Middle East And Africa Orthopedic Surgical Robots Market
시장 규모 (USD 10억)
연평균 성장률 :
% 
 USD
195.73 Billion
USD
887.55 Billion
2025
2033
USD
195.73 Billion
USD
887.55 Billion
2025
2033
| 2026 –2033 | |
| USD 195.73 Billion | |
| USD 887.55 Billion | |
| % | |
|
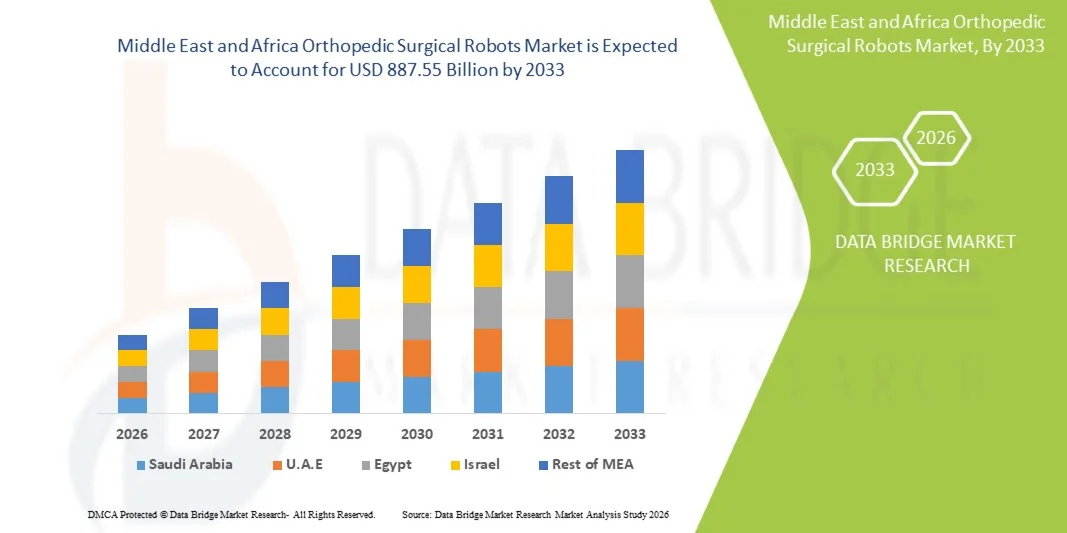
Middle East and Africa Orthopedic Surgical Robots Market, By Product Type (Robotic System, Robotic Accessories, and Software and Services), End User (Hospital and Ambulatory Surgery Centers (ASCS)), Distribution Channel (Direct Tenders and Third Party Distributors) - Industry Trends and Forecast to 2029.
중동 및 아프리카 정형 외과 로봇 시장 크기 및 개요는 무엇입니까
- Data Bridge Market Research Analysis에 따르면 중동 및 아프리카 Orthopedic Surgical Robots Market size가 가치있었습니다.50억 달러 2025견적 요청50억 887.55억, 에 의해20.8%의 CAGR예측 기간
- 시장 성장은 로봇 보조 수술 시스템, 정밀 이미징 및 내비게이션 플랫폼의 지속적인 기술 발전, 병원 및 외과 센터의 디지털화 성장에 의해 크게 연료
- 또한, 최소 침습 절차, 향상된 수술 정확도, 감소 회복 시간 및 통합 운영 룸 솔루션은 정형 외과 로봇을 고급 정형 외과 치료에 현대 표준으로 수립하고 있습니다. 이 융합 요인은 Orthopedic Surgical Robots 솔루션의 uptake를 가속화하고 있으며, 업계의 성장을 크게 향상시킵니다.
시장 크기 & Forecast
- 시장 가치 (2025):50억
- 예상 시장 가치 (2033):887.55억
- 캐스트 CAGR (2026–2033):20.8%
중동 및 아프리카 Orthopedic 외과 로봇 시장 분석
- 관절 교체, 척추 수술, 외상 고정 및 정밀 뼈 정렬 절차에 대한 로봇 보조 시스템을 제공하는 Orthopedic Surgical Robots는 향상된 정확도로 인해 병원 및 전문 외과 센터의 현대 정형 외과 관리의 점점 중요한 구성 요소이며, 침략, 빠른 회복 시간 및 고급 이미징 및 탐색 기술과 통합
- Orthopedic Surgical Robots의 escalating 수요는 주로 증가된 채택에 의해 연료를 공급최소 침습 수술, musculoskeletal 무질서의 발생, 노후화 인구 증가, 정밀 성형 외과 결과에 대한 상승 선호
- 사우디 아라비아는 2025 년에 약 33.6%의 가장 큰 수익 점유율을 가진 중동에서 정형 외과 로봇 시장을 지배하고, 의료 인프라를 개선하여, 고급 의료 기술에 대한 강력한 정부 투자, 그리고 주요 병원과 전문 외과 센터를 통해 로봇식 보조 교정 절차를 증가
- U.A.E.는 예측 기간 동안 Orthopedic Surgical Robots 부문에서 가장 빠르게 성장하는 시장이 될 것으로 예상되며, 약 12.1%의 CAGR를 등록하기 위해 계획되어 있으며, 의료 투자 증가, 공동 교체 서빙 수요, 로봇 기술의 채택, 의료 관광 증가, 기술적으로 진보 된 외과 치료에 강한 초점
- 로봇 시스템 세그먼트는 로봇 플랫폼의 높은 자본 가치에 의해 구동 2025 년에 57.6%의 가장 큰 시장 수익 점유율을 지배하고 정밀 보조 직립 서지의 채택을 증가
보고 범위 및 중동 및 아프리카 Orthopedic 외과 로봇 시장 세그먼트
|
관련 기사 |
Orthopedic 외과 로봇 키 시장 통찰력 |
|
Segments 적용 |
|
|
국가 덮음 |
·
|
|
핵심 시장 선수 |
|
|
시장 기회 |
|
|
Value 추가 데이터 Infosets |
시장 가치, 성장률, 세그먼트, 지리적 범위 및 주요 플레이어와 같은 시장 시나리오에 대한 통찰력 외에도 데이터 브리지 시장 연구에 의해 큐레이터 시장 보고서는 심층적 인 전문가 분석, 환자 분석, 파이프라인 분석, 가격 분석 및 규제 프레임 워크를 포함합니다. |
중동 및 아프리카 정형 외과 로봇 시장에서 중요한 추세는 무엇입니까
"Robotic-Assisted Precision Surgery 및 AI-Enabled Navigation의 채택·
- Orthopedic Surgical Robots 시장의 상당한 성장 추세는 로봇 보조 정밀 수술 시스템의 채택 증가인공 지능,실시간 이미징 및 내비게이션 기술. 이 혁신은 임플란트 배치 정확도, 외과적 견실함 및 환자의 결과를 개선함으로써 정형 외과 절차를 변형시킵니다.
- 예를 들어, Stryker의 Mako 시스템 및 Zimmer Biomet의 ROSA 무릎 시스템과 같은 로봇 플랫폼은 무릎과 엉덩이 교체 절차에 대한 유럽 병원에서 점점 채택됩니다. 이 시스템은 사전 수술 계획 및 수술 지침에 외과 의사를 지원하며 정렬을 최적화하고 인간의 오류를 줄일 수 있습니다.
- 고급 로봇 시스템은 외과 의사가 CT 스캔 또는 3D 이미징을 사용하여 환자 별 anatomy에 기반을 둔 개인 외과 계획을 만들 수 있습니다. 예를 들어, AI 지원 소프트웨어는 뼈 구조를 분석하고 수술 후 더 나은 관절 기능 및 빠른 회복을 선도하는 최적의 임플란트 포지셔닝을 권장합니다.
- 디지털 운영실과 병원 정보 시스템을 갖춘 정형 로봇의 통합은 원활한 워크플로우 관리를 지원합니다. Surgeons는 화상 진찰 자료, 외과 계획 및 통일된 플랫폼을 통해 실시간 분석에 접근할 수 있으며, 번영 효율을 개선하고 운영 시간을 단축할 수 있습니다.
- 최소 침습 및 기술 보조 교정을 향한이 추세는 진정한 정형 외과적 치료에 대한 기대를 재구성합니다.관절 교체유럽 전역의 척추 수술 따라서 Smith+와 같은 회사 Nephew, Medtronic 및 Globus Medical은 로봇 포트폴리오를 확장하고 고급 탐색 시스템을 출시합니다.
- 정형 외과 로봇에 대한 수요는 공공 및 민간 의료 기관에 걸쳐 점점 더 정밀 수술, 더 짧은 병원 체류 및 감소 된 개정 서빙을 통해 장기 비용 절감을 우선 순위
중동 및 아프리카 Orthopedic 외과 로봇 시장 역학
관련 기사
“정밀한 정형외선 및 Minimally Invasive Procedures를 위한 수요 상승 필요”
- 골관절염, osteoporosis, 스포츠 부상 및 퇴행성 합동 질병과 같은 musculoskeletal 무질서의 증가는 중동과 아프리카 Orthopedic 외과 로봇 시장을 위한 중요한 운전사입니다. 독일, 프랑스, 이탈리아, 영국과 같은 국가의 노화 인구는 공동 교체 및 척추 절차에 대한 필요성을 크게 증가
- 예를 들어, 3 월 2025에서 여러 유럽 병원은 로봇 무릎과 엉덩이 교체 프로그램을 확장하여 대기 목록을 상승하고 외과 효율성을 향상시킵니다. 의료 제공자의 이러한 전략적 투자는 예측 기간 동안 시장 성장을 지원할 것으로 예상됩니다.
- 환자는 더 안전하고 빠른 회복 옵션을 추구, 로봇 보조 수술은 더 작은 절개, 감소된 혈액 손실, 낮은 수술 후 통증 및 기존 수술과 비교된 임플란트 정확도 향상
- 또한, 로봇 시스템의 임상 혜택에 대한 외과 의사의 인식은 병원 및 특수 교정 센터의 채택 증가. 교육 프로그램 및 외과 인증 이니셔티브는 더 accelerating 합격
- 외래형 정형 외과 절차와 같은 일 방전 수술을 위한 일어나는 수요는 또한 로봇식 체계 임명을 몰고 있습니다, 이 기술은 절차와 단축 회복 시간을 표준화하는 것을 돕습니다. 유럽 전역의 의료 지출 지원 시장 확장
스트레인트/Challenge
"Smaller Healthcare 시설의 높은 자본 투자 및 제한적 접근성·
- 정형 외과 로봇의 높은 취득 그리고 정비 비용은 더 넓은 시장 침투를 위한 뜻깊은 도전 남아 있습니다. 로봇 시스템은 종종 실질적인 상승 투자, 소프트웨어 라이센싱 수수료, 일회용 장비 및 직원 교육, 더 작은 병원 및 지역 클리닉에 대 한 채택 어려운 만들기
- 예를 들어, 동부 및 남부 유럽의 많은 중형 의료 센터는 예산 제약 및 로봇 보조 절차에 대한 제한적 재투자 지원으로 인해 기존 정형 기술에 의존합니다.
- 비용 장벽 외에도 병원은 설치 및 외과 학습 곡선 중 워크플로우 붕괴를 직면 할 수 있습니다. 기존 운영 룸 인프라와의 교육 요구 사항 및 통합은 구현을 지연시킬 수 있습니다.
- 일부 유럽 국가에서 로봇 절차에 대한 Reimbursement uncertainty는 의료 시스템이 매우 비용 규제되는 곳에 특히 차별적인 투자를 할 수 있습니다. 공급자는 robotic 서약이 적절하게 보상되지 않는 경우에 주저할지도 모릅니다
- 시스템 가동 중단, 소프트웨어 업데이트 및 전문 기술 지원에 대한 의존도는 특정 지역에서 더 느린 채택 할 수 있습니다.
- 더 낮은 비용 로봇 플랫폼을 통해 이러한 도전을 극복, 향상 된 재투자 프레임 워크, 증가 모델, 더 넓은 외과 훈련 프로그램은 유럽에서 지속적인 시장 성장을 위해 생명 될 것입니다
중동 및 아프리카 Orthopedic 외과 로봇 시장 범위
시장은 제품 유형, 최종 사용자 및 유통 채널을 기준으로 구분됩니다.
• 제품 유형에 의하여
제품 유형의 기초에, Orthopedic 외과 로봇 시장은 로봇 시스템, 로봇 부속품 및 소프트웨어 및 서비스로 구분됩니다. 로봇 시스템 세그먼트는 로봇 플랫폼의 높은 자본 가치에 의해 구동 2025 년에 57.6%의 가장 큰 시장 수익 점유율을 지배하고 정밀 보조 직립 서지의 채택을 증가. 병원은 무릎, 엉덩이, 척추 절차에 대한 로봇 시스템에 투자하여 수술 정확도와 환자의 결과를 개선합니다. 이 시스템은 개정 서지와 짧은 병원 체류를 줄일 수 있습니다. 최소 침습형 정형식 개입에 대한 수요 증가는 채택을 지원합니다. 고급 네비게이션, 이미징 및 AI-assisted Planning tools 추가가 필요합니다. Surgeons는 점점 재현 가능한 임플란트 배치를 위한 로봇 시스템을 선호합니다. 특수형 정형외과 센터의 확장은 세그먼트 성장에 기여합니다. 기존 시스템을 로봇 플랫폼으로 교체하기 위해 시장을 개발했습니다. 병원과 제조업체 간의 전략적 파트너십은 설치를 지원합니다. 노후화 인구 및 관절 교체 볼륨은 더 지배력을 유지합니다. 차세대 로봇 플랫폼의 지속적인 혁신은 전 세계 시장 진출을 가속화합니다.
소프트웨어 및 서비스 부문은 분석, 유지 보수, 교육, 워크플로우 최적화 및 클라우드 기반 계획 솔루션에 필요한 상승하는 데 필요한 2026에서 2033 %의 가장 빠른 CAGR을 목격하기 위해 계획됩니다. Robotic 플랫폼은 점점 향상된 기능을 위해 소프트웨어 업그레이드에 의존합니다. 병원은 예측 유지 보수 및 원격 기술 지원을 요구하고 있습니다. AI-powered 수술 계획 단위는 견인을 급속하게 얻고 있습니다. 로봇의 설치 기반을 성장시켜 서비스 수익 기회를 창출합니다. 구독 기반 소프트웨어 모델은 의료 제공자에 대한 감당성을 향상시킵니다. 교육 서비스는 외과적 채택 상승으로 점점 요구됩니다. 공급 업체는 디지털 생태계에 초점을 맞추고 이미징과 로봇을 통합합니다. data-driven post-operative analytics의 확장은 수요를 지원합니다. Emerging 시장은 소프트웨어 최초 로봇 솔루션을 채택하고 있습니다. 탐색 소프트웨어의 지속적인 혁신은 이 세그먼트의 성장을 가속화합니다.
• 최종 사용자
최종 사용자의 기초에, Orthopedic 외과 로봇 시장은 병원과 구급 수술 센터 (ASCs)로 분류됩니다. 병원 부문은 2025년에 71.3%의 가장 큰 시장 수익 점유율을 차지했으며, 더 높은 구매 용량, 대형 수술량 및 고급 인프라의 가용성에 의해 구동됩니다. 병원은 총 관절 교체 및 척추 수술을 포함한 복잡한 정형 외과 절차의 대부분을 수행합니다. 자본 예산에 액세스하기 때문에 로봇 시스템의 초기 채택자입니다. 숙련 된 외과 의사와 다임러 팀이 활용을 지원합니다. 병원은 통합된 이미징 및 내비게이션 시스템에서도 혜택을 누릴 수 있습니다. 기술적으로 진보된 외과 배려를 위한 환자 선호도는 수요를 모읍니다. 교육 및 연구에 대한 로봇을 사용하여 점점 더 있습니다. 대형 의료 네트워크는 로봇 수술 프로그램을 확장합니다. 개발된 시장에 있는 호기성 reimbursement는 병원 지도력을 강화합니다. 외상 및 퇴행성 뼈 질환 사례 지원 계속 성장. 스마트 운영실에 대한 투자가 더욱 강화되는 세그먼트 도민.
구급차 수술 센터 (ASCs) 세그먼트는 2026에서 2033까지 16.9%의 가장 빠른 CAGR을 목격 할 것으로 예상되며, 외형 교정 절차로 이동하여 연료를 공급합니다. ASCs 제안 더 낮은 처리 비용 및 더 짧은 환자 체재. 로봇 시스템의 기술 최소화는 컴팩트한 시설에서 쉽게 배포할 수 있습니다. 동일한 일 무릎과 엉덩이 수술을 위한 상승 수요는 채택합니다. 환자는 점점 편리한 외래 설정을 선호합니다. Surgeons는 효율적인 스케줄링과 낮은 오버헤드 비용을 위한 ASC와 파트너 관계를 맺고 있습니다. 개량된 무감각 및 회복 의정서는 ASCs에 있는 절차 더 가능하게 합니다. 공급 업체는 이러한 센터에 맞게 비용 효율적인 로봇 솔루션 출시. 민간 의료 인프라의 확장은 더 성장을 밀어줍니다. 외래 치료에 대한 보험 지원 증가는 전 세계적으로 채택을 가속화합니다.
• 배급 채널에 의하여
배급 수로의 기초에, Orthopedic 외과 로봇 시장은 직접적인 입찰 및 제3자 분배자로 분류됩니다. 직접 입찰 세그먼트는 로봇 시스템 조달의 복잡하고 높은 가치 성격에 의해 구동 2025 년에 64.8%의 가장 큰 시장 수익 점유율을 기록했습니다. 병원은 임명, 주문화 및 장기 서비스 계약을 위한 제조자에서 직접 구매를 선호합니다. 직접적인 수로는 더 나은 훈련 및 기술지원을 지킵니다. 제조업체는 액세서리 및 유지 보수 계약을 포함한 번들 패키지를 제공 할 수 있습니다. 큰 병원 그룹 협상 멀티 유닛 입찰 직접 공급 업체. 정부 기관은 또한 취득을 위한 공식적인 입찰 과정에 의존합니다. 직접 조달은 투명성과 수명주기 관리를 향상시킵니다. 강한 manufacturer-customer 관계 지원 반복 사업. 주문을 받아서 만들어진 financing 모형은 이 세그먼트를 더 강화합니다. 연속 업그레이드 및 서비스 갱신은 수익 리더십에 기여합니다.
제3자 유통 부문은 2026년부터 2033년까지 14.7%의 가장 빠른 CAGR를 목격하여 신흥 및 중형 시장에서 침투를 확장함으로써 구동됩니다. Distributors 도움 제조자는 지역 병원 및 더 작은 외과 센터를 능률적으로 도달합니다. 그들은 현지 판매 지원 및 시장 지식을 제공합니다. 아시아 태평양과 라틴 아메리카의 성장 수요는 채널 확장을 지원합니다. 더 작은 시설은 더 빠른 액세스 및 유연한 가격으로 유통 주도 조달을 선호합니다. Distributor는 또한 임명 조정 및 소모품 공급과 원조합니다. OEM 및 지역 딜러 간의 파트너십 강화 aftermarket 서비스 네트워크의 확장은 채택을 지원합니다. untapped 시장에서 로봇 정형 외과의 인식은 성장을 가속화합니다.
중동 및 아프리카 Orthopedic 외과 로봇 시장 지역 분석
- 중동 정형 외과 로봇 시장은 예측 기간 동안 실질적인 CAGR에 확장하기 위해 계획되어, 주로 최소 침략적인 정형 외과 절차에 대한 수요 상승에 의해 구동되고, musculoskeletal 무질서의 전세를 증가시키고, 병원과 전문 외과 센터의 로봇 보조 기술의 채택
- 의료 인프라 개선, 의료 지출 증가, 고급 외과 시스템의 투자 증가, 외과 정밀, 환자 결과, 및 회복 시간 강화에 초점을 맞추고
- 또한, 무릎의 상승 볼륨, 엉덩이, 그리고 척추 절차는 중동 전역의 지속적인 시장 확장 지원
사우디 아라비아 Orthopedic 외과 로봇 시장 통찰력
사우디 아라비아 정형 외과 로봇 시장은 중동에서 정형 외과 로봇 시장을 지배하고 약의 가장 큰 수익 점유율을 가진33.6% 에서 2025, 의료 인프라 개선에 의해 특징, 의료 지출 상승, 고급 의료 기술에 강한 정부 투자, 주요 병원 및 전문 외과 센터에 걸쳐 로봇 보조 교정 절차를 증가. 차세대 운영실에 대한 투자와 함께 정밀 기반 관절 교체 서지에 대한 수요 증가, 시장 성장을 지원하기 위해 계속. 또한, 수술과 환자의 인식을 증가시켜 로봇 보조 절차의 이점에 대한 인식은 전국의 채택을 가속화합니다.
U.A.E. Orthopedic 외과 로봇 시장 통찰력
U.A.E. Orthopedic Surgical Robots 시장은 예측 기간 동안 Orthopedic Surgical Robots 부문에서 가장 빠르게 성장하는 시장이 될 것으로 예상되며, 대략 CAGR를 등록 할 것으로 예상됩니다.12.1%, 의료 투자 증가, 공동 교체 서빙에 대 한 상승 수요, 로봇 기술의 채택, 의료 관광 성장, 기술적으로 고급 수술에 강한 초점. 이 나라의 확장 병원 네트워크, 혁신에 중점을두고 프리미엄 의료 서비스에 대한 수요가 증가하는 것은 로봇 정형 외과 시스템을위한 더 많은 주행 수요입니다. 또한, 외과 교육 프로그램을 증가 하 고 스마트 운영 극장에 있는 지속적인 투자는 미래 시장 성장을 강화할 것으로 예상 된다.
중동 및 아프리카 정형 외과 로봇 시장에 있는 정상 회사는 무엇입니까
Orthopedic Surgical Robots 산업은 주로 잘 설립 된 회사에 의해 주도됩니다.
- Stryker Corporation (미국)
- Zimmer Biomet Holdings, Inc. (미국)
- Smith+Nephew plc (미국)
- Johnson & Johnson MedTech (미국)
- Medtronic plc (아일랜드)
- Globus 의료, Inc. (미국)
- 직관적 인 외과, Inc. (미국)
- THINK 외과, Inc. (미국)
- 코린 그룹 (미국)
- CUREXO, Inc. (한국)
- Renishaw plc (미국)
- Brainlab AG (독일)
- Exactech, Inc. (미국)
- MicroPort Scientific Corporation (중국)
- OrthAlign, Inc. (미국)
- Omnicare 의료 기술 유한 회사 (중국)
- Asensus Surgical, Inc. (미국)
- ZBEdge / Zimmer Biomet 로봇 (미국)
- eCential 로봇 (프랑스)
- 메릴 생명 과학 Pvt. Ltd. (인도)
중동 및 아프리카 Orthopedic Surgical Robots 시장의 최신 개발
- 2021 년 6 월, Zimmer Biomet Holdings, Inc.는 ROSA Hip의 미국 상업 발사를 발표했습니다. 무릎 관절 경련을 총 엉덩이 교체 절차로 넘어 ROSA Robotics 플랫폼을 확장했습니다. 발사는 로봇 보조 합동 재건에 있는 Zimmer Biomet의 위치를 강화하고 로봇식 Orthopedic 체계의 외과 채택을 확장했습니다
- 9 월 2022에서 Point Robotics MedTech Inc.는 정형 외과 로봇을위한 미국 FDA 정리를 받아 최초의 신흥 로봇 회사 중 하나가 정형 외과 부문에서 승인을 확보했습니다. 이 이정표는 로봇 보조 직형 외과 수술에서 인큐베이트 선수를 넘어 경쟁과 혁신을 강조했다.
- Johnson & Johnson MedTech는 11월 2022일, Johnson & Johnson MedTech는 무릎 교체 수술을 위한 VELYS Robotic-Assisted Solution의 상용 롤아웃을 확장하여 외과적 정밀도, 워크플로우 효율 및 총 무릎 관절의 수술적 데이터 중심 정렬을 지원합니다. J&J는 빠르게 성장하는 정형외선 로봇 시장에서의 존재를 강화
- 에 5월 2023, 스미스 + Nephew는 CORI 외과 시스템의 지속적인 글로벌 확장을보고, 무릎 관절 통증을위한 핸드 헬드 로봇 보조 플랫폼. 이 회사는 탄화수소 수술 센터 및 병원에서 휴대용, 이미지없는 로봇 솔루션을 찾는 상승 채택을 강조했습니다.
- 8 월 2023에서 Stryker Corporation은 Mako SmartRobotics 플랫폼의 직접적 인 마케팅 캠페인을 시작했습니다. 로봇 보조 엉덩이 및 무릎 교체 절차의 인식을 증가시키는 것을 목표로합니다. 이 캠페인은 정형외선 로봇 채택을 운전하는 소비자 교육의 성장 역할을 수행
- 모노그램 Orthopaedics Inc.는 11월 2023일, 모노그램 Orthopaedics Inc.의 첫 번째 납품을 발표했습니다. 이정표는 Monogram의 상업적인 입장을 합동 보충 절차에 집중된 차세대 반 자율적인 플랫폼과 정형외선 로봇으로 표시했습니다
- 2월 2024일, THINK Surgical, Inc.는 TMINI Miniature Robotic System과 Maxx Orthopedics와 전략적 협업을 발표했습니다. 파트너십은 무릎 관절에 더 넓은 임플란트 호환성을 허용하여 개방형 로봇을 개발했습니다.
- 5월 2024일, Stryker, Zimmer Biomet, Globus Medical을 포함한 주요 직형 외과 회사는 로봇 시스템 판매 및 배치의 이중 변형 성장을보고, 로봇 보조 정형 외과 절차에 대한 accelerating 병원 수요를 반영하고 구급 수술 센터에서 설치를 증가
SKU-
세계 최초의 시장 정보 클라우드 보고서에 온라인으로 접속하세요

- 대화형 데이터 분석 대시보드
- 높은 성장 잠재력 기회를 위한 회사 분석 대시보드
- 사용자 정의 및 질의를 위한 리서치 분석가 액세스
- 대화형 대시보드를 통한 경쟁자 분석
- 최신 뉴스, 업데이트 및 추세 분석
- 포괄적인 경쟁자 추적을 위한 벤치마크 분석의 힘 활용
목차
1 서론
1.1 연구 목적
1.2 시장 정의
1.3 중동 및 아프리카 정형외과 수술 로봇 시장 개요
1.4 통화 및 가격
1.5 제한 사항
1.6 대상 시장
2 시장 세분화
2.1 대상 시장
2.2 지리적 범위
연구에 2.3년이 고려됨
2.4 통화 및 가격
2.5 DBMR TRIPOD 데이터 검증 모델
2.6 다변량 모델링
2.7 제품 수명 곡선
2.8 주요 여론 선도자와의 1차 인터뷰
2.9 DBMR 시장 위치 그리드
2.1 시장 적용 범위 그리드
2.11 공급업체 점유율 분석
2.12 2차 소스
2.13 가정
3 요약
4가지 프리미엄 인사이트
4.1 페스텔
4.2 포터의 5가지 힘
4.3 중동 및 아프리카의 정형외과 수술 로봇에 대한 임상 시험
4.4 전략적 이니셔티브
4.4.1 인구 통계적 추세
4.4.2 주요 특허 등록 전략
4.5 중동 및 아프리카 정형외과 수술 로봇 시장, 규제 프레임워크
5 시장 개요
5.1 드라이버
5.1.1 골다공증 유병률 증가
5.1.2 로봇 시스템의 기술적 진보 증가
5.1.3 정형외과 수술 건수 증가
5.1.4 스포츠 및 외상 부상 발생률 증가
5.2 제약
5.2.1 정형외과 수술에 대한 인식 부족
5.2.2 정형외과 수술에서 관찰되는 위험
5.2.3 정형외과 수술과 관련된 높은 비용
5.3 기회
5.3.1 노인 인구의 증가
5.3.2 증가하는 의료비 지출
5.3.3 파손 발생률 증가
5.4 과제
5.4.1 숙련된 전문가의 부족
5.4.2 엄격한 규제 프레임워크
6 중동 및 아프리카 정형외과 수술 로봇 시장, 제품 유형별
6.1 개요
6.2 로봇 시스템
6.2.1 무릎
6.2.1.1 수술 유형
6.2.1.1.1 총 무릎 관절 성형술
6.2.1.1.2 단일 구획 무릎 관절 성형술
6.2.1.1.3 전방십자인대 재건술
6.2.1.1.4 기타
6.2.1.1.5 로봇 유형
6.2.1.1.6 마코
6.2.1.1.7 코리
6.2.1.1.8 네비게이션
6.2.1.1.9 티로봇
6.2.1.1.10 T솔루션 1
6.2.1.1.11 기타
6.2.2 고관절
6.2.2.1 수술 유형
6.2.2.1.1 전체 고관절 인공관절수술
6.2.2.1.2 기타
6.2.2.1.3 로봇 유형
6.2.2.1.4 마코
6.2.2.1.5 T솔루션 1
6.2.2.1.6 기타
6.2.3 척추
6.2.3.1 수술 유형
6.2.3.1.1 척추 나사 이식
6.2.3.1.2 척추 증강술
6.2.3.1.3 복강경 전방 요추 척추간 융합술
6.2.3.1.4 척추 종양 절제 수술
6.2.3.1.5 수술 중 현지화
6.2.3.1.6 전방 요추 추간 융합술
6.2.3.1.7 기타
6.2.3.1.8 로봇 유형
6.2.3.1.9 마조르
6.2.3.1.9.1 르네상스
6.2.3.1.9.2 마조르 엑스
6.2.3.1.9.3 척추 보조
6.2.3.1.10 로사
6.2.3.1.11 CIRQ
6.2.3.1.12 엑셀시우스 GPS
6.2.3.1.13 기타
6.2.4 대퇴골
6.2.4.1 수술 유형
6.2.4.1.1 대퇴경부 캐뉼라 나사 배치
6.2.4.1.2 골수내 손톱 고정
6.2.4.1.3 대퇴골두의 핵심 감압
6.2.4.1.4 기타
6.2.4.1.5 로봇 유형
6.2.4.1.6 티로봇
6.2.4.1.7 기타
6.2.5 골반
6.2.5.1 수술 유형
6.2.5.1.1 대퇴경부 캐뉼라 나사 배치
6.2.5.1.2 골수내 손톱 고정
6.2.5.1.3 대퇴골두의 핵심 감압
6.2.5.1.4 기타
6.2.5.1.5 로봇 유형
6.2.5.1.6 티로봇
6.2.5.1.7 기타
6.2.6 손
6.2.6.1 수술 유형
6.2.6.1.1 대퇴경부 캐뉼라 나사 배치
6.2.6.1.2 골수내 손톱 고정
6.2.6.1.3 대퇴골두의 핵심 감압
6.2.6.1.4 기타
6.2.6.1.5 로봇 유형
6.2.6.1.6 티로봇
6.2.6.1.7 기타
6.2.7 팔꿈치
6.2.7.1 수술 유형
6.2.7.1.1 대퇴경부 캐뉼라 나사 배치
6.2.7.1.2 골수내 손톱 고정
6.2.7.1.3 대퇴골두의 핵심 감압
6.2.7.1.4 기타
6.2.7.1.5 로봇 유형
6.2.7.1.6 티로봇
6.2.7.1.7 기타
6.2.8 기타
6.3 로봇 액세서리
6.4 소프트웨어 및 서비스
7 중동 및 아프리카 정형외과 수술 로봇 시장, 최종 사용자별
7.1 개요
7.2 병원
7.2.1 ACTUE CARE 병원
7.2.2 장기요양병원
7.2.3 간호 시설
7.2.4 재활 센터
7.3 외래 수술 센터
8 중동 및 아프리카 정형외과 수술 로봇 시장, 유통 채널별
8.1 개요
8.2 직접 입찰
8.3 제3자 유통업체
9 중동 및 아프리카 정형외과 수술 로봇 시장, 지역별
9.1 중동 및 아프리카
9.1.1 남아프리카 공화국
9.1.2 사우디 아라비아
9.1.3 아랍에미리트
9.1.4 이집트
9.1.5 이스라엘
9.1.6 중동 및 아프리카의 나머지 지역
10 중동 및 아프리카 정형외과 수술 로봇 시장: 회사 환경
10.1 회사 점유율 분석: 중동 및 아프리카
11 SWOT 분석
12 회사 프로필
12.1 스트라이커
12.1.1 회사 스냅샷
12.1.2 수익 분석
12.1.3 회사 점유율 분석
12.1.4 제품 포트폴리오
12.1.5 최근 개발 사항
12.2 스미스 앤 네퓨
12.2.1 회사 스냅샷
12.2.2 수익 분석
12.2.3 회사 점유율 분석
12.2.4 제품 포트폴리오
12.2.5 최근 개발 사항
12.3 존슨앤존슨서비스 주식회사
12.3.1 회사 스냅샷
12.3.2 수익 분석
12.3.3 회사 점유율 분석
12.3.4 제품 포트폴리오
12.3.5 최근 개발 사항
12.4 메드트로닉
12.4.1 회사 스냅샷
12.4.2 수익 분석
12.4.3 회사 점유율 분석
12.4.4 제품 포트폴리오
12.4.5 최근 개발
12.5 짐머 바이오멧
12.5.1 회사 스냅샷
12.5.2 수익 분석
12.5.3 회사 점유율 분석
12.5.4 제품 포트폴리오
12.5.5 최근 개발 사항
12.6 ACCURAY 주식회사
12.6.1 회사 스냅샷
12.6.2 수익 분석
12.6.3 제품 포트폴리오
12.6.4 최근 개발
12.7 베이징 티나비 의료기술 유한회사
12.7.1 회사 스냅샷
12.7.2 제품 포트폴리오
12.7.3 최근 개발
12.8 브레인랩 AG
12.8.1 회사 스냅샷
12.8.2 제품 포트폴리오
12.8.3 최근 개발 사항
12.9 코린 그룹
12.9.1 회사 스냅샷
12.9.2 제품 포트폴리오
12.9.3 최근 개발
12.1 (주)큐렉소
12.10.1 회사 스냅샷
12.10.2 제품 포트폴리오
12.10.3 최근 개발 사항
12.11 글로버스 메디컬 주식회사
12.11.1 회사 스냅샷
12.11.2 수익 분석
12.11.3 제품 포트폴리오
12.11.4 최근 개발 사항
12.12 INTEGRITY IMPLANTS INC. D/B/A/ ACCELUS
12.12.1 회사 스냅샷
12.12.2 제품 포트폴리오
12.12.3 최근 개발
12.13 누바시브 주식회사
12.13.1 회사 스냅샷
12.13.2 수익 분석
12.13.3 제품 포트폴리오
12.13.4 최근 개발
12.14 씽크서지컬 주식회사
12.14.1 회사 스냅샷
12.14.2 제품 포트폴리오
12.14.3 최근 개발 사항
13 설문지
14 관련 보고서
표 목록
표 1 중동 및 아프리카 정형외과 수술 로봇 시장, 제품 유형별, 2021-2029년(백만 달러)
표 2 중동 및 아프리카 정형외과 수술 로봇 시장의 로봇 시스템, 지역별, 2021-2029년(백만 달러)
표 3 중동 및 아프리카 정형외과 수술 로봇 시장의 로봇 시스템, 유형별, 2020-2029년(백만 달러)
표 4 중동 및 아프리카 무릎 수술 로봇 시장, 수술 유형별, 2020-2029년(백만 달러)
표 5 중동 및 아프리카 무릎 수술 로봇 시장, 로봇 유형별, 2020-2029년(백만 달러)
표 6 중동 및 아프리카 정형외과 수술용 로봇 시장, 로봇 유형별, 양, 2020-2029년(단위)
표 7 중동 및 아프리카 고관절 수술 로봇 시장, 수술 유형별, 2020-2029년(백만 달러)
표 8 중동 및 아프리카 고관절 정형외과 수술 로봇 시장, 로봇 유형별, 2020-2029년(백만 달러)
표 9 중동 및 아프리카 정형외과 수술 로봇 시장, 로봇 유형별, 양, 2020-2029(단위)
표 10 중동 및 아프리카 척추 정형외과 수술 로봇 시장, 수술 유형별, 2020-2029년(백만 달러)
표 11 중동 및 아프리카 척추 정형외과 수술 로봇 시장, 로봇 유형별, 2020-2029년(백만 달러)
표 12 중동 및 아프리카 정형외과 수술 로봇 시장, 로봇 유형별, 볼륨, 2020-2029 볼륨, (단위)
표 13 중동 및 아프리카 정형외과 수술 로봇 시장 주요 규모, 수술 유형별, 2020-2029년(백만 달러)
표 14 중동 및 아프리카 정형외과 수술 로봇 시장 주요 규모, 로봇 유형별, 양, 2020-2029(단위)
표 15 중동 및 아프리카 대퇴골 정형외과 수술 로봇 시장, 수술 유형별, 2020-2029년(백만 달러)
표 16 중동 및 아프리카 대퇴골 정형외과 수술 로봇 시장, 로봇 유형별, 2020-2029년(백만 달러)
표 17 중동 및 아프리카 대퇴부 정형외과 수술 로봇 시장, 로봇 유형별, 볼륨, 2020-2029(단위)
표 18 중동 및 아프리카 골반 수술 로봇 시장, 수술 유형별, 2020-2029년(백만 달러)
표 19 중동 및 아프리카 골반 수술 로봇 시장, 로봇 유형별, 2020-2029년(백만 달러)
표 20 중동 및 아프리카 골반 정형외과 수술 로봇 시장, 로봇 유형별, 볼륨, 2020-2029(단위)
표 21 중동 및 아프리카, 수술 유형별 정형외과 수술 로봇 시장 점유율, 2020-2029년(백만 달러)
표 22 중동 및 아프리카, 로봇 유형별 정형외과 수술 로봇 시장 점유율, 2020-2029년(백만 달러)
표 23 중동 및 아프리카, 로봇 유형별 정형외과 수술 로봇 시장 점유율, 2020-2029년(대)
표 24 중동 및 아프리카 정형외과 수술 로봇 시장, 수술 유형별, 2020-2029년(백만 달러)
표 25 중동 및 아프리카 정형외과 수술 로봇 시장의 엘보, 로봇 유형별, 2020-2029년(백만 달러)
표 26 중동 및 아프리카 정형외과 수술 로봇 시장의 엘보, 로봇 유형별, 볼륨, 2020-2029(단위)
표 27 중동 및 아프리카 정형외과 수술 로봇 시장의 로봇 액세서리, 지역별, 2021-2029년(백만 달러)
표 28 중동 및 아프리카 정형외과 수술 로봇 시장의 소프트웨어 및 장치, 지역별, 2021-2029년(백만 달러)
표 29 중동 및 아프리카 정형외과 수술 로봇 시장, 최종 사용자별, 2020-2029년(백만 달러)
표 30 중동 및 아프리카 병원의 정형외과 수술 로봇 시장, 지역별, 2020-2029년(백만 달러)
표 31 중동 및 아프리카 병원의 정형외과 수술 로봇 시장, 최종 사용자별, 2020-2029년(백만 달러)
표 32 중동 및 아프리카 외래 수술 센터, 정형외과 수술 로봇 시장, 지역별, 2020-2029년(백만 달러)
표 33 중동 및 아프리카 정형외과 수술 로봇 시장, 유통 채널별, 2020-2029년(백만 달러)
표 34 중동 및 아프리카 정형외과 수술 로봇 시장 직접 입찰, 지역별, 2020-2029 (백만 달러)
표 35 중동 및 아프리카 정형외과 수술 로봇 시장의 제3자 유통업체, 지역별, 2020-2029년(백만 달러)
표 36 중동 및 아프리카 정형외과 수술 로봇 시장, 국가별, 2020-2029년(백만 달러)
표 37 중동 및 아프리카 정형외과 수술 로봇 시장, 제품 유형별, 2020-2029년(백만 달러)
표 38 중동 및 아프리카 정형외과 수술 로봇 시장의 로봇 시스템, 응용 분야별, 2020-2029년(백만 달러)
표 39 중동 및 아프리카 무릎 수술 로봇 시장, 수술 유형별, 2020-2029(백만 달러)
표 40 중동 및 아프리카 무릎 정형외과 수술 로봇 시장, 로봇 유형별, 2020-2029년(백만 달러)
표 41 중동 및 아프리카 정형외과 수술용 로봇 시장, 로봇 유형별, 볼륨, 2020-2029(단위)
표 42 중동 및 아프리카 고관절 수술 로봇 시장, 수술 유형별, 2020-2029년(백만 달러)
표 43 중동 및 아프리카 정형외과 수술 로봇 시장, 로봇 유형별, 2020-2029년(백만 달러)
표 44 중동 및 아프리카 정형외과 수술용 로봇 시장, 로봇 유형별, 볼륨, 2020-2029(단위)
표 45 중동 및 아프리카 척추 정형외과 수술 로봇 시장, 수술 유형별, 2020-2029년(백만 달러)
표 46 중동 및 아프리카 척추 정형외과 수술 로봇 시장, 로봇 유형별, 2020-2029년(백만 달러)
표 47 중동 및 아프리카 척추 정형외과 수술 로봇 시장, 로봇 유형별, 볼륨, 2020-2029(단위)
표 48 중동 및 아프리카 정형외과 수술 로봇 시장 주요 규모, 로봇 유형별, 2020-2029년(백만 달러)
표 49 중동 및 아프리카 정형외과 수술 로봇 시장 주요 규모, 로봇 유형별, 양, 2020-2029(단위)
표 50 중동 및 아프리카 대퇴골 정형외과 수술 로봇 시장, 수술 유형별, 2020-2029년(백만 달러)
표 51 중동 및 아프리카 대퇴골 정형외과 수술 로봇 시장, 로봇 유형별, 2020-2029년(백만 달러)
표 52 중동 및 아프리카 대퇴부 정형외과 수술 로봇 시장, 로봇 유형별, 볼륨, 2020-2029(단위)
표 53 중동 및 아프리카 골반 수술 로봇 시장, 수술 유형별, 2020-2029년(백만 달러)
표 54 중동 및 아프리카 골반 수술 로봇 시장, 로봇 유형별, 2020-2029년(백만 달러)
표 55 중동 및 아프리카 골반 정형외과 수술 로봇 시장, 로봇 유형별, 볼륨, 2020-2029(단위)
표 56 중동 및 아프리카, 수술 유형별 정형외과 수술 로봇 시장 점유율, 2020-2029년(백만 달러)
표 57 중동 및 아프리카, 로봇 유형별 정형외과 수술 로봇 시장 점유율, 2020-2029년(백만 달러)
표 58 중동 및 아프리카, 로봇 유형별 정형외과 수술 로봇 시장 점유율, 규모, 2020-2029년(단위)
표 59 중동 및 아프리카 정형외과 수술 로봇 시장, 수술 유형별, 2020-2029년(백만 달러)
표 60 중동 및 아프리카 정형외과 수술 로봇 시장, 로봇 유형별, 2020-2029년(백만 달러)
표 61 중동 및 아프리카 정형외과 수술 로봇 시장, 로봇 유형별, 볼륨, 2020-2029(단위)
표 62 중동 및 아프리카 정형외과 수술 로봇 시장, 최종 사용자별, 2020-2029년(백만 달러)
표 63 중동 및 아프리카 병원의 정형외과 수술 로봇 시장, 최종 사용자별, 2020-2029년(백만 달러)
표 64 중동 및 아프리카 정형외과 수술 로봇 시장, 유통 채널별, 2020-2029년(백만 달러)
표 65 남아프리카 정형외과 수술 로봇 시장, 제품 유형별, 2020-2029년(백만 달러)
표 66 남아프리카 정형외과 수술 로봇 시장의 로봇 시스템, 응용 분야별, 2020-2029년(백만 달러)
표 67 수술 유형별 남아프리카 공화국 무릎 수술 로봇 시장, 2020-2029년(백만 달러)
표 68 남아프리카 공화국 무릎 정형외과 수술 로봇 시장, 로봇 유형별, 2020-2029년(백만 달러)
표 69 남아프리카 공화국 정형외과 수술용 로봇 시장, 로봇 유형별, 볼륨, 2020-2029(단위)
표 70 수술 유형별 남아프리카 고관절 수술 로봇 시장, 2020-2029년(백만 달러)
표 71 정형외과 수술 로봇 시장 내 남아프리카 엉덩이, 로봇 유형별, 2020-2029년(백만 달러)
표 72 정형외과 수술용 로봇 시장, 로봇 유형별, 볼륨, 2020-2029(단위)
표 73 수술 유형별 남아프리카 척추 정형외과 수술 로봇 시장, 2020-2029년(백만 달러)
표 74 남아프리카 정형외과 수술 로봇 시장, 로봇 유형별, 2020-2029년(백만 달러)
표 75 남아프리카 정형외과 수술 로봇 시장, 로봇 유형별, 볼륨, 2020-2029(단위)
표 76 남아프리카 정형외과 수술 로봇 시장 주요 규모, 로봇 유형별, 2020-2029년(백만 달러)
표 77 남아프리카 정형외과 수술 로봇 시장 주요 규모, 로봇 유형별, 규모, 2020-2029(단위)
표 78 수술 유형별 남아프리카 대퇴골 정형외과 수술 로봇 시장, 2020-2029년(백만 달러)
표 79 정형외과 수술 로봇 시장의 남아프리카 대퇴골, 로봇 유형별, 2020-2029년(백만 달러)
표 80 남아프리카 대퇴골 정형외과 수술 로봇 시장, 로봇 유형별, 볼륨, 2020-2029(단위)
표 81 수술 유형별 남아프리카 골반 수술 로봇 시장, 2020-2029년(백만 달러)
표 82 정형외과 수술 로봇 시장의 남아프리카 골반, 로봇 유형별, 2020-2029년(백만 달러)
표 83 정형외과 수술 로봇 시장의 남아프리카 골반, 로봇 유형별, 볼륨, 2020-2029(단위)
표 84 수술 유형별 정형외과 수술 로봇 시장에서 남아프리카의 영향력, 2020-2029년(백만 달러)
표 85 로봇 유형별 정형외과 수술 로봇 시장에서 남아프리카의 영향력, 2020-2029년(백만 달러)
표 86 정형외과 수술 로봇 시장에서 남아프리카 공화국의 점유율, 로봇 유형별, 양, 2020-2029년(단위)
표 87 수술 유형별 남아프리카 엘보 수술 로봇 시장, 2020-2029년(백만 달러)
표 88 남아프리카 정형외과 수술 로봇 시장의 엘보, 로봇 유형별, 2020-2029년(백만 달러)
표 89 정형외과 수술용 로봇 시장에서의 남아프리카 엘보, 로봇 유형별, 볼륨, 2020-2029(단위)
표 90 남아프리카 정형외과 수술 로봇 시장, 최종 사용자별, 2020-2029년(백만 달러)
표 91 정형외과 수술 로봇 시장의 남아프리카 병원, 최종 사용자별, 2020-2029년(백만 달러)
표 92 남아프리카 정형외과 수술 로봇 시장, 유통 채널별, 2020-2029년(백만 달러)
표 93 사우디 아라비아 정형외과 수술 로봇 시장, 제품 유형별, 2020-2029년(백만 달러)
표 94 사우디 아라비아 정형외과 수술 로봇 시장의 로봇 시스템, 응용 분야별, 2020-2029년(백만 달러)
표 95 사우디 아라비아 무릎 수술 로봇 시장, 수술 유형별, 2020-2029(백만 달러)
표 96 사우디 아라비아 정형외과 수술용 로봇 시장, 로봇 유형별, 2020-2029년(백만 달러)
표 97 사우디 아라비아 정형외과 수술용 로봇 시장, 로봇 유형별, 볼륨, 2020-2029(단위)
표 98 사우디 아라비아 고관절 수술 로봇 시장, 수술 유형별, 2020-2029년(백만 달러)
표 99 사우디 아라비아 정형외과 수술 로봇 시장, 로봇 유형별, 2020-2029년(백만 달러)
표 100 사우디 아라비아 정형외과 수술 로봇 시장, 로봇 유형별, 볼륨, 2020-2029(단위)
표 101 사우디 아라비아 척추 정형외과 수술 로봇 시장, 수술 유형별, 2020-2029년(백만 달러)
표 102 사우디 아라비아 정형외과 수술 로봇 시장, 로봇 유형별, 2020-2029년(백만 달러)
표 103 사우디 아라비아 정형외과 수술 로봇 시장, 로봇 유형별, 볼륨, 2020-2029(단위)
표 104 사우디 아라비아의 정형외과 수술 로봇 시장 규모, 로봇 유형별, 2020-2029년(백만 달러)
표 105 사우디 아라비아 정형외과 수술 로봇 시장 규모, 로봇 유형별, 규모, 2020-2029(단위)
표 106 사우디 아라비아 대퇴골 수술 로봇 시장, 수술 유형별, 2020-2029년(백만 달러)
표 107 사우디 아라비아 대퇴골 정형외과 수술 로봇 시장, 로봇 유형별, 2020-2029년(백만 달러)
표 108 사우디 아라비아 대퇴골 정형외과 수술 로봇 시장, 로봇 유형별, 볼륨, 2020-2029(단위)
표 109 사우디 아라비아 골반 수술 로봇 시장, 수술 유형별, 2020-2029(백만 달러)
표 110 사우디 아라비아 골반 수술 로봇 시장, 로봇 유형별, 2020-2029(백만 달러)
표 111 사우디 아라비아 골반 수술 로봇 시장, 로봇 유형별, 볼륨, 2020-2029(단위)
표 112 사우디 아라비아, 수술 유형별 정형외과 수술 로봇 시장 점유율, 2020-2029년(백만 달러)
표 113 사우디 아라비아, 로봇 유형별 정형외과 수술 로봇 시장 점유율, 2020-2029년(백만 달러)
표 114 사우디 아라비아, 로봇 유형별 정형외과 수술 로봇 시장 점유율, 규모, 2020-2029년(단위)
표 115 사우디 아라비아 정형외과 수술 로봇 시장, 수술 유형별, 2020-2029년(백만 달러)
표 116 사우디 아라비아 정형외과 수술 로봇 시장의 엘보우, 로봇 유형별, 2020-2029년(백만 달러)
표 117 사우디 아라비아 정형외과 수술 로봇 시장의 엘보, 로봇 유형별, 볼륨, 2020-2029(단위)
표 118 사우디 아라비아 정형외과 수술 로봇 시장, 최종 사용자별, 2020-2029년(백만 달러)
표 119 사우디 아라비아 병원의 정형외과 수술 로봇 시장, 최종 사용자별, 2020-2029(백만 달러)
표 120 사우디 아라비아 정형외과 수술 로봇 시장, 유통 채널별, 2020-2029년(백만 달러)
표 121 UAE 정형외과 수술 로봇 시장, 제품 유형별, 2020-2029년(백만 달러)
표 122 UAE 정형외과 수술 로봇 시장의 로봇 시스템, 응용 분야별, 2020-2029년(백만 달러)
표 123 UAE 무릎 정형외과 수술 로봇 시장, 수술 유형별, 2020-2029(백만 달러)
표 124 UAE 무릎 정형외과 수술 로봇 시장, 로봇 유형별, 2020-2029(백만 달러)
표 125 UAE 무릎 정형외과 수술 로봇 시장, 로봇 유형별, 볼륨, 2020-2029(단위)
표 126 UAE 고관절 정형외과 수술 로봇 시장, 수술 유형별, 2020-2029(백만 달러)
표 127 UAE HIP 정형외과 수술 로봇 시장, 로봇 유형별, 2020-2029(백만 달러)
표 128 UAE HIP 정형외과 수술 로봇 시장, 로봇 유형별, 볼륨, 2020-2029(단위)
표 129 UAE 척추 정형외과 수술 로봇 시장, 수술 유형별, 2020-2029(백만 달러)
표 130 UAE 척추 정형외과 수술 로봇 시장, 로봇 유형별, 2020-2029년(백만 달러)
표 131 UAE 척추 정형외과 수술 로봇 시장, 로봇 유형별, 볼륨, 2020-2029(단위)
표 132 UAE 정형외과 수술 로봇 시장 주요 규모, 로봇 유형별, 2020-2029년(백만 달러)
표 133 UAE 정형외과 수술 로봇 시장 주요 규모, 로봇 유형별, 규모, 2020-2029(단위)
표 134 UAE 대퇴골 정형외과 수술 로봇 시장, 수술 유형별, 2020-2029(백만 달러)
표 135 로봇 유형별 UAE 대퇴골 정형외과 수술 로봇 시장, 2020-2029년(백만 달러)
표 136 UAE 대퇴골 정형외과 수술 로봇 시장, 로봇 유형별, 볼륨, 2020-2029(단위)
표 137 UAE 골반 수술 로봇 시장, 수술 유형별, 2020-2029(백만 달러)
표 138 UAE 골반 정형외과 수술 로봇 시장, 로봇 유형별, 2020-2029(백만 달러)
표 139 UAE 골반 정형외과 수술 로봇 시장, 로봇 유형별, 볼륨, 2020-2029(단위)
표 140 UAE, 수술 유형별 정형외과 수술 로봇 시장 점유율, 2020-2029년(백만 달러)
표 141 UAE, 로봇 유형별 정형외과 수술 로봇 시장 점유율, 2020-2029년(백만 달러)
표 142 UAE, 로봇 유형별 정형외과 수술 로봇 시장 점유율, 규모, 2020-2029년(단위)
표 143 UAE 정형외과 수술 로봇 시장, 수술 유형별, 2020-2029(백만 달러)
표 144 UAE 정형외과 수술 로봇 시장, 로봇 유형별, 2020-2029년(백만 달러)
표 145 UAE 정형외과 수술용 로봇 시장, 로봇 유형별, 볼륨, 2020-2029(단위)
표 146 UAE 정형외과 수술 로봇 시장, 최종 사용자별, 2020-2029(백만 달러)
표 147 최종 사용자별 정형외과 수술 로봇 시장의 UAE 병원, 2020-2029년(백만 달러)
표 148 유통 채널별 UAE 정형외과 수술 로봇 시장, 2020-2029년(백만 달러)
표 149 이집트 정형외과 수술 로봇 시장, 제품 유형별, 2020-2029년(백만 달러)
표 150 이집트 정형외과 수술 로봇 시장의 로봇 시스템, 응용 분야별, 2020-2029년(백만 달러)
표 151 이집트 무릎 수술 로봇 시장, 수술 유형별, 2020-2029 (백만 달러)
표 152 이집트 무릎 수술 로봇 시장, 로봇 유형별, 2020-2029년(백만 달러)
표 153 이집트 정형외과 수술 로봇 시장, 로봇 유형별, 볼륨, 2020-2029(단위)
표 154 이집트 고관절 수술 로봇 시장, 수술 유형별, 2020-2029년(백만 달러)
표 155 이집트 고관절 정형외과 수술 로봇 시장, 로봇 유형별, 2020-2029년(백만 달러)
표 156 이집트 고관절 정형외과 수술 로봇 시장, 로봇 유형별, 볼륨, 2020-2029(단위)
표 157 이집트 척추 수술 로봇 시장, 수술 유형별, 2020-2029(백만 달러)
표 158 이집트 척추 수술 로봇 시장, 로봇 유형별, 2020-2029년(백만 달러)
표 159 이집트 정형외과 수술 로봇 시장의 척추, 로봇 유형별, 볼륨, 2020-2029(단위)
표 160 이집트 정형외과 수술 로봇 시장, 로봇 유형별, 2020-2029년(백만 달러)
표 161 이집트 정형외과 수술 로봇 시장, 로봇 유형별, 볼륨, 2020-2029(단위)
표 162 이집트 대퇴골 수술 로봇 시장, 수술 유형별, 2020-2029(백만 달러)
표 163 이집트 대퇴골 정형외과 수술 로봇 시장, 로봇 유형별, 2020-2029년(백만 달러)
표 164 이집트 대퇴골 정형외과 수술 로봇 시장, 로봇 유형별, 볼륨, 2020-2029(단위)
표 165 이집트 골반 수술 로봇 시장, 수술 유형별, 2020-2029 (백만 달러)
표 166 이집트 골반 수술 로봇 시장, 로봇 유형별, 2020-2029년(백만 달러)
표 167 이집트 골반 정형외과 수술 로봇 시장, 로봇 유형별, 볼륨, 2020-2029(단위)
표 168 이집트, 수술 유형별 정형외과 수술 로봇 시장 점유율, 2020-2029년(백만 달러)
표 169 이집트, 로봇 유형별 정형외과 수술 로봇 시장 점유율, 2020-2029년(백만 달러)
표 170 이집트 정형외과 수술 로봇 시장 점유율, 로봇 유형별, 볼륨, 2020-2029(단위)
표 171 정형외과 수술 로봇 시장의 이집트 엘보, 수술 유형별, 2020-2029년(백만 달러)
표 172 정형외과 수술 로봇 시장에서의 이집트 엘보, 로봇 유형별, 2020-2029년(백만 달러)
표 173 정형외과 수술 로봇 시장에서의 이집트 엘보, 로봇 유형별, 볼륨, 2020-2029(단위)
표 174 이집트 정형외과 수술 로봇 시장, 최종 사용자별, 2020-2029년(백만 달러)
표 175 최종 사용자별 정형외과 수술 로봇 시장의 이집트 병원, 2020-2029년(백만 달러)
표 176 이집트 정형외과 수술 로봇 시장, 유통 채널별, 2020-2029년(백만 달러)
표 177 이스라엘 정형외과 수술 로봇 시장, 제품 유형별, 2020-2029년(백만 달러)
표 178 이스라엘 정형외과 수술 로봇 시장의 로봇 시스템, 응용 분야별, 2020-2029년(백만 달러)
표 179 이스라엘 정형외과 수술 로봇 시장, 수술 유형별, 2020-2029년(백만 달러)
표 180 이스라엘 정형외과 수술용 로봇 시장, 로봇 유형별, 2020-2029년(백만 달러)
표 181 이스라엘 정형외과 수술용 로봇 시장, 로봇 유형별, 볼륨, 2020-2029(단위)
표 182 이스라엘 고관절 수술 로봇 시장, 수술 유형별, 2020-2029(백만 달러)
표 183 이스라엘 정형외과 수술 로봇 시장, 로봇 유형별, 2020-2029년(백만 달러)
표 184 이스라엘 정형외과 수술 로봇 시장, 로봇 유형별, 볼륨, 2020-2029(단위)
표 185 이스라엘 척추 정형외과 수술 로봇 시장, 수술 유형별, 2020-2029(백만 달러)
표 186 이스라엘 척추 정형외과 수술 로봇 시장, 로봇 유형별, 2020-2029(백만 달러)
표 187 이스라엘 척추 정형외과 수술 로봇 시장, 로봇 유형별, 볼륨, 2020-2029(단위)
표 188 이스라엘 MAZOR 정형외과 수술 로봇 시장, 로봇 유형별, 2020-2029(백만 달러)
표 189 이스라엘 MAZOR 정형외과 수술 로봇 시장, 로봇 유형별, 볼륨, 2020-2029(단위)
표 190 이스라엘 대퇴골 정형외과 수술 로봇 시장, 수술 유형별, 2020-2029(백만 달러)
표 191 이스라엘 대퇴골 정형외과 수술 로봇 시장, 로봇 유형별, 2020-2029년(백만 달러)
표 192 이스라엘 대퇴부 정형외과 수술 로봇 시장, 로봇 유형별, 볼륨, 2020-2029(단위)
표 193 이스라엘 골반 수술 로봇 시장, 수술 유형별, 2020-2029(백만 달러)
표 194 이스라엘 골반 정형외과 수술 로봇 시장, 로봇 유형별, 2020-2029(백만 달러)
표 195 이스라엘 골반 정형외과 수술 로봇 시장, 로봇 유형별, 볼륨, 2020-2029(단위)
표 196 이스라엘, 수술 유형별 정형외과 수술 로봇 시장 점유율, 2020-2029년(백만 달러)
표 197 이스라엘, 로봇 유형별 정형외과 수술 로봇 시장 점유율, 2020-2029년(백만 달러)
표 198 이스라엘, 로봇 유형별 정형외과 수술 로봇 시장 점유율, 규모, 2020-2029년(단위)
표 199 이스라엘 정형외과 수술 로봇 시장, 수술 유형별, 2020-2029(백만 달러)
표 200 이스라엘 정형외과 수술 로봇 시장의 엘보, 로봇 유형별, 2020-2029(백만 달러)
표 201 이스라엘 정형외과 수술 로봇 시장의 엘보, 로봇 유형별, 볼륨, 2020-2029(단위)
표 202 이스라엘 정형외과 수술 로봇 시장, 최종 사용자별, 2020-2029년(백만 달러)
표 203 이스라엘 병원의 정형외과 수술 로봇 시장, 최종 사용자별, 2020-2029(백만 달러)
표 204 이스라엘 정형외과 수술 로봇 시장, 유통 채널별, 2020-2029년(백만 달러)
표 205 중동 및 아프리카의 나머지 지역 정형외과 수술 로봇 시장, 제품 유형별, 2020-2029년(백만 달러)
그림 목록
그림 1 중동 및 아프리카 정형외과 수술 로봇 시장: 세분화
그림 2 중동 및 아프리카 정형외과 수술 로봇 시장: 데이터 삼각 측량
그림 3 중동 및 아프리카 정형외과 수술 로봇 시장: DROC 분석
그림 4 중동 및 아프리카 정형외과 수술 로봇 시장: 중동 및 아프리카 대 지역 시장 분석
그림 5 중동 및 아프리카 정형외과 수술 로봇 시장: 회사 연구 분석
그림 6 중동 및 아프리카 정형외과 수술 로봇 시장: 인터뷰 인구 통계
그림 7 중동 및 아프리카 정형외과 수술 로봇 시장: DBMR 시장 위치 그리드
그림 8 중동 및 아프리카 정형외과 수술 로봇 시장: 시장 최종 사용자 그리드
그림 9 중동 및 아프리카 정형외과 수술 로봇 시장: 공급업체 점유율 분석
그림 10 중동 및 아프리카 정형외과 수술 로봇 시장: 세분화
그림 11 골다공증의 유병률 증가와 스포츠 및 외상 부상 발생률 증가가 2020년에서 2027년까지의 예측 기간 동안 중동 및 아프리카 정형외과 수술 로봇 시장을 주도할 것으로 예상됩니다.
그림 12 제품 유형은 2022년 및 2029년 중동 및 아프리카 정형외과 수술 로봇 시장에서 가장 큰 점유율을 차지할 것으로 예상됩니다.
그림 13 중동 및 아프리카 정형외과 수술 로봇 시장의 동인, 제약, 기회 및 과제
그림 14 현재 의료비 지출(GDP 대비 %) 2018-2019-
그림 15 중동 및 아프리카 정형외과 수술 로봇 시장: 제품 유형별, 2021년
그림 16 중동 및 아프리카 정형외과 수술 로봇 시장: 제품 유형별, 2021-2029년(백만 달러)
그림 17 중동 및 아프리카 정형외과 수술 로봇 시장: 제품 유형별, CAGR(2021-2029)
그림 18 중동 및 아프리카 정형외과 수술 로봇 시장: 제품 유형별, 수명선 곡선
그림 19 중동 및 아프리카 정형외과 수술 로봇 시장: 최종 사용자별, 2021년
그림 20 중동 및 아프리카 정형외과 수술 로봇 시장: 최종 사용자별, 2020-2029(백만 달러)
그림 21 중동 및 아프리카 정형외과 수술 로봇 시장: 최종 사용자별, CAGR(2022-2029)
그림 22 중동 및 아프리카 정형외과 수술 로봇 시장: 최종 사용자별, 수명선 곡선
그림 23 중동 및 아프리카 정형외과 수술 로봇 시장: 유통 채널별, 2021년
그림 24 중동 및 아프리카 정형외과 수술 로봇 시장: 유통 채널별, 2022-2029년(백만 달러)
그림 25 중동 및 아프리카 정형외과 수술 로봇 시장: 유통 채널별, CAGR(2022-2029)
그림 26 중동 및 아프리카 정형외과 수술 로봇 시장: 유통 채널별, 수명선 곡선
그림 27 중동 및 아프리카 정형외과 수술 로봇 시장: 스냅샷(2021)
그림 28 중동 및 아프리카 정형외과 수술 로봇 시장: 국가별(2021년)
그림 29 중동 및 아프리카 정형외과 수술 로봇 시장: 국가별(2022년 및 2029년)
그림 30 중동 및 아프리카 정형외과 수술 로봇 시장: 국가별(2021년 및 2029년)
그림 31 중동 및 아프리카 정형외과 수술 로봇 시장: 제품 유형별(2022-2029)
그림 32 중동 및 아프리카 정형외과 수술 로봇 시장: 회사 점유율 2021(%)
연구 방법론
데이터 수집 및 기준 연도 분석은 대규모 샘플 크기의 데이터 수집 모듈을 사용하여 수행됩니다. 이 단계에는 다양한 소스와 전략을 통해 시장 정보 또는 관련 데이터를 얻는 것이 포함됩니다. 여기에는 과거에 수집한 모든 데이터를 미리 검토하고 계획하는 것이 포함됩니다. 또한 다양한 정보 소스에서 발견되는 정보 불일치를 검토하는 것도 포함됩니다. 시장 데이터는 시장 통계 및 일관된 모델을 사용하여 분석하고 추정합니다. 또한 시장 점유율 분석 및 주요 추세 분석은 시장 보고서의 주요 성공 요인입니다. 자세한 내용은 분석가에게 전화를 요청하거나 문의 사항을 드롭하세요.
DBMR 연구팀에서 사용하는 주요 연구 방법론은 데이터 마이닝, 시장에 대한 데이터 변수의 영향 분석 및 주요(산업 전문가) 검증을 포함하는 데이터 삼각 측량입니다. 데이터 모델에는 공급업체 포지셔닝 그리드, 시장 타임라인 분석, 시장 개요 및 가이드, 회사 포지셔닝 그리드, 특허 분석, 가격 분석, 회사 시장 점유율 분석, 측정 기준, 글로벌 대 지역 및 공급업체 점유율 분석이 포함됩니다. 연구 방법론에 대해 자세히 알아보려면 문의를 통해 업계 전문가에게 문의하세요.
사용자 정의 가능
Data Bridge Market Research는 고급 형성 연구 분야의 선두 주자입니다. 저희는 기존 및 신규 고객에게 목표에 맞는 데이터와 분석을 제공하는 데 자부심을 느낍니다. 보고서는 추가 국가에 대한 시장 이해(국가 목록 요청), 임상 시험 결과 데이터, 문헌 검토, 재생 시장 및 제품 기반 분석을 포함하도록 사용자 정의할 수 있습니다. 기술 기반 분석에서 시장 포트폴리오 전략에 이르기까지 타겟 경쟁업체의 시장 분석을 분석할 수 있습니다. 귀하가 원하는 형식과 데이터 스타일로 필요한 만큼 많은 경쟁자를 추가할 수 있습니다. 저희 분석가 팀은 또한 원시 엑셀 파일 피벗 테이블(팩트북)로 데이터를 제공하거나 보고서에서 사용 가능한 데이터 세트에서 프레젠테이션을 만드는 데 도움을 줄 수 있습니다.

