Us Optic Neuritis Market
시장 규모 (USD 10억)
연평균 성장률 :
% 
 USD
5.04 Million
USD
7.44 Million
2025
2033
USD
5.04 Million
USD
7.44 Million
2025
2033
| 2026 –2033 | |
| USD 5.04 Million | |
| USD 7.44 Million | |
| % | |
U.S. Optic Neuritis Market, By Treatment (Corticosteroids, IV Immunoglobulin, Supplements, and Others), Diagnosis (MRI Scan, Lumbar Puncture, Occular Coherence Tomography, Blood Test, and Others), Route of Administration (Parenteral, and Oral), End User (Hospitals, Clinics, Academics & Research Institutes, and Others), Distribution Channel (Hospital Pharmacy, Retail Pharmacy, and Others). Industry Trends and Forecast to 2029.
U.S. Optic Neuritis Market Analysis and Size
The growing prevalence of eye disorders in the region and the rise in the geriatric population has enhanced the demand of the market. The rising healthcare expenditure for better health services is also attributed to the growth of the market. The major market players are highly focused on product launches and approvals during this crucial period. In addition, the government and regulatory bodies are supporting market players by product approval due to the surging emergence.
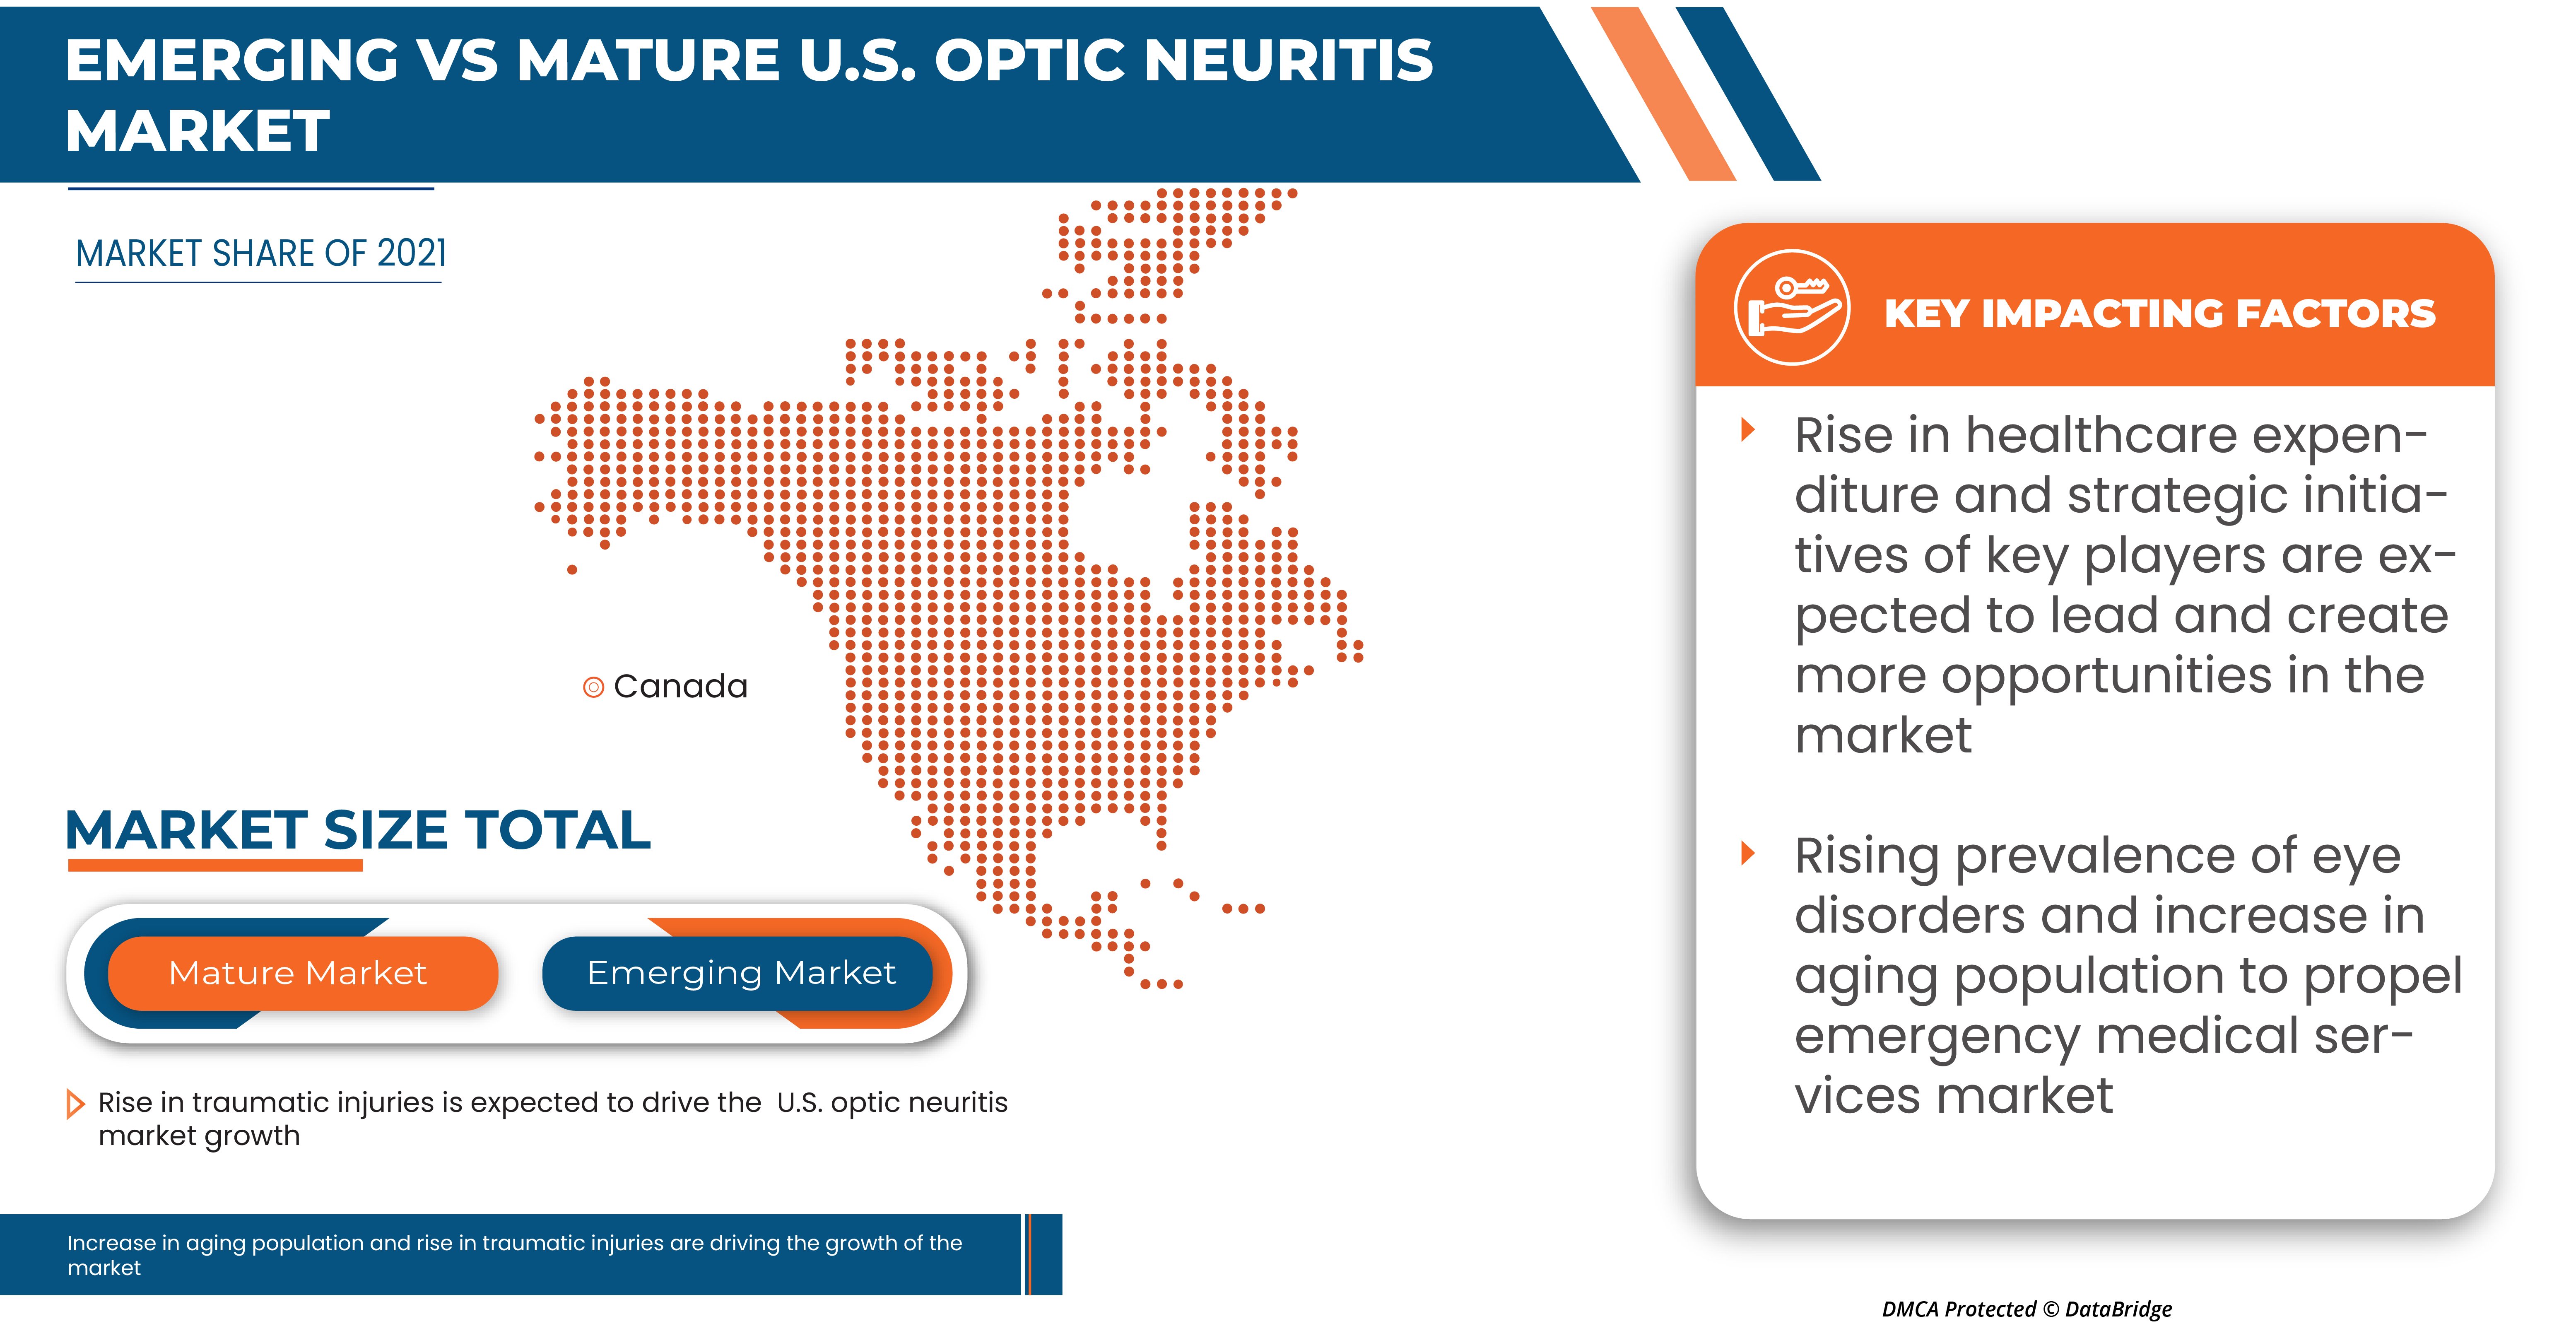

The U.S. optic neuritis market is expected to reach USD 6.11 million by 2029 from USD 4.15 million in 2021, growing at a CAGR of 5.0% in the forecast period of 2022 to 2029.
|
Report Metric |
Details |
|
Forecast Period |
2022 to 2029 |
|
Base Year |
2021 |
|
Historic Years |
2020 (Customizable to 2019 - 2015) |
|
Quantitative Units |
Revenue in USD Million |
|
Segments Covered |
By Treatment (Corticosteroids, IV Immunoglobulin, Supplements, and Others), Diagnosis (MRI Scan, Lumbar Puncture, Ocular Coherence Tomography, Blood Test, and Others), Route of Administration (Parenteral, and Oral), End User (Hospitals, Clinics, Academics & Research Institutes, and Others), Distribution Channel (Hospital Pharmacy, Retail Pharmacy, and Others) |
|
Countries Covered |
U.S. |
|
Market Players Covered |
AbbVie Inc., Bausch & Lomb Incorporated, Boehringer Ingelheim International GmbH, Novartis AG, Merck & Co., Inc., Hikma Pharmaceuticals PLC, Fresenius Kabi USA, Teva Pharmaceuticals Industries Ltd., GSK plc, Pfizer, Akorn Operating Company LLC, AdvaCare Pharma, Bristol- Myers Squibb Company, Jubilant Cadista Pharmaceuticals Inc., Amneal Pharmaceuticals LLC., Viatris Inc., and Novitium Pharma, among others. The pipeline companies that are in this market are Accure Therapeutics, Noveome Biotherapeutics, Inc., Biogen, Mallinckrodt, and Acorda Therapeutics, Sanofi, among others. |
Market Definition
Optic neuritis is characterized as a swelling or inflammation that occurs in the optic nerve. It is also commonly termed as optic papillitis and retro tubular neuritis. The optic nerves is a nerve fibres that has the capability of transmitting visual information from the eye to the brain. The inflammation usually leads to damage in the optic nerve and temporary vision loss in only one eye typically. Pediatric optic neuritis and adult optic neuritis and are two types which is based on the age group of patients diagnosed with optic neuritis. The common way to diagnose the optic neuritis is through a physical exam and medical history. The treatment becomes essential at an early stage due to the lifetime risk of losing human eye vision in this disorder. The most common symptoms associated with optic neuritis include pain with eye movement and dyschromatopsia or inability to see colors correctly. For instance, as per an article in the Journal of Neurology stated that the annual incidence of optic neuritis in the U.S. is found to be around 5/1,000,000, with an estimated prevalence of 115/1,000,000.
Optic Neuritis Market Dynamics
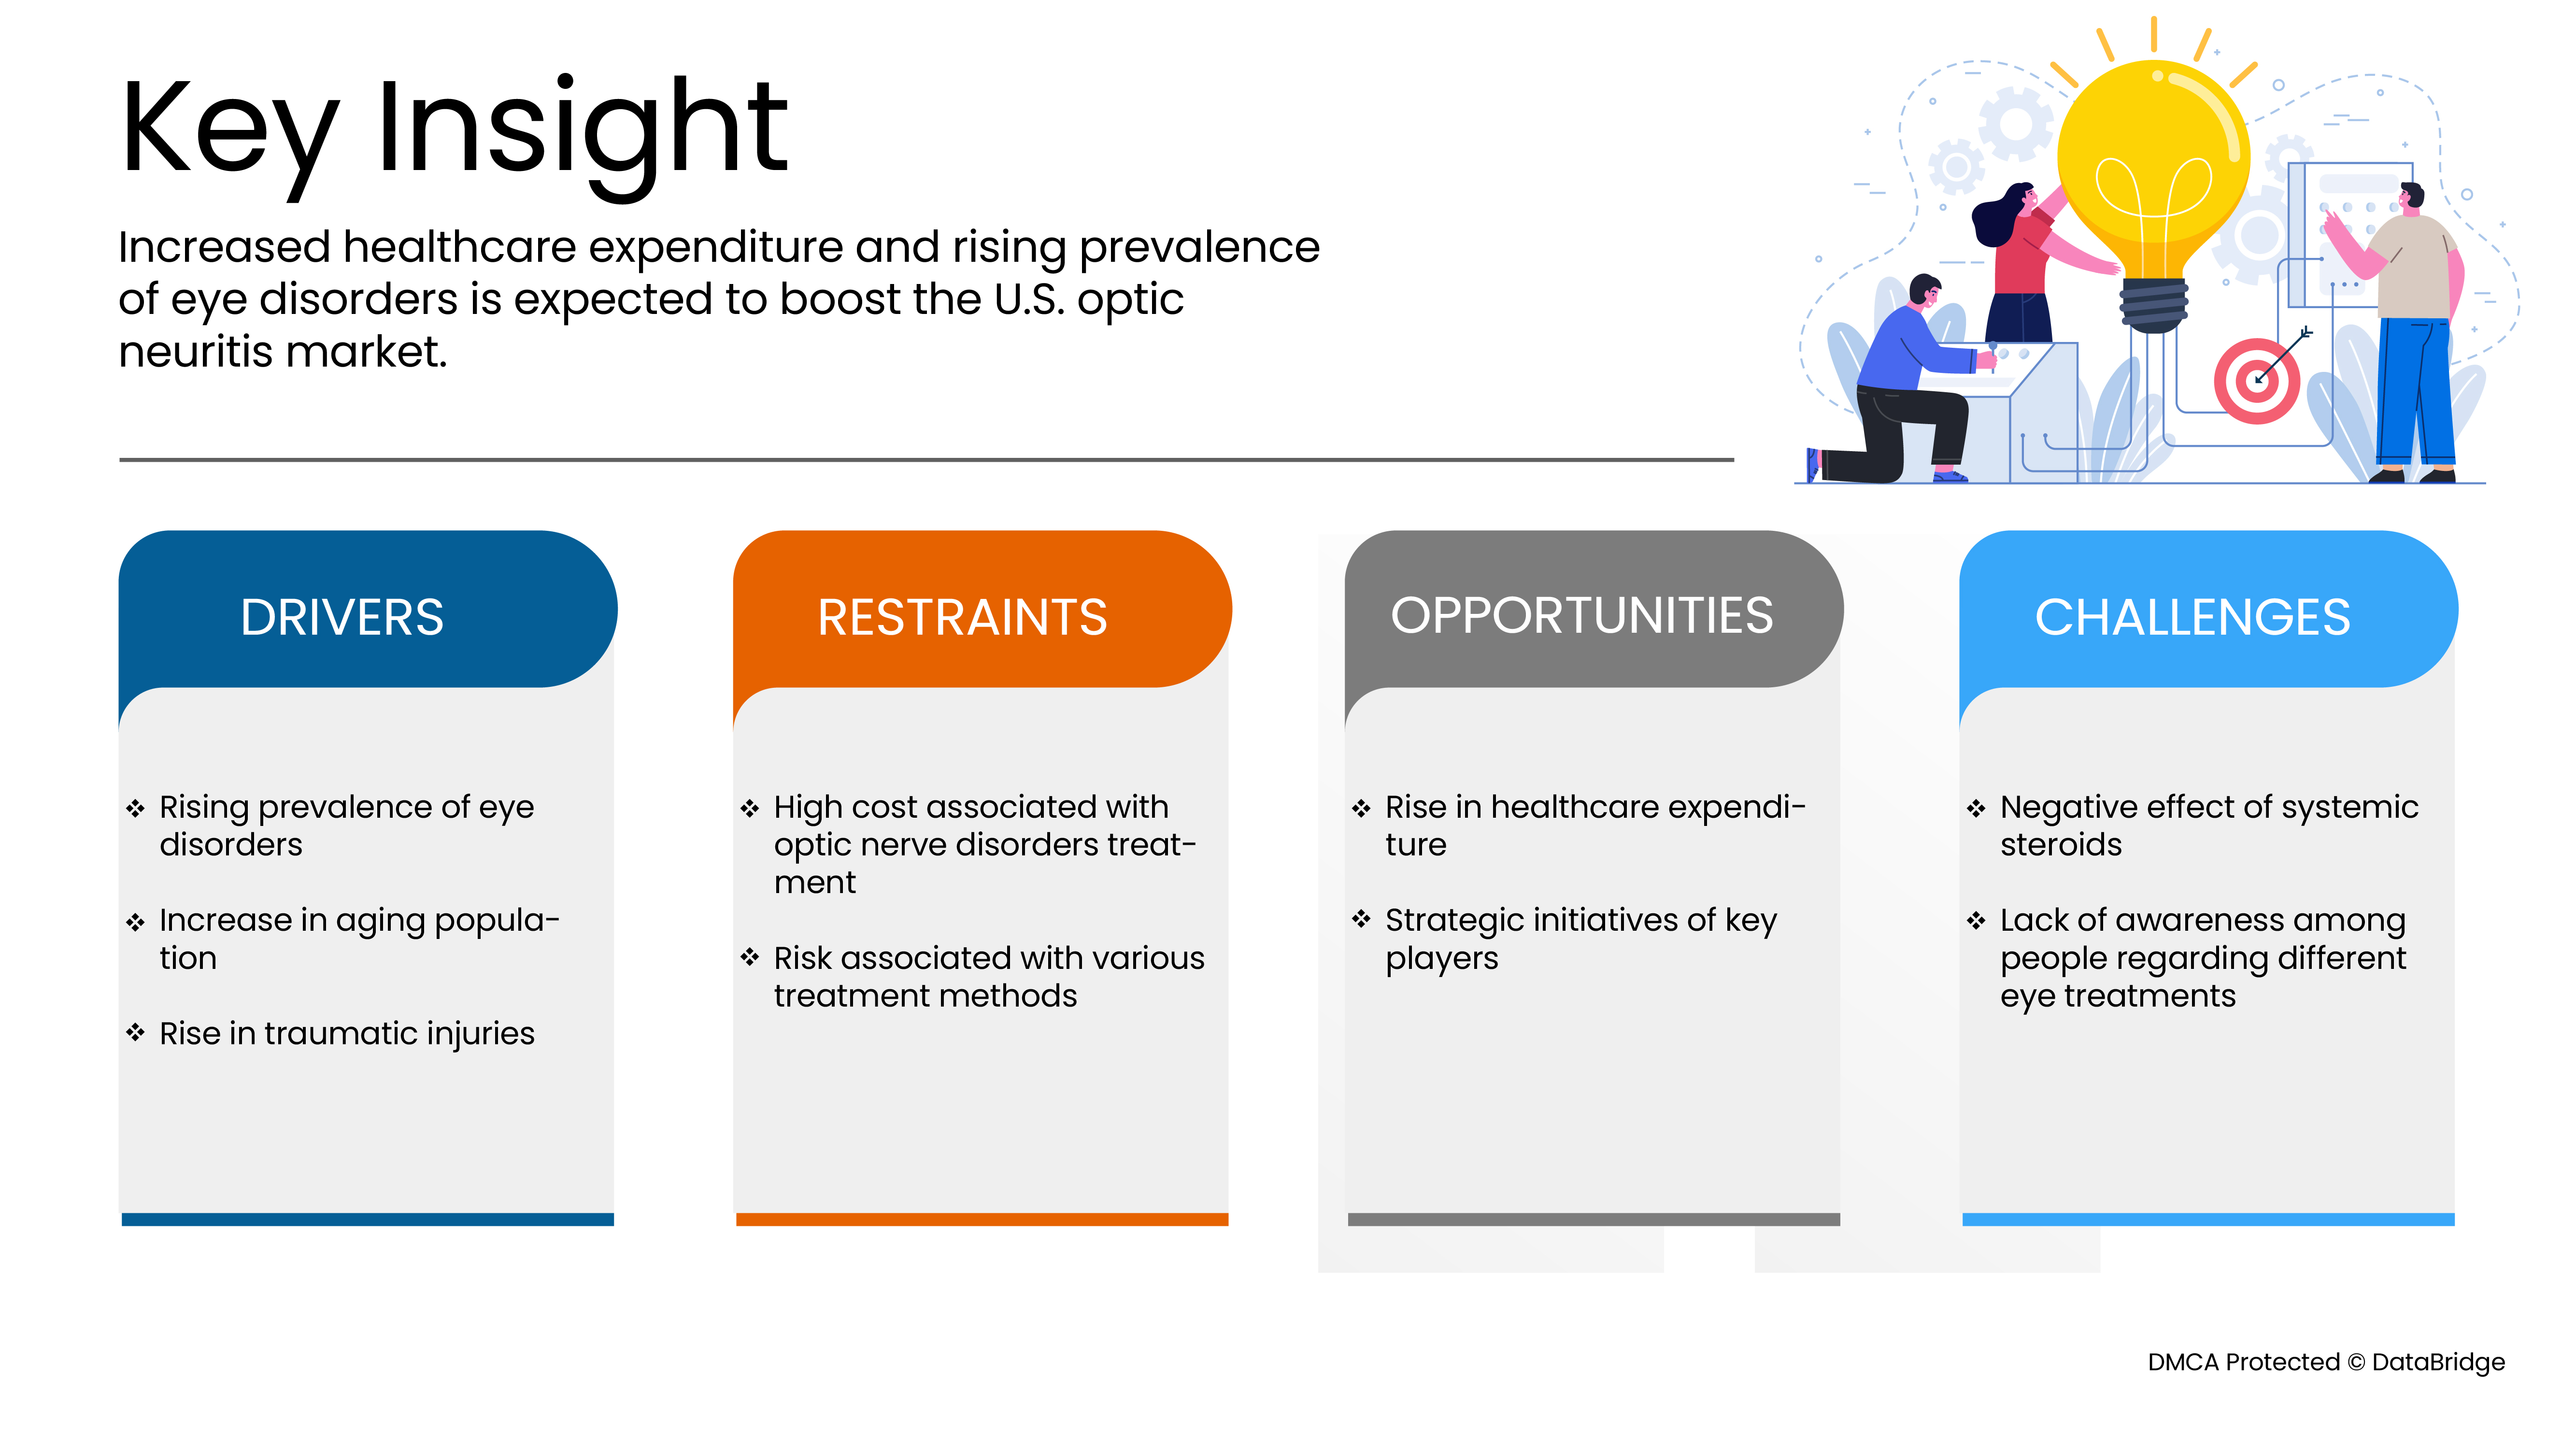
This section deals with understanding the market drivers, opportunities, restraints, and challenges. All of this is discussed in detail as below:
Drivers
-
Rising prevalence of eye disorders
With the increased prevalence and optic neuritis worldwide, there is an increase in the awareness about the disease. Therefore, rising patient awareness of optic neuritis is expected to act as a driver for the growth of the optic neuritis market.
-
Rise in traumatic injuries
Another significant factor influencing the growth rate of the optic neuritis market is the increasing prevalence of the disease in the region.
-
Increase in aging population
An increase in the aging population, rise in the multiple sclerosis patient pool, growing awareness, and affordable prices are the major factors propelling the market.
Opportunities
-
Strategic initiatives of key players
The dramatic rise in the quality of research and increasing research opportunities is because of various strategic initiatives taken by the key market players in the optic neuritis market. They are taking initiatives such as product launches, collaborations, mergers, acquisitions, and many more over the years and are expected to lead and create more opportunities in the market.
Also, the rise in healthcare expenditure will provide structural integrity and future opportunities for the optic neuritis market in the forecast period of 2022-2029.
Restraints/Challenges
- High cost associated with optic nerve disorders treatment
However, the high cost of therapies and side effects and complications of various drugs and therapies will impede the growth rate of the optic neuritis market. Additionally, stringent rules and regulations will further challenge the market in the forecast period mentioned above.
This optic neuritis market report provides details of new recent developments, trade regulations, import-export analysis, production analysis, value chain optimization, market share, the impact of domestic and localized market players, analyses opportunities in terms of emerging revenue pockets, changes in market regulations, strategic market growth analysis, market size, category market growths, application niches and dominance, product approvals, product launches, geographic expansions, technological innovations in the market. For more info on the optic neuritis market, contact Data Bridge Market Research for an Analyst Brief. Our team will help you to make an informed market decision to achieve market growth.
Recent Development
Sanofi is recently working on a single oral doses study of nerispirdine on visual function in patients with multiple sclerosis.
The U.S. Optic Neuritis Market Scope
The U.S. optic neuritis market is segmented into treatment, diagnosis, route of administration, end users, and distribution channel. The growth amongst these segments will help you analyze meager growth segments in the industries and provide the users with a valuable market overview and market insights to make strategic decisions to identify core market applications.
Treatment
- Corticosteroids
- IV Immunoglobulin
- Supplements
- Others
On the basis of treatment, the U.S. optic neuritis market is segmented into corticosteroids, IV Immunoglobulin, Supplements, and Others.
Diagnosis
- MRI Scan
- Lumbar Puncture
- Ocular Coherence Tomography
- Blood Test
- Others
On the basis of diagnosis, the U.S. optic neuritis market is segmented into MRI scans, lumbar puncture, ocular coherence tomography, blood test, and others.
Route of Administration
- Parenteral
- Oral
On the basis of route of administration, the U.S. optic neuritis market is segmented into parenteral, and oral.
End User
- Hospitals
- Clinics
- Academic & Research Institutes
- Others
On the basis of end-user, the U.S. optic neuritis market is segmented into hospitals, clinics, academic and research institutes, and others.
Distribution Channel
- Hospital Pharmacy
- Retail Pharmacy
- Others
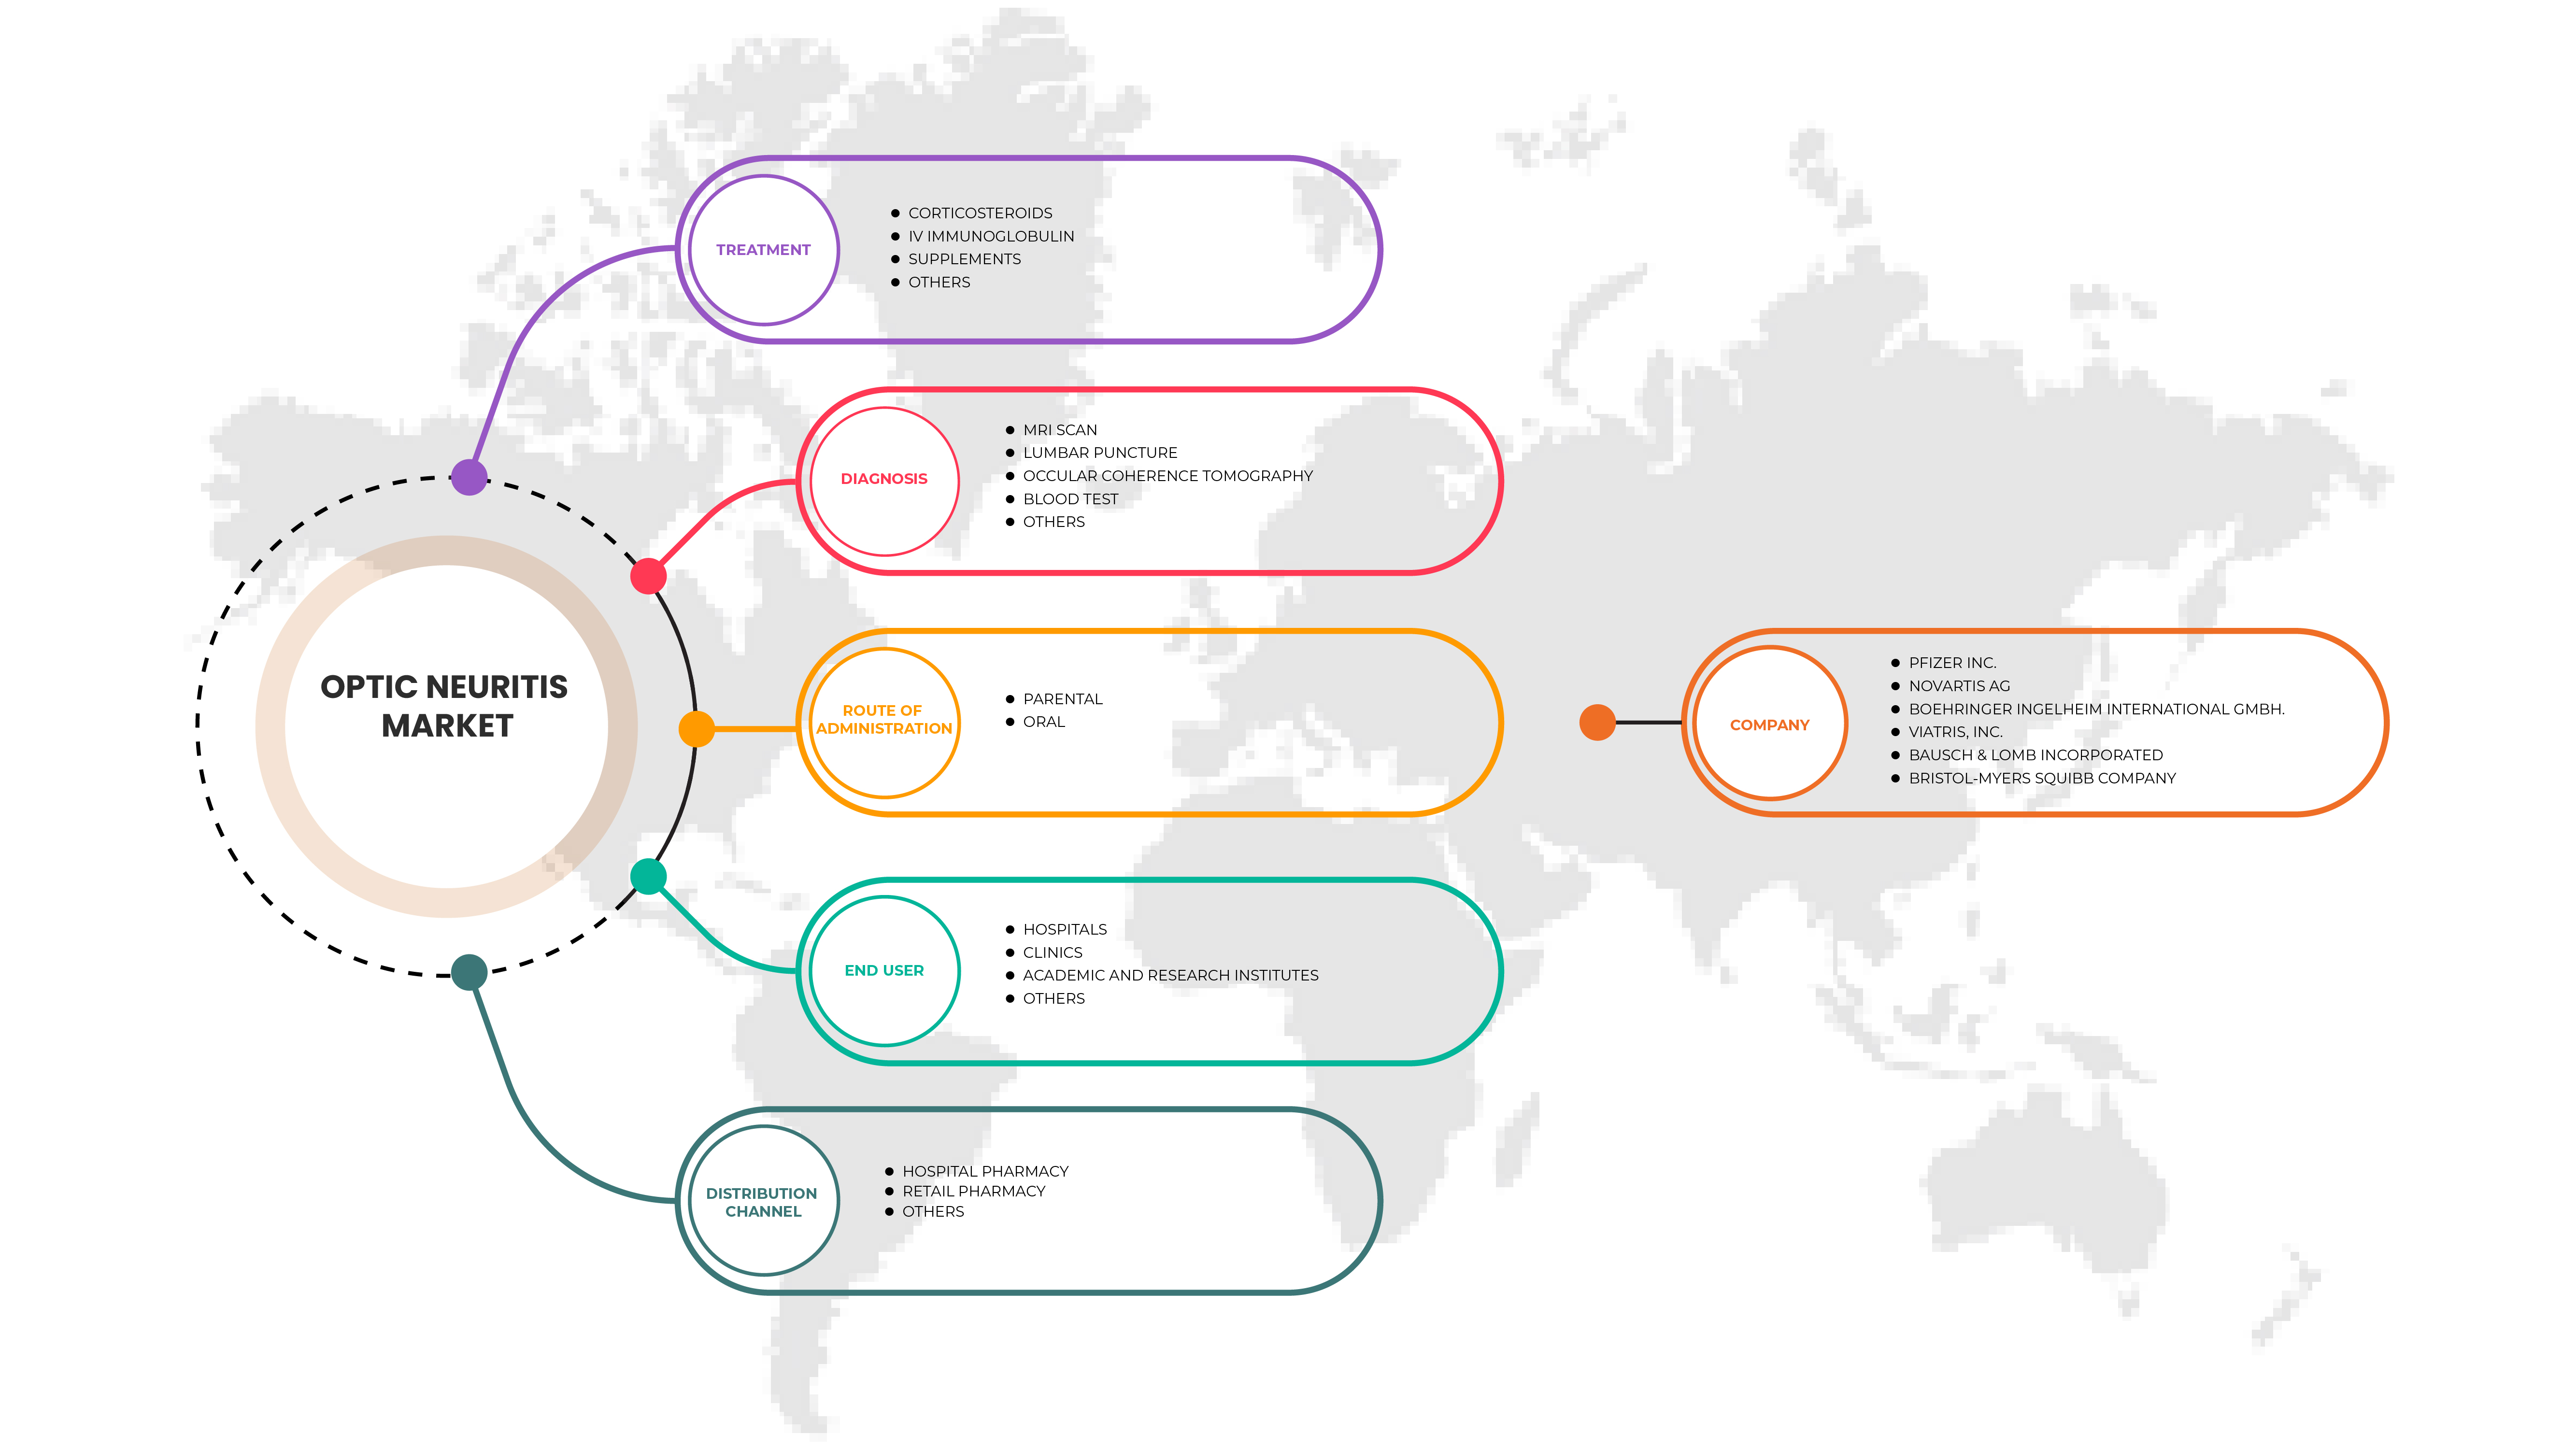
On the basis of distribution channel, the U.S. optic neuritis market is segmented into hospital pharmacy, retail pharmacy, and others.
Optic Neuritis Market Regional Analysis/Insights
The optic neuritis market is analyzed, and market size insights and trends are provided by country, treatment, diagnosis, route of administration, end user, and distribution channel, as referenced above.
The U.S. dominates the optic neuritis market in terms of market share and market revenue and will continue to flourish its dominance during the forecast period. This is due to implementing awareness programs regarding the diagnosis and treatments of optic neuritis, and research and development in the drugs for optic neuritis in the U.S. region further improves this market growth.
The country section of the report also provides individual market-impacting factors and changes in regulations in the market that impact the current and future trends of the market. Data points, such as new and replacement sales, country demographics, disease epidemiology, and import-export tariffs, are some of the major pointers used to forecast the market scenario for individual countries. In addition, the presence and availability of global brands and their challenges faced due to high competition from local and domestic brands, and the impact of sales channels are considered while providing forecast analysis of the country data.
Competitive Landscape and Optic Neuritis Market Share Analysis
The optic neuritis market competitive landscape provides details by the competitors. Details include company overview, company financials, revenue generated, market potential, investment in research and development, new market initiatives, global presence, production sites and facilities, production capacities, company strengths and weaknesses, product launch, product width and breadth, and application dominance. The above data points provided are only related to the companies' focus on the optic neuritis market.
Some of the major players operating in the optic neuritis market are AbbVie Inc., Bausch & Lomb Incorporated, Boehringer Ingelheim International GmbH, Novartis AG, Merck & Co., Inc., Hikma Pharmaceuticals PLC, Fresenius Kabi USA, Teva Pharmaceuticals Industries Ltd., GSK plc, Pfizer, Akorn Operating Company LLC, AdvaCare Pharma, Bristol- Myers Squibb Company, Jubilant Cadista Pharmaceuticals Inc., Amneal Pharmaceuticals LLC., Viatris Inc., and Novitium Pharma, among others. The pipeline companies that are in this market are Accure Therapeutics, Noveome Biotherapeutics, Inc., Biogen, Mallinckrodt, Acorda Therapeutics, and Sanofi, among others.
Research Methodology
Data collection and base year analysis are done using data collection modules with large sample sizes. The market data is analysed and estimated using market statistical and coherent models. In addition, market share analysis and key trend analysis are the major success factors in the market report. The key research methodology used by DBMR research team is data triangulation which involves data mining, analysis of the impact of data variables on the market, and primary (industry expert) validation. Apart from this, data models include the Vendor Positioning Grid, Market Time Line Analysis, Market Overview and Guide, Company Positioning Grid, Company Market Share Analysis, Standards of Measurement, U.S. vs. Regional, and Vendor Share Analysis. Please request an analyst call in case of further inquiry.
SKU-
세계 최초의 시장 정보 클라우드 보고서에 온라인으로 접속하세요

- 대화형 데이터 분석 대시보드
- 높은 성장 잠재력 기회를 위한 회사 분석 대시보드
- 사용자 정의 및 질의를 위한 리서치 분석가 액세스
- 대화형 대시보드를 통한 경쟁자 분석
- 최신 뉴스, 업데이트 및 추세 분석
- 포괄적인 경쟁자 추적을 위한 벤치마크 분석의 힘 활용
목차
1 서론
1.1 연구 목적
1.2 시장 정의
1.3 미국 시신경염 시장 개요
1.4 제한 사항
1.5 대상 시장
2 시장 세분화
2.1 대상 시장
2.2 지리적 범위
연구에 2.3년이 고려됨
2.4 통화 및 가격
2.5 DBMR TRIPOD 데이터 검증 모델
2.6 다변량 모델링
2.7 치료 수명선 곡선
2.8 주요 여론 선도자와의 1차 인터뷰
2.9 DBMR 시장 위치 그리드
2.1 시장 최종 사용자 범위 그리드
2.11 공급업체 점유율 분석
2.12 2차 소스
2.13 가정
3 요약
4가지 프리미엄 인사이트
4.1 페스텔
4.2 포터의 5가지 힘 모델
5 역학
6가지 산업 통찰력
6.1 특허 분석
6.2 성숙 시장별 약물 치료율
6.3 인구 통계적 추세: 모든 발생률에 미치는 영향
6.4 환자 흐름도
6.5 주요 가격 책정 전략
6.6 주요 환자 등록 전략
7 파이프라인 분석
8 미국 시신경염 시장: 규정
8.1 미국 내 규제:
9 시장 개요
9.1 드라이버
9.1.1 눈 질환 유병률 증가
9.1.2 고령화 인구 증가
9.1.3 외상성 부상 증가
9.2 제약
9.2.1 시신경 장애 치료와 관련된 높은 비용
9.2.2 다양한 치료 방법과 관련된 위험
9.3 기회
9.3.1 의료비 지출 증가
9.3.2 주요 참여자의 전략적 이니셔티브
9.4 과제
9.4.1 전신 스테로이드의 부정적 영향
9.4.2 다양한 눈 치료에 대한 사람들의 인식 부족
10 미국 시신경염 시장, 치료별
10.1 개요
10.2 코르티코스테로이드
10.2.1 메틸프레드니솔론
10.2.2 프레드니손
10.2.3 기타
10.3 IV 면역글로불린
10.4 보충 자료
10.5 기타
11 미국 시신경염 시장, 진단별
11.1 개요
11.2 MRI 스캔
11.3 혈액 검사
11.4 안구 간섭 단층촬영
11.5 요추 천자
11.6 기타
12 미국 시신경염 시장, 투여 경로별
12.1 개요
12.2 부모의
12.3 경구
13 미국 시신경염 시장, 최종 사용자별
13.1 개요
13.2 병원
13.3 클리닉
13.4 학술 및 연구 기관
13.5 기타
14 미국 시신경염 시장, 유통 채널별
14.1 개요
14.2 병원약국
14.3 소매 약국
14.4 기타
15 미국 시신경염 시장: 회사 환경
15.1 회사 점유율 분석: 미국
16 SWOT 분석
17 회사 프로필
17.1 파이저 주식회사
17.1.1 회사 스냅샷
17.1.2 수익 분석
17.1.3 제품 포트폴리오
17.1.4 최근 개발
17.2 노바티스 AG
17.2.1 회사 스냅샷
17.2.2 수익 분석
17.2.3 제품 포트폴리오
17.2.4 최근 개발
17.3 베링거 인겔하임 인터내셔널 유한회사.
17.3.1 회사 스냅샷
17.3.2 수익 분석
17.3.3 제품 포트폴리오
17.3.4 최근 개발
17.4 VIATRIS 주식회사
17.4.1 회사 스냅샷
17.4.2 수익 분석
17.4.3 제품 포트폴리오
17.4.4 최근 개발
17.5 바우쉬앤롬 주식회사
17.5.1 회사 스냅샷
17.5.2 수익 분석
17.5.3 제품 포트폴리오
17.5.4 최근 개발 사항
17.6 브리스톨 – 마이어스 스퀴브 회사
17.6.1 회사 스냅샷
17.6.2 수익 분석
17.6.3 제품 포트폴리오
17.6.4 최근 개발
17.7 프레세니우스 카비 USA
17.7.1 회사 스냅샷
17.7.2 수익 분석
17.7.3 제품 포트폴리오
17.7.4 최근 개발
17.8 애브비 주식회사
17.8.1 회사 스냅샷
17.8.2 수익 분석
17.8.3 제품 포트폴리오
17.8.4 최근 개발
17.9 아드바카레파마
17.9.1 회사 스냅샷
17.9.2 제품 포트폴리오
17.9.3 최근 개발
17.1 AKORN 운영 회사 유한회사.
17.10.1 회사 스냅샷
17.10.2 제품 포트폴리오
17.10.3 최근 개발
17.11 AMNEAL 제약 유한회사
17.11.1 회사 스냅샷
17.11.2 수익 분석
17.11.3 제품 포트폴리오
17.11.4 최근 개발
17.12 지에스케이(주)
17.12.1 회사 스냅샷
17.12.2 수익 분석
17.12.3 제품 포트폴리오
17.12.4 최근 개발
17.13 히크마제약 주식회사
17.13.1 회사 스냅샷
17.13.2 수익 분석
17.13.3 제품 포트폴리오
17.13.4 최근 개발
17.14 환호하는 카디스타
17.14.1 회사 스냅샷
17.14.2 제품 포트폴리오
17.14.3 최근 개발
17.15 머크앤코 주식회사
17.15.1 회사 스냅샷
17.15.2 수익 분석
17.15.3 제품 포트폴리오
17.15.4 최근 개발 사항
17.16 노비티움 파마
17.16.1 회사 스냅샷
17.16.2 제품 포트폴리오
17.16.3 최근 개발
17.17 테바제약공업주식회사
17.17.1 회사 스냅샷
17.17.2 수익 분석
17.17.3 제품 포트폴리오
17.17.4 최근 개발
17.18 ACCURE 치료학
17.18.1 회사 스냅샷
17.18.2 제품 포트폴리오
17.18.3 최근 개발
17.19 아코르다 테라퓨틱스 주식회사
17.19.1 회사 스냅샷
17.19.2 수익 분석
17.19.3 제품 포트폴리오
17.19.4 최근 개발
17.2 바이오젠 주식회사
17.20.1 회사 스냅샷
17.20.2 수익 분석
17.20.3 제품 포트폴리오
17.20.4 최근 개발
17.21 멀린크르도트 제약
17.21.1 회사 스냅샷
17.21.2 수익 분석
17.21.3 제품 포트폴리오
17.21.4 최근 개발
17.22 노베옴 바이오테라퓨틱스 주식회사
17.22.1 회사 스냅샷
17.22.2 제품 포트폴리오
17.22.3 최근 개발
17.23 사노피
17.23.1 회사 스냅샷
17.23.2 수익 분석
17.23.3 제품 포트폴리오
17.23.4 최근 개발 사항
18 설문지
19 관련 보고서
그림 목록
그림 1 미국 시신경염 시장: 세분화
그림 2 미국 시신경염 시장: 데이터 삼각 측량
그림 3 미국 시신경염 시장: DROC 분석
그림 4 미국 시신경염 시장: 글로벌 대 지역 시장 분석
그림 5 미국 시신경염 시장: 회사 연구 분석
그림 6 미국 시신경염 시장: 인터뷰 인구 통계
그림 7 미국 시신경염 시장: DBMR 시장 위치 그리드
그림 8 미국 시신경염 시장: 시장 최종 사용자 적용 범위 그리드
그림 9 미국 시신경염 시장: 공급업체 점유율 분석
그림 10 미국 시신경염 시장: 세분화
그림 11 눈 질환의 유병률 증가와 노인 인구의 증가는 2022년에서 2029년 예측 기간 동안 미국 시신경염 시장을 주도할 것으로 예상됩니다.
그림 12 코르티코스테로이드 세그먼트는 2022년과 2029년에 미국 시신경염 시장에서 가장 큰 점유율을 차지할 것으로 예상됩니다.
그림 13 미국 시신경염 시장의 동인, 제약, 기회 및 과제
그림 14 미국 시신경염 시장: 치료별, 2021
그림 15 미국 시신경염 시장: 치료별, 2022-2029년(백만 달러)
그림 16 미국 시신경염 시장: 치료별, CAGR(2022-2029)
그림 17 미국 시신경염 시장: 치료별, 수명선 곡선
그림 18 미국 시신경염 시장: 진단별, 2021
그림 19 미국 시신경염 시장: 진단 기준, 2022-2029년(백만 달러)
그림 20 미국 시신경염 시장: 진단, CAGR(2022-2029)별
그림 21 미국 시신경염 시장: 진단별, 생명선 곡선
그림 22 미국 시신경염 시장: 투여 경로별, 2021
그림 23 미국 시신경염 시장: 관리 경로별, 2022-2029년(백만 달러)
그림 24 미국 시신경염 시장: 투여 경로별, CAGR(2022-2029)
그림 25 미국 시신경염 시장: 투여 경로별, 생명선 곡선
그림 26 미국 시신경염 시장: 최종 사용자별, 2021년
그림 27 미국 시신경염 시장: 최종 사용자별, 2022-2029년(백만 달러)
그림 28 미국 시신경염 시장: 최종 사용자별, CAGR(2022-2029)
그림 29 미국 시신경염 시장: 최종 사용자별, 수명선 곡선
그림 30 미국 시신경염 시장: 유통 채널별, 2021
그림 31 미국 시신경염 시장: 유통 채널별, 2022-2029년(백만 달러)
그림 32 미국 시신경염 시장: 유통 채널별, CAGR(2022-2029)
그림 33 미국 시신경염 시장: 유통 채널별, 수명선 곡선
그림 34 미국 시신경염 시장: 회사 점유율 2021(%)
연구 방법론
데이터 수집 및 기준 연도 분석은 대규모 샘플 크기의 데이터 수집 모듈을 사용하여 수행됩니다. 이 단계에는 다양한 소스와 전략을 통해 시장 정보 또는 관련 데이터를 얻는 것이 포함됩니다. 여기에는 과거에 수집한 모든 데이터를 미리 검토하고 계획하는 것이 포함됩니다. 또한 다양한 정보 소스에서 발견되는 정보 불일치를 검토하는 것도 포함됩니다. 시장 데이터는 시장 통계 및 일관된 모델을 사용하여 분석하고 추정합니다. 또한 시장 점유율 분석 및 주요 추세 분석은 시장 보고서의 주요 성공 요인입니다. 자세한 내용은 분석가에게 전화를 요청하거나 문의 사항을 드롭하세요.
DBMR 연구팀에서 사용하는 주요 연구 방법론은 데이터 마이닝, 시장에 대한 데이터 변수의 영향 분석 및 주요(산업 전문가) 검증을 포함하는 데이터 삼각 측량입니다. 데이터 모델에는 공급업체 포지셔닝 그리드, 시장 타임라인 분석, 시장 개요 및 가이드, 회사 포지셔닝 그리드, 특허 분석, 가격 분석, 회사 시장 점유율 분석, 측정 기준, 글로벌 대 지역 및 공급업체 점유율 분석이 포함됩니다. 연구 방법론에 대해 자세히 알아보려면 문의를 통해 업계 전문가에게 문의하세요.
사용자 정의 가능
Data Bridge Market Research는 고급 형성 연구 분야의 선두 주자입니다. 저희는 기존 및 신규 고객에게 목표에 맞는 데이터와 분석을 제공하는 데 자부심을 느낍니다. 보고서는 추가 국가에 대한 시장 이해(국가 목록 요청), 임상 시험 결과 데이터, 문헌 검토, 재생 시장 및 제품 기반 분석을 포함하도록 사용자 정의할 수 있습니다. 기술 기반 분석에서 시장 포트폴리오 전략에 이르기까지 타겟 경쟁업체의 시장 분석을 분석할 수 있습니다. 귀하가 원하는 형식과 데이터 스타일로 필요한 만큼 많은 경쟁자를 추가할 수 있습니다. 저희 분석가 팀은 또한 원시 엑셀 파일 피벗 테이블(팩트북)로 데이터를 제공하거나 보고서에서 사용 가능한 데이터 세트에서 프레젠테이션을 만드는 데 도움을 줄 수 있습니다.

