Asia Pacific Acerola Extract Market
Tamanho do mercado em biliões de dólares
CAGR :
% 
 USD
1.47 Billion
USD
2.99 Billion
2025
2033
USD
1.47 Billion
USD
2.99 Billion
2025
2033
| 2026 –2033 | |
| USD 1.47 Billion | |
| USD 2.99 Billion | |
| % | |
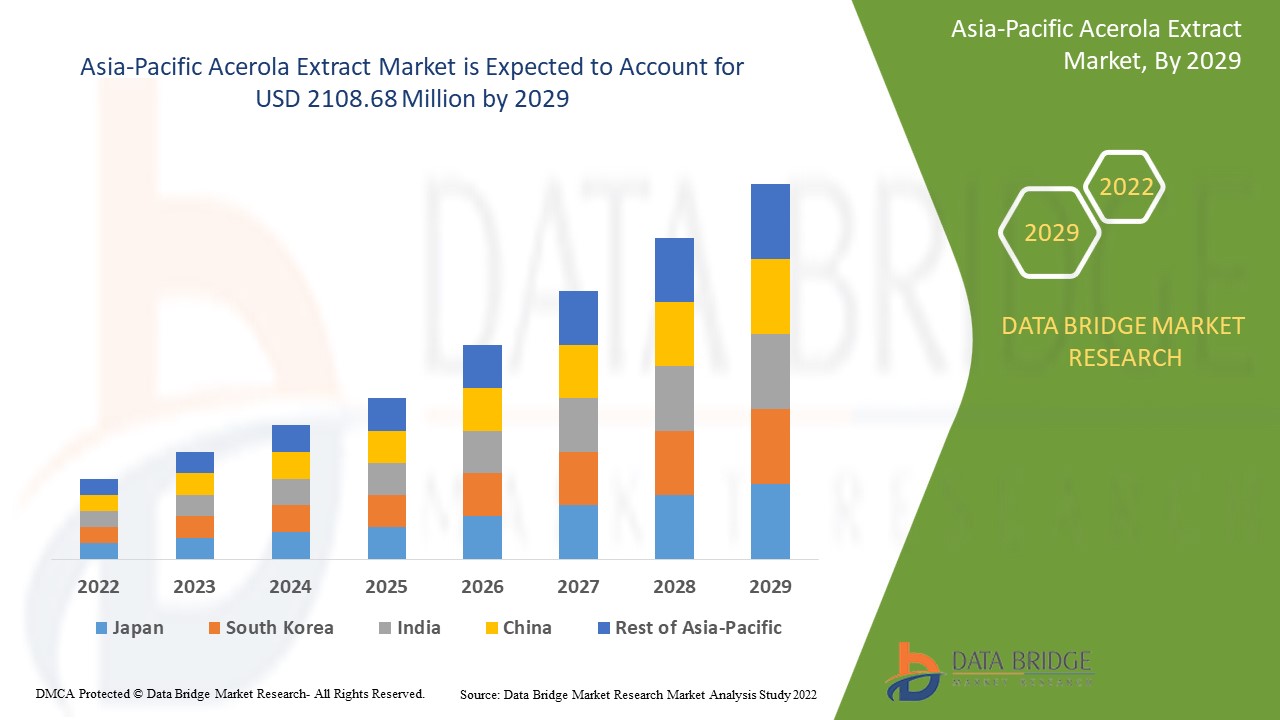
Asia-Pacific Acerola Extract By Form (Dry/Powder, Liquid/Paste), Type (Conventional, organic), Application (Dietary Supplements, Bakery Products, Beverages, Sports Nutrition, Convenience & Processed Products, Cosmetics & Personal Care, Dairy Products, Confectionery Products, Meat & Poultry Products, Granola & Breakfast Cereals), Distribution Channel (Direct and Indirect), – Industry Trends and Forecast to 2029
Asia-Pacific Acerola Extract Market Analysis and Size
Growing awareness of its medicinal and other commercial applications has resulted in its plantation spreading to other parts of the world. The tree is now found as far south as India in Asia Pacific and as far north as Texas in North America. Since the fruit is relatively easy to grow, the Asia-Pacific acerola extract market participants are able to keep manufacturing costs to a minimum. Due to its extremely shallow roots, the tree plantation only requires careful consideration of wind conditions. Cutting, seeding, and other common methods are used to propagate the tree.
Data Bridge Market Research analyses that the acerola extract market was valued at USD 1035.26 million in 2021 and is expected to reach the value of USD 2108.68 million by 2029, at a CAGR of 9.3% during the forecast period of 2022 to 2029.
Market Definition
Acerola is a tropical fruit-bearing small tree or shrub with the scientific name Malpighia emarginata. The tree belongs to the Malpighiaceae family. It is also known as wild crepe, acerola cherry, seriz, and West Indian cherry. The acerola tree is thought to have originated in South America. Its fruit resembles cherry but is much smaller in size. It contains Vitamin B1, Vitamin A, B3, and B2 as well as Vitamin C, which is extremely nutritious. The fruit is also well-known for its antioxidant properties, bioflavonoids, and carotenoids.
Asia-Pacific Acerola Extract Market Scope and Segmentation
|
Report Metric |
Details |
|
Forecast Period |
2022 to 2029 |
|
Base Year |
2021 |
|
Historic Years |
2020 (Customizable to 2014 - 2019) |
|
Quantitative Units |
Revenue in USD Million, Volumes in Units, Pricing in USD |
|
Segments Covered |
Form (Dry/Powder, Liquid/Paste), Type (Conventional, organic), Application (Dietary Supplements, Bakery Products, Beverages, Sports Nutrition, Convenience & Processed Products, Cosmetics & Personal Care, Dairy Products, Confectionery Products, Meat & Poultry Products, Granola & Breakfast Cereals), Distribution Channel (Direct and Indirect), |
|
Countries Covered |
China, Australia, Vietnam, Japan, India, New Zealand, Malaysia, South Korea, Singapore, Thailand, Indonesia, Philippines, Rest of Asia-Pacific |
|
Market Players Covered |
Kemin Industries, Inc. (U.S), Florida Food Products (U.S), Niagro - Nichirei do Brasil Ag. Ltda (Brazil), Naturex SA (France), Advanced Biotech (India), HANDARY S.A. (Belgium), Bösch Boden Spies (Germany), Optimally Organic (U.S), KINGHERBS (China), Vita Forte Inc. (U.S), The Green Labs LLC. (U.S), DuPONT (U.S), Foodchem International Corporation (China), Ti Tropicals (U.S), Duas Rodas Institucional (Brazil) |
|
Opportunities |
|
Acerola Extract Market Dynamics
Drivers
- Growing demand from the food and beverage industry due to its numerous benefits
Ascorbic acid is a water-soluble vitamin that is essential. Although most plants and animals can synthesise ascorbic acid but humans cannot. As a result, humans require it as a dietary supplement. Acerola is a good source of vitamin C. This property of acerola extract compels food and beverage manufacturers to include it in their products. Along with being a good source of ascorbic acid, acerola is one of the few fruits that contain a good amount of phenolic, flavonoids, anthocyanins, and carotenoids. All of these phytonutrients aid in the treatment of various diseases. For its high antioxidant capacity, acerola promotes the inactivation of free radicals, which are directly related to the ageing process and diseases such as cancer and cardiovascular disorders.
- Rising application from the cosmetic industry
Acerola extracts' widespread use in dietary supplements, beverages, and cosmetics for skin and hair care has accelerated their growth. Acerola has a standard vitamin composition of 17 percent, which is significantly higher than any other citrus fruit such as oranges and cherries. The demands for organic and natural-based vitamins, as well as the high demand for clean labelled products and consumer awareness, have fuelled market growth.
Opportunity
Government organisations have made aggressive efforts to regulate the production and use of environmentally friendly products, such as prohibiting the use of specific chemicals and establishing maximum consumption limits. The growing consumer concern about the health effects of synthetic colours drives the demand for clean label products. The rise in demand for natural ingredients, particularly those used to preserve meat products, can be viewed as an opportunity for acerola extract manufacturers to expand and grow.
Restraints
Adverse effects from excessive use of acerola-based vitamin C products, combined with high acerola-based merchandise costs, may impede business growth in the current forecast timeframe. Many factors influence multifunctional food industry trends, including regulatory structure, consumption patterns, and distribution network connections from farm to fork. This is expected to have an impact on the growth of the acerola extract market.
This acerola extract market report provides details of new recent developments, trade regulations, import-export analysis, production analysis, value chain optimization, market share, impact of domestic and localized market players, analyses opportunities in terms of emerging revenue pockets, changes in market regulations, strategic market growth analysis, market size, category market growths, application niches and dominance, product approvals, product launches, geographic expansions, technological innovations in the market. To gain more info on the acerola extract market contact Data Bridge Market Research for an Analyst Brief, our team will help you take an informed market decision to achieve market growth.
COVID-19 Impact on Acerola Extract Market
The COVID-19 has had an impact on economies and businesses such as the food and beverage industry in a number of countries due to detentions, travel restrictions, and company closures. The distribution network outage has indeed had an impact on acerola availability. The delay in the distribution network will affect the quality of acerola as well as the volume and cost of deliveries. As more people eat healthier foods, the demand for acerola extract has increased as a result of the outbreak. As a result, COVID had a significant impact on the acerola extract market.
Recent Development
- Duas Rodas Institucional was awarded the Innovation Award in February 2019, recognising the company for developing the most unique functional element in the Food Ingredients industry. The company manufactures various types of ingredients used in the food and beverage industry. As a result of receiving this award for innovation, the company's market standing has improved.
Asia-Pacific Acerola Extract Market Scope
The acerola extract market is segmented on the basis of application, form, type and distribution channel. The growth amongst these segments will help you analyze meagre growth segments in the industries and provide the users with a valuable market overview and market insights to help them make strategic decisions for identifying core market applications.
Type
- Conventional
- Organic
Application
- Dietary Supplements
- Bakery Products
- Beverages
- Sports Nutrition
- Convenience
- Processed Products
- Cosmetics
- Personal Care
- Dairy Products
- Confectionery Products
- Meat & Poultry Products
- Granola
- Breakfast Cereals
Form
- Dry/Powder
- Liquid/Paste
Distribution channel
- Direct
- Indirect
Acerola Extract Market Regional Analysis/Insights
The acerola extract market is analysed and market size insights and trends are provided by country, application, form, type and distribution channel as referenced above.
The countries covered in the acerola extract market report are China, Australia, Vietnam, Japan, India, New Zealand, Malaysia, South Korea, Singapore, Thailand, Indonesia, Philippines, Rest of Asia-Pacific.
The China market is leading the growth in the Asia-Pacific region due to the high consumption of acerola extract in beverages and dietary supplements due to the highest organic vitamin composition as compared to other citrus fruits and the high preference of flavours. China is the largest consumer of nutritional supplements, and Chinese companies have conducted extensive R&D and filed numerous patents related to Acerola powder, cherry, and concentrated, which has boosted the market growth of acerola.
The country section of the report also provides individual market impacting factors and changes in market regulation that impact the current and future trends of the market. Data points like down-stream and upstream value chain analysis, technical trends and porter's five forces analysis, case studies are some of the pointers used to forecast the market scenario for individual countries. Also, the presence and availability of Asia-Pacific brands and their challenges faced due to large or scarce competition from local and domestic brands, impact of domestic tariffs and trade routes are considered while providing forecast analysis of the country data.
Competitive Landscape and Acerola Extract Market Share Analysis
The acerola extract market competitive landscape provides details by competitor. Details included are company overview, company financials, revenue generated, market potential, investment in research and development, new market initiatives, Asia-Pacific presence, production sites and facilities, production capacities, company strengths and weaknesses, product launch, product width and breadth, application dominance. The above data points provided are only related to the companies' focus related to acerola extract market.
Some of the major players operating in the acerola extract market are:
- Kemin Industries, Inc. (U.S)
- Florida Food Products (U.S)
- Niagro - Nichirei do Brasil Ag. Ltd (Brazil)
- Naturex SA (France)
- Advanced Biotech (India)
- HANDARY S.A. (Belgium)
- Bösch Boden Spies (Germany)
- Optimally Organic (U.S)
- KINGHERBS (China)
- Vita Forte Inc. (U.S)
- The Green Labs LLC. (U.S)
- DuPONT (U.S)
- Foodchem International Corporation (China)
- iTi Tropicals (U.S)
- Duas Rodas Institucional (Brazil)
SKU-
Obtenha acesso online ao relatório sobre a primeira nuvem de inteligência de mercado do mundo

- Painel interativo de análise de dados
- Painel de análise da empresa para oportunidades de elevado potencial de crescimento
- Acesso de analista de pesquisa para personalização e customização. consultas
- Análise da concorrência com painel interativo
- Últimas notícias, atualizações e atualizações Análise de tendências
- Aproveite o poder da análise de benchmark para um rastreio abrangente da concorrência
Índice
1 INTRODUÇÃO
1.1 OBJETIVOS DO ESTUDO
1.2 DEFINIÇÃO DE MERCADO
1.3 VISÃO GERAL DO MERCADO DE EXTRATO DE ACEROLA DA ÁSIA-PACÍFICO
1.4 LIMITAÇÕES
1,5 MERCADOS COBERTOS
2 SEGMENTAÇÃO DE MERCADO
2.1 MERCADOS COBERTOS
2.2 ÂMBITO GEOGRÁFICO
2,3 ANOS CONSIDERADOS PARA O ESTUDO
2.4 MOEDA E PREÇOS
2.5 MODELO DE VALIDAÇÃO DE DADOS TRIPÉ DBMR
2.6 MODELAGEM MULTIVARIADA
2.7 GRADE DE COBERTURA DE APLICAÇÃO DE MERCADO
2.8 FORMULÁRIO DE CURVA DA LINHA DE VIDA
2.9 ENTREVISTAS PRINCIPAIS COM PRINCIPAIS LÍDERES DE OPINIÃO
2.1 GRADE DE POSIÇÃO DE MERCADO DBMR
2.11 ANÁLISE DA PARTICIPAÇÃO DO FORNECEDOR
2.12 FONTES SECUNDÁRIAS
2.13 PREMISSAS
3 RESUMO EXECUTIVO
4 INSIGHTS PREMIUM
4.1 ALEGAÇÕES DE SAÚDE
4.2 ANÁLISE DE INFORMAÇÕES NUTRICIONAIS DA ACEROLA CRUA POR PORÇÃO
4.3 ANÁLISE DE PATENTES
4.4 ANÁLISE DBMR
4.4.1 ANÁLISE DE PATENTES EM NÍVEL DE PAÍS
4.4.2 ANÁLISE BASEADA NA EMPRESA
4.5 CADEIA DE SUPRIMENTOS DO MERCADO DE EXTRATO DE ACEROLA
4.6 CADEIA DE VALOR DO EXTRATO DE ACEROLA
4.7 MERCADO DE EXTRATO DE ACEROLA DA ÁSIA-PACÍFICO: QUADRO REGULAMENTAR
5 IMPACTOS DA COVID-19
6 VISÃO GERAL DO MERCADO
6.1 MOTORISTAS
6.1.1 CONSUMO CRESCENTE DE PRODUTOS RICOS EM VITAMINAS
6.1.2 AUMENTO DA DEMANDA POR ALIMENTOS E BEBIDAS DE CONVENIÊNCIA
6.1.3 AUMENTO DA DEMANDA POR DERIVADOS DE FRUTAS NATURAIS E FRESCAS
6.1.4 CRESCENDO O CONHECIMENTO SOBRE AS VANTAGENS DOS PRODUTOS NUTRICIONAIS
6.2 RESTRIÇÕES
6.2.1 EFEITOS COLATERAIS ASSOCIADOS AO CONSUMO EXCESSIVO DE PRODUTOS À BASE DE ACEROLA COM VITAMINA C
6.2.2 ALTO CUSTO DOS PRODUTOS À BASE DE ACEROLA
6.3 OPORTUNIDADES
6.3.1 AUMENTO DO USO DA ACEROLA EM VÁRIOS SETORES
6.3.2 ACEITAÇÃO EM PAÍSES EM DESENVOLVIMENTO
6.4 DESAFIOS
6.4.1 DISPONIBILIDADE DE SUBSTITUTOS DE ACEROLA
6.4.2 REGULAMENTOS GOVERNAMENTAIS RIGOROSOS
7 MERCADO DE EXTRATO DE ACEROLA DA ÁSIA-PACÍFICO, POR FORMULÁRIO
7.1 VISÃO GERAL
7.2 SECO/PÓ
7.3 LÍQUIDO/ PASTA
8 MERCADO DE EXTRATO DE ACEROLA DA ÁSIA-PACÍFICO, POR TIPO
8.1 VISÃO GERAL
8.2 CONVENCIONAL
8.3 ORGÂNICO
9 MERCADO DE EXTRATO DE ACEROLA DA ÁSIA-PACÍFICO, POR APLICAÇÃO
9.1 VISÃO GERAL
9.2 SUPLEMENTOS ALIMENTARES
9.3 PRODUTOS DE PADARIA
9.3.1 BISCOITOS E COOKIES
9.3.2 BOLOS E PASTÉIS
9.3.3 PÃO
9.3.4 DONUTS E MUFFINS
9.3.5 OUTROS
9.4 BEBIDAS
9.4.1 NÃO ALCOÓLICO
9.4.1.1 SMOOTHIES
9.4.1.2 BEBIDAS ESPORTIVAS E ENERGÉTICAS
9.4.1.3 BEBIDAS GASEIFICADAS
9.4.1.4 CAFÉ E CHÁ RTD
9.4.1.5 OUTROS
9.4.2 ALCOÓLICO
9.5 NUTRIÇÃO ESPORTIVA
9.6 PRODUTOS DE CONVENIÊNCIA E PROCESSADOS
9.6.1 LANCHES
9.6.2 REFEIÇÕES RTD
9.6.3 DOCES, CONSERVAS E MARMELADAS
9.6.4 TEMPEROS E MOLHOS
9.6.5 SOPAS E MOLHOS
9.6.6 OUTROS
9.7 COSMÉTICOS E CUIDADOS PESSOAIS
9.7.1 CUIDADOS COM A PELE
9.7.2 CUIDADOS COM OS CABELOS
9.7.3 SABONETES E SABONETES LÍQUIDOS PARA O CORPO
9.7.4 OUTROS
9.8 PRODUTOS LATICÍNIOS
9.8.1 SORVETE
9.8.2 LEITE
9.8.3 SPREADS
9.8.4 IOGURTE
9.8.5 PUDINS
9.8.6 QUEIJO
9.8.7 OUTROS
9.9 PRODUTOS DE CONFEITARIA
9.9.1 CHOCOLATES
9.9.2 BALAS MACIAS E DURAS
9.9.3 RECHEIOS DE CREME
9.9.4 MAÇAPÃO
9.9.5 FONDANT
9.9.6 OUTROS
9.1 PRODUTOS DE CARNE E AVES
9.11 GRANOLA E CEREAIS DE CAFÉ DA MANHÃ
10 MERCADO DE EXTRATO DE ACEROLA DA ÁSIA-PACÍFICO, POR CANAL DE DISTRIBUIÇÃO
10.1 VISÃO GERAL
10.2 DIRETO
10.3 INDIRETO
10.3.1 VAREJO EM LOJA
10.3.1.1 ATACADISTAS
10.3.1.2 LOJAS DE CONVENIÊNCIA
10.3.1.3 SUPERMERCADOS/HIPERMERCADOS
10.3.1.4 MERCEARIAS
10.3.1.5 FARMÁCIAS
10.3.1.6 LOJAS ESPECIALIZADAS/ALIMENTOS SAUDÁVEIS ARMAZENADOS
10.3.2 VENDA A VAREJO NÃO LOJA
10.3.2.1 ONLINE
10.3.2.2 LOJAS DE CONVENIÊNCIA
11 MERCADO DE EXTRATO DE ACEROLA DA ÁSIA-PACÍFICO, POR REGIÃO
11.1 ÁSIA-PACÍFICO
11.1.1 CHINA
11.1.2 JAPÃO
11.1.3 ÍNDIA
11.1.4 COREIA DO SUL
11.1.5 AUSTRÁLIA
11.1.6 MALÁSIA
11.1.7 SINGAPURA
11.1.8 VIETNÃ
11.1.9 TAILÂNDIA
11.1.10 NOVA ZELÂNDIA
11.1.11 INDONÉSIA
11.1.12 FILIPINAS
11.1.13 RESTANTE DA ÁSIA-PACÍFICO
12 MERCADO DE EXTRATO DE ACEROLA DA ÁSIA-PACÍFICO, PAISAGEM DA EMPRESA
12.1 ANÁLISE DE AÇÕES DA EMPRESA: ÁSIA-PACÍFICO
13 ANÁLISE SWOT
14 PERFIL DA EMPRESA
14.1 NATUREX (UMA SUBSIDIÁRIA DA GIVAUDAN)
14.1.1 RESUMO DA EMPRESA
14.1.2 ANÁLISE DE RECEITA
14.1.3 ANÁLISE DAS AÇÕES DA EMPRESA
14.1.4 PORTFÓLIO DE PRODUTOS
14.1.5 DESENVOLVIMENTO RECENTE
14.2 DUAS RODAS INSTITUCIONAIS
14.2.1 RESUMO DA EMPRESA
14.2.2 ANÁLISE DAS AÇÕES DA EMPRESA
14.2.3 PORTFÓLIO DE PRODUTOS
14.2.4 DESENVOLVIMENTOS RECENTES
14.3 AMWAY
14.3.1 RESUMO DA EMPRESA
14.3.2 ANÁLISE DE RECEITA
14.3.3 ANÁLISE DE AÇÕES DA EMPRESA
14.3.4 PORTFÓLIO DE PRODUTOS
14.3.5 DESENVOLVIMENTO RECENTE
14.4 DUPONT
14.4.1 RESUMO DA EMPRESA
14.4.2 ANÁLISE DE RECEITA
14.4.3 ANÁLISE DAS AÇÕES DA EMPRESA
14.4.4 PORTFÓLIO DE PRODUTOS
14.4.5 DESENVOLVIMENTO RECENTE
14.5 DIANA GROUP (UMA SUBSIDIÁRIA DA SYMRISE)
14.5.1 RESUMO DA EMPRESA
14.5.2 ANÁLISE DE RECEITA
14.5.3 ANÁLISE DE AÇÕES DA EMPRESA
14.5.4 PORTFÓLIO DE PRODUTOS
14.5.5 DESENVOLVIMENTO RECENTE
14.6 NIAGRO - NICHIREI DO BRASIL AG. LTDA (UMA SUBSIDIÁRIA DA NICHIREI CORPORATION)
14.6.1 RESUMO DA EMPRESA
14.6.2 ANÁLISE DE RECEITA
14.6.3 PORTFÓLIO DE PRODUTOS
14.6.4 DESENVOLVIMENTO RECENTE
14.7 BIOTECNOLOGIA AVANÇADA
14.7.1 RESUMO DA EMPRESA
14.7.2 PORTFÓLIO DE PRODUTOS
14.7.3 DESENVOLVIMENTO RECENTE
14.8 FLORA DE ARARA-AZUL
14.8.1 RESUMO DA EMPRESA
14.8.2 PORTFÓLIO DE PRODUTOS
14.8.3 DESENVOLVIMENTO RECENTE
14.9 BÖSCH BODEN SPIES
14.9.1 RESUMO DA EMPRESA
14.9.2 PORTFÓLIO DE PRODUTOS
14.9.3 DESENVOLVIMENTO RECENTE
14.1 CORPORAÇÃO INTERNACIONAL FOODCHEM
14.10.1 RESUMO DA EMPRESA
14.10.2 PORTFÓLIO DE PRODUTOS
14.10.3 DESENVOLVIMENTO RECENTE
14.11 PRODUTOS ALIMENTARES DA FLÓRIDA
14.11.1 RESUMO DA EMPRESA
14.11.2 PORTFÓLIO DE PRODUTOS
14.11.3 DESENVOLVIMENTO RECENTE
14.12 HANDARY SA
14.12.1 RESUMO DA EMPRESA
14.12.2 PORTFÓLIO DE PRODUTOS
14.12.3 DESENVOLVIMENTO RECENTE
14.13 ITI TROPICALS
14.13.1 RESUMO DA EMPRESA
14.13.2 PORTFÓLIO DE PRODUTOS
14.13.3 DESENVOLVIMENTO RECENTE
14.14 ERVAS REIS
14.14.1 RESUMO DA EMPRESA
14.14.2 PORTFÓLIO DE PRODUTOS
14.14.3 DESENVOLVIMENTO RECENTE
14.15 KEMIN INDUSTRIES, INC.
14.15.1 RESUMO DA EMPRESA
14.15.2 PORTFÓLIO DE PRODUTOS
14.15.3 DESENVOLVIMENTO RECENTE
14.16 NP NUTRA
14.16.1 RESUMO DA EMPRESA
14.16.2 PORTFÓLIO DE PRODUTOS
14.16.3 DESENVOLVIMENTO RECENTE
14.17 OTIMAMENTE ORGÂNICO
14.17.1 RESUMO DA EMPRESA
14.17.2 PORTFÓLIO DE PRODUTOS
14.17.3 DESENVOLVIMENTO RECENTE
14.18 OS LABORATÓRIOS VERDES LLC
14.18.1 RESUMO DA EMPRESA
14.18.2 PORTFÓLIO DE PRODUTOS
14.18.3 DESENVOLVIMENTO RECENTE
14.19 VITA FORTE INC.
14.19.1 RESUMO DA EMPRESA
14.19.2 PORTFÓLIO DE PRODUTOS
14.19.3 DESENVOLVIMENTO RECENTE
14.2 ERVAS VITAIS
14.20.1 RESUMO DA EMPRESA
14.20.2 PORTFÓLIO DE PRODUTOS
14.20.3 DESENVOLVIMENTO RECENTE
15 QUESTIONÁRIO
16 RELATÓRIOS RELACIONADOS
Lista de Tabela
LISTA DE TABELAS
TABELA 1 VITAMINAS 45
TABELA 2 MINERAIS 45
TABELA 3 GORDURAS E ÁCIDOS GRAXOS 46
TABELA 4 PROTEÍNAS E AMINOÁCIDOS 46
TABELA 5 CARBOIDRATOS 47
TABELA 6 ESTERÓIS 47
TABELA 7 OUTROS 47
TABELA 8 MERCADO DE EXTRATO DE ACEROLA DA ÁSIA-PACÍFICO: PATENTES (2018-2020) 48
TABELA 9 MERCADO DE EXTRATO DE ACEROLA DA ÁSIA-PACÍFICO: QUADRO REGULAMENTAR 56
TABELA 10 PRINCIPAIS NUTRIENTES ENCONTRADOS NA ACEROLA 62
TABELA 11 CUSTO DOS PRODUTOS À BASE DE ACEROLA 69
TABELA 12 MERCADO DE EXTRATO DE ACEROLA NA ÁSIA-PACÍFICO, POR FORMA, 2018-2027 (US$ MILHÕES) 76
TABELA 13 ÁSIA-PACÍFICO/ MERCADO DE EXTRATO DE ACEROLA EM PÓ, POR REGIÃO, 2018-2027 (US$ MILHÕES) 77
TABELA 14 LÍQUIDO/PASTA DA ÁSIA-PACÍFICO NO MERCADO DE EXTRATO DE ACEROLA, POR REGIÃO, 2018-2027 (US$ MILHÕES) 78
TABELA 15 MERCADO DE EXTRATO DE ACEROLA DA ÁSIA-PACÍFICO, POR TIPO, 2018-2027 (US$ MILHÕES) 80
TABELA 16 ÁSIA-PACÍFICO CONVENCIONAL NO MERCADO DE EXTRATO DE ACEROLA, POR REGIÃO, 2018-2027 (US$ MILHÕES) 81
TABELA 17 MERCADO DE EXTRATO DE ACEROLA ORGÂNICO NA ÁSIA-PACÍFICO, POR REGIÃO, 2018-2027 (US$ MILHÕES) 82
TABELA 18 MERCADO DE EXTRATO DE ACEROLA NA ÁSIA-PACÍFICO, POR APLICAÇÃO, 2018-2027 (US$ MILHÕES) 85
TABELA 19 SUPLEMENTOS DIETÉTICOS DA ÁSIA-PACÍFICO NO MERCADO DE EXTRATO DE ACEROLA, POR REGIÃO, 2018-2027 (US$ MILHÕES) 86
TABELA 20 PRODUTOS DE FABRICAÇÃO DA ÁSIA-PACÍFICO NO MERCADO DE EXTRATO DE ACEROLA, POR REGIÃO, 2018-2027 (US$ MILHÕES) 87
TABELA 21 PRODUTOS DE FABRICAÇÃO DA ÁSIA-PACÍFICO NO MERCADO DE EXTRATO DE ACEROLA, POR APLICAÇÃO, 2018-2027 (US$ MILHÕES) 87
TABELA 22 MÉDIAS DA ÁSIA-PACÍFICO NO MERCADO DE EXTRATO DE ACEROLA, POR REGIÃO, 2018-2027 (US$ MILHÕES) 88
TABELA 23 MÉDIAS DA ÁSIA-PACÍFICO NO MERCADO DE EXTRATO DE ACEROLA, POR APLICAÇÃO, 2018-2027 (US$ MILHÕES) 88
TABELA 24 MERCADO DE EXTRATO DE ACEROLA NÃO ALCOÓLICO NA ÁSIA-PACÍFICO, POR APLICAÇÃO, 2018-2027 (US$ MILHÕES) 89
TABELA 25 NUTRIÇÃO ESPORTIVA NA ÁSIA-PACÍFICO NO MERCADO DE EXTRATO DE ACEROLA, POR REGIÃO, 2018-2027 (US$ MILHÕES) 90
TABELA 26 PRODUTOS DE CONVENIÊNCIA E PROCESSADOS DA ÁSIA-PACÍFICO NO MERCADO DE EXTRATO DE ACEROLA, POR REGIÃO, 2018-2027 (US$ MILHÕES) 91
TABELA 27 CONVENIÊNCIA DA ÁSIA-PACÍFICO E PROCESSADOS NO MERCADO DE EXTRATO DE ACEROLA, POR APLICAÇÃO, 2018-2027 (US$ MILHÕES) 91
TABELA 28 ÁSIA-PACÍFICO COSMÉTICOS E CUIDADOS PESSOAIS NO MERCADO DE EXTRATO DE ACEROLA, POR REGIÃO, 2018-2027 (US$ MILHÕES) 93
TABELA 29 ÁSIA-PACÍFICO COSMÉTICOS E CUIDADOS PESSOAIS NO MERCADO DE EXTRATO DE ACEROLA, POR APLICAÇÃO, 2018-2027 (US$ MILHÕES) 93
TABELA 30 PRODUTOS LÁCTEOS DA ÁSIA-PACÍFICO NO MERCADO DE EXTRATO DE ACEROLA, POR REGIÃO, 2018-2027 (US$ MILHÕES) 94
TABELA 31 PRODUTOS DA ÁSIA-PACÍFICO NO MERCADO DE EXTRATO DE ACEROLA, POR APLICAÇÃO, 2018-2027 (US$ MILHÕES) 95
TABELA 32 PRODUTOS DE CONFEITARIA DA ÁSIA-PACÍFICO NO MERCADO DE EXTRATO DE ACEROLA, POR REGIÃO, 2018-2027 (US$ MILHÕES) 96
TABELA 33 PRODUTOS DE CONFEITARIA DA ÁSIA-PACÍFICO NO MERCADO DE EXTRATO DE ACEROLA, POR APLICAÇÃO, 2018-2027 (US$ MILHÕES) 96
TABELA 34 PRODUTOS DE CARNE E AVES DA ÁSIA-PACÍFICO NO MERCADO DE EXTRATO DE ACEROLA, POR REGIÃO, 2018-2027 (US$ MILHÕES) 98
TABELA 35 GRANOLA E CEREAIS MATEMÁTICOS DA ÁSIA-PACÍFICO NO MERCADO DE EXTRATO DE ACEROLA, POR REGIÃO, 2018-2027 (US$ MILHÕES) 98
TABELA 36 MERCADO DE EXTRATO DE ACEROLA DA ÁSIA-PACÍFICO, POR CANAL DE DISTRIBUIÇÃO, 2018-2027 (US$ MILHÕES) 100
TABELA 37 ÁSIA-PACÍFICO DIRETO NO MERCADO DE EXTRATO DE ACEROLA, POR REGIÃO, 2018-2027 (US$ MILHÕES) 101
TABELA 38 ÁSIA-PACÍFICO INDIRETO NO MERCADO DE EXTRATO DE ACEROLA, POR REGIÃO, 2018-2027 (US$ MILHÕES) 102
TABELA 39 ÁSIA-PACÍFICO INDIRETO NO MERCADO DE EXTRATO DE ACEROLA, POR CANAL DE DISTRIBUIÇÃO, 2018-2027 (US$ MILHÕES) 102
TABELA 40 ÁSIA-PACÍFICOVAREJO EM LOJAS NO MERCADO DE EXTRATO DE ACEROLA, POR CANAL DE DISTRIBUIÇÃO, 2018-2027 (US$ MILHÕES) 102
TABELA 41 ÁSIA-PACÍFICO VAREJO NÃO LOJA NO MERCADO DE EXTRATO DE ACEROLA, POR CANAL DE DISTRIBUIÇÃO, 2018-2027 (US$ MILHÕES) 103
TABELA 42 MERCADO DE EXTRATO DE ACEROLA NA ÁSIA-PACÍFICO, POR PAÍS, 2018-2027 (US$ MILHÕES) 109
TABELA 43 MERCADO DE EXTRATO DE CEROLA NA ÁSIA-PACÍFICO, POR FORMA, 2018-2027 (US$ MILHÕES) 109
TABELA 44 MERCADO DE EXTRATO DE ACEROLA NA ÁSIA-PACÍFICO, POR TIPO, 2018-2027 (US$ MILHÕES) 109
TABELA 45 MERCADO DE EXTRATO DE ACEROLA DA ÁSIA-PACÍFICO, POR APLICAÇÃO, 2018-2027 (US$ MILHÕES) 110
TABELA 46 PRODUTOS DE PADARIA DA ÁSIA-PACÍFICO NO MERCADO DE EXTRATO DE ACEROLA, POR APLICAÇÃO, 2018-2027 (US$ MILHÕES) 110
TABELA 47 BEBIDAS DA ÁSIA-PACÍFICO NO MERCADO DE EXTRATO DE ACEROLA, POR APLICAÇÃO, 2018-2027 (US$ MILHÕES) 110
TABELA 48 MERCADO DE EXTRATO DE ACEROLA NÃO ALCOÓLICO DA ÁSIA-PACÍFICO, POR APLICAÇÃO, 2018-2027 (US$ MILHÕES) 111
TABELA 49 PRODUTOS DE CONVENIÊNCIA E PROCESSADOS DA ÁSIA-PACÍFICO NO MERCADO DE EXTRATO DE ACEROLA, POR APLICAÇÃO, 2018-2027 (US$ MILHÕES) 111
TABELA 50 PRODUTOS LÁCTEOS DA ÁSIA-PACÍFICO NO MERCADO DE EXTRATO DE ACEROLA, POR APLICAÇÃO, 2018-2027 (US$ MILHÕES) 111
TABELA 51 PRODUTOS DE CONFEITARIA DA ÁSIA-PACÍFICO NO MERCADO DE EXTRATO DE ACEROLA, POR APLICAÇÃO, 2018-2027 (US$ MILHÕES) 112
TABELA 52 COSMÉTICOS E CUIDADOS PESSOAIS NA ÁSIA-PACÍFICO NO MERCADO DE EXTRATO DE ACEROLA, POR APLICAÇÃO, 2018-2027 (US$ MILHÕES) 112
TABELA 53 MERCADO DE EXTRATO DE ACEROLA NA ÁSIA-PACÍFICO, POR CANAL DE DISTRIBUIÇÃO, 2018-2027 (US$ MILHÕES) 112
TABELA 54 INDIRETO DA ÁSIA-PACÍFICO NO MERCADO DE EXTRATO DE ACEROLA, POR CANAL DE DISTRIBUIÇÃO, 2018-2027 (US$ MILHÕES) 112
TABELA 55 VAREJO EM LOJAS DA ÁSIA-PACÍFICO NO MERCADO DE EXTRATO DE ACEROLA, POR CANAL DE DISTRIBUIÇÃO, 2018-2027 (US$ MILHÕES) 113
TABELA 56 VAREJO NÃO LOJA NA ÁSIA-PACÍFICO NO MERCADO DE EXTRATO DE ACEROLA, POR CANAL DE DISTRIBUIÇÃO, 2018-2027 (US$ MILHÕES) 113
TABELA 57 MERCADO DE EXTRATO DE ACEROLA DA CHINA, POR FORMA, 2018-2027 (US$ MILHÕES) 114
TABELA 58 MERCADO DE EXTRATO DE ACEROLA DA CHINA, POR TIPO, 2018-2027 (US$ MILHÕES) 114
TABELA 59 MERCADO DE EXTRATO DE ACEROLA DA CHINA, POR APLICAÇÃO, 2018-2027 (US$ MILHÕES) 114
TABELA 60 PRODUTOS DE PADARIA DA CHINA NO MERCADO DE EXTRATO DE ACEROLA, POR APLICAÇÃO, 2018-2027 (US$ MILHÕES) 115
TABELA 61 BEBIDAS DA CHINA NO MERCADO DE EXTRATO DE ACEROLA, POR APLICAÇÃO, 2018-2027 (US$ MILHÕES) 115
TABELA 62 MERCADO DE EXTRATO DE ACEROLA NÃO ALCOÓLICO DA CHINA, POR APLICAÇÃO, 2018-2027 (US$ MILHÕES) 115
TABELA 63 PRODUTOS DE CONVENIÊNCIA E PROCESSADOS DA CHINA NO MERCADO DE EXTRATO DE ACEROLA, POR APLICAÇÃO, 2018-2027 (US$ MILHÕES) 116
TABELA 64 PRODUTOS LÁCTEOS DA CHINA NO MERCADO DE EXTRATO DE ACEROLA, POR APLICAÇÃO, 2018-2027 (US$ MILHÕES) 116
TABELA 65 PRODUTOS DE CONFEITARIA DA CHINA NO MERCADO DE EXTRATO DE ACEROLA, POR APLICAÇÃO, 2018-2027 (US$ MILHÕES) 116
TABELA 66 COSMÉTICOS E CUIDADOS PESSOAIS DA CHINA NO MERCADO DE EXTRATO DE ACEROLA, POR APLICAÇÃO, 2018-2027 (US$ MILHÕES) 117
TABELA 67 MERCADO DE EXTRATO DE ACEROLA DA CHINA, POR CANAL DE DISTRIBUIÇÃO, 2018-2027 (US$ MILHÕES) 117
TABELA 68 CHINA INDIRETA NO MERCADO DE EXTRATO DE ACEROLA, POR CANAL DE DISTRIBUIÇÃO, 2018-2027 (US$ MILHÕES) 117
TABELA 69 VAREJO EM LOJAS DA CHINA NO MERCADO DE EXTRATO DE ACEROLA, POR CANAL DE DISTRIBUIÇÃO, 2018-2027 (US$ MILHÕES) 117
TABELA 70 VAREJO NÃO LOJA DA CHINA NO MERCADO DE EXTRATO DE ACEROLA, POR CANAL DE DISTRIBUIÇÃO, 2018-2027 (US$ MILHÕES) 118
TABELA 71 MERCADO DE EXTRATO DE JAPANACEROLA, POR FORMA, 2018-2027 (US$ MILHÕES) 119
TABELA 72 MERCADO DE EXTRATO DE ACEROLA NO JAPÃO, POR TIPO, 2018-2027 (US$ MILHÕES) 119
TABELA 73 MERCADO DE EXTRATO DE ACEROLA NO JAPÃO, POR APLICAÇÃO, 2018-2027 (US$ MILHÕES) 119
TABELA 74 PRODUTOS DE PADARIA DO JAPÃO NO MERCADO DE EXTRATO DE ACEROLA, POR APLICAÇÃO, 2018-2027 (US$ MILHÕES) 120
TABELA 75 BEBIDAS DO JAPÃO NO MERCADO DE EXTRATO DE ACEROLA, POR APLICAÇÃO, 2018-2027 (US$ MILHÕES) 120
TABELA 76 MERCADO DE EXTRATO DE ACEROLA NÃO ALCOÓLICO NO JAPÃO, POR APLICAÇÃO, 2018-2027 (US$ MILHÕES) 120
TABELA 77 PRODUTOS DE CONVENIÊNCIA E PROCESSADOS DO JAPÃO NO MERCADO DE EXTRATO DE ACEROLA, POR APLICAÇÃO, 2018-2027 (US$ MILHÕES) 121
TABELA 78 PRODUTOS LÁCTEOS DO JAPÃO NO MERCADO DE EXTRATO DE ACEROLA, POR APLICAÇÃO, 2018-2027 (US$ MILHÕES) 121
TABELA 79 PRODUTOS DE CONFEITARIA DO JAPÃO NO MERCADO DE EXTRATO DE ACEROLA, POR APLICAÇÃO, 2018-2027 (US$ MILHÕES) 121
TABELA 80 COSMÉTICOS E CUIDADOS PESSOAIS NO JAPÃO NO MERCADO DE EXTRATO DE ACEROLA, POR APLICAÇÃO, 2018-2027 (US$ MILHÕES) 122
TABELA 81 MERCADO DE EXTRATO DE ACEROLA NO JAPÃO, POR CANAL DE DISTRIBUIÇÃO, 2018-2027 (US$ MILHÕES) 122
TABELA 82 JAPÃO INDIRETO NO MERCADO DE EXTRATO DE ACEROLA, POR CANAL DE DISTRIBUIÇÃO, 2018-2027 (US$ MILHÕES) 122
TABELA 83 VAREJO EM LOJAS NO JAPÃO NO MERCADO DE EXTRATO DE ACEROLA, POR CANAL DE DISTRIBUIÇÃO, 2018-2027 (US$ MILHÕES) 122
TABELA 84 VENDAS NO VAREJO NÃO LOJA NO JAPÃO NO MERCADO DE EXTRATO DE ACEROLA, POR CANAL DE DISTRIBUIÇÃO, 2018-2027 (US$ MILHÕES) 123
TABELA 85 MERCADO DE EXTRATO DE CEROLA DA ÍNDIA, POR FORMA, 2018-2027 (US$ MILHÕES) 124
TABELA 86 MERCADO DE EXTRATO DE ACEROLA DA ÍNDIA, POR TIPO, 2018-2027 (US$ MILHÕES) 124
TABELA 87 MERCADO DE EXTRATO DE ACEROLA DA ÍNDIA, POR APLICAÇÃO, 2018-2027 (US$ MILHÕES) 124
TABELA 88 PRODUTOS DE PADARIA DA ÍNDIA NO MERCADO DE EXTRATO DE ACEROLA, POR APLICAÇÃO, 2018-2027 (US$ MILHÕES) 125
TABELA 89 BEBIDAS DA ÍNDIA NO MERCADO DE EXTRATO DE ACEROLA, POR APLICAÇÃO, 2018-2027 (US$ MILHÕES) 125
TABELA 90 MERCADO DE EXTRATO DE ACEROLA NÃO ALCOÓLICO DA ÍNDIA, POR APLICAÇÃO, 2018-2027 (US$ MILHÕES) 125
TABELA 91 PRODUTOS DE CONVENIÊNCIA E PROCESSADOS DA ÍNDIA NO MERCADO DE EXTRATO DE ACEROLA, POR APLICAÇÃO, 2018-2027 (US$ MILHÕES) 126
TABELA 92 PRODUTOS LÁCTEOS DA ÍNDIA NO MERCADO DE EXTRATO DE ACEROLA, POR APLICAÇÃO, 2018-2027 (US$ MILHÕES) 126
TABELA 93 PRODUTOS DE CONFEITARIA DA ÍNDIA NO MERCADO DE EXTRATO DE ACEROLA, POR APLICAÇÃO, 2018-2027 (US$ MILHÕES) 126
TABELA 94 COSMÉTICOS E CUIDADOS PESSOAIS DA ÍNDIA NO MERCADO DE EXTRATO DE ACEROLA, POR APLICAÇÃO, 2018-2027 (US$ MILHÕES) 127
TABELA 95 MERCADO DE EXTRATO DE ACEROLA DA ÍNDIA, POR CANAL DE DISTRIBUIÇÃO, 2018-2027 (US$ MILHÕES) 127
TABELA 96 ÍNDIA INDIRETO NO MERCADO DE EXTRATO DE ACEROLA, POR CANAL DE DISTRIBUIÇÃO, 2018-2027 (US$ MILHÕES) 127
TABELA 97 INDIA VAREJO EM LOJAS NO MERCADO DE EXTRATO DE ACEROLA, POR CANAL DE DISTRIBUIÇÃO, 2018-2027 (US$ MILHÕES) 127
TABELA 98 INDIA VAREJO NÃO LOJA NO MERCADO DE EXTRATO DE ACEROLA, POR CANAL DE DISTRIBUIÇÃO, 2018-2027 (US$ MILHÕES) 128
TABELA 99 MERCADO DE EXTRATO DE CEROLA DA COREIA DO SUL, POR FORMA, 2018-2027 (US$ MILHÕES) 129
TABELA 100 MERCADO DE EXTRATO DE ACEROLA DA COREIA DO SUL, POR TIPO, 2018-2027 (US$ MILHÕES) 129
TABELA 101 MERCADO DE EXTRATO DE ACEROLA DA COREIA DO SUL, POR APLICAÇÃO, 2018-2027 (US$ MILHÕES) 129
TABELA 102 PRODUTOS DE PADARIA DA COREIA DO SUL NO MERCADO DE EXTRATO DE ACEROLA, POR APLICAÇÃO, 2018-2027 (US$ MILHÕES) 130
TABELA 103 BEBIDAS DA COREIA DO SUL NO MERCADO DE EXTRATO DE ACEROLA, POR APLICAÇÃO, 2018-2027 (US$ MILHÕES) 130
TABELA 104 MERCADO DE EXTRATO DE ACEROLA NÃO ALCOÓLICO DA COREIA DO SUL, POR APLICAÇÃO, 2018-2027 (US$ MILHÕES) 130
TABELA 105 PRODUTOS DE CONVENIÊNCIA E PROCESSADOS DA COREIA DO SUL NO MERCADO DE EXTRATO DE ACEROLA, POR APLICAÇÃO, 2018-2027 (US$ MILHÕES) 131
TABELA 106 PRODUTOS LÁCTEOS DA COREIA DO SUL NO MERCADO DE EXTRATO DE ACEROLA, POR APLICAÇÃO, 2018-2027 (US$ MILHÕES) 131
TABELA 107 PRODUTOS DE CONFEITARIA DA COREIA DO SUL NO MERCADO DE EXTRATO DE ACEROLA, POR APLICAÇÃO, 2018-2027 (US$ MILHÕES) 131
TABELA 108 COSMÉTICOS E CUIDADOS PESSOAIS DA COREIA DO SUL NO MERCADO DE EXTRATO DE ACEROLA, POR APLICAÇÃO, 2018-2027 (US$ MILHÕES) 132
TABELA 109 MERCADO DE EXTRATO DE ACEROLA DA COREIA DO SUL, POR CANAL DE DISTRIBUIÇÃO, 2018-2027 (US$ MILHÕES) 132
TABELA 110 COREIA DO SUL INDIRETA NO MERCADO DE EXTRATO DE ACEROLA, POR CANAL DE DISTRIBUIÇÃO, 2018-2027 (US$ MILHÕES) 132
TABELA 111 VAREJO EM LOJAS DA COREIA DO SUL NO MERCADO DE EXTRATO DE ACEROLA, POR CANAL DE DISTRIBUIÇÃO, 2018-2027 (US$ MILHÕES) 132
TABELA 112 VENDAS NO VAREJO NÃO LOJA NA COREIA DO SUL NO MERCADO DE EXTRATO DE ACEROLA, POR CANAL DE DISTRIBUIÇÃO, 2018-2027 (US$ MILHÕES) 133
TABELA 113 AUSTRÁLIA MERCADO DE EXTRATO DE ACEROLA, POR FORMA, 2018-2027 (US$ MILHÕES) 134
TABELA 114 MERCADO DE EXTRATO DE ACEROLA NA AUSTRÁLIA, POR TIPO, 2018-2027 (US$ MILHÕES) 134
TABELA 115 MERCADO DE EXTRATO DE ACEROLA DA AUSTRÁLIA, POR APLICAÇÃO, 2018-2027 (US$ MILHÕES) 134
TABELA 116 PRODUTOS DE PADARIA DA AUSTRÁLIA NO MERCADO DE EXTRATO DE ACEROLA, POR APLICAÇÃO, 2018-2027 (US$ MILHÕES) 135
TABELA 117 BEBIDAS DA AUSTRÁLIA NO MERCADO DE EXTRATO DE ACEROLA, POR APLICAÇÃO, 2018-2027 (US$ MILHÕES) 135
TABELA 118 MERCADO DE EXTRATO DE ACEROLA NÃO ALCOÓLICO NA AUSTRÁLIA, POR APLICAÇÃO, 2018-2027 (US$ MILHÕES) 135
TABELA 119 PRODUTOS DE CONVENIÊNCIA E PROCESSADOS DA AUSTRÁLIA NO MERCADO DE EXTRATO DE ACEROLA, POR APLICAÇÃO, 2018-2027 (US$ MILHÕES) 136
TABELA 120 PRODUTOS LÁCTEOS DA AUSTRÁLIA NO MERCADO DE EXTRATO DE ACEROLA, POR APLICAÇÃO, 2018-2027 (US$ MILHÕES) 136
TABELA 121 PRODUTOS DE CONFEITARIA DA AUSTRÁLIA NO MERCADO DE EXTRATO DE ACEROLA, POR APLICAÇÃO, 2018-2027 (US$ MILHÕES) 136
TABELA 122 COSMÉTICOS E CUIDADOS PESSOAIS NA AUSTRÁLIA NO MERCADO DE EXTRATO DE ACEROLA, POR APLICAÇÃO, 2018-2027 (US$ MILHÕES) 137
TABELA 123 MERCADO DE EXTRATO DE ACEROLA NA AUSTRÁLIA, POR CANAL DE DISTRIBUIÇÃO, 2018-2027 (US$ MILHÕES) 137
TABELA 124 AUSTRÁLIA INDIRETA NO MERCADO DE EXTRATO DE ACEROLA, POR CANAL DE DISTRIBUIÇÃO, 2018-2027 (US$ MILHÕES) 137
TABELA 125 VAREJO EM LOJAS DA AUSTRÁLIA NO MERCADO DE EXTRATO DE ACEROLA, POR CANAL DE DISTRIBUIÇÃO, 2018-2027 (US$ MILHÕES) 137
TABELA 126 AUSTRÁLIA VAREJO NÃO LOJA NO MERCADO DE EXTRATO DE ACEROLA, POR CANAL DE DISTRIBUIÇÃO, 2018-2027 (US$ MILHÕES) 138
TABELA 127 MERCADO DE EXTRATO DE ACEROLA DA MALÁSIA, POR FORMA, 2018-2027 (US$ MILHÕES) 139
TABELA 128 MERCADO DE EXTRATO DE ACEROLA DA MALÁSIA, POR TIPO, 2018-2027 (US$ MILHÕES) 139
TABELA 129 MERCADO DE EXTRATO DE ACEROLA DA MALÁSIA, POR APLICAÇÃO, 2018-2027 (US$ MILHÕES) 139
TABELA 130 PRODUTOS DE PADARIA DA MALÁSIA NO MERCADO DE EXTRATO DE ACEROLA, POR APLICAÇÃO, 2018-2027 (US$ MILHÕES) 140
TABELA 131 BEBIDAS DA MALÁSIA NO MERCADO DE EXTRATO DE ACEROLA, POR APLICAÇÃO, 2018-2027 (US$ MILHÕES) 140
TABELA 132 MERCADO DE EXTRATO DE ACEROLA NÃO ALCOÓLICO DA MALÁSIA, POR APLICAÇÃO, 2018-2027 (US$ MILHÕES) 140
TABELA 133 PRODUTOS DE CONVENIÊNCIA E PROCESSADOS DA MALÁSIA NO MERCADO DE EXTRATO DE ACEROLA, POR APLICAÇÃO, 2018-2027 (US$ MILHÕES) 141
TABELA 134 PRODUTOS LÁCTEOS DA MALÁSIA NO MERCADO DE EXTRATO DE ACEROLA, POR APLICAÇÃO, 2018-2027 (US$ MILHÕES) 141
TABELA 135 PRODUTOS DE CONFEITARIA DA MALÁSIA NO MERCADO DE EXTRATO DE ACEROLA, POR APLICAÇÃO, 2018-2027 (US$ MILHÕES) 141
TABELA 136 COSMÉTICOS E CUIDADOS PESSOAIS DA MALÁSIA NO MERCADO DE EXTRATO DE ACEROLA, POR APLICAÇÃO, 2018-2027 (US$ MILHÕES) 142
TABELA 137 MERCADO DE EXTRATO DE ACEROLA DA MALÁSIA, POR CANAL DE DISTRIBUIÇÃO, 2018-2027 (US$ MILHÕES) 142
TABELA 138 MALÁSIA INDIRETO NO MERCADO DE EXTRATO DE ACEROLA, POR CANAL DE DISTRIBUIÇÃO, 2018-2027 (US$ MILHÕES) 142
TABELA 139 MALÁSIA VAREJO EM LOJAS NO MERCADO DE EXTRATO DE ACEROLA, POR CANAL DE DISTRIBUIÇÃO, 2018-2027 (US$ MILHÕES) 142
TABELA 140 MALÁSIA VENDA NO VAREJO NÃO LOJA NO MERCADO DE EXTRATO DE ACEROLA, POR CANAL DE DISTRIBUIÇÃO, 2018-2027 (US$ MILHÕES) 143
TABELA 141 MERCADO DE EXTRATO DE CEROLA DE SINGAPURA, POR FORMA, 2018-2027 (US$ MILHÕES) 144
TABELA 142 MERCADO DE EXTRATO DE ACEROLA DE SINGAPURA, POR TIPO, 2018-2027 (US$ MILHÕES) 144
TABELA 143 MERCADO DE EXTRATO DE ACEROLA DE SINGAPURA, POR APLICAÇÃO, 2018-2027 (US$ MILHÕES) 144
TABELA 144 PRODUTOS DE PADARIA DE SINGAPURA NO MERCADO DE EXTRATO DE ACEROLA, POR APLICAÇÃO, 2018-2027 (US$ MILHÕES) 145
TABELA 145 BEBIDAS DE SINGAPURA NO MERCADO DE EXTRATO DE ACEROLA, POR APLICAÇÃO, 2018-2027 (US$ MILHÕES) 145
TABELA 146 MERCADO DE EXTRATO DE ACEROLA NÃO ALCOÓLICO DE SINGAPURA, POR APLICAÇÃO, 2018-2027 (US$ MILHÕES) 145
TABELA 147 PRODUTOS DE CONVENIÊNCIA E PROCESSADOS DE SINGAPURA NO MERCADO DE EXTRATO DE ACEROLA, POR APLICAÇÃO, 2018-2027 (US$ MILHÕES) 146
TABELA 148 PRODUTOS LÁCTEOS DE SINGAPURA NO MERCADO DE EXTRATO DE ACEROLA, POR APLICAÇÃO, 2018-2027 (US$ MILHÕES) 146
TABELA 149 PRODUTOS DE CONFEITARIA DE SINGAPURA NO MERCADO DE EXTRATO DE ACEROLA, POR APLICAÇÃO, 2018-2027 (US$ MILHÕES) 146
TABELA 150 COSMÉTICOS E CUIDADOS PESSOAIS DE SINGAPURA NO MERCADO DE EXTRATO DE ACEROLA, POR APLICAÇÃO, 2018-2027 (US$ MILHÕES) 147
TABELA 151 MERCADO DE EXTRATO DE ACEROLA DE SINGAPURA, POR CANAL DE DISTRIBUIÇÃO, 2018-2027 (US$ MILHÕES) 147
TABELA 152 SINGAPURA INDIRETO NO MERCADO DE EXTRATO DE ACEROLA, POR CANAL DE DISTRIBUIÇÃO, 2018-2027 (US$ MILHÕES) 147
TABELA 153 VENDAS VAREJADAS EM LOJAS DE SINGAPURA NO MERCADO DE EXTRATO DE ACEROLA, POR CANAL DE DISTRIBUIÇÃO, 2018-2027 (US$ MILHÕES) 147
TABELA 154 VENDAS NO VAREJO NÃO LOJA EM SINGAPURA NO MERCADO DE EXTRATO DE ACEROLA, POR CANAL DE DISTRIBUIÇÃO, 2018-2027 (US$ MILHÕES) 148
TABELA 155 MERCADO DE EXTRATO DE MACEROLA DO VIETNÃ, POR FORMA, 2018-2027 (US$ MILHÕES) 149
TABELA 156 MERCADO DE EXTRATO DE ACEROLA DO VIETNÃ, POR TIPO, 2018-2027 (US$ MILHÕES) 149
TABELA 157 MERCADO DE EXTRATO DE ACEROLA DO VIETNÃ, POR APLICAÇÃO, 2018-2027 (US$ MILHÕES) 149
TABELA 158 PRODUTOS DE PADARIA DO VIETNÃ NO MERCADO DE EXTRATO DE ACEROLA, POR APLICAÇÃO, 2018-2027 (US$ MILHÕES) 150
TABELA 159 BEBIDAS DO VIETNÃ NO MERCADO DE EXTRATO DE ACEROLA, POR APLICAÇÃO, 2018-2027 (US$ MILHÕES) 150
TABELA 160 VIETNÃ NÃO ALCOÓLICO NO MERCADO DE EXTRATO DE ACEROLA, POR APLICAÇÃO, 2018-2027 (US$ MILHÕES) 150
TABELA 161 PRODUTOS DE CONVENIÊNCIA E PROCESSADOS DO VIETNÃ NO MERCADO DE EXTRATO DE ACEROLA, POR APLICAÇÃO, 2018-2027 (US$ MILHÕES) 151
TABELA 162 PRODUTOS LÁCTEOS DO VIETNÃ NO MERCADO DE EXTRATO DE ACEROLA, POR APLICAÇÃO, 2018-2027 (US$ MILHÕES) 151
TABELA 163 PRODUTOS DE CONFEITARIA DO VIETNÃ NO MERCADO DE EXTRATO DE ACEROLA, POR APLICAÇÃO, 2018-2027 (US$ MILHÕES) 151
TABELA 164 COSMÉTICOS E CUIDADOS PESSOAIS DO VIETNÃ NO MERCADO DE EXTRATO DE ACEROLA, POR APLICAÇÃO, 2018-2027 (US$ MILHÕES) 152
TABELA 165 MERCADO DE EXTRATO DE ACEROLA DO VIETNÃ, POR CANAL DE DISTRIBUIÇÃO, 2018-2027 (US$ MILHÕES) 152
TABELA 166 VIETNÃ INDIRETO NO MERCADO DE EXTRATO DE ACEROLA, POR CANAL DE DISTRIBUIÇÃO, 2018-2027 (US$ MILHÕES) 152
TABELA 167 VAREJO EM LOJAS NO VIETNÃ NO MERCADO DE EXTRATO DE ACEROLA, POR CANAL DE DISTRIBUIÇÃO, 2018-2027 (US$ MILHÕES) 152
TABELA 168 VAREJO NÃO LOJA NO VIETNÃ NO MERCADO DE EXTRATO DE ACEROLA, POR CANAL DE DISTRIBUIÇÃO, 2018-2027 (US$ MILHÕES) 153
TABELA 169 MERCADO DE EXTRATO DE ACEROLA DA TAILÂNDIA, POR FORMA, 2018-2027 (US$ MILHÕES) 154
TABELA 170 MERCADO DE EXTRATO DE ACEROLA DA TAILÂNDIA, POR TIPO, 2018-2027 (US$ MILHÕES) 154
TABELA 171 MERCADO DE EXTRATO DE ACEROLA DA TAILÂNDIA, POR APLICAÇÃO, 2018-2027 (US$ MILHÕES) 154
TABELA 172 PRODUTOS DE PADARIA DA TAILÂNDIA NO MERCADO DE EXTRATO DE ACEROLA, POR APLICAÇÃO, 2018-2027 (US$ MILHÕES) 155
TABELA 173 BEBIDAS DA TAILÂNDIA NO MERCADO DE EXTRATO DE ACEROLA, POR APLICAÇÃO, 2018-2027 (US$ MILHÕES) 155
TABELA 174 MERCADO DE EXTRATO DE ACEROLA NÃO ALCOÓLICO DA TAILÂNDIA, POR APLICAÇÃO, 2018-2027 (US$ MILHÕES) 155
TABELA 175 PRODUTOS DE CONVENIÊNCIA E PROCESSADOS DA TAILÂNDIA NO MERCADO DE EXTRATO DE ACEROLA, POR APLICAÇÃO, 2018-2027 (US$ MILHÕES) 156
TABELA 176 PRODUTOS LÁCTEOS DA TAILÂNDIA NO MERCADO DE EXTRATO DE ACEROLA, POR APLICAÇÃO, 2018-2027 (US$ MILHÕES) 156
TABELA 177 PRODUTOS DE CONFEITARIA DA TAILÂNDIA NO MERCADO DE EXTRATO DE ACEROLA, POR APLICAÇÃO, 2018-2027 (US$ MILHÕES) 156
TABELA 178 COSMÉTICOS E CUIDADOS PESSOAIS DA TAILÂNDIA NO MERCADO DE EXTRATO DE ACEROLA, POR APLICAÇÃO, 2018-2027 (US$ MILHÕES) 157
TABELA 179 MERCADO DE EXTRATO DE ACEROLA DA TAILÂNDIA, POR CANAL DE DISTRIBUIÇÃO, 2018-2027 (US$ MILHÕES) 157
TABELA 180 TAILÂNDIA INDIRETO NO MERCADO DE EXTRATO DE ACEROLA, POR CANAL DE DISTRIBUIÇÃO, 2018-2027 (US$ MILHÕES) 157
TABLE 181 THAILAND STORE-BASED RETAILING IN ACEROLA EXTRACT MARKET, BY DISTRIBUTION CHANNEL, 2018-2027 (USD MILLION) 157
TABLE 182 THAILAND NON-STORE RETAILING IN ACEROLA EXTRACT MARKET, BY DISTRIBUTION CHANNEL, 2018-2027 (USD MILLION)) 158
TABLE 183 NEW ZEALANDACEROLA EXTRACT MARKET, BY FORM, 2018-2027 (USD MILLION) 159
TABLE 184 NEW ZEALAND ACEROLA EXTRACT MARKET, BY TYPE, 2018-2027 (USD MILLION) 159
TABLE 185 NEW ZEALAND ACEROLA EXTRACT MARKET, BY APPLICATION, 2018-2027 (USD MILLION) 159
TABLE 186 NEW ZEALAND BAKERY PRODUCTS IN ACEROLA EXTRACT MARKET, BY APPLICATION, 2018-2027 (USD MILLION) 160
TABLE 187 NEW ZEALAND BEVERAGES IN ACEROLA EXTRACT MARKET, BY APPLICATION, 2018-2027 (USD MILLION) 160
TABLE 188 NEW ZEALAND NON-ALCOHOLIC IN ACEROLA EXTRACT MARKET, BY APPLICATION, 2018-2027 (USD MILLION) 160
TABLE 189 NEW ZEALAND CONVENIENCE & PROCESSED PRODUCTS IN ACEROLA EXTRACT MARKET, BY APPLICATION, 2018-2027 (USD MILLION) 161
TABLE 190 NEW ZEALAND DAIRY PRODUCTS IN ACEROLA EXTRACT MARKET, BY APPLICATION, 2018-2027 (USD MILLION) 161
TABLE 191 NEW ZEALAND CONFECTIONERY PRODUCTS IN ACEROLA EXTRACT MARKET, BY APPLICATION, 2018-2027 (USD MILLION) 161
TABLE 192 NEW ZEALAND COSMETICS & PERSONAL CARE IN ACEROLA EXTRACT MARKET, BY APPLICATION, 2018-2027 (USD MILLION) 162
TABLE 193 NEW ZEALAND ACEROLA EXTRACT MARKET, BY DISTRIBUTION CHANNEL, 2018-2027 (USD MILLION) 162
TABLE 194 NEW ZEALAND INDIRECT IN ACEROLA EXTRACT MARKET, BY DISTRIBUTION CHANNEL, 2018-2027 (USD MILLION) 162
TABLE 195 NEW ZEALAND STORE-BASED RETAILING IN ACEROLA EXTRACT MARKET, BY DISTRIBUTION CHANNEL, 2018-2027 (USD MILLION) 162
TABLE 196 NEW ZEALAND NON-STORE RETAILING IN ACEROLA EXTRACT MARKET, BY DISTRIBUTION CHANNEL, 2018-2027 (USD MILLION)) 163
TABLE 197 INDONESIAACEROLA EXTRACT MARKET, BY FORM, 2018-2027 (USD MILLION) 164
TABLE 198 INDONESIA ACEROLA EXTRACT MARKET, BY TYPE, 2018-2027 (USD MILLION) 164
TABLE 199 INDONESIA ACEROLA EXTRACT MARKET, BY APPLICATION, 2018-2027 (USD MILLION) 164
TABLE 200 INDONESIA BAKERY PRODUCTS IN ACEROLA EXTRACT MARKET, BY APPLICATION, 2018-2027 (USD MILLION) 165
TABLE 201 INDONESIA BEVERAGES IN ACEROLA EXTRACT MARKET, BY APPLICATION, 2018-2027 (USD MILLION) 165
TABLE 202 INDONESIA NON-ALCOHOLIC IN ACEROLA EXTRACT MARKET, BY APPLICATION, 2018-2027 (USD MILLION) 165
TABLE 203 INDONESIA CONVENIENCE & PROCESSED PRODUCTS IN ACEROLA EXTRACT MARKET, BY APPLICATION, 2018-2027 (USD MILLION) 166
TABLE 204 INDONESIA DAIRY PRODUCTS IN ACEROLA EXTRACT MARKET, BY APPLICATION, 2018-2027 (USD MILLION) 166
TABLE 205 INDONESIA CONFECTIONERY PRODUCTS IN ACEROLA EXTRACT MARKET, BY APPLICATION, 2018-2027 (USD MILLION) 166
TABLE 206 INDONESIA COSMETICS & PERSONAL CARE IN ACEROLA EXTRACT MARKET, BY APPLICATION, 2018-2027 (USD MILLION) 167
TABLE 207 INDONESIA ACEROLA EXTRACT MARKET, BY DISTRIBUTION CHANNEL, 2018-2027 (USD MILLION) 167
TABLE 208 INDONESIA INDIRECT IN ACEROLA EXTRACT MARKET, BY DISTRIBUTION CHANNEL, 2018-2027 (USD MILLION) 167
TABELA 209 VAREJO EM LOJAS DA INDONÉSIA NO MERCADO DE EXTRATO DE ACEROLA, POR CANAL DE DISTRIBUIÇÃO, 2018-2027 (US$ MILHÕES) 167
TABELA 210 VAREJO NÃO LOJA NA INDONÉSIA NO MERCADO DE EXTRATO DE ACEROLA, POR CANAL DE DISTRIBUIÇÃO, 2018-2027 (US$ MILHÕES) 168
TABELA 211 MERCADO FILIPINO DE EXTRATO DE SACEROLA, POR FORMA, 2018-2027 (US$ MILHÕES) 169
TABELA 212 MERCADO DE EXTRATO DE ACEROLA NAS FILIPINAS, POR TIPO, 2018-2027 (US$ MILHÕES) 169
TABELA 213 MERCADO DE EXTRATO DE ACEROLA NAS FILIPINAS, POR APLICAÇÃO, 2018-2027 (US$ MILHÕES) 169
TABELA 214 PRODUTOS DE PADARIA DAS FILIPINAS NO MERCADO DE EXTRATO DE ACEROLA, POR APLICAÇÃO, 2018-2027 (US$ MILHÕES) 170
TABELA 215 BEBIDAS DAS FILIPINAS NO MERCADO DE EXTRATO DE ACEROLA, POR APLICAÇÃO, 2018-2027 (US$ MILHÕES) 170
TABELA 216 FILIPINAS NÃO ALCOÓLICAS NO MERCADO DE EXTRATO DE ACEROLA, POR APLICAÇÃO, 2018-2027 (US$ MILHÕES) 170
TABELA 217 PRODUTOS DE CONVENIÊNCIA E PROCESSADOS NAS FILIPINAS NO MERCADO DE EXTRATO DE ACEROLA, POR APLICAÇÃO, 2018-2027 (US$ MILHÕES) 171
TABELA 218 PRODUTOS LÁCTEOS DAS FILIPINAS NO MERCADO DE EXTRATO DE ACEROLA, POR APLICAÇÃO, 2018-2027 (US$ MILHÕES) 171
TABELA 219 PRODUTOS DE CONFEITARIA DAS FILIPINAS NO MERCADO DE EXTRATO DE ACEROLA, POR APLICAÇÃO, 2018-2027 (US$ MILHÕES) 171
TABELA 220 FILIPINAS COSMÉTICOS E CUIDADOS PESSOAIS NO MERCADO DE EXTRATO DE ACEROLA, POR APLICAÇÃO, 2018-2027 (US$ MILHÕES) 172
TABELA 221 MERCADO DE EXTRATO DE ACEROLA NAS FILIPINAS, POR CANAL DE DISTRIBUIÇÃO, 2018-2027 (US$ MILHÕES) 172
TABELA 222 FILIPINAS INDIRETAMENTE NO MERCADO DE EXTRATO DE ACEROLA, POR CANAL DE DISTRIBUIÇÃO, 2018-2027 (US$ MILHÕES) 172
TABELA 223 FILIPINAS VAREJO EM LOJAS NO MERCADO DE EXTRATO DE ACEROLA, POR CANAL DE DISTRIBUIÇÃO, 2018-2027 (US$ MILHÕES) 172
TABELA 224 FILIPINAS VAREJO NÃO LOJA NO MERCADO DE EXTRATO DE ACEROLA, POR CANAL DE DISTRIBUIÇÃO, 2018-2027 (US$ MILHÕES) 173
TABELA 225 RESTO DA ÁSIA-PACÍFICO MERCADO DE EXTRATO DE CEROLA, POR FORMA, 2018-2027 (US$ MILHÕES) 174
Lista de Figura
LISTA DE FIGURAS
FIGURA 1 MERCADO DE EXTRATO DE ACEROLA DA ÁSIA-PACÍFICO: SEGMENTAÇÃO 27
FIGURA 2 MERCADO DE EXTRATO DE ACEROLA DA ÁSIA-PACÍFICO: TRIANGULAÇÃO DE DADOS 30
FIGURA 3 MERCADO DE EXTRATO DE ACEROLA DA ÁSIA-PACÍFICO: ANÁLISE DROC 31
FIGURA 4 MERCADO DE EXTRATO DE ACEROLA DA ÁSIA-PACÍFICO: ANÁLISE DE MERCADO DA ÁSIA-PACÍFICO VS MERCADO REGIONAL 32
FIGURA 5 MERCADO DE EXTRATO DE ACEROLA DA ÁSIA-PACÍFICO: ANÁLISE DE PESQUISA DA EMPRESA 32
FIGURA 6 MERCADO DE EXTRATO DE ACEROLA DA ÁSIA-PACÍFICO: GRADE DE COBERTURA DE APLICAÇÃO DE MERCADO 33
FIGURA 7 MERCADO DE EXTRATO DE ACEROLA DA ÁSIA-PACÍFICO: ENTREVISTA DEMOGRAFIA 35
FIGURA 8 MERCADO DE EXTRATO DE ACEROLA DA ÁSIA-PACÍFICO: POSIÇÃO DE MERCADO DBMR GRADE 36
FIGURA 9 MERCADO DE EXTRATO DE ACEROLA DA ÁSIA-PACÍFICO: ANÁLISE DA PARTICIPAÇÃO DE FORNECEDORES 37
FIGURA 10 MERCADO DE EXTRATO DE ACEROLA DA ÁSIA-PACÍFICO: SEGMENTAÇÃO 40
FIGURA 11 A CRESCENTE DEMANDA POR ALIMENTOS E BEBIDAS DE CONVENIÊNCIA E O CRESCENTE CONSUMO DE PRODUTOS RICO EM VITAMINAS DEVEM IMPULSIONAR O MERCADO DE EXTRATO DE ACEROLA DA ÁSIA-PACÍFICO NO PERÍODO PREVISTO DE 2020 A 2027 41
FIGURA 12 O SEGMENTO SECO/PÓ DEVE SER REPRESENTADO PELA MAIOR PARCIALIDADE DO MERCADO DE EXTRATO DE ACEROLA DA ÁSIA-PACÍFICO EM 2020 E 2027 41
FIGURA 13 A ÁSIA-PACÍFICO É O MERCADO DE CRESCIMENTO MAIS RÁPIDO PARA OS DESENVOLVEDORES DE EXTRATO DE ACEROLA NO PERÍODO DE PREVISÃO DE 2020 A 2027 42
FIGURA 14 TEOR DE VITAMINA C DAS FRUTAS (MG/100G) 43
FIGURA 15 PATENTE REGISTRADA PARA ACEROLA, POR PAÍS 51
FIGURA 16 ANO DE REGISTRO DA PATENTE (1998-2020) 51
FIGURA 17 MOTIVADORES, RESTRIÇÕES, OPORTUNIDADES E DESAFIOS DO MERCADO DE EXTRATO DE ACEROLA DA ÁSIA-PACÍFICO 61
FIGURA 18 CONSUMO DE ALIMENTOS NOS EUA 63
FIGURA 19 CONSUMO DE ALIMENTOS NO MUNDO 64
FIGURA 20 CONSUMO DE ALIMENTOS NA CHINA 64
FIGURA 21 CONSUMO DE ALIMENTOS NA ÍNDIA 65
FIGURA 22 INFORMAÇÃO NUTRICIONAL DA ACEROLA CRUA 67
FIGURA 23 CALORIAS POR FONTE 67
FIGURA 24 IMPORTAÇÃO DE SUCOS DE SUPERFRUTAS POR PAÍSES 70
FIGURA 25 EXPORTAÇÃO DE SUCOS DE SUPERFRUTAS POR PAÍSES 71
FIGURA 26 IMPORTAÇÃO DE SUCOS DE SUPERFRUTAS 72
FIGURA 27 MERCADO DE EXTRATO DE ACEROLA DA ÁSIA-PACÍFICO: POR FORMA, 2019 76
FIGURA 28 MERCADO DE EXTRATO DE ACEROLA NA ÁSIA-PACÍFICO: POR TIPO, 2019 80
FIGURA 29 MERCADO DE EXTRATO DE ACEROLA DA ÁSIA-PACÍFICO: POR APLICAÇÃO, 2019 84
FIGURA 30 MERCADO DE EXTRATO DE ACEROLA NA ÁSIA-PACÍFICO: POR CANAL DE DISTRIBUIÇÃO, 2019 100
FIGURA 31 MERCADO DE EXTRATO DE ACEROLA DA ÁSIA-PACÍFICO: INSTANTÂNEO (2019) 105
FIGURA 32 MERCADO DE EXTRATO DE ACEROLA NA ÁSIA-PACÍFICO: POR PAÍS (2019) 107
FIGURA 33 MERCADO DE EXTRATO DE ACEROLA NA ÁSIA-PACÍFICO: POR PAÍS (2020 e 2027) 107
FIGURA 34 MERCADO DE EXTRATO DE ACEROLA NA ÁSIA-PACÍFICO: POR PAÍS (2019 e 2027) 108
FIGURA 35 MERCADO DE EXTRATO DE ACEROLA NA ÁSIA-PACÍFICO: POR FORMA (2020-2027) 108
FIGURA 36 MERCADO DE EXTRATO DE ACEROLA DA ÁSIA-PACÍFICO: PARTICIPAÇÃO DA EMPRESA EM 2019 (%) 175
Metodologia de Investigação
A recolha de dados e a análise do ano base são feitas através de módulos de recolha de dados com amostras grandes. A etapa inclui a obtenção de informações de mercado ou dados relacionados através de diversas fontes e estratégias. Inclui examinar e planear antecipadamente todos os dados adquiridos no passado. Da mesma forma, envolve o exame de inconsistências de informação observadas em diferentes fontes de informação. Os dados de mercado são analisados e estimados utilizando modelos estatísticos e coerentes de mercado. Além disso, a análise da quota de mercado e a análise das principais tendências são os principais fatores de sucesso no relatório de mercado. Para saber mais, solicite uma chamada de analista ou abra a sua consulta.
A principal metodologia de investigação utilizada pela equipa de investigação do DBMR é a triangulação de dados que envolve a mineração de dados, a análise do impacto das variáveis de dados no mercado e a validação primária (especialista do setor). Os modelos de dados incluem grelha de posicionamento de fornecedores, análise da linha de tempo do mercado, visão geral e guia de mercado, grelha de posicionamento da empresa, análise de patentes, análise de preços, análise da quota de mercado da empresa, normas de medição, análise global versus regional e de participação dos fornecedores. Para saber mais sobre a metodologia de investigação, faça uma consulta para falar com os nossos especialistas do setor.
Personalização disponível
A Data Bridge Market Research é líder em investigação formativa avançada. Orgulhamo-nos de servir os nossos clientes novos e existentes com dados e análises que correspondem e atendem aos seus objetivos. O relatório pode ser personalizado para incluir análise de tendências de preços de marcas-alvo, compreensão do mercado para países adicionais (solicite a lista de países), dados de resultados de ensaios clínicos, revisão de literatura, mercado remodelado e análise de base de produtos . A análise de mercado dos concorrentes-alvo pode ser analisada desde análises baseadas em tecnologia até estratégias de carteira de mercado. Podemos adicionar quantos concorrentes necessitar de dados no formato e estilo de dados que procura. A nossa equipa de analistas também pode fornecer dados em tabelas dinâmicas de ficheiros Excel em bruto (livro de factos) ou pode ajudá-lo a criar apresentações a partir dos conjuntos de dados disponíveis no relatório.