Asia-Pacific E-Commerce Market, By Product Type (Business to Consumer (B2C), Business to Business (B2B), Customer to Business (C2B) and Customer to Customer (C2C)), Platform (Open-Source, Software as a Service (SaaS) and Headless Commerce), Hosting Environment (Cloud and On-Premise), Category (Goods and Services), Distribution Channel (Pure Clicks and Brick -and Click or Click-To-Brick), Purchased Device (Mobile Devices, Computer and Tablets), Payment Solutions (Third-Party Payments, Credit Cards, Debit Cards, Bank Transfers, Cash Vouchers, Cash on Delivery and Others) – Industry Trends and Forecast to 2030.
Asia-Pacific E-Commerce Market Analysis and Size
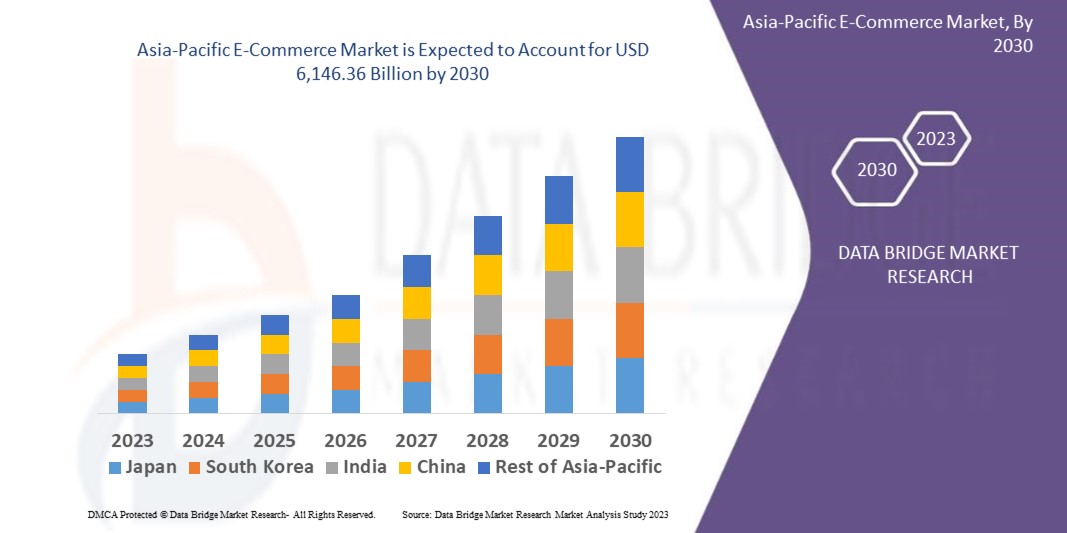
E-commerce is the purchase and sale of goods or services over the internet and the transfer of money and data to complete the transaction. It is also referred to as e-commerce or internet commerce. E-commerce is frequently used to refer to the online sale of physical products, but it can also refer to any commercial transaction that is facilitated by the internet. Asia-Pacific is being highly penetrated by the adoption of the usage of mobile e-wallets and rising preferences for online shopping.
Data Bridge Market Research analyses that the Asia-Pacific e-commerce market was valued at USD 2,980.11 billion in 2022 and is expected to reach USD 6,146.36 billion by 2030, registering a CAGR of 19.20% during the forecast period of 2023-2030. In addition to the market insights such as market value, growth rate, market segments, geographical coverage, market players, and market scenario, the market report curated by the Data Bridge Market Research team includes in-depth expert analysis, import/export analysis, pricing analysis, production consumption analysis, and consumer behavior.
Asia-Pacific E-Commerce Market Scope and Segmentation
|
Report Metric |
Details |
|
Forecast Period |
2023 to 2030 |
|
Base Year |
2022 |
|
Historic Years |
2021 (Customizable to 2015- 2020) |
|
Quantitative Units |
Revenue in USD Million, Volumes in Units, Pricing in USD |
|
Segments Covered |
Product Type (Business to Consumer (B2C), Business to Business (B2B), Customer to Business (C2B) and Customer to Customer (C2C)), Platform (Open-Source, Software as a Service (SaaS) and Headless Commerce), Hosting Environment (Cloud and On-Premise), Category (Goods and Services), Distribution Channel (Pure Clicks and Brick -and Click or Click-To-Brick), Purchased Device (Mobile Devices, Computer and Tablet), Payment Solutions (Third-Party Payments, Credit Cards, Debit Cards, Bank Transfers, Cash Vouchers, Cash on Delivery and Others) |
|
Countries Covered |
China, South Korea, Japan, India, Australia, Indonesia, Thailand, Malaysia, Singapore, Philippines, and Rest of Asia-Pacific |
|
Market Players Covered |
Jingdong JD (A Subsidiary of JD.com, Inc.) (China), Alibaba Group Holding Limited (China), Rakuten Group, Inc. (Japan), Supermarket Grocery Supplies Pvt Ltd (India), Grofers India Pvt. Ltd. (India), Shopify Inc. (Canada), Booking Holdings (U.S.), Amazon, Inc. (U.S.), eBay Inc. (U.S.), Walmart Inc. (U.S.), JB Hi-Fi (Australia), Woolworths Group Limited (Australia), Home Depot Product Authority, LLC (U.S.), OTTO GROUP (Germany), Brainbees Solutions Pvt Ltd (Firstcry.com) (India), ASOS plc (U.K.), Groupon, Inc. (U.S.), Costco Wholesale Corporation (U.S.), Vipshop Holdings Limited (China), Snapdeal Private Limited (India), and Carousel (Singapore) among others |
|
Market Opportunities |
|
Market Definition
The Asia-Pacific e-commerce market refers to the online buying and selling activities conducted in the Asia-Pacific region, which includes countries such as China, India, Japan, Australia, and various Southeast Asian nations. It encompasses the electronic trade of goods and services through digital platforms, websites, and mobile application. This market represents the growing trend of consumers in the Asia-Pacific region turning to online platforms for their shopping needs, facilitated by increasing internet penetration, smartphone adoption, and the availability of secure payment gateways. The Asia-Pacific e-commerce market offers businesses opportunities to reach a large and diverse consumer base, engage in cross-border trade, leverage mobile commerce, and benefit from the region's supportive government policies and technological advancements.
Asia-Pacific E-Commerce Market Dynamics
This section deals with understanding the market drivers, advantages, opportunities, restraints and challenges. All of this is discussed in detail as below:
Drivers
- Rapid adoption of digital technologies and increasing internet penetration
With the large and growing population, countries in the Asia-Pacific region are witnessing a significant rise in the number of Internet users, creating a vast customer base for online retailers. Additionally, the increasing use of smartphone and the availability of affordable Internet services have further facilitated the accessibility and convenience of online shopping, driving the demand for e-commerce platforms. Moreover, the Asia-Pacific region is witnessing a rising middle-class population with higher disposable incomes, leading to an increased propensity to spend on online purchases. These factors, combined with the growing popularity of social media platforms and the adoption of mobile payment systems, are propelling the Asia-Pacific e-commerce market to new heights, are all critical factors driving the market.
- Growing popularity of the concept of smart homes and incorporating advanced technologies
The Asia-Pacific region has experienced a significant surge in mobile device usage, with a large portion of consumers accessing the internet and engaging in online shopping through their smartphones. This widespread adoption of mobile commerce has driven the growth of the e-commerce market. Furthermore, advances in technology and increased e-commerce operations in the manufacturing of electronic goods in the smart home appliance industry have increased demand for white goods. This, in turn, is expected to boost market growth.
Opportunities
- Rapidly expanding consumer base is bolster the market’s growth
The Asia-Pacific e-commerce market presents a significant opportunity for businesses to tap into a vast and rapidly expanding consumer base. With a region that encompasses diverse and populous countries such as China, India, and Southeast Asian nations, there is immense potential for growth and revenue generation. Furthermore, the increasing digital connectivity, rising middle-class population, and changing consumer preferences towards online shopping create a favorable environment for businesses to establish their presence in the e-commerce sector. By leveraging innovative technologies, adapting to local market dynamics, and offering personalized experiences, companies can capitalize on the burgeoning demand for online retail, fostering long-term customer loyalty and market success in the Asia-Pacific region. This, in turn, is anticipated to provide an opportunity for the market.
Restraints/Challenges
- High costs to derail the growth
The cost of running a modern model refrigerator is significantly dependent on the amount of power consumed per day. The amount of power utilised is affected by factors such as refrigerator features and size. However, a significant amount of the cost is determined by the service and maintenance costs that must be incurred for the new type of refrigerator. Furthermore, the fridges must be cleaned from top to bottom once a week using just the cleaner recommended by the equipment manufacturer. This affects demand for white products and is expected to slow market growth.
- Payment systems and security concerns
In certain countries, the prevalence of cash-based transactions and the lack of secure online payment systems can discourage consumers from engaging in E-commerce. Concerns over fraud, data breaches, and cybercrime also impact consumer trust in online transactions and are expected to impede market demand for these goods.
This market report provides details of new recent developments, trade regulations, import-export analysis, production analysis, value chain optimization, market share, the impact of domestic and localized market players, analyses opportunities in terms of emerging revenue pockets, changes in market regulations, strategic market growth analysis, market size, category market growths, application niches and dominance, product approvals, product launches, geographic expansions, technological innovations in the market. To gain more info on the Asia-Pacific e-commerce market, contact Data Bridge Market Research for an Analyst Brief, our team will help you make an informed market decision to achieve market growth.
Recent Developments
- In June 15, 2023, Jingdong JD, a subsidiary of JD.com, Inc. and one of China's largest E-commerce companies, has made a significant move in the healthcare sector by launching JD Health International. This new initiative aims to expand its cross-border healthcare E-commerce services and cater to the increasing global demand for quality healthcare products.
- In 2020, Whirlpool released the latest 3D Cool Inverter Air Conditioners range on March 17. This equipment is built with 3D Cool Technology, which delivers 60% faster cooling throughout the 50-degree summer season.
Asia-Pacific E-Commerce Market Scope
The Asia-Pacific e-commerce market is segmented into seven notable segments based on product type, platform, hosting environment, category, distribution channel, purchased device, and payment solutions. The growth amongst these segments will help you analyze meager growth segments in the industries and provide the users with a valuable market overview and market insights to help them make strategic decisions for identifying core market applications.
Product Type
- Business to Consumer (B2C)
- Business to Business (B2B)
- Customer to Business (C2B) and Customer to Customer (C2C))
Platform
- Open-Source
- Software as a Service (SaaS) and Headless Commerce
Hosting Environment
- Cloud
- On-Premise
Category
- Goods
- Services
Distribution Channel
- Pure Clicks
- Brick -and Click or Click-To-Brick
Purchased Device
- Mobile Devices
- Computer
- Tablets
Payment Solutions
- Third-Party Payments
- Credit Cards
- Debit Cards
- Bank Transfers
- Cash Vouchers
- Cash on Delivery
- Others
Asia-Pacific E-Commerce Market Regional Analysis/Insights
The Asia-Pacific e-commerce market is analyzed and market size information is provided by the country, product type, platform, hosting environment, category, distribution channel, purchased device, and payment solutions.
The countries covered in this market report are China, South Korea, Japan, India, Australia, Indonesia, Thailand, Malaysia, Singapore, Philippines, and rest of Asia-Pacific.
China is dominating the e-commerce sector in Asia-Pacific due to the large population in the region, which has influenced the lifestyle and pattern of the consumer and the growing number of e-commerce platforms such as apps and websites. South Korea holds the second position owing to rising technological advancement with the wide adoption of smartphones in the region driving the e-commerce platform at a significant rate. Japan holds the third position owing to LINE, a messaging app with its payment system being the dominant social media platform in Japan along with the strong local presence of e-commerce websites.
The country section of the report also provides individual market impacting factors and changes in market regulation that impact the current and future trends of the market. Data points like down-stream and upstream value chain analysis, technical trends and porter's five forces analysis, case studies are some of the pointers used to forecast the market scenario for individual countries. Also, the presence and availability of global brands and their challenges faced due to large or scarce competition from local and domestic brands, impact of domestic tariffs and trade routes are considered while providing forecast analysis of the country data.
Competitive Landscape and Asia-Pacific E-Commerce Market Share Analysis
The Asia-Pacific e-commerce market competitive landscape provides details by competitor. Details included are company overview, company financials, revenue generated, market potential, investment in research and development, new market initiatives, global presence, production sites and facilities, production capacities, company strengths and weaknesses, product launch, product width and breadth, and application dominance. The above data points provided are only related to the companies' focus related to market.
Some of the major players operating in the Asia-Pacific e-commerce market are:
- Jingdong JD (A Subsidiary of JD.com, Inc.) (China)
- Alibaba Group Holding Limited (China)
- Rakuten Group, Inc. (Japan)
- Supermarket Grocery Supplies Pvt Ltd (India)
- Grofers India Pvt. Ltd. (India)
- Shopify Inc. (Canada)
- Booking Holdings (U.S.)
- Amazon, Inc. (U.S.)
- eBay Inc. (U.S.)
- Walmart Inc. (U.S.)
- JB Hi-Fi (Australia)
- Woolworths Group Limited (Australia)
- Home Depot Product Authority, LLC (U.S.)
- OTTO GROUP (Germany)
- Brainbees Solutions Pvt Ltd (Firstcry.com) (India)
- ASOS plc (U.K.)
- Groupon, Inc. (U.K.)
- Costco Wholesale Corporation (U.S.)
- Vipshop Holdings Limited (China)
- Snapdeal Private Limited (India)
- Carousel (Singapore)
SKU-
Obtenha acesso online ao relatório sobre a primeira nuvem de inteligência de mercado do mundo

- Painel interativo de análise de dados
- Painel de análise da empresa para oportunidades de elevado potencial de crescimento
- Acesso de analista de pesquisa para personalização e customização. consultas
- Análise da concorrência com painel interativo
- Últimas notícias, atualizações e atualizações Análise de tendências
- Aproveite o poder da análise de benchmark para um rastreio abrangente da concorrência
Índice
- INTRODUÇÃO
- OBJETIVOS DO ESTUDO
- DEFINIÇÃO DE MERCADO
- VISÃO GERAL DO MERCADO DE COMÉRCIO ELETRÔNICO DA ÁSIA-PACÍFICO
- MOEDA E PREÇOS
- LIMITAÇÕES
- MERCADOS COBERTOS
- SEGMENTAÇÃO DE MERCADO
- MERCADOS COBERTOS
- ÂMBITO GEOGRÁFICO
- ANOS CONSIDERADOS PARA O ESTUDO
- MODELO DE VALIDAÇÃO DE DADOS TRIPÉ DBMR
- ENTREVISTAS PRINCIPAIS COM PRINCIPAIS LÍDERES DE OPINIÃO
- GRADE DE POSIÇÃO DE MERCADO DBMR
- ANÁLISE DE PARTICIPAÇÃO DO FORNECEDOR
- MODELAGEM MULTIVARIADA
- CURVA DO TIPO DE PRODUTO
- FONTES SECUNDÁRIAS
- SUPOSIÇÕES
- SUMÁRIO EXECUTIVO
- INSIGHTS PREMIUM
- ANÁLISE DO COMPORTAMENTO DO CLIENTE
- MUDANÇAS DE COMPORTAMENTO DEVIDO À COVID-19
- COMPORTAMENTO DE NAVEGAÇÃO
- SESSÃO MÉDIA
- PÁGINAS POR VISITA, FLUXO DE TRÁFEGO E FIDELIDADE DO CLIENTE
- ESPECIFICAÇÕES E USOS DO COMÉRCIO ELETRÔNICO POR PAÍS
- CHINA
- ÍNDIA
- INDONÉSIA
- JAPÃO
- MALÁSIA
- CINGAPURA
- CORÉIA DO SUL
- TAIWAN
- TAILÂNDIA
- AUSTRÁLIA
- NOVA ZELÂNDIA
- COMO AS MÍDIAS SOCIAIS TRANSFORMARAM O COMÉRCIO ELETRÔNICO
- TRANSFORMAÇÃO DIGITAL NO E-COMMERCE
- LISTA DE EMPRESAS INICIAIS NO COMÉRCIO ELETRÔNICO
- ANÁLISE DAS CINCO FORÇAS DE PORTERS
- VISÃO GERAL DO MERCADO
- MOTORISTAS
- DESENVOLVIMENTO E CRESCIMENTO DO MERCADO DE LOGÍSTICA DE TERCEIROS NA REGIÃO
- CRESCIMENTO NO USO DE CARTEIRAS MÓVEIS
- ALTA PREFERÊNCIA PARA COMPRAS ONLINE
- AUMENTO DO USO DE USUÁRIOS DA INTERNET
- NÚMERO CRESCENTE DE USUÁRIOS DE SMARTPHONES
- RESTRIÇÕES
- QUESTÕES REGULAMENTARES NOS PAÍSES DA ÁSIA
- IMPACTO DAS TENSÕES COMERCIAIS
- OPORTUNIDADES
- O DESENVOLVIMENTO DA TECNOLOGIA 5G LEVOU A UMA CONECTIVIDADE MELHORADA
- CRESCIMENTO DA RENDA DISPONÍVEL DA REGIÃO
- DESAFIO
- CASOS DE VIOLAÇÃO DE DADOS E PRIVACIDADE
- IMPACTO DA COVID-19 NO MERCADO DE COMÉRCIO ELETRÔNICO DA ÁSIA-PACÍFICO
- ANÁLISE DO IMPACTO DA COVID-19 NO MERCADO
- CONSEQUÊNCIAS DA COVID-19 E INICIATIVA DO GOVERNO PARA IMPULSIONAR O MERCADO
- DECISÕES ESTRATÉGICAS PARA OS PRINCIPAIS ATORES APÓS A COVID-19 PARA GANHAR PARTICIPAÇÃO COMPETITIVA NO MERCADO
- FORMAR PARCERIA, ESTRATÉGIAS DE AQUISIÇÃO PARA AUMENTAR O ALCANCE E ESTABILIZAR A OFERTA
- IMPACTO NA DEMANDA
- IMPACTO NA CADEIA DE SUPRIMENTOS
- CONCLUSÃO
- MERCADO DE COMÉRCIO ELETRÔNICO DA ÁSIA-PACÍFICO, POR TIPO DE PRODUTO
- VISÃO GERAL
- BUSINESS-TO-CONSUMER (B2C)
- VAREJO ONLINE / E-TAILING
- VIAGENS ONLINE
- CLASSIFICADOS ONLINE
- BUSINESS-TO-BUSINESS (B2B)
- CLIENTE-EMPRESA (C2B)
- CLIENTE PARA CLIENTE (C2C)
- MERCADO DE COMÉRCIO ELETRÔNICO DA ÁSIA-PACÍFICO, POR PLATAFORMA
- VISÃO GERAL
- CÓDIGO ABERTO
- SAAS (SOFTWARE COMO SERVIÇO)
- COMÉRCIO SEM CABEÇA
- MERCADO DE COMÉRCIO ELETRÔNICO DA ÁSIA-PACÍFICO, POR MEIO DE AMBIENTE DE HOSPEDAGEM
- VISÃO GERAL
- NUVEM
- NO LOCAL
- MERCADO DE COMÉRCIO ELETRÔNICO DA ÁSIA-PACÍFICO, POR CATEGORIA
- VISÃO GERAL
- BENS
- ROUPAS, ACESSÓRIOS E CALÇADOS
- MANTIMENTOS
- SAÚDE E BELEZA
- PRODUTOS DE CUIDADOS PESSOAIS
- TELECOM
- MÍDIA E ENTRETENIMENTO
- TV
- SISTEMAS DE MÚSICA
- VIDEOGAMES, DVDS
- REPRODUTORES DE MÍDIA
- OUTROS
- EQUIPAMENTOS ELETRÔNICOS
- FOGÕES ELÉTRICOS
- MÁQUINA DE LAVAR
- REFRIGERADORES
- OUTROS
- ALIMENTOS E BEBIDAS
- LIVROS
- LIVROS DE HISTÓRIAS
- LIVROS EDUCACIONAIS
- LIVROS MITOLÓGICOS
- OUTROS
- ARTIGOS ESPORTIVOS
- ARTIGOS PARA BEBÊS
- PRODUTOS RELACIONADOS A ANIMAIS DE ESTIMAÇÃO
- CASA E JARDIM
- PRESENTES E BRINQUEDOS
- HARDWARE DE COMPUTADOR
- CARRO, MOTOCICLETA E ACESSÓRIOS
- OUTROS
- SERVIÇOS
- PASSAGENS AÉREAS
- RESERVAS DE HOTEL E ACOMODAÇÕES
- INGRESSOS DE CINEMA
- INGRESSOS PARA EVENTOS
- MERCADO DE COMÉRCIO ELETRÔNICO DA ÁSIA-PACÍFICO, POR CANAL DE DISTRIBUIÇÃO
- VISÃO GERAL
- CLIQUES PUROS
- BRICK-&-CLICK OU CLIQUE-PARA-BRICK
- MERCADO DE COMÉRCIO ELETRÔNICO DA ÁSIA-PACÍFICO, POR DISPOSITIVO DE COMPRA
- VISÃO GERAL
- DISPOSITIVOS MÓVEIS
- COMPUTADOR
- COMPRIMIDOS
- MERCADO DE COMÉRCIO ELETRÔNICO DA ÁSIA-PACÍFICO, POR SOLUÇÕES DE PAGAMENTO
- VISÃO GERAL
- PAGAMENTOS DE TERCEIROS
- CARTÕES DE CRÉDITO
- CARTÕES DE DÉBITO
- TRANSFERÊNCIAS BANCÁRIAS
- COMPROVANTE DE DINHEIRO
- PAGAMENTO NA ENTREGA
- OUTROS
- MERCADO DE COMÉRCIO ELETRÔNICO DA ÁSIA-PACÍFICO POR REGIÃO
- ÁSIA-PACÍFICO
- CHINA
- CORÉIA DO SUL
- JAPÃO
- ÍNDIA
- AUSTRÁLIA
- INDONÉSIA
- TAILÂNDIA
- MALÁSIA
- CINGAPURA
- FILIPINAS
- RESTO DA ÁSIA-PACÍFICO
- MERCADO DE COMÉRCIO ELETRÔNICO DA ÁSIA-PACÍFICO: CENÁRIO DA EMPRESA
- ANÁLISE DE AÇÕES DA EMPRESA: ÁSIA-PACÍFICO
- ANÁLISE SWOT
- PERFIL DE COMPANHIA
- AMAZON.COM, INC.
- RESUMO DA EMPRESA
- ANÁLISE DE RECEITA
- PORTFÓLIO DE PRODUTOS
- DESENVOLVIMENTOS RECENTES
- WALMART INC.
- RESUMO DA EMPRESA
- ANÁLISE DE RECEITA
- PORTFÓLIO DE PRODUTOS
- DESENVOLVIMENTOS RECENTES
- JINGDONG JD (UMA SUBSIDIÁRIA DA JD.COM, INC.)
- RESUMO DA EMPRESA
- ANÁLISE DE RECEITA
- PORTFÓLIO DE PRODUTOS
- DESENVOLVIMENTOS RECENTES
- ALIBABA GROUP HOLDING LIMITADA
- RESUMO DA EMPRESA
- ANÁLISE DE RECEITA
- PORTFÓLIO DE PRODUTOS
- DESENVOLVIMENTO RECENTE
- ASOS PLC
- RESUMO DA EMPRESA
- ANÁLISE DE RECEITA
- PORTFÓLIO DE PRODUTOS
- DESENVOLVIMENTOS RECENTES
- RESERVAS DE PARTICIPAÇÕES
- RESUMO DA EMPRESA
- ANÁLISE DE RECEITA
- PORTFÓLIO DE PRODUTOS
- DESENVOLVIMENTOS RECENTES
- BRAINBEES SOLUTIONS Pvt Ltd (FIRSTCRY.COM)
- RESUMO DA EMPRESA
- PORTFÓLIO DE PRODUTOS
- DESENVOLVIMENTO RECENTE
- CARROSSELL
- RESUMO DA EMPRESA
- PORTFÓLIO DE PRODUTOS
- DESENVOLVIMENTOS RECENTES
- CORPORAÇÃO DE ATACADO COSTCO
- RESUMO DA EMPRESA
- ANÁLISE DE RECEITA
- PORTFÓLIO DE PRODUTOS
- DESENVOLVIMENTOS RECENTES
- EBAY INC.
- RESUMO DA EMPRESA
- ANÁLISE DE RECEITA
- PORTFÓLIO DE PRODUTOS
- DESENVOLVIMENTOS RECENTES
- GROFERS ÍNDIA Pvt. Ltda.
- RESUMO DA EMPRESA
- PORTFÓLIO DE PRODUTOS
- DESENVOLVIMENTOS RECENTES
- GROUPON, INC.
- RESUMO DA EMPRESA
- ANÁLISE DE RECEITA
- PORTFÓLIO DE PRODUTOS
- DESENVOLVIMENTOS RECENTES
- AUTORIDADE DE PRODUTOS HOME DEPOT, LLC
- RESUMO DA EMPRESA
- ANÁLISE DE RECEITA
- PORTFÓLIO DE PRODUTOS
- DESENVOLVIMENTOS RECENTES
- JB HI-FI
- RESUMO DA EMPRESA
- ANÁLISE DE RECEITA
- PORTFÓLIO DE PRODUTOS
- DESENVOLVIMENTO RECENTE
- GRUPO OTTO
- RESUMO DA EMPRESA
- PORTFÓLIO DE PRODUTOS
- DESENVOLVIMENTOS RECENTES
- GRUPO RAKUTEN, INC.
- RESUMO DA EMPRESA
- ANÁLISE DE RECEITA
- PORTFÓLIO DE SERVIÇOS
- DESENVOLVIMENTOS RECENTES
- SHOPIFY INC.
- RESUMO DA EMPRESA
- ANÁLISE DE RECEITA
- PORTFÓLIO DE PRODUTOS
- DESENVOLVIMENTOS RECENTES
- SNAPDEAL PRIVATE LIMITADA
- RESUMO DA EMPRESA
- PORTFÓLIO DE PRODUTOS
- DESENVOLVIMENTOS RECENTES
- SUPRIMENTOS DE MERCEARIA PARA SUPERMERCADOS Pvt Ltd
- RESUMO DA EMPRESA
- PORTFÓLIO DE PRODUTOS
- DESENVOLVIMENTOS RECENTES
- VIPSHOP HOLDINGS LIMITADA
- RESUMO DA EMPRESA
- ANÁLISE DE RECEITA
- PORTFÓLIO DE PRODUTOS
- DESENVOLVIMENTOS RECENTES
- GRUPO WOOLWORTHS LIMITADO
- RESUMO DA EMPRESA
- ANÁLISE DE RECEITA
- PORTFÓLIO DE MARCAS
- DESENVOLVIMENTOS RECENTES
- QUESTIONÁRIO
- RELATÓRIOS RELACIONADOS
Lista de Tabela
TABELA 1 PENETRAÇÃO DE USUÁRIOS DE SMARTPHONES NOS PAÍSES DA ÁSIA-PACÍFICO (EM MILHÕES)
TABELA 2 Mercado de comércio eletrônico da Ásia-Pacífico, por tipo de produto, 2019-2028 (US$ bilhões)
TABELA 3 Mercado de comércio eletrônico (B2C) da Ásia-Pacífico, por tipo, 2019-2028 (US$ bilhões)
TABELA 4 Mercado de comércio eletrônico da Ásia-Pacífico, por plataforma, 2019-2028 (US$ bilhões)
TABELA 5 Mercado de comércio eletrônico da Ásia-Pacífico, por ambiente de hospedagem, 2019-2028 (US$ bilhões)
TABELA 6 Mercado de comércio eletrônico da Ásia-Pacífico, por categoria, 2019-2028 (US$ bilhões)
TABELA 7 Mercado de produtos da Ásia-Pacífico no comércio eletrônico, por tipo, 2019-2028 (US$ bilhões)
TABELA 8 Mídia e entretenimento na Ásia-Pacífico no mercado de comércio eletrônico, por tipo, 2019-2028 (US$ bilhões)
TABELA 9 Equipamentos eletrônicos da Ásia-Pacífico no mercado de comércio eletrônico, por tipo, 2019-2028 (US$ bilhões)
TABELA 10 Livros da Ásia-Pacífico no mercado de comércio eletrônico, por tipo, 2019-2028 (US$ bilhões)
TABELA 11 Serviços da Ásia-Pacífico no mercado de comércio eletrônico, por tipo, 2019-2028 (US$ bilhões)
TABELA 12 Mercado de comércio eletrônico da Ásia-Pacífico, por canal de distribuição, 2019-2028 (US$ bilhões)
TABELA 13 Mercado de comércio eletrônico da Ásia-Pacífico, por dispositivo adquirido, 2019-2028 (US$ bilhões)
TABELA 14 Mercado de comércio eletrônico da Ásia-Pacífico, por soluções de pagamento, 2019-2028 (US$ bilhões)
TABELA 15 Mercado de comércio eletrônico da Ásia-Pacífico, por país, 2019-2028 (US$ bilhões)
TABELA 16 Mercado de comércio eletrônico da China, por tipo de produto, 2019-2028 (US$ bilhões)
TABELA 17 CHINA Business to Consumer (B2C) no mercado de comércio eletrônico, por tipo, 2019-2028 (US$ bilhões)
TABELA 18 Mercado de comércio eletrônico da China, por plataforma, 2019-2028 (US$ bilhões)
TABELA 19 Mercado de comércio eletrônico da China, por ambiente de hospedagem, 2019-2028 (US$ bilhões)
TABELA 20 Mercado de comércio eletrônico da China, por categoria, 2019-2028 (US$ bilhões)
TABELA 21 Mercadorias da China no mercado de comércio eletrônico, por tipo, 2019-2028 (US$ bilhões)
TABELA 22 CHINA Mídia e Entretenimento no Mercado de Comércio Eletrônico, Por Tipo, 2019-2028 (US$ bilhões)
TABELA 23 Equipamentos eletrônicos no mercado de comércio eletrônico da China, por tipo, 2019-2028 (US$ bilhões)
TABELA 24 Livros da China no mercado de comércio eletrônico, por tipo, 2019-2028 (US$ bilhões)
TABELA 25 Serviços da CHINA no mercado de comércio eletrônico, por tipo, 2019-2028 (US$ bilhões)
TABELA 26 Mercado de comércio eletrônico da China, por canal de distribuição, 2019-2028 (US$ bilhões)
TABELA 27 Mercado de comércio eletrônico da China, por dispositivo adquirido, 2019-2028 (US$ bilhões)
TABELA 28 Mercado de comércio eletrônico da China, por soluções de pagamento, 2019-2028 (US$ bilhões)
TABELA 29 Mercado de comércio eletrônico da COREIA DO SUL, por tipo de produto, 2019-2028 (US$ bilhões)
TABELA 30 COREIA DO SUL Business to Consumer (B2C) no Mercado de Comércio Eletrônico, Por Tipo, 2019-2028 (US$ bilhões)
TABELA 31 Mercado de comércio eletrônico da COREIA DO SUL, por plataforma, 2019-2028 (US$ bilhões)
TABELA 32 Mercado de comércio eletrônico da COREIA DO SUL, por ambiente de hospedagem, 2019-2028 (US$ bilhões)
TABELA 33 Mercado de comércio eletrônico da COREIA DO SUL, por categoria, 2019-2028 (US$ bilhões)
TABELA 34 COREIA DO SUL Mercadorias no Mercado de Comércio Eletrônico, Por Tipo, 2019-2028 (US$ bilhões)
TABELA 35 COREIA DO SUL Mídia e entretenimento no mercado de comércio eletrônico, por tipo, 2019-2028 (US$ bilhões)
TABELA 36 COREIA DO SUL Equipamentos eletrônicos no mercado de comércio eletrônico, por tipo, 2019-2028 (US$ bilhões)
TABELA 37 COREIA DO SUL Livros no Mercado de Comércio Eletrônico, Por Tipo, 2019-2028 (US$ bilhões)
TABELA 38 COREIA DO SUL Serviços no Mercado de Comércio Eletrônico, Por Tipo, 2019-2028 (US$ bilhões)
TABELA 39 Mercado de comércio eletrônico da COREIA DO SUL, por canal de distribuição, 2019-2028 (US$ bilhões)
TABELA 40 Mercado de comércio eletrônico da COREIA DO SUL, por dispositivo adquirido, 2019-2028 (US$ bilhões)
TABELA 41 Mercado de comércio eletrônico da COREIA DO SUL, por soluções de pagamento, 2019-2028 (US$ bilhões)
TABELA 42 Mercado de comércio eletrônico do Japão, por tipo de produto, 2019-2028 (US$ bilhões)
TABELA 43 JAPÃO Business to Consumer (B2C) no mercado de comércio eletrônico, por tipo, 2019-2028 (US$ bilhões)
TABELA 44 Mercado de comércio eletrônico do Japão, por plataforma, 2019-2028 (US$ bilhões)
TABELA 45 Mercado de comércio eletrônico do Japão, por ambiente de hospedagem, 2019-2028 (US$ bilhões)
TABELA 46 Mercado de comércio eletrônico do Japão, por categoria, 2019-2028 (US$ bilhões)
TABELA 47 Mercadorias do Japão no mercado de comércio eletrônico, por tipo, 2019-2028 (US$ bilhões)
TABELA 48 JAPÃO Mídia e Entretenimento no Mercado de Comércio Eletrônico, Por Tipo, 2019-2028 (US$ bilhões)
TABELA 49 Equipamentos eletrônicos no mercado de comércio eletrônico do Japão, por tipo, 2019-2028 (US$ bilhões)
TABELA 50 Livros no mercado de comércio eletrônico do Japão, por tipo, 2019-2028 (US$ bilhões)
TABELA 51 Serviços no mercado de comércio eletrônico do Japão, por tipo, 2019-2028 (US$ bilhões)
TABELA 52 Mercado de comércio eletrônico do Japão, por canal de distribuição, 2019-2028 (US$ bilhões)
TABELA 53 Mercado de comércio eletrônico do Japão, por dispositivo adquirido, 2019-2028 (US$ bilhões)
TABELA 54 Mercado de comércio eletrônico do Japão, por soluções de pagamento, 2019-2028 (US$ bilhões)
TABELA 55 Mercado de comércio eletrônico da ÍNDIA, por tipo de produto, 2019-2028 (US$ bilhões)
TABELA 56 ÍNDIA Business to Consumer (B2C) no mercado de comércio eletrônico, por tipo, 2019-2028 (US$ bilhões)
TABELA 57 Mercado de comércio eletrônico da ÍNDIA, por plataforma, 2019-2028 (US$ bilhões)
TABELA 58 Mercado de comércio eletrônico da Índia, por ambiente de hospedagem, 2019-2028 (US$ bilhões)
TABELA 59 Mercado de comércio eletrônico da ÍNDIA, por categoria, 2019-2028 (US$ bilhões)
TABELA 60 Mercadorias no mercado de comércio eletrônico da ÍNDIA, por tipo, 2019-2028 (US$ bilhões)
TABELA 61 ÍNDIA Mídia e entretenimento no mercado de comércio eletrônico, por tipo, 2019-2028 (US$ bilhões)
TABELA 62 ÍNDIA Equipamentos Eletrônicos no Mercado de Comércio Eletrônico, Por Tipo, 2019-2028 (US$ bilhões)
TABELA 63 Livros da ÍNDIA no mercado de comércio eletrônico, por tipo, 2019-2028 (US$ bilhões)
TABELA 64 Serviços no mercado de comércio eletrônico da ÍNDIA, por tipo, 2019-2028 (US$ bilhões)
TABELA 65 Mercado de comércio eletrônico da ÍNDIA, por canal de distribuição, 2019-2028 (US$ bilhões)
TABELA 66 Mercado de comércio eletrônico da ÍNDIA, por dispositivo adquirido, 2019-2028 (US$ bilhões)
TABELA 67 Mercado de comércio eletrônico da ÍNDIA, por soluções de pagamento, 2019-2028 (US$ bilhões)
TABELA 68 Mercado de comércio eletrônico da AUSTRÁLIA, por tipo de produto, 2019-2028 (US$ bilhões)
TABELA 69 AUSTRÁLIA Business to Consumer (B2C) no mercado de comércio eletrônico, por tipo, 2019-2028 (US$ bilhões)
TABELA 70 Mercado de comércio eletrônico da AUSTRÁLIA, por plataforma, 2019-2028 (US$ bilhões)
TABELA 71 Mercado de comércio eletrônico da AUSTRÁLIA, por ambiente de hospedagem, 2019-2028 (US$ bilhões)
TABELA 72 Mercado de comércio eletrônico da AUSTRÁLIA, por categoria, 2019-2028 (US$ bilhões)
TABELA 73 AUSTRÁLIA Mercado de bens no comércio eletrônico, por tipo, 2019-2028 (US$ bilhões)
TABELA 74 AUSTRÁLIA Mídia e entretenimento no mercado de comércio eletrônico, por tipo, 2019-2028 (US$ bilhões)
TABELA 75 AUSTRÁLIA Equipamentos Eletrônicos no Mercado de Comércio Eletrônico, Por Tipo, 2019-2028 (US$ bilhões)
TABELA 76 AUSTRÁLIA Livros no Mercado de Comércio Eletrônico, Por Tipo, 2019-2028 (US$ bilhões)
TABELA 77 Serviços no mercado de comércio eletrônico da AUSTRÁLIA, por tipo, 2019-2028 (US$ bilhões)
TABELA 78 Mercado de comércio eletrônico da AUSTRÁLIA, por canal de distribuição, 2019-2028 (US$ bilhões)
TABELA 79 Mercado de comércio eletrônico da AUSTRÁLIA, por dispositivo adquirido, 2019-2028 (US$ bilhões)
TABELA 80 Mercado de comércio eletrônico da AUSTRÁLIA, por soluções de pagamento, 2019-2028 (US$ bilhões)
TABELA 81 Mercado de comércio eletrônico da Indonésia, por tipo de produto, 2019-2028 (US$ bilhões)
TABELA 82 INDONÉSIA Business to Consumer (B2C) no mercado de comércio eletrônico, por tipo, 2019-2028 (US$ bilhões)
TABELA 83 Mercado de comércio eletrônico da Indonésia, por plataforma, 2019-2028 (US$ bilhões)
TABELA 84 Mercado de comércio eletrônico da Indonésia, por ambiente de hospedagem, 2019-2028 (US$ bilhões)
TABELA 85 Mercado de comércio eletrônico da Indonésia, por categoria, 2019-2028 (US$ bilhões)
TABELA 86 Mercadorias no comércio eletrônico da DONÉSIA, por tipo, 2019-2028 (US$ bilhões)
TABELA 87 INDONÉSIA Mídia e entretenimento no mercado de comércio eletrônico, por tipo, 2019-2028 (US$ bilhões)
TABELA 88 INDONÉSIA Equipamentos eletrônicos no mercado de comércio eletrônico, por tipo, 2019-2028 (US$ bilhões)
TABELA 89 INDONÉSIA Livros no Mercado de Comércio Eletrônico, Por Tipo, 2019-2028 (US$ bilhões)
TABELA 90 INDONÉSIA Serviços no Mercado de Comércio Eletrônico, Por Tipo, 2019-2028 (US$ bilhões)
TABELA 91 Mercado de comércio eletrônico da Indonésia, por canal de distribuição, 2019-2028 (US$ bilhões)
TABELA 92 Mercado de comércio eletrônico da Indonésia, por dispositivo adquirido, 2019-2028 (US$ bilhões)
TABELA 93 Mercado de comércio eletrônico da Indonésia, por soluções de pagamento, 2019-2028 (US$ bilhões)
TABELA 94 Mercado de comércio eletrônico da Tailândia, por tipo de produto, 2019-2028 (US$ bilhões)
TABELA 95 TAILÂNDIA Business to Consumer (B2C) no mercado de comércio eletrônico, por tipo, 2019-2028 (US$ bilhões)
TABELA 96 Mercado de comércio eletrônico da Tailândia, por plataforma, 2019-2028 (US$ bilhões)
TABELA 97 Mercado de comércio eletrônico da Tailândia, por ambiente de hospedagem, 2019-2028 (US$ bilhões)
TABELA 98 Mercado de comércio eletrônico da Tailândia, por categoria, 2019-2028 (US$ bilhões)
TABELA 99 Mercadorias no mercado de comércio eletrônico da Tailândia, por tipo, 2019-2028 (US$ bilhões)
TABELA 100 TAILÂNDIA Mídia e entretenimento no mercado de comércio eletrônico, por tipo, 2019-2028 (US$ bilhões)
TABELA 101 TAILÂNDIA Equipamentos eletrônicos no mercado de comércio eletrônico, por tipo, 2019-2028 (US$ bilhões)
TABELA 102 TAILÂNDIA Livros no mercado de comércio eletrônico, por tipo, 2019-2028 (US$ bilhões)
TABELA 103 Serviços no mercado de comércio eletrônico da Tailândia, por tipo, 2019-2028 (US$ bilhões)
TABELA 104 Mercado de comércio eletrônico da Tailândia, por canal de distribuição, 2019-2028 (US$ bilhões)
TABELA 105 Mercado de comércio eletrônico da Tailândia, por dispositivo adquirido, 2019-2028 (US$ bilhões)
TABELA 106 Mercado de comércio eletrônico da Tailândia, por soluções de pagamento, 2019-2028 (US$ bilhões)
TABELA 107 Mercado de comércio eletrônico da MALÁSIA, por tipo de produto, 2019-2028 (US$ bilhões)
TABELA 108 MALÁSIA Business to Consumer (B2C) no mercado de comércio eletrônico, por tipo, 2019-2028 (US$ bilhões)
TABELA 109 Mercado de comércio eletrônico da MALÁSIA, por plataforma, 2019-2028 (US$ bilhões)
TABELA 110 Mercado de comércio eletrônico da MALÁSIA, por ambiente de hospedagem, 2019-2028 (US$ bilhões)
TABELA 111 Mercado de comércio eletrônico da MALÁSIA, por categoria, 2019-2028 (US$ bilhões)
TABELA 112 MALÁSIA Mercadorias no mercado de comércio eletrônico, por tipo, 2019-2028 (US$ bilhões)
TABELA 113 MALÁSIA Mídia e entretenimento no mercado de comércio eletrônico, por tipo, 2019-2028 (US$ bilhões)
TABELA 114 MALÁSIA Equipamentos eletrônicos no mercado de comércio eletrônico, por tipo, 2019-2028 (US$ bilhões)
TABELA 115 Livros no mercado de comércio eletrônico da MALÁSIA, por tipo, 2019-2028 (US$ bilhões)
TABELA 116 MALÁSIA Serviços no Mercado de Comércio Eletrônico, Por Tipo, 2019-2028 (US$ bilhões)
TABELA 117 Mercado de comércio eletrônico da MALÁSIA, por canal de distribuição, 2019-2028 (US$ bilhões)
TABELA 118 Mercado de comércio eletrônico da MALÁSIA, por dispositivo adquirido, 2019-2028 (US$ bilhões)
TABELA 119 Mercado de comércio eletrônico da MALÁSIA, por soluções de pagamento, 2019-2028 (US$ bilhões)
TABELA 120 Mercado de comércio eletrônico de Cingapura, por tipo de produto, 2019-2028 (US$ bilhões)
TABELA 121 SINGAPURA Business to Consumer (B2C) no mercado de comércio eletrônico, por tipo, 2019-2028 (US$ bilhões)
TABELA 122 Mercado de comércio eletrônico de Cingapura, por plataforma, 2019-2028 (US$ bilhões)
TABELA 123 Mercado de comércio eletrônico de Cingapura, por ambiente de hospedagem, 2019-2028 (US$ bilhões)
TABELA 124 Mercado de comércio eletrônico de Cingapura, por categoria, 2019-2028 (US$ bilhões)
TABELA 125 Mercadorias no mercado de comércio eletrônico de Singapura, por tipo, 2019-2028 (US$ bilhões)
TABELA 126 SINGAPURA Mídia e Entretenimento no Mercado de Comércio Eletrônico, Por Tipo, 2019-2028 (US$ bilhões)
TABELA 127 EQUIPAMENTOS ELETRÔNICOS DE SINGAPURA no Mercado de Comércio Eletrônico, Por Tipo, 2019-2028 (US$ bilhões)
TABELA 128 Livros no mercado de comércio eletrônico em Singapura, por tipo, 2019-2028 (US$ bilhões)
TABELA 129 Serviços no mercado de comércio eletrônico em Singapura, por tipo, 2019-2028 (US$ bilhões)
TABELA 130 Mercado de comércio eletrônico de Cingapura, por canal de distribuição, 2019-2028 (US$ bilhões)
TABELA 131 Mercado de comércio eletrônico de Cingapura, por dispositivo adquirido, 2019-2028 (US$ bilhões)
TABELA 132 Mercado de comércio eletrônico de Cingapura, por soluções de pagamento, 2019-2028 (US$ bilhões)
TABELA 133 Mercado de comércio eletrônico das Filipinas, por tipo de produto, 2019-2028 (US$ bilhões)
TABELA 134 FILIPINAS Business to Consumer (B2C) no mercado de comércio eletrônico, por tipo, 2019-2028 (US$ bilhões)
TABELA 135 FILIPINAS Mercado de comércio eletrônico, por plataforma, 2019-2028 (US$ bilhões)
TABELA 136 Mercado de comércio eletrônico das Filipinas, por ambiente de hospedagem, 2019-2028 (US$ bilhões)
TABELA 137 FILIPINAS Mercado de comércio eletrônico, por categoria, 2019-2028 (US$ bilhões)
TABELA 138 FILIPINAS Mercadorias no mercado de comércio eletrônico, por tipo, 2019-2028 (US$ bilhões)
TABELA 139 FILIPINAS Mídia e entretenimento no mercado de comércio eletrônico, por tipo, 2019-2028 (US$ bilhões)
TABELA 140 EQUIPAMENTOS ELETRÔNICOS NAS FILIPINAS no Mercado de Comércio Eletrônico, Por Tipo, 2019-2028 (US$ bilhões)
TABELA 141 FILIPINAS Livros no mercado de comércio eletrônico, por tipo, 2019-2028 (US$ bilhões)
TABELA 142 FILIPINAS Serviços no mercado de comércio eletrônico, por tipo, 2019-2028 (US$ bilhões)
TABELA 143 Mercado de comércio eletrônico das Filipinas, por canal de distribuição, 2019-2028 (US$ bilhões)
TABELA 144 Mercado de comércio eletrônico das Filipinas, por dispositivo adquirido, 2019-2028 (US$ bilhões)
TABELA 145 FILIPINAS Mercado de comércio eletrônico, por soluções de pagamento, 2019-2028 (US$ bilhões)
TABELA 146 RESTANTE DO MERCADO DE COMÉRCIO ELETRÔNICO DA ÁSIA-PACÍFICO, POR TIPO DE PRODUTO, 2019-2028 (US$ bilhões)
Lista de Figura
FIGURA 1 Mercado de comércio eletrônico da ÁSIA-PACÍFICO: segmentação
FIGURA 2 Mercado de comércio eletrônico da ÁSIA-PACÍFICO: triangulação de dados
FIGURA 3 Mercado de comércio eletrônico da ÁSIA-PACÍFICO: ANÁLISE DROC
FIGURA 4 Mercado de comércio eletrônico da ÁSIA-PACÍFICO: ANÁLISE DE MERCADO REGIONAL vs. por país
FIGURA 5 Mercado de comércio eletrônico da ÁSIA-PACÍFICO: ANÁLISE DE PESQUISA DA EMPRESA
FIGURA 6 Mercado de comércio eletrônico da ÁSIA-PACÍFICO: DEMOGRAFIA DA ENTREVISTA
FIGURA 7 Mercado de comércio eletrônico da Ásia-Pacífico: Grade de posição de mercado DBMR
FIGURA 8 Mercado de comércio eletrônico da ÁSIA-PACÍFICO: análise de participação de fornecedores
FIGURA 9 Mercado de comércio eletrônico da ÁSIA-PACÍFICO: SEGMENTAÇÃO
FIGURA 10 O crescimento no uso de carteiras móveis deve impulsionar o mercado de comércio eletrônico da região Ásia-Pacífico no período previsto de 2021 a 2028
FIGURA 11 O segmento Business to Consumer (B2C) deverá representar a maior fatia do mercado de comércio eletrônico da ÁSIA-PACÍFICO em 2021 e 2028
FIGURA 12 PARTICIPAÇÃO DE MERCADO DE PLATAFORMAS B2C NA CHINA
FIGURA 13 CATEGORIAS DE COMÉRCIO ELETRÔNICO NA ÍNDIA
FIGURA 14 MÉTODOS DE PAGAMENTO ONLINE NA ÍNDIA
FIGURA 15 CATEGORIA DE COMPRAS NO JAPÃO
FIGURA 16 MÉTODO DE PAGAMENTO NA COREIA DO SUL
FIGURA 17 MÍDIAS SOCIAIS E APLICATIVO DE MENSAGENS
FIGURA 18 MOTIVADORES, RESTRIÇÕES, OPORTUNIDADES E DESAFIOS DO MERCADO DE COMÉRCIO ELETRÔNICO DA ÁSIA-PACÍFICO
FIGURA 19 ADOÇÃO DE CARTEIRAS ELETRÔNICAS PELA POPULAÇÃO ADULTA EM PAÍSES ASIÁTICOS
FIGURA 20 MERCADO DE COMÉRCIO ELETRÔNICO DA ÁSIA-Pacífico: POR TIPO DE PRODUTO, 2020
FIGURA 21 MERCADO DE COMÉRCIO ELETRÔNICO DA ÁSIA-Pacífico: POR plataforma, 2020
FIGURA 22 MERCADO DE COMÉRCIO ELETRÔNICO DA ÁSIA-Pacífico: POR AMBIENTE DE HOSPEDAGEM, 2020
FIGURA 23 MERCADO DE COMÉRCIO ELETRÔNICO DA ÁSIA-Pacífico: POR Categoria, 2020
FIGURA 24 MERCADO DE COMÉRCIO ELETRÔNICO DA ÁSIA-Pacífico: POR CANAL DE DISTRIBUIÇÃO, 2020
FIGURA 25 MERCADO DE COMÉRCIO ELETRÔNICO DA ÁSIA-Pacífico: POR dispositivo adquirido, 2020
FIGURA 26 MERCADO DE COMÉRCIO ELETRÔNICO DA ÁSIA-Pacífico: POR SOLUÇÕES DE PAGAMENTO, 2020
FIGURA 27 MERCADO DE COMÉRCIO ELETRÔNICO DA ÁSIA-PACÍFICO: RESUMO (2020)
FIGURA 28 MERCADO DE COMÉRCIO ELETRÔNICO DA ÁSIA-PACÍFICO: por país (2020)
FIGURA 29 MERCADO DE COMÉRCIO ELETRÔNICO DA ÁSIA-PACÍFICO: por país (2021 e 2028)
FIGURA 30 MERCADO DE COMÉRCIO ELETRÔNICO DA ÁSIA-PACÍFICO: por país (2020 e 2028)
FIGURA 31 MERCADO DE COMÉRCIO ELETRÔNICO DA ÁSIA-PACÍFICO: por tipo de produto (2021-2028)
FIGURA 32 MERCADO DE COMÉRCIO ELETRÔNICO DA ÁSIA-PACÍFICO: Participação da empresa em 2020 (%)
Metodologia de Investigação
A recolha de dados e a análise do ano base são feitas através de módulos de recolha de dados com amostras grandes. A etapa inclui a obtenção de informações de mercado ou dados relacionados através de diversas fontes e estratégias. Inclui examinar e planear antecipadamente todos os dados adquiridos no passado. Da mesma forma, envolve o exame de inconsistências de informação observadas em diferentes fontes de informação. Os dados de mercado são analisados e estimados utilizando modelos estatísticos e coerentes de mercado. Além disso, a análise da quota de mercado e a análise das principais tendências são os principais fatores de sucesso no relatório de mercado. Para saber mais, solicite uma chamada de analista ou abra a sua consulta.
A principal metodologia de investigação utilizada pela equipa de investigação do DBMR é a triangulação de dados que envolve a mineração de dados, a análise do impacto das variáveis de dados no mercado e a validação primária (especialista do setor). Os modelos de dados incluem grelha de posicionamento de fornecedores, análise da linha de tempo do mercado, visão geral e guia de mercado, grelha de posicionamento da empresa, análise de patentes, análise de preços, análise da quota de mercado da empresa, normas de medição, análise global versus regional e de participação dos fornecedores. Para saber mais sobre a metodologia de investigação, faça uma consulta para falar com os nossos especialistas do setor.
Personalização disponível
A Data Bridge Market Research é líder em investigação formativa avançada. Orgulhamo-nos de servir os nossos clientes novos e existentes com dados e análises que correspondem e atendem aos seus objetivos. O relatório pode ser personalizado para incluir análise de tendências de preços de marcas-alvo, compreensão do mercado para países adicionais (solicite a lista de países), dados de resultados de ensaios clínicos, revisão de literatura, mercado remodelado e análise de base de produtos . A análise de mercado dos concorrentes-alvo pode ser analisada desde análises baseadas em tecnologia até estratégias de carteira de mercado. Podemos adicionar quantos concorrentes necessitar de dados no formato e estilo de dados que procura. A nossa equipa de analistas também pode fornecer dados em tabelas dinâmicas de ficheiros Excel em bruto (livro de factos) ou pode ajudá-lo a criar apresentações a partir dos conjuntos de dados disponíveis no relatório.

