Asia Pacific Exosome Therapeutic Market
Tamanho do mercado em biliões de dólares
CAGR :
% 
 USD
255.50 Billion
USD
861.02 Billion
2025
2033
USD
255.50 Billion
USD
861.02 Billion
2025
2033
| 2026 –2033 | |
| USD 255.50 Billion | |
| USD 861.02 Billion | |
| % | |
Asia-Pacific Exosome Therapeutics Market, By Type (Natural Exosome, Hybrid Exosome), Source (Mesenchymal Stem Cells, Blood, Body Fluids, Urine, Dendritic Cells, Saliva, Milk, and Others), Therapy (Immunotherapy, Chemotherapy, and Gene Therapy), Transporting Capacity (Bio Macromolecules and Small Molecules), Application (Metabolic Disorders, Oncology, Cardiac Disorders, Neurology, Inflammatory Disorders, Organ Transplantation, Gynecology Disorders, Blood Disorders, and Others), Route of administration (Parenteral and Oral), End User (Research and Academic Institutes, Hospitals and Diagnostic Centers), Country (South Korea, Australia, Hong-Kong, Rest of Asia-Pacific) Industry Trends and Forecast To 2029
 Market Analysis and Insights: Asia Pacific Exosome Therapeutics Market
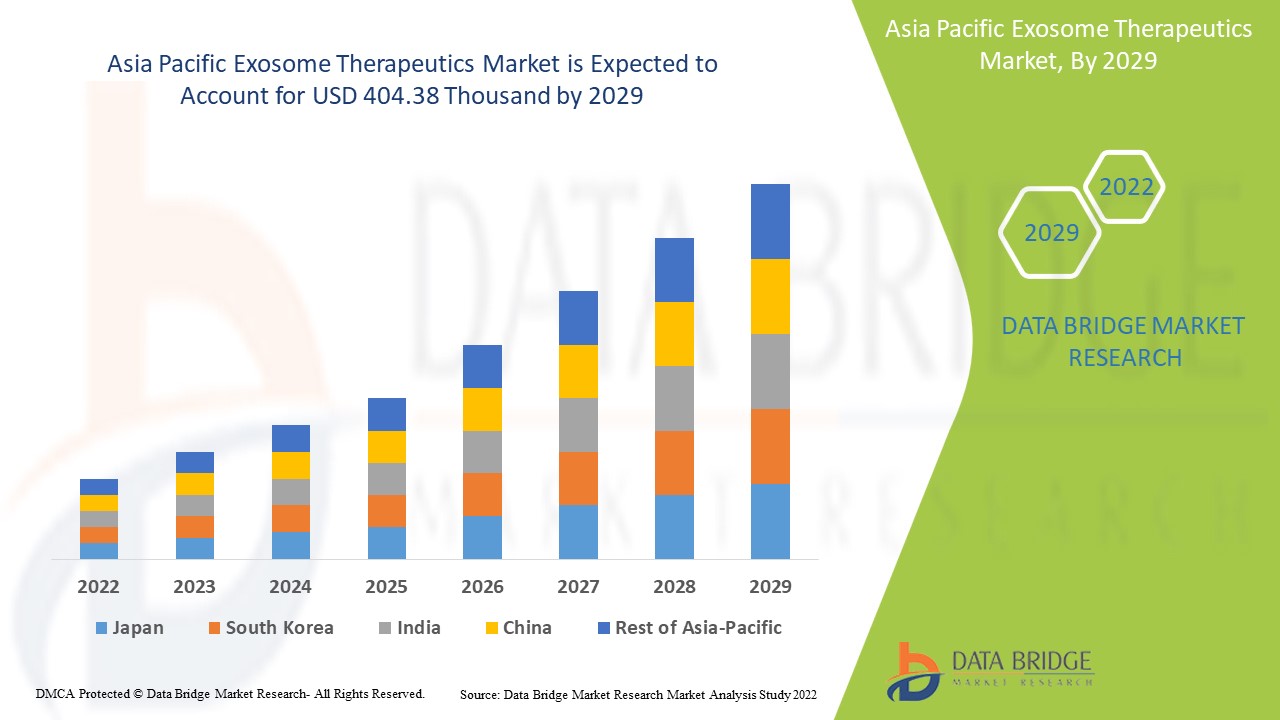
Asia Pacific exosome therapeutics market is expected to gain market growth in the forecast period of 2022 to 2029. Data Bridge Market Research analyses that the market is growing with a CAGR of 16.4% in the forecast period of 2022 to 2029 and is expected to reach USD 404.38 thousand by 2029 from USD 122.59 thousand in 2021. The rising prevalence of chronic inflammatory autoimmune diseases and technological developments in exosome therapeutics are likely to act as the major drivers for the demand of the market in the forecast period.
The exosomes are a specific class of cell-derived extracellular vesicles composed of endosomes and are typically 30-150 nm in diameter – the smallest type of extracellular vesicle. Protected by a lipid bilayer, the exosomes are pushed into the extracellular environment, which contains a complex cargo of contents derived from the original cell. The contents present in the cargo are proteins, lipids, messenger ribonucleic acid (mRNA), microsomal ribonucleic acid (miRNA), and deoxyribonucleic acid (DNA). The exosomes are distinct by how they are formed – through the fusion and exocytosis of multivesicular bodies into the extracellular space. The exosomes have been connected to treat various chronic conditions such as autoimmune disorders. Nanotechnology has shown novel insights for the prior detection of cancer-based on nanocarriers such as exosomes. Since the exosomes provide strong potential for applicability in therapeutic interventions, the exosomes have been regarded as potential drug carriers.
The exosomes consist of two types, the natural exosomes, and the hybrid exosomes. The natural exosomes are further sub-segmented into exogenous exosomes and autologous exosomes. The autologous exosomes are safe and operative vehicles for the targeted delivery of drugs for the treatment of cancer, autoimmune diseases, and chronic inflammatory diseases. The exogenous exosomes are tiny extracellular membrane vesicles released from endosomes of various cells and can be found in most of the body fluids, such as the synovial fluid, amniotic fluid, and semen. In cancer, exosomes have vital roles in the metastatic spread, drug resistance, and the formation of new blood vessels.
The driving factors responsible for the growth of the Asia-Pacific exosome therapeutics market are the increased incidence of chronic inflammatory diseases, the rise in research and development activities for exosome therapeutics, and government funding for the development and production of exosome therapeutics. Moreover, the growth potential in the emerging economies for exosome therapeutics and increased use of anti-aging therapy bolsters the exosome therapeutics market growth. However, the rise in cost, the stringent regulations imposed, and the risks observed while using the exosome therapeutics are the restraints that may hinder the market growth. An increase in healthcare expenditure is expected to provide a lucrative opportunity for market growth. On the other hand, rising investments, coupled with a lack of standardized procedures for isolating exosomes as well as non-availability of required expertise, are some of the significant challenges that are expected to affect the market growth.
The Asia-Pacific exosome therapeutics market report provides details of market share, new developments, and impact of domestic and localized market players, analyses opportunities in terms of emerging revenue pockets, changes in market regulations, product approvals, strategic decisions, product launches, geographic expansions, and technological innovations in the market. To understand the analysis and the market scenario, contact us for an Analyst Brief. Our team will help you create a revenue impact solution to achieve your desired goal.
 Asia- Pacific Exosome Therapeutics Market Scope and Market Size
Asia-Pacific exosome therapeutics market is categorized into seven notable segments which are based on type, source, therapy, transporting capacity, application, route of administration, and end user.
- On the basis of type, the Asia-Pacific exosome therapeutics market is segmented into natural exosomes and hybrid exosomes. In 2022, the natural exosomes segment is expected to dominate the Asia-Pacific exosome therapeutics market due to the presence of natural material of the exosomes and the benefits in drug delivery.
- On the basis of source, the Asia-Pacific exosome therapeutics market is segmented into mesenchymal stem cells, blood, body fluids, urine, dendritic cells, saliva, milk, and others. In 2022, the mesenchymal stem cell segment is expected to dominate the Asia-Pacific exosome therapeutics market due to emerging applications of mesenchymal stem cells and expansion of pipeline, availability, and ease of harvesting.
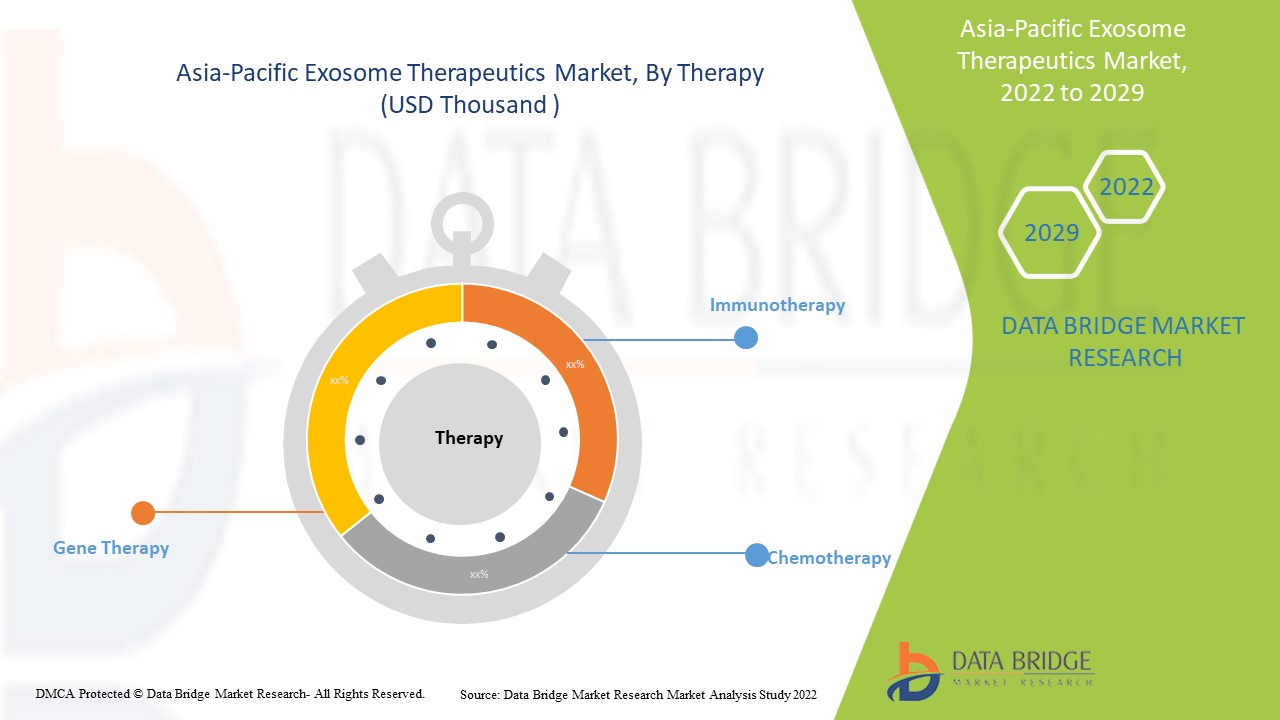
- On the basis of therapy, the Asia-Pacific exosome therapeutics market is segmented into immunotherapy, gene therapy, and chemotherapy. In 2022, the immunotherapy segment is expected to dominate the Asia-Pacific exosome therapeutics market due to ease of convenience, high accuracy, and improvement in the long-term survival rate.
- On the basis of transporting capacity, the Asia-Pacific exosome therapeutics market is segmented into bio macromolecules and small molecules. In 2022, the bio macromolecules segment is expected to dominate the Asia-Pacific exosome therapeutics market due to the presence of high sensitivity, increased use of protein therapeutics to cure inflammatory disorders, and boosting the natural defenses in the body to combat inflammatory diseases.
- On the basis of application, the Asia-Pacific exosome therapeutics market is segmented into metabolic disorders, oncology, cardiac disorders, neurology, inflammatory disorders, organ transplantation, gynecology disorders, blood disorders, and others. In 2022, the metabolic disorders segment is expected to dominate the Asia-Pacific exosome therapeutics market due to the increase in cases of metabolic disorders in China and India and the availability of exosome therapeutics in diagnostic laboratories.
- On the basis of route of administration, the Asia-Pacific exosome therapeutics market is segmented into parenteral and oral. In 2022, the parenteral segment is expected to dominate the Asia-Pacific exosome therapeutics market due to enhanced bioavailability and immediate onset of action.
- On the basis of end user, the Asia-Pacific exosome therapeutics market is segmented into research and academic institutes, hospitals, and diagnostics centers. In 2022, the research and academic institutes segment is expected to dominate the Asia-Pacific exosome therapeutics market due to the rise in research and development of exosomes in Japan and support from the government in funding.
Asia-Pacific Exosome Therapeutics Market Country Level Analysis
Asia-Pacific exosome therapeutics market is analyzed, and market size information is provided by type, source, therapy, transporting capacity, application, route of administration, and end user.
The countries covered in the exosome therapeutics market report are Japan, China, India, South Korea, Australia, Singapore, Indonesia, the Philippines, and rest of Asia-Pacific.
Asia-Pacific is expected to grow with the highest CAGR in the forecast periods as in the Asia-Pacific's countries demand exosome therapeutics products is increasing very rapidly with the urbanization and laboratory automation. China is expected to dominate in the market in the Asia-Pacific market as China is one of the leading countries to inculcate the exosome therapeutics market.
The country section of the report also provides individual market impacting factors and changes in regulation in the market domestically that impact the current and future trends of the market. Data points such as new sales, replacement sales, country demographics, regulatory acts, and import-export tariffs are some of the major pointers used to forecast the market scenario for individual countries. Also, the presence and availability of Asia Pacific brands and their challenges faced due to large or scarce competition from local and domestic brands, the impact of sales channels are considered while providing forecast analysis of the country data.
The Growth Potential For Exosome Therapeutics In Emerging Economies And The Strategic Initiatives By Market Players Are Creating New Opportunities In The Asia-Pacific Exosome Therapeutics Market
Asia Pacific exosome therapeutics market also provides you with detailed market analysis for every country's growth in a particular industry with exosome therapeutics sales, the impact of advancement in the exosome therapeutics, and changes in regulatory scenarios with their support for the exosome therapeutics market. The data is available for the historic period 2011 to 2020.
Competitive Landscape and Asia Pacific Exosome Therapeutics Market Share Analysis
Asia Pacific exosome therapeutics market competitive landscape provides details by a competitor. Details included are company overview, company financials, revenue generated, market potential, investment in research and development, new market initiatives, production sites and facilities, company strengths and weaknesses, product launch, product trials pipelines, product approvals, patents, product width, and breadth, application dominance, technology lifeline curve. The above data points provided are only related to the company's focus related to the exosome therapeutics market.
The major company providing Asia- Pacific exosome therapeutics is Exopharm.
DBMR analysts understand competitive strengths and provide competitive analysis for each competitor separately.
The strategic initiatives by market players along with new technological advancements for exosome therapeutics are bridging the gap for the treatment of chronic autoimmune diseases.
For instance,
- In September 2021, Exopharm collaborated with Japan's Showa Denko Materials for the use of LEAP technology in exosome therapeutics. The LEAP technology reduces the major problem faced during the production of exosome s, which are used as regenerative medicine for diseases such as cancer. The collaboration would evaluate Exopharm's LEAP – Ligand-based Exosome Affinity Purification – technology platform within its Yokohama regenerative medicine business unit. It would result in Showa Denko Materials leveraging the exosome technology of Exopharm
Collaboration, joint ventures, and other strategies by the market players are enhancing the company market in the exosome therapeutics market, which also provides the benefit for the organization to improve their offering for the exosome therapeutics market.
SKU-
Obtenha acesso online ao relatório sobre a primeira nuvem de inteligência de mercado do mundo

- Painel interativo de análise de dados
- Painel de análise da empresa para oportunidades de elevado potencial de crescimento
- Acesso de analista de pesquisa para personalização e customização. consultas
- Análise da concorrência com painel interativo
- Últimas notícias, atualizações e atualizações Análise de tendências
- Aproveite o poder da análise de benchmark para um rastreio abrangente da concorrência
Índice
1 INTRODUÇÃO
1.1 OBJETIVOS DO ESTUDO
1.2 DEFINIÇÃO DE MERCADO
1.3 VISÃO GERAL DO MERCADO DE TERAPÊUTICOS DE EXOSSOMOS DA ÁSIA-PACÍFICO
1.4 MOEDA E PREÇOS
1.5 LIMITAÇÕES
1.6 MERCADOS COBERTOS
2 MERCADO DE TERAPÊUTICOS DE EXOSSOMOS DA ÁSIA-PACÍFICO: SEGMENTAÇÃO
2.1 MERCADOS COBERTOS
2.2 ÂMBITO GEOGRÁFICO
2,3 ANOS CONSIDERADOS PARA O ESTUDO
2.4 MODELO DE VALIDAÇÃO DE DADOS TRIPÉ DBMR
2.5 ENTREVISTAS PRINCIPAIS COM PRINCIPAIS LÍDERES DE OPINIÃO
2.6 MODELAGEM MULTIVARIADA
2.7 TIPO DE CURVA DE LINHA DE VIDA DO SEGMENTO
2.8 GRADE DE POSIÇÃO DE MERCADO DBMR
2.9 ANÁLISE DA PARTICIPAÇÃO DO FORNECEDOR
2.1 GRADE DE COBERTURA DO USUÁRIO FINAL DO MERCADO
2.11 FONTES SECUNDÁRIAS
2.12 PREMISSAS
3 RESUMO EXECUTIVO
4 INSIGHTS PREMIUM
5 ANÁLISE DE PIPELINE
6 MERCADO DE TERAPÊUTICOS DE EXOSSOMOS DA ÁSIA-PACÍFICO: REGULAMENTAÇÕES
7 VISÃO GERAL DO MERCADO
7.1 MOTORISTAS
7.1.1 AUMENTO DA PREVALÊNCIA DE INFLAMAÇÃO CRÔNICA, DOENÇA AUTOIMUNE, DOENÇA DE LYME E OUTRAS DOENÇAS DEGENERATIVAS CRÔNICAS
7.1.2 AUMENTO DA INCIDÊNCIA DE DOENÇAS ONCOLOGICAS
7.1.3 AVANÇOS TECNOLÓGICOS NA TERAPÊUTICA DE EXOSSOMOS
7.1.4 AUMENTO DAS ATIVIDADES DE PESQUISA E DESENVOLVIMENTO ENVOLVIDAS NA TERAPÊUTICA COM EXOSSOMOS
7.1.5 FINANCIAMENTO GOVERNAMENTAL PARA O DESENVOLVIMENTO E PRODUÇÃO DE TERAPÊUTICOS DE EXOSSOMOS
7.2 RESTRIÇÕES
7.2.1 ALTO CUSTO ASSOCIADO À TERAPÊUTICA DO EXOSSOMO
7.2.2 FALTA DE REQUISITOS DE AUTENTICAÇÃO PARA ISOLAMENTO DE EXOSSOMOS
7.2.3 RISCOS OBSERVADOS DURANTE O USO DE TERAPÊUTICOS COM EXOSSOMOS
7.2.4 NECESSIDADES MÉDICAS NÃO ATENDIDAS
7.3 OPORTUNIDADES
7.3.1 AUMENTAR O USO DA TERAPIA ANTI-ENVELHECIMENTO
7.3.2 INICIATIVAS ESTRATÉGICAS DOS ATORES DO MERCADO
7.3.3 AUMENTO DAS DESPESAS COM SAÚDE
7.3.4 DISPONIBILIDADE DE VÁRIAS TÉCNICAS DE ISOLAMENTO E PURIFICAÇÃO DE EXOSSOMOS
7.3.5 VALOR TERAPÊUTICO PROGRESSIVO DO EXOSSOMO
7.4 DESAFIOS
7.4.1 A ESCASSEZ DE PROFISSIONAIS QUALIFICADOS NECESSÁRIOS PARA O ISOLAMENTO DE EXOSSOMAS
7.4.2 APROVAÇÃO TARDIA ASSOCIADA A LANÇAMENTOS DE PRODUTOS
8 IMPACTO DA COVID-19 NO MERCADO DE TERAPÊUTICOS DE EXOSSOMOS DA ÁSIA-PACÍFICO
8.1 IMPACTO NO PREÇO
8.2 IMPACTO NA DEMANDA
8.3 IMPACTO NA CADEIA DE SUPRIMENTOS
8.4 DECISÕES ESTRATÉGICAS DOS FABRICANTES
8.5 CONCLUSÃO
9 MERCADO DE TERAPÊUTICOS DE EXOSSOMOS DA ÁSIA-PACÍFICO, POR TIPO
9.1 VISÃO GERAL
9.2 EXOSSOMOS NATURAIS
9.2.1 EXOSSOMOS AUTÓLOGOS
9.2.2 EXOSSOMOS EXÓGENOS
9.3 EXOSSOMOS HÍBRIDOS
10 MERCADO DE TERAPÊUTICOS EXOSSOMÁTICOS DA ÁSIA-PACÍFICO, POR FONTE
10.1 VISÃO GERAL
10.2 CÉLULAS-TRONCO MESENQUIMAIS
10.3 SANGUE
10.3.1 LINFÓCITOS T
10.3.2 OUTROS
10.4 FLUIDOS CORPORAIS
10.4.1 LÍQUIDO AMNIÓTICO
10.4.2 SÊMEN
10.4.3 LÍQUIDO SINOVIAL
10.4.4 OUTROS
10.5 URINA
10.6 CÉLULAS DENDRÍTICAS
10.7 SALIVA
10.8 LEITE
10.9 OUTROS
11 MERCADO DE TERAPÊUTICOS DE EXOSSOMOS DA ÁSIA-PACÍFICO, POR TERAPIA
11.1 VISÃO GERAL
11.2 IMUNOTERAPIA
11.3 TERAPIA GÊNICA
11.4 QUIMIOTERAPIA
12 MERCADO DE TERAPÊUTICOS EXOSSOMÁTICOS DA ÁSIA-PACÍFICO, POR CAPACIDADE DE TRANSPORTE
12.1 VISÃO GERAL
12.2 BIOMACROMOLÉCULAS
12.2.1 ÁCIDOS NUCLEICOS
12.2.2 PROTEÍNAS
12.2.3 PEPTÍDEOS
12.3 PEQUENAS MOLÉCULAS
13 MERCADO DE TERAPÊUTICOS DE EXOSSOMOS DA ÁSIA-PACÍFICO, POR APLICAÇÃO
13.1 VISÃO GERAL
13.2 DISTÚRBIOS METABÓLICOS
13.3 ONCOLOGIA
13.3.1 CÂNCER DE PULMÃO DE CÉLULAS NÃO PEQUENAS
13.3.2 CÂNCER DE MAMA
13.3.3 CÂNCER GÁSTRICO
13.3.4 CÂNCER DE CABEÇA E PESCOÇO
13.3.5 OUTROS
13.4 DISTÚRBIOS CARDÍACOS
13.5 NEUROLOGIA
13.5.1 DOENÇA DE ALZHEIMER
13.5.2 DOENÇA DE PARKINSON
13.5.3 OUTROS
13.6 DISTÚRBIOS INFLAMATÓRIOS
13.7 TRANSPLANTE DE ÓRGÃOS
13.8 DISTÚRBIOS GINECOLOGICOS
13.9 DISTÚRBIOS SANGUÍNEOS
13.1 OUTROS
14 MERCADO DE TERAPÊUTICOS EXOSSOMÁTICOS DA ÁSIA-PACÍFICO, POR VIA DE ADMINISTRAÇÃO
14.1 VISÃO GERAL
14.2 PARENTERAL
14.3 ORAL
15 MERCADO DE TERAPÊUTICOS DE EXOSSOMOS DA ÁSIA-PACÍFICO, POR USUÁRIO FINAL
15.1 VISÃO GERAL
15.2 INSTITUTOS DE PESQUISA E ACADÊMICOS
15.3 HOSPITAIS
15.4 CENTROS DE DIAGNÓSTICO
16 MERCADO DE TERAPÊUTICOS DE EXOSSOMOS DA ÁSIA-PACÍFICO, POR REGIÃO
16.1 ÁSIA-PACÍFICO
16.1.1 COREIA DO SUL
16.1.2 AUSTRÁLIA
16.1.3 HONG-KONG
16.1.4 RESTANTE DA ÁSIA-PACÍFICO
17 MERCADO DE TERAPÊUTICOS DE EXOSSOMOS DA ÁSIA-PACÍFICO: CENÁRIO DA EMPRESA
17.1 ANÁLISE DE AÇÕES DA EMPRESA: ÁSIA-PACÍFICO
18 PERFIL DA EMPRESA
18.1 LABORATÓRIOS KIMERA
18.1.1 RESUMO DA EMPRESA
18.1.2 ANÁLISE DAS AÇÕES DA EMPRESA
18.1.3 PORTFÓLIO DE PRODUTOS
18.1.4 DESENVOLVIMENTOS RECENTES
18.2 GRUPO DE CÉLULAS-TRONCO
18.2.1 RESUMO DA EMPRESA
18.2.2 ANÁLISE DE AÇÕES DA EMPRESA
18.2.3 PORTFÓLIO DE PRODUTOS
18.2.4 DESENVOLVIMENTOS RECENTES
18.3 AEGLE TERAPÊUTICA
18.3.1 RESUMO DA EMPRESA
18.3.2 PORTFÓLIO DE PRODUTOS
18.3.3 DESENVOLVIMENTOS RECENTES
18.4 AVALON GLOBOCARE CORP.(2021)
18.4.1 RESUMO DA EMPRESA
18.4.2 ANÁLISE DE RECEITA
18.4.3 PORTFÓLIO DE PRODUTOS
18.4.4 DESENVOLVIMENTOS RECENTES
18.5 CAPRICOR TERAPÊUTICOS (2021)
18.5.1 RESUMO DA EMPRESA
18.5.2 ANÁLISE DE RECEITA
18.5.3 PORTFÓLIO DE PRODUTOS
18.5.4 DESENVOLVIMENTOS RECENTES
18.6 CODIAK (2021)
18.6.1 RESUMO DA EMPRESA
18.6.2 REVENUE ANALYSIS
18.6.3 PRODUCT PORTFOLIO
18.6.4 RECENT DEVELOPMENTS
18.7 EXOSOME SCIENCES (A SUBSIDIARY OF AETHLON MEDICAL) (2021)
18.7.1 COMPANY SNAPSHOT
18.7.2 REVENUE ANALYSIS
18.7.3 PRODUCT PORTFOLIO
18.7.4 RECENT DEVELOPMENTS NO RECENT DEVELOPMENTS
18.8 EXOPHARM
18.8.1 COMPANY SNAPSHOT
18.8.2 PRODUCT PORTFOLIO
18.8.3 RECENT DEVELOPMENTS
18.9 EVOX THERAPEUTICS
18.9.1 COMPANY SNAPSHOT
18.9.2 PRODUCT PORTFOLIO
18.9.3 RECENT DEVELOPMENTS
18.1 EV THERAPEUTICS
18.10.1 COMPANY SNAPSHOT
18.10.2 PRODUCT PORTFOLIO
18.10.3 RECENT DEVELOPMENTS
18.11 JAZZ PHARMACEUTICALS, INC
18.11.1 COMPANY SNAPSHOT
18.11.2 REVENUE ANALYSIS
18.11.3 PRODUCT PORTFOLIO
18.11.4 RECENT DEVELOPMENTS
18.12 RENEURON GROUP PLC
18.12.1 COMPANY SNAPSHOT
18.12.2 REVENUE ANALYSIS
18.12.3 PRODUCT PORTFOLIO
18.12.4 RECENT DEVELOPMENTS
18.13 STEM CELL MEDICINE
18.13.1 COMPANY SNAPSHOT
18.13.2 PRODUCT PORTFOLIO
18.13.3 RECENT DEVELOPMENTS
19 QUESTIONNAIRE
20 RELATED REPORTS
Lista de Tabela
TABELA 1 ANÁLISE DO MERCADO DE TERAPÊUTICOS DE EXOSSOMOS DA ÁSIA-PACÍFICO
TABELA 2 MERCADO DE TERAPÊUTICOS DE EXOSSOMOS DA ÁSIA-PACÍFICO, POR TIPO, 2020-2029 (MIL USD)
TABELA 3 EXOSSOMOS NATURAIS DA ÁSIA-PACÍFICO NO MERCADO DE TERAPÊUTICOS DE EXOSSOMOS, POR REGIÃO, 2020-2029 (MIL USD)
TABELA 4 EXOSSOMOS NATURAIS DA ÁSIA-PACÍFICO NO MERCADO DE TERAPÊUTICOS DE EXOSSOMOS, POR TIPO, 2020-2029 (MIL USD)
TABELA 5 EXOSSOMOS HÍBRIDOS DA ÁSIA-PACÍFICO NO MERCADO DE TERAPÊUTICOS DE EXOSSOMOS, POR REGIÃO, 2020-2029 (MIL USD)
TABELA 6 MERCADO DE TERAPÊUTICOS DE EXOSSOMOS DA ÁSIA-PACÍFICO, POR FONTE, 2020-2029 (MIL USD)
TABELA 7 CÉLULAS-TRONCO MESENQUIMAIS DA ÁSIA-PACÍFICO NO MERCADO DE TERAPÊUTICOS DE EXOSSOMOS, POR REGIÃO, 2020-2029 (MIL USD)
TABELA 8 SANGUE DA ÁSIA-PACÍFICO NO MERCADO DE TERAPÊUTICOS DE EXOSSOMOS, POR REGIÃO, 2020-2029 (MIL USD)
TABELA 9 SANGUE DA ÁSIA-PACÍFICO NO MERCADO DE TERAPÊUTICOS DE EXOSSOMOS, POR FONTE, 2020-2029 (MIL USD)
TABELA 10 FLUIDOS CORPORAIS DA ÁSIA-PACÍFICO NO MERCADO DE TERAPÊUTICOS DE EXOSSOMOS, POR REGIÃO, 2020-2029 (MIL USD)
TABELA 11 SANGUE DA ÁSIA-PACÍFICO NO MERCADO DE TERAPÊUTICOS DE EXOSSOMOS, POR FONTE, 2020-2029 (MIL USD)
TABELA 12 URINA DA ÁSIA-PACÍFICO NO MERCADO DE TERAPÊUTICOS DE EXOSSOMOS, POR REGIÃO, 2020-2029 (MIL USD)
TABELA 13 CÉLULAS DENDRÍTICAS DA ÁSIA-PACÍFICO NO MERCADO DE TERAPÊUTICOS DE EXOSSOMOS, POR REGIÃO, 2020-2029 (MIL USD)
TABELA 14 SALIVA DA ÁSIA-PACÍFICO NO MERCADO DE TERAPÊUTICOS DE EXOSSOMOS, POR REGIÃO, 2020-2029 (MIL USD)
TABELA 15 LEITE DA ÁSIA-PACÍFICO NO MERCADO DE TERAPÊUTICOS DE EXOSSOMOS, POR REGIÃO, 2020-2029 (MIL USD)
TABELA 16 OUTROS MERCADOS DE TERAPÊUTICOS DE EXOSSOMOS NA ÁSIA E PACÍFICO, POR REGIÃO, 2020-2029 (MIL USD)
TABELA 17 MERCADO DE TERAPÊUTICOS DE EXOSSOMOS DA ÁSIA-PACÍFICO, POR TERAPIA, 2020-2029 (MIL USD)
TABELA 18 IMUNOTERAPIA NA ÁSIA-PACÍFICO NO MERCADO DE TERAPÊUTICOS DE EXOSSOMOS, POR REGIÃO, 2020-2029 (MIL USD)
TABELA 19 TERAPIA GÊNICA NA ÁSIA-PACÍFICO NO MERCADO DE TERAPÊUTICOS DE EXOSSOMOS, POR REGIÃO, 2020-2029 (MIL USD)
TABELA 20 QUIMIOTERAPIA NA ÁSIA-PACÍFICO NO MERCADO DE TERAPÊUTICOS DE EXOSSOMOS, POR REGIÃO, 2020-2029 (MIL USD)
TABELA 21 MERCADO DE TERAPÊUTICOS DE EXOSSOMOS DA ÁSIA-PACÍFICO, POR CAPACIDADE DE TRANSPORTE, 2020-2029 (MIL USD)
TABELA 22 BIOMACROMOLÉCULAS DA ÁSIA-PACÍFICO NO MERCADO DE TERAPÊUTICOS DE EXOSSOMOS, POR REGIÃO, 2020-2029 (MIL USD)
TABELA 23 BIOMACROMOLÉCULAS DA ÁSIA-PACÍFICO NO MERCADO DE TERAPÊUTICOS DE EXOSSOMOS, POR CAPACIDADE DE TRANSPORTE, 2020-2029 (MIL USD)
TABELA 24 PEQUENAS MOLÉCULAS DA ÁSIA-PACÍFICO NO MERCADO DE TERAPÊUTICOS DE EXOSSOMOS, POR REGIÃO, 2020-2029 (MIL USD)
TABELA 25 MERCADO DE TERAPÊUTICOS DE EXOSSOMOS DA ÁSIA-PACÍFICO, POR APLICAÇÃO, 2020-2029 (MIL USD)
TABELA 26 DISTÚRBIOS METABÓLICOS NA ÁSIA-PACÍFICO NO MERCADO DE TERAPÊUTICOS DE EXOSSOMOS, POR REGIÃO, 2020-2029 (MIL USD)
TABELA 27 ONCOLOGIA NA ÁSIA-PACÍFICO NO MERCADO DE TERAPÊUTICOS DE EXOSSOMOS, POR REGIÃO, 2020-2029 (MIL USD)
TABELA 28 ONCOLOGIA DA ÁSIA-PACÍFICA NO MERCADO DE TERAPÊUTICOS DE EXOSSOMOS DA ÁSIA-PACÍFICO, POR APLICAÇÃO, 2020-2029 (MIL USD)
TABELA 29 DISTÚRBIOS CARDÍACOS NA ÁSIA-PACÍFICO NO MERCADO DE TERAPÊUTICOS DE EXOSSOMOS, POR REGIÃO, 2020-2029 (MIL USD)
TABELA 30 NEUROLOGIA DA ÁSIA-PACÍFICO NO MERCADO DE TERAPÊUTICA DE EXOSSOMOS, POR REGIÃO, 2020-2029 (MIL USD)
TABELA 31 NEUROLOGIA DA ÁSIA-PACÍFICO NO MERCADO DE TERAPÊUTICOS DE EXOSSOMOS, POR APLICAÇÃO, 2020-2029 (MIL USD)
TABELA 32 DISTÚRBIOS INFLAMATÓRIOS DA ÁSIA-PACÍFICO NO MERCADO DE TERAPÊUTICOS DE EXOSSOMOS, POR REGIÃO, 2020-2029 (MIL USD)
TABELA 33 TRANSPLANTE DE ÓRGÃOS NA ÁSIA-PACÍFICO NO MERCADO DE TERAPÊUTICOS DE EXOSSOMOS, POR REGIÃO, 2020-2029 (MIL USD)
TABELA 34 DISTÚRBIOS GINECOLOGICOS NA ÁSIA-PACÍFICO NO MERCADO DE TERAPÊUTICOS DE EXOSSOMOS, POR REGIÃO, 2020-2029 (MIL USD)
TABELA 35 DISTÚRBIOS SANGUÍNEOS NA ÁSIA-PACÍFICO NO MERCADO DE TERAPÊUTICOS DE EXOSSOMOS, POR REGIÃO, 2020-2029 (MIL USD)
TABELA 36 ÁSIA-PACÍFICO OUTROS NO MERCADO DE TERAPÊUTICOS DE EXOSSOMOS, POR REGIÃO, 2020-2029 (MIL USD)
TABELA 37 MERCADO DE TERAPÊUTICOS DE EXOSSOMOS DA ÁSIA-PACÍFICO, POR VIA DE ADMINISTRAÇÃO, 2020-2029 (MIL USD)
TABELA 38 TERAPÊUTICA PARENTERAL NO MERCADO DA ÁSIA-PACÍFICO, POR REGIÃO, 2020-2029 (MIL USD)
TABELA 39 MERCADO DE TERAPÊUTICOS ORAL NA ÁSIA-PACÍFICO EM EXOSSOMOS, POR REGIÃO, 2020-2029 (MIL USD)
TABELA 40 MERCADO DE TERAPÊUTICOS DE EXOSSOMOS NA ÁSIA-PACÍFICO, POR USUÁRIO FINAL, 2020-2029 (MIL USD)
TABELA 41 INSTITUTOS ACADÊMICOS E DE PESQUISA DA ÁSIA-PACÍFICO NO MERCADO DE TERAPÊUTICA DE EXOSSOMOS, POR REGIÃO, 2020-2029 (MIL USD)
TABELA 42 HOSPITAIS DA ÁSIA-PACÍFICO NO MERCADO DE TERAPÊUTICA DE EXOSSOMOS, POR REGIÃO, 2020-2029 (MIL USD)
TABELA 43 CENTROS DE DIAGNÓSTICO DA ÁSIA-PACÍFICO NO MERCADO DE TERAPÊUTICA DE EXOSSOMOS, POR REGIÃO, 2020-2029 (MIL USD)
TABELA 44 MERCADO DE TERAPÊUTICOS DE EXOSSOMOS NA ÁSIA-PACÍFICO, POR PAÍS, 2019-2029 (MIL USD)
TABELA 45 MERCADO DE TERAPÊUTICOS DE EXOSSOMOS NA ÁSIA-PACÍFICO, POR TIPO, 2020-2029 (MIL USD)
TABELA 46 EXOSSOMO NATURAL DA ÁSIA-PACÍFICO NO MERCADO DE TERAPÊUTICOS DE EXOSSOMO, POR TIPO, 2020-2029 (MIL USD)
TABELA 47 MERCADO DE TERAPÊUTICOS DE EXOSSOMOS NA ÁSIA-PACÍFICO, POR FONTE, 2020-2029 (MIL USD)
TABELA 48 SANGUE NA ÁSIA-PACÍFICO NO MERCADO DE TERAPÊUTICOS DE EXOSSOMOS, POR FONTE, 2020-2029 (MIL USD)
TABELA 49 FLUIDOS CORPORAIS DA ÁSIA-PACÍFICO NO MERCADO DE TERAPÊUTICOS DE EXOSSOMOS, POR FONTE, 2020-2029 (MIL USD)
TABELA 50 MERCADO DE TERAPÊUTICOS DE EXOSSOMOS DA ÁSIA-PACÍFICO, POR TERAPIA, 2020-2029 (MIL USD)
TABELA 51 MERCADO DE TERAPÊUTICOS DE EXOSSOMOS DA ÁSIA-PACÍFICO, POR CAPACIDADE DE TRANSPORTE, 2020-2029 (MIL USD)
TABELA 52 BIOMACROMOLÉCULAS DA ÁSIA-PACÍFICO NO MERCADO DE TERAPÊUTICOS DE EXOSSOMOS, POR CAPACIDADE DE TRANSPORTE, 2020-2029 (MIL USD)
TABELA 53 MERCADO DE TERAPÊUTICOS DE EXOSSOMOS NA ÁSIA-PACÍFICO, POR APLICAÇÃO, 2020-2029 (MIL USD)
TABELA 54 ONCOLOGIA NA ÁSIA-PACÍFICO NO MERCADO DE TERAPÊUTICOS DE EXOSSOMOS, POR APLICAÇÃO, 2020-2029 (MIL USD)
TABELA 55 NEUROLOGIA DA ÁSIA-PACÍFICO NO MERCADO DE TERAPÊUTICOS DE EXOSSOMOS, POR APLICAÇÃO, 2020-2029 (MIL USD)
TABELA 56 MERCADO DE TERAPÊUTICOS EXOSSOMÁTICOS DA ÁSIA-PACÍFICO, POR VIA DE ADMINISTRAÇÃO, 2020-2029 (MIL USD)
TABELA 57 MERCADO DE TERAPÊUTICOS DE EXOSSOMOS NA ÁSIA-PACÍFICO, POR USUÁRIO FINAL, 2020-2029 (MIL USD)
TABELA 58 MERCADO DE TERAPÊUTICOS DE EXOSSOMOS DA COREIA DO SUL, POR TIPO, 2020-2029 (MIL USD)
TABELA 59 EXOSSOMO NATURAL DA COREIA DO SUL NO MERCADO DE TERAPÊUTICOS DE EXOSSOMO, POR TIPO, 2020-2029 (MIL USD)
TABELA 60 MERCADO DE TERAPÊUTICOS DE EXOSSOMOS DA COREIA DO SUL, POR FONTE, 2020-2029 (MIL USD)
TABELA 61 SANGUE DA COREIA DO SUL NO MERCADO DE TERAPÊUTICOS DE EXOSSOMOS, POR FONTE, 2020-2029 (MIL USD)
TABELA 62 FLUIDOS CORPORAIS NO MERCADO DE TERAPÊUTICOS DE EXOSSOMOS DA COREIA DO SUL, POR FONTE, 2020-2029 (MIL USD)
TABELA 63 MERCADO DE TERAPÊUTICOS DE EXOSSOMOS DA COREIA DO SUL, POR TERAPIA, 2020-2029 (MIL USD)
TABELA 64 MERCADO DE TERAPÊUTICOS DE EXOSSOMOS DA COREIA DO SUL, POR CAPACIDADE DE TRANSPORTE, 2020-2029 (MIL USD)
TABELA 65 BIOMACROMOLÉCULAS DA COREIA DO SUL NO MERCADO DE TERAPÊUTICOS DE EXOSSOMOS, POR CAPACIDADE DE TRANSPORTE, 2020-2029 (MIL USD)
TABELA 66 MERCADO DE TERAPÊUTICOS DE EXOSSOMOS DA COREIA DO SUL, POR APLICAÇÃO, 2020-2029 (MIL USD)
TABELA 67 ONCOLOGIA DA COREIA DO SUL NO MERCADO DE TERAPÊUTICOS DE EXOSSOMOS, POR APLICAÇÃO, 2020-2029 (MIL USD)
TABELA 68 NEUROLOGIA DA COREIA DO SUL NO MERCADO DE TERAPÊUTICOS DE EXOSSOMOS, POR APLICAÇÃO, 2020-2029 (MIL USD)
TABELA 69 MERCADO DE TERAPÊUTICOS DE EXOSSOMOS DA COREIA DO SUL, POR VIA DE ADMINISTRAÇÃO, 2020-2029 (MIL USD)
TABELA 70 MERCADO DE TERAPÊUTICOS DE EXOSSOMOS DA COREIA DO SUL, POR USUÁRIO FINAL, 2020-2029 (MIL USD)
TABELA 71 MERCADO AUSTRALIANO DE TERAPÊUTICOS DE EXOSSOMOS, POR TIPO, 2020-2029 (MIL USD)
TABELA 72 EXOSSOMO NATURAL DA AUSTRÁLIA NO MERCADO DE TERAPÊUTICOS DE EXOSSOMO, POR TIPO, 2020-2029 (MIL USD)
TABELA 73 MERCADO DE TERAPÊUTICOS DE EXOSSOMOS NA AUSTRÁLIA, POR FONTE, 2020-2029 (MIL USD)
TABELA 74 SANGUE NA AUSTRÁLIA NO MERCADO DE TERAPÊUTICOS DE EXOSSOMOS, POR FONTE, 2020-2029 (MIL USD)
TABELA 75 FLUIDOS CORPORAIS NO MERCADO DE TERAPÊUTICOS DE EXOSSOMOS DA AUSTRÁLIA, POR FONTE, 2020-2029 (MIL USD)
TABELA 76 MERCADO DE TERAPÊUTICOS DE EXOSSOMOS DA AUSTRÁLIA, POR TERAPIA, 2020-2029 (MIL USD)
TABELA 77 MERCADO DE TERAPÊUTICOS DE EXOSSOMOS NA AUSTRÁLIA, POR CAPACIDADE DE TRANSPORTE, 2020-2029 (MIL USD)
TABELA 78 BIOMACROMOLÉCULAS NA AUSTRÁLIA NO MERCADO DE TERAPÊUTICOS DE EXOSSOMOS, POR CAPACIDADE DE TRANSPORTE, 2020-2029 (MIL USD)
TABELA 79 MERCADO AUSTRALIANO DE TERAPÊUTICOS DE EXOSSOMOS, POR APLICAÇÃO, 2020-2029 (MIL USD)
TABELA 80 ONCOLOGIA NA AUSTRÁLIA NO MERCADO DE TERAPÊUTICOS DE EXOSSOMOS, POR APLICAÇÃO, 2020-2029 (MIL USD)
TABELA 81 NEUROLOGIA NA AUSTRÁLIA NO MERCADO DE TERAPÊUTICOS DE EXOSSOMOS, POR APLICAÇÃO, 2020-2029 (MIL USD)
TABELA 82 MERCADO DE TERAPÊUTICOS DE EXOSSOMOS DA AUSTRÁLIA, POR VIA DE ADMINISTRAÇÃO, 2020-2029 (MIL USD)
TABELA 83 MERCADO DE TERAPÊUTICOS DE EXOSSOMOS NA AUSTRÁLIA, POR USUÁRIO FINAL, 2020-2029 (MIL USD)
TABELA 84 MERCADO DE TERAPÊUTICOS DE EXOSSOMOS DE HONG KONG, POR TIPO, 2020-2029 (MIL USD)
TABELA 85 EXOSSOMO NATURAL DE HONG KONG NO MERCADO DE TERAPÊUTICOS DE EXOSSOMO, POR TIPO, 2020-2029 (MIL USD)
TABELA 86 MERCADO DE TERAPÊUTICOS DE EXOSSOMOS DE HONG KONG, POR FONTE, 2020-2029 (MIL USD)
TABELA 87 SANGUE DE HONG KONG NO MERCADO DE TERAPÊUTICOS DE EXOSSOMOS, POR FONTE, 2020-2029 (MIL USD)
TABELA 88 FLUIDOS CORPORAIS DE HONG KONG NO MERCADO DE TERAPÊUTICOS DE EXOSSOMOS, POR FONTE, 2020-2029 (MIL USD)
TABELA 89 MERCADO DE TERAPÊUTICOS DE EXOSSOMOS DE HONG KONG, POR TERAPIA, 2020-2029 (MIL USD)
TABELA 90 MERCADO DE TERAPÊUTICOS DE EXOSSOMOS DE HONG KONG, POR CAPACIDADE DE TRANSPORTE, 2020-2029 (MIL USD)
TABELA 91 BIOMACROMOLÉCULAS DE HONG KONG NO MERCADO DE TERAPÊUTICOS DE EXOSSOMOS, POR CAPACIDADE DE TRANSPORTE, 2020-2029 (MIL USD)
TABELA 92 MERCADO DE TERAPÊUTICOS DE EXOSSOMOS DE HONG KONG, POR APLICAÇÃO, 2020-2029 (MIL USD)
TABELA 93 ONCOLOGIA DE HONG KONG NO MERCADO DE TERAPÊUTICOS DE EXOSSOMOS, POR APLICAÇÃO, 2020-2029 (MIL USD)
TABELA 94 NEUROLOGIA DE HONG KONG NO MERCADO DE TERAPÊUTICOS DE EXOSSOMOS, POR APLICAÇÃO, 2020-2029 (MIL USD)
TABELA 95 MERCADO DE TERAPÊUTICOS DE EXOSSOMOS DE HONG KONG, POR VIA DE ADMINISTRAÇÃO, 2020-2029 (MIL USD)
TABELA 96 MERCADO DE TERAPÊUTICOS DE EXOSSOMOS DE HONG KONG, POR USUÁRIO FINAL, 2020-2029 (MIL USD)
TABELA 97 RESTANTE DO MERCADO DE TERAPÊUTICOS DE EXOSSOMOS DA ÁSIA-PACÍFICO, POR TIPO, 2020-2029 (MIL USD)
Lista de Figura
FIGURA 1 MERCADO DE TERAPÊUTICOS DE EXOSSOMOS DA ÁSIA-PACÍFICO: SEGMENTAÇÃO
FIGURA 2 MERCADO DE TERAPÊUTICOS DE EXOSSOMOS DA ÁSIA-PACÍFICO: TRIANGULAÇÃO DE DADOS
FIGURA 3 MERCADO DE TERAPÊUTICOS DE EXOSSOMOS DA ÁSIA-PACÍFICO: ANÁLISE DROC
FIGURA 4 MERCADO DE TERAPÊUTICOS DE EXOSSOMOS DA ÁSIA-PACÍFICO: ANÁLISE DE MERCADO DA ÁSIA-PACÍFICO VS MERCADO REGIONAL
FIGURA 5 MERCADO DE TERAPÊUTICOS DE EXOSSOMOS DA ÁSIA-PACÍFICO: ANÁLISE DE PESQUISA DA EMPRESA
FIGURA 6 MERCADO DE TERAPÊUTICOS DE EXOSSOMOS DA ÁSIA-PACÍFICO: DEMOGRAFIA DA ENTREVISTA
FIGURA 7 MERCADO DE TERAPÊUTICOS DE EXOSSOMOS DA ÁSIA-PACÍFICO: GRADE DE POSIÇÃO DE DBMR
FIGURA 8 MERCADO DE TERAPÊUTICOS DE EXOSSOMOS DA ÁSIA-PACÍFICO: ANÁLISE DA PARTICIPAÇÃO DE FORNECEDORES
FIGURA 9 MERCADO DE TERAPÊUTICOS DE EXOSSOMOS DA ÁSIA-PACÍFICO: GRADE DE COBERTURA DO USUÁRIO FINAL
FIGURA 10 MERCADO DE TERAPÊUTICOS DE EXOSSOMOS DA ÁSIA-PACÍFICO: SEGMENTAÇÃO
FIGURA 11 O AUMENTO DA PREVALÊNCIA DE DOENÇAS AUTOIMUNES, DOENÇAS DE LYME, INCIDÊNCIA DE CÂNCER E O AUMENTO DOS AVANÇOS TECNOLÓGICOS DEVEM IMPULSIONAR O MERCADO DE TERAPÊUTICOS DE EXOSSOMOS DA ÁSIA-PACÍFICO DE 2022 A 2029
FIGURA 12 O SEGMENTO TIPO DEVE TER A MAIOR PARCIALIDADE DO MERCADO DE TERAPÊUTICOS DE EXOSSOMOS DA ÁSIA-PACÍFICO EM 2022 E 2029
FIGURA 13 MOTIVADORES, RESTRIÇÕES, OPORTUNIDADES E DESAFIOS DO MERCADO DE TERAPÊUTICOS DE EXOSSOMOS DA ÁSIA-PACÍFICO
FIGURA 14 PREVALÊNCIA DE ESCLEROSE MÚLTIPLA NAS REGIÕES DA ORGANIZAÇÃO MUNDIAL DA SAÚDE (OMS) EM 2020.
FIGURA 15 TAXA DE INCIDÊNCIA DE CÂNCER NA AUSTRÁLIA E EM OUTROS PAÍSES (2020)
FIGURA 16 MERCADO DE TERAPÊUTICOS DE EXOSSOMOS DA ÁSIA-PACÍFICO: POR TIPO, 2021
FIGURA 17 MERCADO DE TERAPÊUTICOS DE EXOSSOMOS DA ÁSIA-PACÍFICO: POR TIPO, 2020-2029 (MIL USD)
FIGURA 18 MERCADO DE TERAPÊUTICOS DE EXOSSOMOS DA ÁSIA-PACÍFICO: POR TIPO, CAGR (2022-2029)
FIGURA 19 MERCADO DE TERAPÊUTICOS DE EXOSSOMOS DA ÁSIA-PACÍFICO: POR TIPO, CURVA DE LINHA DE SALVAÇÃO
FIGURA 20 MERCADO DE TERAPÊUTICOS DE EXOSSOMOS DA ÁSIA-PACÍFICO: POR FONTE, 2021
FIGURA 21 MERCADO DE TERAPÊUTICOS DE EXOSSOMOS DA ÁSIA-PACÍFICO: POR FONTE, 2020-2029 (MIL USD)
FIGURA 22 MERCADO DE TERAPÊUTICOS DE EXOSSOMOS DA ÁSIA-PACÍFICO: POR FONTE, CAGR (2022-2029)
FIGURA 23 MERCADO DE TERAPÊUTICOS DE EXOSSOMOS DA ÁSIA-PACÍFICO: POR FONTE, CURVA DA LINHA DE SALVAÇÃO
FIGURA 24 MERCADO DE TERAPÊUTICOS DE EXOSSOMOS DA ÁSIA-PACÍFICO: POR TERAPIA, 2021
FIGURA 25 MERCADO DE TERAPÊUTICOS DE EXOSSOMOS DA ÁSIA-PACÍFICO: POR TERAPIA, 2020-2029 (MIL USD)
FIGURA 26 MERCADO DE TERAPÊUTICOS DE EXOSSOMOS DA ÁSIA-PACÍFICO: POR TERAPIA, CAGR (2022-2029)
FIGURA 27 MERCADO DE TERAPÊUTICOS DE EXOSSOMOS DA ÁSIA-PACÍFICO: POR TERAPIA, CURVA DE LINHA DE SALVAÇÃO
FIGURA 28 MERCADO DE TERAPÊUTICOS DE EXOSSOMOS DA ÁSIA-PACÍFICO: POR CAPACIDADE DE TRANSPORTE, 2021
FIGURA 29 MERCADO DE TERAPÊUTICOS DE EXOSSOMOS DA ÁSIA-PACÍFICO: POR CAPACIDADE DE TRANSPORTE, 2020-2029 (MIL USD)
FIGURA 30 MERCADO DE TERAPÊUTICOS DE EXOSSOMOS DA ÁSIA-PACÍFICO: POR CAPACIDADE DE TRANSPORTE, CAGR (2022-2029)
FIGURA 31 MERCADO DE TERAPÊUTICOS DE EXOSSOMOS DA ÁSIA-PACÍFICO: POR CAPACIDADE DE TRANSPORTE, CURVA DA LINHA DE SALVAÇÃO
FIGURA 32 MERCADO DE TERAPÊUTICOS DE EXOSSOMOS DA ÁSIA-PACÍFICO: POR APLICAÇÃO, 2021
FIGURA 33 MERCADO DE TERAPÊUTICOS DE EXOSSOMOS DA ÁSIA-PACÍFICO: POR APLICAÇÃO, 2020-2029 (MIL USD)
FIGURA 34 MERCADO DE TERAPÊUTICOS DE EXOSSOMOS DA ÁSIA-PACÍFICO: POR APLICAÇÃO, CAGR (2022-2029)
FIGURA 35 MERCADO DE TERAPÊUTICOS DE EXOSSOMOS DA ÁSIA-PACÍFICO: POR APLICAÇÃO, CURVA DE LINHA DE VIDA
FIGURA 36 MERCADO DE TERAPÊUTICOS DE EXOSSOMOS DA ÁSIA-PACÍFICO: POR VIA DE ADMINISTRAÇÃO, 2021
FIGURA 37 MERCADO DE TERAPÊUTICOS DE EXOSSOMOS DA ÁSIA-PACÍFICO: POR VIA DE ADMINISTRAÇÃO, 2020-2029 (MIL USD)
FIGURA 38 MERCADO DE TERAPÊUTICOS DE EXOSSOMOS DA ÁSIA-PACÍFICO: POR VIA DE ADMINISTRAÇÃO, CAGR (2022-2029)
FIGURA 39 MERCADO DE TERAPÊUTICOS DE EXOSSOMOS DA ÁSIA-PACÍFICO: POR VIA DE ADMINISTRAÇÃO, CURVA DA LINHA DE SALVAÇÃO
FIGURA 40 MERCADO DE TERAPÊUTICOS DE EXOSSOMOS DA ÁSIA-PACÍFICO: POR USUÁRIO FINAL, 2021
FIGURA 41 MERCADO DE TERAPÊUTICOS DE EXOSSOMOS DA ÁSIA-PACÍFICO: POR USUÁRIO FINAL, 2020-2029 (MIL USD)
FIGURA 42 MERCADO DE TERAPÊUTICOS DE EXOSSOMOS DA ÁSIA-PACÍFICO: POR USUÁRIO FINAL, CAGR (2022-2029)
FIGURA 43 MERCADO DE TERAPÊUTICOS DE EXOSSOMOS DA ÁSIA-PACÍFICO: POR USUÁRIO FINAL, CURVA DE LINHA DE SALVAÇÃO
FIGURA 44 MERCADO DE TERAPÊUTICOS DE EXOSSOMOS DA ÁSIA-PACÍFICO: RESUMO (2021)
FIGURA 45 MERCADO DE TERAPÊUTICOS DE EXOSSOMOS DA ÁSIA-PACÍFICO: POR PAÍS (2021)
FIGURA 46 MERCADO DE TERAPÊUTICOS DE EXOSSOMOS NA ÁSIA-PACÍFICO: POR PAÍS (2022 E 2029)
FIGURA 47 MERCADO DE TERAPÊUTICOS DE EXOSSOMOS DA ÁSIA-PACÍFICO: POR PAÍS (2021 E 2029)
FIGURA 48 MERCADO DE TERAPÊUTICOS DE EXOSSOMOS DA ÁSIA-PACÍFICO: POR TIPO (2022-2029)
FIGURA 49 MERCADO DE TERAPÊUTICOS DE EXOSSOMOS DA ÁSIA-PACÍFICO: PARTICIPAÇÃO DA EMPRESA EM 2021 (%)
Metodologia de Investigação
A recolha de dados e a análise do ano base são feitas através de módulos de recolha de dados com amostras grandes. A etapa inclui a obtenção de informações de mercado ou dados relacionados através de diversas fontes e estratégias. Inclui examinar e planear antecipadamente todos os dados adquiridos no passado. Da mesma forma, envolve o exame de inconsistências de informação observadas em diferentes fontes de informação. Os dados de mercado são analisados e estimados utilizando modelos estatísticos e coerentes de mercado. Além disso, a análise da quota de mercado e a análise das principais tendências são os principais fatores de sucesso no relatório de mercado. Para saber mais, solicite uma chamada de analista ou abra a sua consulta.
A principal metodologia de investigação utilizada pela equipa de investigação do DBMR é a triangulação de dados que envolve a mineração de dados, a análise do impacto das variáveis de dados no mercado e a validação primária (especialista do setor). Os modelos de dados incluem grelha de posicionamento de fornecedores, análise da linha de tempo do mercado, visão geral e guia de mercado, grelha de posicionamento da empresa, análise de patentes, análise de preços, análise da quota de mercado da empresa, normas de medição, análise global versus regional e de participação dos fornecedores. Para saber mais sobre a metodologia de investigação, faça uma consulta para falar com os nossos especialistas do setor.
Personalização disponível
A Data Bridge Market Research é líder em investigação formativa avançada. Orgulhamo-nos de servir os nossos clientes novos e existentes com dados e análises que correspondem e atendem aos seus objetivos. O relatório pode ser personalizado para incluir análise de tendências de preços de marcas-alvo, compreensão do mercado para países adicionais (solicite a lista de países), dados de resultados de ensaios clínicos, revisão de literatura, mercado remodelado e análise de base de produtos . A análise de mercado dos concorrentes-alvo pode ser analisada desde análises baseadas em tecnologia até estratégias de carteira de mercado. Podemos adicionar quantos concorrentes necessitar de dados no formato e estilo de dados que procura. A nossa equipa de analistas também pode fornecer dados em tabelas dinâmicas de ficheiros Excel em bruto (livro de factos) ou pode ajudá-lo a criar apresentações a partir dos conjuntos de dados disponíveis no relatório.

