Asia-Pacific Fat Replacers Market, By Type (Carbohydrate-Based, Protein-Based, And Fat-Based), Source (Plant And Animal), Category (Clean-Label And Conventional), Form (Liquid And Dry), Application (Bakery, Dairy Products, Sauces, Soups, & Dressings, Convenience Foods, Processed Food, Confectionery, Processed Meat, Functional Food And Others), Country (China, India, Japan, Australia, Indonesia, Singapore, South Korea, Malaysia, Thailand, Philippines, Rest of Asia-Pacific) Industry Trends and Forecast to 2029.
 Market Analysis and Insights : Asia-Pacific Fat Replacers Market
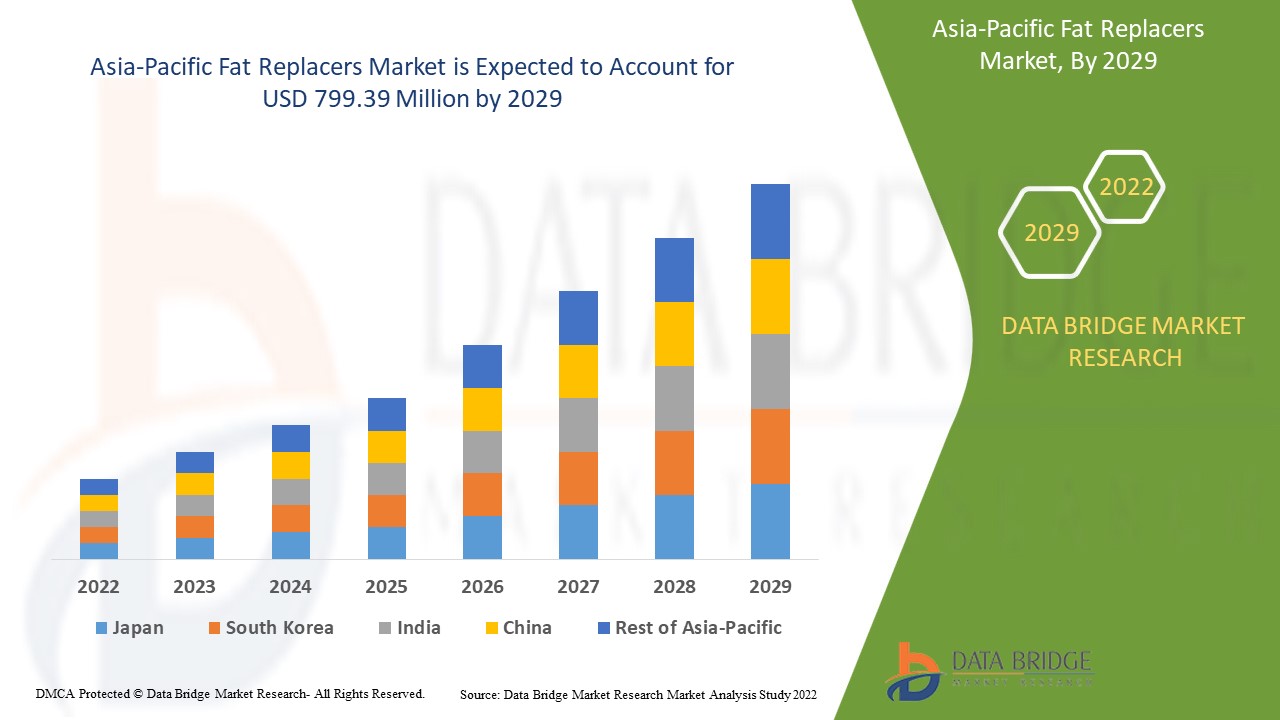
Asia-Pacific fat replacers market is expected to gain significant growth in the forecast period of 2022 to 2029. Data Bridge Market Research analyzes that the market is growing with a CAGR of 6.8% in the forecast period of 2022 to 2029 and is expected to reach USD 799.39 million by 2029. Growth in usage of fat replacers in bakery, dairy, and frozen products is expected to drive the market growth.
Fat replacers, also known as fat substitutes, are substances that replace all or portion of the fat in a diet while maintaining the same taste, texture, and mouth feel as the original full-fat food. Fat is not a single substance, but rather a collection of various substances made up of a glycerol molecule and three separate fatty acids. It is an essential component of a healthy diet. It contains the building blocks for prostaglandins, contains essential fatty acids, helps control cholesterol metabolism, transports fat-soluble vitamins and carotenoids throughout the body, and offers nine calories of energy per gram.
Fat replacers are compounds that are used to replace fat in a variety of foods and beverages. The majority of fat substitutes are reformulated versions of existing food components (starches, gums, cellulose, and others).
Fat can be found in almost any food. It imparts a distinct texture, flavor, and aroma to the dish in which it is present. While fat is necessary for life, it can be harmful to one's health if consumed in excess of physiological requirements. Diets high in fat raise the risk of heart disease, weight gain, and several cancers. The use of fat replacers in food products allows for the retention of the food's original quality characteristics while avoiding the risks associated with fat consumption. The fat replacers market is gaining significant growth due to increasing awareness among people about excessive consumption of fat, growing health consciousness among people. Increasing participation of people in weight loss management programs, growing government regulations associated with limit on daily consumption of fat, and growing usage of fat replacer in bakery, dairy, and frozen products are also boosting the growth of the global fat replacers market. However, unfavorable taste when compared to fats, and nutrition problems associated with fat substitutes are expected to restrain the growth of fat replacers market during the forecast period. Increase in consumption of convenience food and a large number of people opting dairy-free diets, and increase in research & development of fat replacers will create opportunity for the market in the forecast period. However, high prices of fat replacer products and adverse effects of fat replacers can create a massive challenge for the market.
The Asia-Pacific fat replacers market report provides details of market share, new developments, and product pipeline analysis, impact of domestic and localized market players, analyses opportunities in terms of emerging revenue pockets, changes in market regulations, product approvals, strategic decisions, product launches, geographic expansions, and technological innovations in the market. To understand the analysis and the Fat replacers market scenario contact Data Bridge Market Research for an Analyst Brief, our team will help you create a revenue impact solution to achieve your desired goal.
Asia-Pacific Fat Replacers Market Scope and Market Size
Asia-Pacific fat replacers market is segmented into five notable segments based on type, source, category, form, and application. The growth among segments helps you analyze niche pockets of growth and strategies to approach the market and determine your core application areas and the difference in your target markets.
- On the basis of type, the Asia-Pacific fat replacers market is segmented into carbohydrate-based, protein-based, and fat-based. In 2022, the carbohydrate-based segment is expected to dominate the fat replacers market due to growing demand for carbohydrate based fat replacer to mimic some of the properties of conventional fats.
- On the basis of source, the Asia-Pacific fat replacers market is segmented into plant and animal. In 2022, plant segment is expected to dominate the market due to growing vegan and vegetarian population across the globe.
- On the basis of category, the Asia-Pacific fat replacers market is segmented into clean label and conventional. In 2022, the clean label segment is expected to dominate the fat replacers market due to growing consumption of clean label ingredients.
- On the basis of form, the Asia-Pacific fat replacers market is segmented into liquid and dry. In 2022, dry segment is expected to dominate the fat replacers market as dry form fat replacers are easy to use and maintain as compared to liquid form fat replacers.
- On the basis of application, the Asia-Pacific fat replacers market is segmented into bakery, dairy products, sauces, soups, & dressings, convenience food, processed food, confectionery, processed meat, functional food, and others. In 2022, the bakery segment is expected to dominate the fat replacers market due to increasing demand for healthy snack foods with reduced fat content.
Dry segment in China is expected to grow with the highest growth rate in the forecast period of 2022 to 2029 owing to growing consumption and production of food applications that utilize fat replacers. Dry segment in Japan is growing at a significant rate due to increase in participation of people in weight loss management programs. India is fastest growing country of the Asia-Pacific market and dry segment is dominating in this country owing to rising health consciousness among people.
The country section of the report also provides individual market impacting factors and changes in regulation in the market domestically that impacts the current and future trends of the market. Data points such as new sales, replacement sales, country demographics, regulatory acts and import-export tariffs are some of the major pointers used to forecast the market scenario for individual countries. Also, presence and availability of Asia-Pacific brands and their challenges faced due to large or scarce competition from local and domestic brands, impact of sales channels are considered while providing forecast analysis of the country data.
Growing Strategic Activities by Major Players to Enhance Awareness for Fat Replacers is Boosting the Market Growth
The Asia-Pacific fat replacers market also provides you with detailed market analysis for every country growth in particular market. Additionally, it provides the detail information regarding the market players’ strategy and their geographical presence. The data is available for historic period 2010 to 2019.
Competitive Landscape and Fat Replacers Market Share Analysis
Asia-Pacific fat replacers market competitive landscape provides details by competitor. Details included are company overview, company financials, revenue generated, market potential, investment in research and development, new market initiatives, production sites and facilities, company strengths and weaknesses, product launch, product trials pipelines, product approvals, patents, product width and breadth, application dominance, and technology lifeline curve. The above data points provided are only related to the company’s focus related to fat replacers market.
The major companies which are dealing in the Asia-Pacific fat replacers market are Cargill, Incorporated, ULRICK&SHORT, Ingredion Incorporated, CP Kelco U.S., Inc, BENEO, Wilmar International Ltd, JELU-WERK J. Ehrler GmbH & Co. KG, Grain Processing Corporation, Corbion, Dupont, AVEBE, Ashland, Tate & Lyle, Kerry, among others domestic players. DBMR analysts understand competitive strengths and provide competitive analysis for each competitor separately.
Many contracts and agreements are also initiated by the companies worldwide, which are further accelerating the Asia-Pacific fat replacers market growth.
For instance,
- In October 2021, Tate & Lyle made distribution agreement with IMCD, a global leader in the sales, marketing, and distribution of specialty food ingredients and flavors in Italy. This agreement has helped the company in regional expansion
Collaborations, product launches, business expansions, awards and recognitions, joint ventures, and other strategies by the market players are enhancing the companies’ footprints in the Asia-Pacific fat replacers market.
SKU-
Obtenha acesso online ao relatório sobre a primeira nuvem de inteligência de mercado do mundo

- Painel interativo de análise de dados
- Painel de análise da empresa para oportunidades de elevado potencial de crescimento
- Acesso de analista de pesquisa para personalização e customização. consultas
- Análise da concorrência com painel interativo
- Últimas notícias, atualizações e atualizações Análise de tendências
- Aproveite o poder da análise de benchmark para um rastreio abrangente da concorrência
Índice
1 INTRODUÇÃO
1.1 OBJETIVOS DO ESTUDO
1.2 DEFINIÇÃO DE MERCADO
1.3 VISÃO GERAL DO MERCADO DE SUBSTITUTOS DE GORDURA DA ÁSIA-PACÍFICO
1.4 LIMITAÇÕES
1,5 MERCADOS COBERTOS
2 SEGMENTAÇÃO DE MERCADO
2.1 MERCADOS COBERTOS
2.2 ÂMBITO GEOGRÁFICO
2,3 ANOS CONSIDERADOS PARA O ESTUDO
2.4 MOEDA E PREÇOS
2.5 MODELO DE VALIDAÇÃO DE DADOS TRIPÉ DBMR
2.6 MODELAGEM MULTIVARIADA
2.7 TIPO DE CURVA DE LINHA DE VIDA
2.8 ENTREVISTAS PRINCIPAIS COM PRINCIPAIS LÍDERES DE OPINIÃO
2.9 GRADE DE POSIÇÃO DE MERCADO DBMR
2.1 ANÁLISE DA PARTICIPAÇÃO DO FORNECEDOR
2.11 FONTES SECUNDÁRIAS
2.12 PREMISSAS
3 RESUMO EXECUTIVO
4 INSIGHTS PREMIUM
4.1 MERCADO DE SUBSTITUTOS DE GORDURA DA ÁSIA-PACÍFICO: ESTRATÉGIAS DE CRESCIMENTO
4.2 MERCADO DE SUBSTITUTOS DE GORDURA DA ÁSIA-PACÍFICO: INFORMAÇÕES INDUSTRIAIS
5 MERCADO DE SUBSTITUTOS DE GORDURA DA ÁSIA-PACÍFICO: QUADRO REGULAMENTAR
5.1 FDA
5.1.1 REGULAMENTOS DE ETIQUETAGEM
5.1.2 OLESTRA
5.1.3 MALTODEXTRINAS
5.1.4 ROTULAGEM DE ALERGÊNICOS
5.2 UE
5.2.1 ROTULAGEM DE ALERGÊNICOS DA UE
5.2.2 VALOR NUTRICIONAL DA UE
5.2.3 ALEGAÇÃO DE SAÚDE DA UE: 'OS CARBOIDRATOS CONTRIBUEM PARA A MANUTENÇÃO DA FUNÇÃO CEREBRAL NORMAL'
5.2.4 ALEGAÇÃO DE SAÚDE DA UE: 'SOLUÇÕES DE CARBOIDRATOS E ELETRÓLITOS AUMENTAM A ABSORÇÃO DE ÁGUA DURANTE O EXERCÍCIO FÍSICO'
5.2.5 ALEGAÇÃO DE SAÚDE DA UE: 'SOLUÇÕES DE CARBOIDRATOS E ELETRÓLITOS PODEM CONTRIBUIR PARA A MANUTENÇÃO DO DESEMPENHO DE RESISTÊNCIA DURANTE EXERCÍCIOS DE RESISTÊNCIA PROLONGADOS'
5.2.6 ALEGAÇÃO DE SAÚDE DA UE: 'OS CARBOIDRATOS GLICÊMICOS CONTRIBUEM PARA A RECUPERAÇÃO DA FUNÇÃO MUSCULAR NORMAL (CONTRAÇÃO) APÓS EXERCÍCIOS EXTENSIVOS'
5.2.7 REGULAMENTO DA UE SOBRE NUTRIÇÃO INFANTIL
6 VISÃO GERAL DO MERCADO
6.1 MOTORISTAS
6.1.1 AUMENTO DA CONSCIENTIZAÇÃO DA POPULAÇÃO SOBRE O CONSUMO EXCESSIVO DE GORDURA
6.1.2 CRESCENDO A CONSCIÊNCIA SOBRE SAÚDE ENTRE AS PESSOAS
6.1.3 AUMENTO DA PARTICIPAÇÃO DE PESSOAS EM PROGRAMAS DE GESTÃO DE PERDA DE PESO
6.1.4 REGULAMENTAÇÕES GOVERNAMENTAIS CRESCENTES ASSOCIADAS AO LIMITE DE CONSUMO DIÁRIO DE GORDURA
6.1.5 CRESCENTE USO DE SUBSTITUTOS DE GORDURA EM PRODUTOS DE PADARIA, LÁCTEOS E CONGELADOS
6.2 RESTRIÇÕES
6.2.1 SABOR DESFAVORÁVEL QUANDO COMPARADO ÀS GORDURAS
6.2.2 PROBLEMAS NUTRICIONAIS ASSOCIADOS A SUBSTITUTOS DE GORDURA
6.3 OPORTUNIDADES
6.3.1 AUMENTO DO CONSUMO DE ALIMENTOS DE PRATO PRÓXIMO
6.3.2 UM GRANDE NÚMERO DE PESSOAS REGRESSANDO A DIETAS SEM LACTOSE
6.3.3 AUMENTO DA PESQUISA E DESENVOLVIMENTO DE SUBSTITUTOS DE GORDURA
6.4 DESAFIOS
6.4.1 ALTOS PREÇOS DOS PRODUTOS SUBSTITUTOS DE GORDURA
6.4.2 EFEITOS ADVERSOS DOS SUBSTITUTOS DE GORDURA
7 IMPACTO DA COVID-19 NO MERCADO DE SUBSTITUTOS DE GORDURA DA ÁSIA-PACÍFICO
7.1 CONSEQUÊNCIAS DA COVID-19 E INICIATIVAS GOVERNAMENTAIS PARA IMPULSIONAR O MERCADO DE SUBSTITUTOS DE GORDURA DA ÁSIA-PACÍFICO
7.2 DECISÕES ESTRATÉGICAS PARA FABRICANTES APÓS A COVID-19 PARA GANHAR PARTICIPAÇÃO COMPETITIVA NO MERCADO
7.3 IMPACTO NO PREÇO
7.4 IMPACTO NA DEMANDA
7.5 IMPACTO NA CADEIA DE SUPRIMENTOS
7.6 CONCLUSÃO
8 MERCADOS DE SUBSTITUTOS DE GORDURA DA ÁSIA-PACÍFICO, POR TIPO
8.1 VISÃO GERAL
8.2 À BASE DE CARBOIDRATOS
8.2.1 AMIDO
8.2.2 CELULOSE
8.2.3 GOMA
8.2.4 GELATIN
8.2.5 OUTROS
8.3 À BASE DE PROTEÍNA
8.3.1 PROTEÍNA DE SORO DE LEITE
8.3.2 PROTEÍNA DE SOJA
8.3.3 PROTEÍNA DO LEITE
8.3.4 PROTEÍNA DO OVO
8.3.5 OUTROS
8.4 À BASE DE GORDURA
8.4.1 OLESTRA
8.4.2 SALATRIM
8.4.3 CAPRENINA
8.4.4 OUTROS
9 MERCADO DE SUBSTITUTOS DE GORDURA DA ÁSIA-PACÍFICO, POR FONTE
9.1 VISÃO GERAL
9.2 PLANTA
9.3 ANIMAIS
10 MERCADOS DE SUBSTITUTOS DE GORDURA DA ÁSIA-PACÍFICO, POR CATEGORIA
10.1 VISÃO GERAL
10.2 RÓTULO LIMPO
10.3 CONVENCIONAL
11 MERCADO DE SUBSTITUTOS DE GORDURA DA ÁSIA-PACÍFICO, POR FORMA
11.1 VISÃO GERAL
11.2 SECO
11.3 LÍQUIDO
12 MERCADOS DE SUBSTITUTOS DE GORDURA DA ÁSIA-PACÍFICO, POR APLICAÇÃO
12.1 VISÃO GERAL
12.2 PADARIA
12.2.1 PADARIA, POR TIPO DE PRODUTO
12.2.1.1 PÃES E PÃEZINHOS
12.2.1.2 BOLOS, PASTÉIS E TRUFAS
12.2.1.3 COOKIES E BISCOITOS
12.2.1.4 TORTAS E TORTAS
12.2.1.5 BROWNIES
12.2.1.6 TORTILHA
12.2.1.7 OUTROS
12.2.2 PADARIA, POR TIPO
12.2.2.1 À BASE DE CARBOIDRATOS
12.2.2.2 À BASE DE PROTEÍNA
12.2.2.3 À BASE DE GORDURA
12.3 PRODUTOS LÁCTEOS
12.3.1 PRODUTOS LÁCTEOS, POR TIPO DE PRODUTO
12.3.1.1 SORVETE
12.3.1.2 IOGURTE
12.3.1.2.1 FRESCO
12.3.1.2.2 CONGELADO
12.3.1.3 LEITE
12.3.1.3.1 LEITE PROCESSADO REGULAR
12.3.1.3.2 LEITE SABORIZADO
12.3.1.4 QUEIJO
12.3.1.5 OUTROS
12.3.2 PRODUTOS LÁCTEOS, POR TIPO
12.3.2.1 À BASE DE CARBOIDRATOS
12.3.2.2 À BASE DE PROTEÍNA
12.3.2.3 À BASE DE GORDURA
12.4 COMIDA DE CONVENIÊNCIA
12.4.1 ALIMENTOS DE CONVENIÊNCIA, POR TIPO DE PRODUTO
12.4.1.1 ALIMENTOS CONGELADOS
12.4.1.2 RTE
12.4.1.3 ALIMENTOS EM CONSERVA
12.4.1.4 MACARRÃO E MASSA
12.4.1.5 CEREAIS E LANCHES
12.4.1.6 OUTROS
12.4.2 ALIMENTOS DE CONVENIÊNCIA, POR TIPO
12.4.2.1 À BASE DE CARBOIDRATOS
12.4.2.2 À BASE DE PROTEÍNA
12.4.2.3 À BASE DE GORDURA
12.5 CARNES PROCESSADAS
12.5.1 CARNES PROCESSADAS, POR TIPO
12.5.1.1 À BASE DE CARBOIDRATOS
12.5.1.2 À BASE DE PROTEÍNA
12.5.1.3 À BASE DE GORDURA
12.6 CONFEITARIA
12.6.1 CONFEITARIA, POR TIPO DE PRODUTO
12.6.1.1 CHOCOLATE
12.6.1.2 DOCES COZIDOS
12.6.1.3 GOMAS E GELATINAS
12.6.1.4 CALDAS DE CHOCOLATE
12.6.1.5 CARAMELOS E CARAMELO
12.6.1.6 MINTA
12.6.1.7 OUTROS
12.6.2 CONFEITARIA, POR TIPO
12.6.2.1 À BASE DE CARBOIDRATOS
12.6.2.2 À BASE DE PROTEÍNA
12.6.2.3 À BASE DE GORDURA
12.7 ALIMENTOS FUNCIONAIS
12.7.1 ALIMENTOS FUNCIONAIS, POR TIPO
12.7.1.1 À BASE DE CARBOIDRATOS
12.7.1.2 À BASE DE PROTEÍNA
12.7.1.3 À BASE DE GORDURA
12.8 MOLHOS, SOPAS E MOLHO
12.8.1 MOLHOS, SOPAS E MOLHO, POR TIPO
12.8.1.1 À BASE DE CARBOIDRATOS
12.8.1.2 À BASE DE PROTEÍNA
12.8.1.3 À BASE DE GORDURA
12.9 BEBIDAS
12.9.1 BEBIDAS, POR TIPO
12.9.1.1 À BASE DE CARBOIDRATOS
12.9.1.2 À BASE DE PROTEÍNA
12.9.1.3 À BASE DE GORDURA
12.1 OUTROS
12.10.1 OUTROS, POR TIPO
12.10.1.1 À BASE DE CARBOIDRATOS
12.10.1.2 À BASE DE PROTEÍNA
12.10.1.3 À BASE DE GORDURA
13 MERCADOS DE SUBSTITUTOS DE GORDURA DA ÁSIA-PACÍFICO, POR REGIÃO
13.1 ÁSIA-PACÍFICO
13.1.1 CHINA
13.1.2 ÍNDIA
13.1.3 JAPÃO
13.1.4 AUSTRÁLIA
13.1.5 INDONÉSIA
13.1.6 SINGAPURA
13.1.7 COREIA DO SUL
13.1.8 MALÁSIA
13.1.9 TAILÂNDIA
13.1.10 FILIPINAS
13.1.11 RESTANTE DA ÁSIA-PACÍFICO
14 MERCADO DE SUBSTITUTOS DE GORDURA DA ÁSIA-PACÍFICO: CENÁRIO DA EMPRESA
14.1 ANÁLISE DE AÇÕES DA EMPRESA: ÁSIA-PACÍFICO
15 ANÁLISE SWOT
16 PERFIL DA EMPRESA
16.1 CARGILL, INCORPORADA
16.1.1 RESUMO DA EMPRESA
16.1.2 ANÁLISE DE RECEITA
16.1.3 ANÁLISE DAS AÇÕES DA EMPRESA
16.1.4 PORTFÓLIO DE PRODUTOS
16.1.5 DESENVOLVIMENTOS RECENTES
16.2 WILMAR INTERNACIONAL LTDA
16.2.1 RESUMO DA EMPRESA
16.2.2 ANÁLISE DE RECEITA
16.2.3 ANÁLISE DAS AÇÕES DA EMPRESA
16.2.4 PORTFÓLIO DE PRODUTOS
16.2.5 DESENVOLVIMENTO RECENTE
16.3 DUPONT
16.3.1 RESUMO DA EMPRESA
16.3.2 ANÁLISE DE RECEITA
16.3.3 ANÁLISE DE AÇÕES DA EMPRESA
16.3.4 PORTFÓLIO DE PRODUTOS
16.3.5 DESENVOLVIMENTO RECENTE
16.4 INGREDIENTES INCORPORADOS
16.4.1 RESUMO DA EMPRESA
16.4.2 ANÁLISE DE RECEITA
16.4.3 ANÁLISE DAS AÇÕES DA EMPRESA
16.4.4 PORTFÓLIO DE PRODUTOS
16.4.5 DESENVOLVIMENTO RECENTE
16,5 ASHLAND
16.5.1 RESUMO DA EMPRESA
16.5.2 ANÁLISE DE RECEITA
16.5.3 ANÁLISE DAS AÇÕES DA EMPRESA
16.5.4 PORTFÓLIO DE PRODUTOS
16.5.5 DESENVOLVIMENTO RECENTE
16.6 CORBION
16.6.1 RESUMO DA EMPRESA
16.6.2 ANÁLISE DE RECEITA
16.6.3 PORTFÓLIO DE PRODUTOS
16.6.4 DESENVOLVIMENTOS RECENTES
16,7 KERRY
16.7.1 RESUMO DA EMPRESA
16.7.2 ANÁLISE DE RECEITA
16.7.3 PORTFÓLIO DE PRODUTOS
16.7.4 DESENVOLVIMENTOS RECENTES
16.8 CP KELCO US, INC.
16.8.1 RESUMO DA EMPRESA
16.8.2 PORTFÓLIO DE PRODUTOS
16.8.3 DESENVOLVIMENTOS RECENTES
16.9 AVEBE
16.9.1 RESUMO DA EMPRESA
16.9.2 PORTFÓLIO DE PRODUTOS
16.9.3 DESENVOLVIMENTO RECENTE
16.1 TATE & LYLE
16.10.1 RESUMO DA EMPRESA
16.10.2 ANÁLISE DE RECEITA
16.10.3 PORTFÓLIO DE PRODUTOS
16.10.4 DESENVOLVIMENTOS RECENTES
16.11 BENEO
16.11.1 RESUMO DA EMPRESA
16.11.2 PORTFÓLIO DE PRODUTOS
16.11.3 DESENVOLVIMENTO RECENTE
16.12 EPOGEE
16.12.1 RESUMO DA EMPRESA
16.12.2 PORTFÓLIO DE PRODUTOS
16.12.3 DESENVOLVIMENTOS RECENTES
16.13 CORPORAÇÃO DE PROCESSAMENTO DE GRÃOS
16.13.1 RESUMO DA EMPRESA
16.13.2 PORTFÓLIO DE PRODUTOS
16.13.3 DESENVOLVIMENTO RECENTE
16.14 JELU-WERK J. EHRLER GMBH & CO.
16.14.1 RESUMO DA EMPRESA
16.14.2 PORTFÓLIO DE PRODUTOS
16.14.3 DESENVOLVIMENTOS RECENTES
16h15 ULRICK & SHORT
16.15.1 RESUMO DA EMPRESA
16.15.2 PORTFÓLIO DE PRODUTOS
16.15.3 DESENVOLVIMENTOS RECENTES
17 QUESTIONÁRIO
18 RELATÓRIOS RELACIONADOS
Lista de Tabela
TABELA 1 MERCADO DE SUBSTITUTOS DE GORDURA DA ÁSIA-PACÍFICO, POR TIPO, 2020-2029 (US$ MILHÕES)
TABELA 2 MERCADO DE SUBSTITUTOS DE GORDURA À BASE DE CARBOIDRATOS NA ÁSIA-PACÍFICO, POR REGIÃO, 2020-2029 (US$ MILHÕES)
TABELA 3 MERCADO DE SUBSTITUTOS DE GORDURA À BASE DE CARBOIDRATOS NA ÁSIA-PACÍFICO, POR TIPO, 2020-2029 (US$ MILHÕES)
TABELA 4 MERCADO DE SUBSTITUTOS DE GORDURA À BASE DE PROTEÍNA NA ÁSIA-PACÍFICO, POR REGIÃO, 2020-2029 (US$ MILHÕES)
TABELA 5 MERCADO DE SUBSTITUTOS DE GORDURA À BASE DE PROTEÍNA NA ÁSIA-PACÍFICO, POR TIPO, 2020-2029 (US$ MILHÕES)
TABELA 6 MERCADO DE SUBSTITUTOS DE GORDURA À BASE DE GORDURA NA ÁSIA-PACÍFICO, POR REGIÃO, 2020-2029 (US$ MILHÕES)
TABELA 7 MERCADO DE SUBSTITUTOS DE GORDURA À BASE DE GORDURA NA ÁSIA-PACÍFICO, POR TIPO, 2020-2029 (US$ MILHÕES)
TABELA 8 MERCADO DE SUBSTITUTOS DE GORDURA DA ÁSIA-PACÍFICO, POR FONTE, 2020-2029 (US$ MILHÕES)
TABELA 9: PLANTAS DA ÁSIA-PACÍFICO NO MERCADO DE SUBSTITUTOS DE GORDURA, POR REGIÃO, 2020-2029 (US$ MILHÕES)
TABELA 10 MERCADO DE SUBSTITUTOS DE GORDURA PARA ANIMAIS NA ÁSIA-PACÍFICO, POR REGIÃO, 2020-2029 (US$ MILHÕES)
TABELA 11 MERCADO DE SUBSTITUTOS DE GORDURA DA ÁSIA-PACÍFICO, POR CATEGORIA, 2020-2029 (US$ MILHÕES)
TABELA 12: RÓTULO LIMPO DA ÁSIA-PACÍFICO NO MERCADO DE SUBSTITUTOS DE GORDURA, POR REGIÃO, 2020-2029 (US$ MILHÕES)
TABELA 13 MERCADO DE SUBSTITUTOS DE GORDURA CONVENCIONAIS DA ÁSIA-PACÍFICO, POR REGIÃO, 2020-2029 (US$ MILHÕES)
TABELA 14 MERCADO DE SUBSTITUTOS DE GORDURA DA ÁSIA-PACÍFICO, POR FORMA, 2020-2029 (US$ MILHÕES)
TABELA 15 MERCADO DE SUBSTITUTOS DE GORDURA SECA NA ÁSIA-PACÍFICO, POR REGIÃO, 2020-2029 (US$ MILHÕES)
TABELA 16 MERCADO DE SUBSTITUTOS DE GORDURA LÍQUIDA DA ÁSIA-PACÍFICO, POR REGIÃO, 2020-2029 (US$ MILHÕES)
TABELA 17 MERCADO DE SUBSTITUTOS DE GORDURA DA ÁSIA-PACÍFICO, POR APLICAÇÃO, 2020-2029 (US$ MILHÕES)
TABELA 18: PADARIA DA ÁSIA-PACÍFICO NO MERCADO DE SUBSTITUTOS DE GORDURA, POR REGIÃO, 2020-2029 (US$ MILHÕES)
TABELA 19: PADARIA DA ÁSIA-PACÍFICO NO MERCADO DE SUBSTITUTOS DE GORDURA, POR TIPO DE PRODUTO, 2020-2029 (US$ MILHÕES)
TABELA 20: PADARIA DA ÁSIA-PACÍFICO NO MERCADO DE SUBSTITUTOS DE GORDURA, POR TIPO, 2020-2029 (US$ MILHÕES)
TABELA 21 PRODUTOS LÁCTEOS DA ÁSIA-PACÍFICO NO MERCADO DE SUBSTITUTOS DE GORDURA, POR REGIÃO, 2020-2029 (US$ MILHÕES)
TABELA 22 PRODUTOS LÁCTEOS DA ÁSIA-PACÍFICO NO MERCADO DE SUBSTITUTOS DE GORDURA, POR TIPO DE PRODUTO, 2020-2029 (US$ MILHÕES)
TABELA 23 Iogurte na região Ásia-Pacífico no mercado de substitutos de gordura, por tipo de produto, 2020-2029 (US$ milhões)
TABELA 24 MERCADO DE SUBSTITUTOS DE GORDURA NO LEITE DA ÁSIA-PACÍFICO, POR TIPO DE PRODUTO, 2020-2029 (US$ MILHÕES)
TABELA 25 MERCADO DE SUBSTITUTOS DE GORDURA PARA PRODUTOS LÁCTEOS NA ÁSIA-PACÍFICO, POR TIPO, 2020-2029 (US$ MILHÕES)
TABELA 26 ALIMENTOS DE CONVENIÊNCIA DA ÁSIA-PACÍFICO NO MERCADO DE SUBSTITUTOS DE GORDURA, POR REGIÃO, 2020-2029 (US$ MILHÕES)
TABELA 27 ALIMENTOS DE CONVENIÊNCIA DA ÁSIA-PACÍFICO NO MERCADO DE SUBSTITUTOS DE GORDURA, POR TIPO DE PRODUTO, 2020-2029 (US$ MILHÕES)
TABELA 28 ALIMENTOS DE CONVENIÊNCIA DA ÁSIA-PACÍFICO NO MERCADO DE SUBSTITUTOS DE GORDURA, POR TIPO, 2020-2029 (US$ MILHÕES)
TABELA 29 MERCADO DE SUBSTITUTOS DE GORDURA PROCESSADOS NA ÁSIA-PACÍFICO, POR REGIÃO, 2020-2029 (US$ MILHÕES)
TABELA 30 MERCADO DE SUBSTITUTOS DE GORDURA PROCESSADA NA ÁSIA-PACÍFICO, POR TIPO, 2020-2029 (US$ MILHÕES)
TABELA 31 CONFEITARIA DA ÁSIA-PACÍFICO NO MERCADO DE SUBSTITUTOS DE GORDURA, POR REGIÃO, 2020-2029 (US$ MILHÕES)
TABELA 32 CONFEITARIA NA ÁSIA-PACÍFICO NO MERCADO DE SUBSTITUTOS DE GORDURA, POR TIPO DE PRODUTO, 2020-2029 (US$ MILHÕES)
TABELA 33 CONFEITARIA NA ÁSIA-PACÍFICO NO MERCADO DE SUBSTITUTOS DE GORDURA, POR TIPO, 2020-2029 (US$ MILHÕES)
TABELA 34 ALIMENTOS FUNCIONAIS NO MERCADO DE SUBSTITUTOS DE GORDURA DA ÁSIA-PACÍFICO, POR REGIÃO, 2020-2029 (US$ MILHÕES)
TABELA 35 ALIMENTOS FUNCIONAIS NO MERCADO DE SUBSTITUTOS DE GORDURA DA ÁSIA-PACÍFICO, POR TIPO, 2020-2029 (US$ MILHÕES)
TABELA 36 MOLHOS, SOPAS E MOLHO NUTRICIONAL NO MERCADO DE SUBSTITUTOS DE GORDURA DA ÁSIA-PACÍFICO, POR REGIÃO, 2020-2029 (US$ MILHÕES)
TABELA 37 MOLHOS, SOPAS E MOLHO NUTRICIONAL NO MERCADO DE SUBSTITUTOS DE GORDURA DA ÁSIA-PACÍFICO, POR TIPO, 2020-2029 (US$ MILHÕES)
TABELA 38 BEBIDAS NO MERCADO DE SUBSTITUTOS DE GORDURA DA ÁSIA-PACÍFICO, POR REGIÃO, 2020-2029 (US$ MILHÕES)
TABELA 39 BEBIDAS NO MERCADO DE SUBSTITUTOS DE GORDURA DA ÁSIA-PACÍFICO, POR TIPO, 2020-2029 (US$ MILHÕES)
TABELA 40 OUTROS SUBSTITUTOS DE GORDURA NO MERCADO DA ÁSIA E PACÍFICO, POR REGIÃO, 2020-2029 (US$ MILHÕES)
TABELA 41 OUTROS MERCADOS DE SUBSTITUTOS DE GORDURA NA ÁSIA E PACÍFICO, POR TIPO, 2020-2029 (US$ MILHÕES)
TABELA 42 MERCADO DE SUBSTITUTOS DE GORDURA DA ÁSIA-PACÍFICO, POR PAÍS, 2020-2029 (US$ MILHÕES)
TABELA 43 MERCADO DE SUBSTITUTOS DE GORDURA DA ÁSIA-PACÍFICO, POR TIPO, 2020-2029 (US$ MILHÕES)
TABELA 44 MERCADO DE SUBSTITUTOS DE GORDURA À BASE DE CARBOIDRATOS NA ÁSIA-PACÍFICO, POR TIPO, 2020-2029 (US$ MILHÕES)
TABELA 45 MERCADO DE SUBSTITUTOS DE GORDURA À BASE DE PROTEÍNA NA ÁSIA-PACÍFICO, POR TIPO, 2020-2029 (US$ MILHÕES)
TABELA 46 MERCADO DE SUBSTITUTOS DE GORDURA À BASE DE GORDURA NA ÁSIA-PACÍFICO, POR TIPO, 2020-2029 (US$ MILHÕES)
TABELA 47 MERCADO DE SUBSTITUTOS DE GORDURA DA ÁSIA-PACÍFICO, POR FONTE, 2020-2029 (US$ MILHÕES)
TABELA 48 MERCADO DE SUBSTITUTOS DE GORDURA DA ÁSIA-PACÍFICO, POR CATEGORIA, 2020-2029 (US$ MILHÕES)
TABELA 49 MERCADO DE SUBSTITUTOS DE GORDURA DA ÁSIA-PACÍFICO, POR FORMA, 2020-2029 (US$ MILHÕES)
TABELA 50 MERCADO DE SUBSTITUTOS DE GORDURA DA ÁSIA-PACÍFICO, POR APLICAÇÃO, 2020-2029 (US$ MILHÕES)
TABELA 51: PADARIA NA ÁSIA-PACÍFICO NO MERCADO DE SUBSTITUTOS DE GORDURA, POR TIPO DE PRODUTO, 2020-2029 (US$ MILHÕES)
TABELA 52: PADARIA NA ÁSIA-PACÍFICO NO MERCADO DE SUBSTITUTOS DE GORDURA, POR TIPO, 2020-2029 (US$ MILHÕES)
TABELA 53 PRODUTOS LÁCTEOS DA ÁSIA-PACÍFICO NO MERCADO DE SUBSTITUTOS DE GORDURA, POR TIPO DE PRODUTO, 2020-2029 (US$ MILHÕES)
TABELA 54 IOGURTE NO MERCADO DE SUBSTITUTOS DE GORDURA DA ÁSIA-PACÍFICO, POR TIPO DE PRODUTO, 2020-2029 (US$ MILHÕES)
TABELA 55 MERCADO DE SUBSTITUTOS DE GORDURA NO LEITE DA ÁSIA-PACÍFICO, POR TIPO DE PRODUTO, 2020-2029 (US$ MILHÕES)
TABELA 56 PRODUTOS LÁCTEOS NA ÁSIA-PACÍFICO NO MERCADO DE SUBSTITUTOS DE GORDURA, POR TIPO, 2020-2029 (US$ MILHÕES)
TABELA 57 ALIMENTOS DE CONVENIÊNCIA DA ÁSIA-PACÍFICO NO MERCADO DE SUBSTITUTOS DE GORDURA, POR TIPO DE PRODUTO, 2020-2029 (US$ MILHÕES)
TABELA 58 ALIMENTOS DE CONVENIÊNCIA DA ÁSIA-PACÍFICO NO MERCADO DE SUBSTITUTOS DE GORDURA, POR TIPO, 2020-2029 (US$ MILHÕES)
TABELA 59 MERCADO DE SUBSTITUTOS DE GORDURA PROCESSADOS NA ÁSIA-PACÍFICO, POR TIPO, 2020-2029 (US$ MILHÕES)
TABELA 60 CONFEITARIA NO MERCADO DE SUBSTITUTOS DE GORDURA DA ÁSIA-PACÍFICO, POR TIPO DE PRODUTO, 2020-2029 (US$ MILHÕES)
TABELA 61 CONFEITARIA NO MERCADO DE SUBSTITUTOS DE GORDURA DA ÁSIA-PACÍFICO, POR TIPO, 2020-2029 (US$ MILHÕES)
TABELA 62 ALIMENTOS FUNCIONAIS NO MERCADO DE SUBSTITUTOS DE GORDURA DA ÁSIA-PACÍFICO, POR TIPO, 2020-2029 (US$ MILHÕES)
TABELA 63 MOLHOS, SOPAS E MOLHO NUTRICIONAL NO MERCADO DE SUBSTITUTOS DE GORDURA DA ÁSIA-PACÍFICO, POR TIPO, 2020-2029 (US$ MILHÕES)
TABELA 64 BEBIDAS NO MERCADO DE SUBSTITUTOS DE GORDURA DA ÁSIA-PACÍFICO, POR TIPO, 2020-2029 (US$ MILHÕES)
TABELA 65 OUTROS SUBSTITUTOS DE GORDURA NO MERCADO DA ÁSIA-PACÍFICO, POR TIPO, 2020-2029 (US$ MILHÕES)
TABELA 66 MERCADO DE SUBSTITUTOS DE GORDURA DA CHINA, POR TIPO, 2020-2029 (US$ MILHÕES)
TABELA 67 MERCADO DE SUBSTITUTOS DE GORDURA À BASE DE CARBOIDRATOS NA CHINA, POR TIPO, 2020-2029 (US$ MILHÕES)
TABELA 68 MERCADO DE SUBSTITUTOS DE GORDURA À BASE DE PROTEÍNA NA CHINA, POR TIPO, 2020-2029 (US$ MILHÕES)
TABELA 69 MERCADO DE SUBSTITUTOS DE GORDURA À BASE DE GORDURA DA CHINA, POR TIPO, 2020-2029 (US$ MILHÕES)
TABELA 70 MERCADO DE SUBSTITUTOS DE GORDURA DA CHINA, POR FONTE, 2020-2029 (US$ MILHÕES)
TABELA 71 MERCADO DE SUBSTITUTOS DE GORDURA DA CHINA, POR CATEGORIA, 2020-2029 (US$ MILHÕES)
TABELA 72 MERCADO DE SUBSTITUTOS DE GORDURA DA CHINA, POR FORMA, 2020-2029 (US$ MILHÕES)
TABELA 73 MERCADO DE SUBSTITUTOS DE GORDURA DA CHINA, POR APLICAÇÃO, 2020-2029 (US$ MILHÕES)
TABELA 74: PADARIA CHINESA NO MERCADO DE SUBSTITUTOS DE GORDURA, POR TIPO DE PRODUTO, 2020-2029 (US$ MILHÕES)
TABELA 75: PADARIA CHINESA NO MERCADO DE SUBSTITUTOS DE GORDURA, POR TIPO, 2020-2029 (US$ MILHÕES)
TABELA 76 PRODUTOS LÁCTEOS DA CHINA NO MERCADO DE SUBSTITUTOS DE GORDURA, POR TIPO DE PRODUTO, 2020-2029 (US$ MILHÕES)
TABELA 77 IOGURTE DA CHINA NO MERCADO DE SUBSTITUTOS DE GORDURA, POR TIPO DE PRODUTO, 2020-2029 (US$ MILHÕES)
TABELA 78 MERCADO DE SUBSTITUTOS DE GORDURA NO LEITE DA CHINA, POR TIPO DE PRODUTO, 2020-2029 (US$ MILHÕES)
TABELA 79 PRODUTOS LÁCTEOS DA CHINA NO MERCADO DE SUBSTITUTOS DE GORDURA, POR TIPO, 2020-2029 (US$ MILHÕES)
TABELA 80 ALIMENTOS DE CONVENIÊNCIA DA CHINA NO MERCADO DE SUBSTITUTOS DE GORDURA, POR TIPO DE PRODUTO, 2020-2029 (US$ MILHÕES)
TABELA 81 ALIMENTOS DE CONVENIÊNCIA DA CHINA NO MERCADO DE SUBSTITUTOS DE GORDURA, POR TIPO, 2020-2029 (US$ MILHÕES)
TABELA 82 MERCADO DE SUBSTITUTOS DE GORDURA PROCESSADOS NA CHINA, POR TIPO, 2020-2029 (US$ MILHÕES)
TABELA 83 CONFEITARIA CHINESA NO MERCADO DE SUBSTITUTOS DE GORDURA, POR TIPO DE PRODUTO, 2020-2029 (US$ MILHÕES)
TABELA 84 CONFEITARIA CHINESA NO MERCADO DE SUBSTITUTOS DE GORDURA, POR TIPO, 2020-2029 (US$ MILHÕES)
TABELA 85 ALIMENTOS FUNCIONAIS NO MERCADO DE SUBSTITUTOS DE GORDURA DA CHINA, POR TIPO, 2020-2029 (US$ MILHÕES)
TABELA 86 MOLHOS, SOPAS E MOLHO CHINESES NO MERCADO DE SUBSTITUTOS DE GORDURA, POR TIPO, 2020-2029 (US$ MILHÕES)
TABELA 87 BEBIDAS CHINESAS NO MERCADO DE SUBSTITUTOS DE GORDURA, POR TIPO, 2020-2029 (US$ MILHÕES)
TABELA 88 CHINA OUTROS NO MERCADO DE SUBSTITUTOS DE GORDURA, POR TIPO, 2020-2029 (US$ MILHÕES)
TABELA 89 MERCADO DE SUBSTITUTOS DE GORDURA DA ÍNDIA, POR TIPO, 2020-2029 (US$ MILHÕES)
TABELA 90 MERCADO DE SUBSTITUTOS DE GORDURA À BASE DE CARBOIDRATOS NA ÍNDIA, POR TIPO, 2020-2029 (US$ MILHÕES)
TABELA 91 MERCADO DE SUBSTITUTOS DE GORDURA À BASE DE PROTEÍNA NA ÍNDIA, POR TIPO, 2020-2029 (US$ MILHÕES)
TABELA 92 MERCADO DE SUBSTITUTOS DE GORDURA À BASE DE GORDURA NA ÍNDIA, POR TIPO, 2020-2029 (US$ MILHÕES)
TABELA 93 MERCADO DE SUBSTITUTOS DE GORDURA DA ÍNDIA, POR FONTE, 2020-2029 (US$ MILHÕES)
TABELA 94 MERCADO DE SUBSTITUTOS DE GORDURA DA ÍNDIA, POR CATEGORIA, 2020-2029 (US$ MILHÕES)
TABELA 95 MERCADO DE SUBSTITUTOS DE GORDURA DA ÍNDIA, POR FORMA, 2020-2029 (US$ MILHÕES)
TABELA 96 MERCADO DE SUBSTITUTOS DE GORDURA DA ÍNDIA, POR APLICAÇÃO, 2020-2029 (US$ MILHÕES)
TABELA 97 PADARIA DA ÍNDIA NO MERCADO DE SUBSTITUTOS DE GORDURA, POR TIPO DE PRODUTO, 2020-2029 (US$ MILHÕES)
TABELA 98: PADARIA DA ÍNDIA NO MERCADO DE SUBSTITUTOS DE GORDURA, POR TIPO, 2020-2029 (US$ MILHÕES)
TABELA 99 PRODUTOS LÁCTEOS DA ÍNDIA NO MERCADO DE SUBSTITUTOS DE GORDURA, POR TIPO DE PRODUTO, 2020-2029 (US$ MILHÕES)
TABELA 100 IOGURTE DA ÍNDIA NO MERCADO DE SUBSTITUTOS DE GORDURA, POR TIPO DE PRODUTO, 2020-2029 (US$ MILHÕES)
TABELA 101 MERCADO DE SUBSTITUTOS DE GORDURA NO LEITE DA ÍNDIA, POR TIPO DE PRODUTO, 2020-2029 (US$ MILHÕES)
TABELA 102 PRODUTOS LÁCTEOS NO MERCADO DE SUBSTITUTOS DE GORDURA DA ÍNDIA, POR TIPO, 2020-2029 (US$ MILHÕES)
TABELA 103 ALIMENTOS DE CONVENIÊNCIA NO MERCADO DE SUBSTITUTOS DE GORDURA DA ÍNDIA, POR TIPO DE PRODUTO, 2020-2029 (US$ MILHÕES)
TABELA 104 ALIMENTOS DE CONVENIÊNCIA NO MERCADO DE SUBSTITUTOS DE GORDURA DA ÍNDIA, POR TIPO, 2020-2029 (US$ MILHÕES)
TABELA 105 MERCADO DE SUBSTITUTOS DE GORDURA PROCESSADA NA ÍNDIA, POR TIPO, 2020-2029 (US$ MILHÕES)
TABELA 106 CONFEITARIA DA ÍNDIA NO MERCADO DE SUBSTITUTOS DE GORDURA, POR TIPO DE PRODUTO, 2020-2029 (US$ MILHÕES)
TABELA 107 CONFEITARIA NO MERCADO DE SUBSTITUTOS DE GORDURA DA ÍNDIA, POR TIPO, 2020-2029 (US$ MILHÕES)
TABELA 108 ALIMENTOS FUNCIONAIS NO MERCADO DE SUBSTITUTOS DE GORDURA DA ÍNDIA, POR TIPO, 2020-2029 (US$ MILHÕES)
TABELA 109 MOLHOS, SOPAS E MOLHO INDIANO NO MERCADO DE SUBSTITUTOS DE GORDURA, POR TIPO, 2020-2029 (US$ MILHÕES)
TABELA 110 BEBIDAS NO MERCADO DE SUBSTITUTOS DE GORDURA DA ÍNDIA, POR TIPO, 2020-2029 (US$ MILHÕES)
TABELA 111 ÍNDIA OUTROS NO MERCADO DE SUBSTITUTOS DE GORDURA, POR TIPO, 2020-2029 (US$ MILHÕES)
TABELA 112 MERCADO DE SUBSTITUTOS DE GORDURA NO JAPÃO, POR TIPO, 2020-2029 (US$ MILHÕES)
TABELA 113 MERCADO DE SUBSTITUTOS DE GORDURA À BASE DE CARBOIDRATOS NO JAPÃO, POR TIPO, 2020-2029 (US$ MILHÕES)
TABELA 114 MERCADO DE SUBSTITUTOS DE GORDURA À BASE DE PROTEÍNA NO JAPÃO, POR TIPO, 2020-2029 (US$ MILHÕES)
TABELA 115 MERCADO DE SUBSTITUTOS DE GORDURA À BASE DE GORDURA NO JAPÃO, POR TIPO, 2020-2029 (US$ MILHÕES)
TABELA 116 MERCADO DE SUBSTITUTOS DE GORDURA NO JAPÃO, POR FONTE, 2020-2029 (US$ MILHÕES)
TABELA 117 MERCADO DE SUBSTITUTOS DE GORDURA NO JAPÃO, POR CATEGORIA, 2020-2029 (US$ MILHÕES)
TABELA 118 MERCADO DE SUBSTITUTOS DE GORDURA NO JAPÃO, POR FORMA, 2020-2029 (US$ MILHÕES)
TABELA 119 MERCADO DE SUBSTITUTOS DE GORDURA NO JAPÃO, POR APLICAÇÃO, 2020-2029 (US$ MILHÕES)
TABELA 120: PADARIA DO JAPÃO NO MERCADO DE SUBSTITUTOS DE GORDURA, POR TIPO DE PRODUTO, 2020-2029 (US$ MILHÕES)
TABELA 121 PADARIA DO JAPÃO NO MERCADO DE SUBSTITUTOS DE GORDURA, POR TIPO, 2020-2029 (US$ MILHÕES)
TABELA 122 PRODUTOS LÁCTEOS NO MERCADO DE SUBSTITUTOS DE GORDURA DO JAPÃO, POR TIPO DE PRODUTO, 2020-2029 (US$ MILHÕES)
TABELA 123 IOGURTE JAPONÊS NO MERCADO DE SUBSTITUTOS DE GORDURA, POR TIPO DE PRODUTO, 2020-2029 (US$ MILHÕES)
TABELA 124 MERCADO DE SUBSTITUTOS DE GORDURA NO LEITE DO JAPÃO, POR TIPO DE PRODUTO, 2020-2029 (US$ MILHÕES)
TABELA 125 PRODUTOS LÁCTEOS NO MERCADO DE SUBSTITUTOS DE GORDURA DO JAPÃO, POR TIPO, 2020-2029 (US$ MILHÕES)
TABELA 126 ALIMENTOS DE CONVENIÊNCIA DO JAPÃO NO MERCADO DE SUBSTITUTOS DE GORDURA, POR TIPO DE PRODUTO, 2020-2029 (US$ MILHÕES)
TABELA 127 ALIMENTOS DE CONVENIÊNCIA DO JAPÃO NO MERCADO DE SUBSTITUTOS DE GORDURA, POR TIPO, 2020-2029 (US$ MILHÕES)
TABELA 128 MERCADO DE SUBSTITUTOS DE GORDURA PROCESSADOS NO JAPÃO, POR TIPO, 2020-2029 (US$ MILHÕES)
TABELA 129 CONFEITARIA NO MERCADO DE SUBSTITUTOS DE GORDURA DO JAPÃO, POR TIPO DE PRODUTO, 2020-2029 (US$ MILHÕES)
TABELA 130 MERCADO DE SUBSTITUTOS DE GORDURA NO JAPÃO, POR TIPO, 2020-2029 (US$ MILHÕES)
TABELA 131 ALIMENTOS FUNCIONAIS NO MERCADO DE SUBSTITUTOS DE GORDURA DO JAPÃO, POR TIPO, 2020-2029 (US$ MILHÕES)
TABELA 132 MOLHOS, SOPAS E MOLHO NUTRICIONAL NO MERCADO DE SUBSTITUTOS DE GORDURA, POR TIPO, 2020-2029 (US$ MILHÕES)
TABELA 133 BEBIDAS NO MERCADO DE SUBSTITUTOS DE GORDURA DO JAPÃO, POR TIPO, 2020-2029 (US$ MILHÕES)
TABELA 134 JAPÃO OUTROS NO MERCADO DE SUBSTITUTOS DE GORDURA, POR TIPO, 2020-2029 (US$ MILHÕES)
TABELA 135 MERCADO DE SUBSTITUTOS DE GORDURA DA AUSTRÁLIA, POR TIPO, 2020-2029 (US$ MILHÕES)
TABELA 136 MERCADO DE SUBSTITUTOS DE GORDURA À BASE DE CARBOIDRATOS NA AUSTRÁLIA, POR TIPO, 2020-2029 (US$ MILHÕES)
TABELA 137 MERCADO DE SUBSTITUTOS DE GORDURA À BASE DE PROTEÍNA NA AUSTRÁLIA, POR TIPO, 2020-2029 (US$ MILHÕES)
TABELA 138 MERCADO DE SUBSTITUTOS DE GORDURA À BASE DE GORDURA NA AUSTRÁLIA, POR TIPO, 2020-2029 (US$ MILHÕES)
TABELA 139 MERCADO DE SUBSTITUTOS DE GORDURA DA AUSTRÁLIA, POR FONTE, 2020-2029 (US$ MILHÕES)
TABELA 140 MERCADO DE SUBSTITUTOS DE GORDURA DA AUSTRÁLIA, POR CATEGORIA, 2020-2029 (US$ MILHÕES)
TABELA 141 MERCADO DE SUBSTITUTOS DE GORDURA DA AUSTRÁLIA, POR FORMA, 2020-2029 (US$ MILHÕES)
TABELA 142 MERCADO DE SUBSTITUTOS DE GORDURA DA AUSTRÁLIA, POR APLICAÇÃO, 2020-2029 (US$ MILHÕES)
TABELA 143 PADARIA AUSTRÁLIA NO MERCADO DE SUBSTITUTOS DE GORDURA, POR TIPO DE PRODUTO, 2020-2029 (US$ MILHÕES)
TABELA 144 PADARIA AUSTRÁLIA NO MERCADO DE SUBSTITUTOS DE GORDURA, POR TIPO, 2020-2029 (US$ MILHÕES)
TABELA 145 PRODUTOS LÁCTEOS NO MERCADO DE SUBSTITUTOS DE GORDURA DA AUSTRÁLIA, POR TIPO DE PRODUTO, 2020-2029 (US$ MILHÕES)
TABELA 146 MERCADO DE IOGURTE NA AUSTRÁLIA NO MERCADO DE SUBSTITUTOS DE GORDURA, POR TIPO DE PRODUTO, 2020-2029 (US$ MILHÕES)
TABELA 147 MERCADO DE SUBSTITUTOS DE GORDURA NO LEITE DA AUSTRÁLIA, POR TIPO DE PRODUTO, 2020-2029 (US$ MILHÕES)
TABELA 148 PRODUTOS LÁCTEOS NO MERCADO DE SUBSTITUTOS DE GORDURA DA AUSTRÁLIA, POR TIPO, 2020-2029 (US$ MILHÕES)
TABELA 149 ALIMENTOS DE CONVENIÊNCIA NA AUSTRÁLIA NO MERCADO DE SUBSTITUTOS DE GORDURA, POR TIPO DE PRODUTO, 2020-2029 (US$ MILHÕES)
TABELA 150 ALIMENTOS DE CONVENIÊNCIA NA AUSTRÁLIA NO MERCADO DE SUBSTITUTOS DE GORDURA, POR TIPO, 2020-2029 (US$ MILHÕES)
TABELA 151 MERCADO DE SUBSTITUTOS DE GORDURA PROCESSADOS NA AUSTRÁLIA, POR TIPO, 2020-2029 (US$ MILHÕES)
TABELA 152 CONFEITARIA NA AUSTRÁLIA NO MERCADO DE SUBSTITUTOS DE GORDURA, POR TIPO DE PRODUTO, 2020-2029 (US$ MILHÕES)
TABELA 153 CONFEITARIA NA AUSTRÁLIA NO MERCADO DE SUBSTITUTOS DE GORDURA, POR TIPO, 2020-2029 (US$ MILHÕES)
TABELA 154 ALIMENTOS FUNCIONAIS NO MERCADO DE SUBSTITUTOS DE GORDURA DA AUSTRÁLIA, POR TIPO, 2020-2029 (US$ MILHÕES)
TABELA 155 MOLHOS, SOPAS E MOLHO INGREDIENTES NO MERCADO DE SUBSTITUTOS DE GORDURA DA AUSTRÁLIA, POR TIPO, 2020-2029 (US$ MILHÕES)
TABELA 156 BEBIDAS NO MERCADO DE SUBSTITUTOS DE GORDURA DA AUSTRÁLIA, POR TIPO, 2020-2029 (US$ MILHÕES)
TABELA 157 AUSTRÁLIA OUTROS NO MERCADO DE SUBSTITUTOS DE GORDURA, POR TIPO, 2020-2029 (US$ MILHÕES)
TABELA 158 MERCADO DE SUBSTITUTOS DE GORDURA DA INDONÉSIA, POR TIPO, 2020-2029 (US$ MILHÕES)
TABELA 159 MERCADO DE SUBSTITUTOS DE GORDURA À BASE DE CARBOIDRATOS NA INDONÉSIA, POR TIPO, 2020-2029 (US$ MILHÕES)
TABELA 160 MERCADO DE SUBSTITUTOS DE GORDURA À BASE DE PROTEÍNA NA INDONÉSIA, POR TIPO, 2020-2029 (US$ MILHÕES)
TABELA 161 MERCADO DE SUBSTITUTOS DE GORDURA À BASE DE GORDURA NA INDONÉSIA, POR TIPO, 2020-2029 (US$ MILHÕES)
TABELA 162 MERCADO DE SUBSTITUTOS DE GORDURA DA INDONÉSIA, POR FONTE, 2020-2029 (US$ MILHÕES)
TABELA 163 MERCADO DE SUBSTITUTOS DE GORDURA DA INDONÉSIA, POR CATEGORIA, 2020-2029 (US$ MILHÕES)
TABELA 164 MERCADO DE SUBSTITUTOS DE GORDURA DA INDONÉSIA, POR FORMA, 2020-2029 (US$ MILHÕES)
TABELA 165 MERCADO DE SUBSTITUTOS DE GORDURA DA INDONÉSIA, POR APLICAÇÃO, 2020-2029 (US$ MILHÕES)
TABELA 166 PADARIA DA INDONÉSIA NO MERCADO DE SUBSTITUTOS DE GORDURA, POR TIPO DE PRODUTO, 2020-2029 (US$ MILHÕES)
TABELA 167 PADARIA DA INDONÉSIA NO MERCADO DE SUBSTITUTOS DE GORDURA, POR TIPO, 2020-2029 (US$ MILHÕES)
TABELA 168 PRODUTOS LÁCTEOS NO MERCADO DE SUBSTITUTOS DE GORDURA DA INDONÉSIA, POR TIPO DE PRODUTO, 2020-2029 (US$ MILHÕES)
TABELA 169 IOGURTE NA INDONÉSIA NO MERCADO DE SUBSTITUTOS DE GORDURA, POR TIPO DE PRODUTO, 2020-2029 (US$ MILHÕES)
TABELA 170 MERCADO DE SUBSTITUTOS DE GORDURA NO LEITE DA INDONÉSIA, POR TIPO DE PRODUTO, 2020-2029 (US$ MILHÕES)
TABELA 171 PRODUTOS LÁCTEOS NO MERCADO DE SUBSTITUTOS DE GORDURA DA INDONÉSIA, POR TIPO, 2020-2029 (US$ MILHÕES)
TABELA 172 ALIMENTOS DE CONVENIÊNCIA NA INDONÉSIA NO MERCADO DE SUBSTITUTOS DE GORDURA, POR TIPO DE PRODUTO, 2020-2029 (US$ MILHÕES)
TABELA 173 ALIMENTOS DE CONVENIÊNCIA NA INDONÉSIA NO MERCADO DE SUBSTITUTOS DE GORDURA, POR TIPO, 2020-2029 (US$ MILHÕES)
TABELA 174 MERCADO DE SUBSTITUTOS DE GORDURA PROCESSADOS NA INDONÉSIA, POR TIPO, 2020-2029 (US$ MILHÕES)
TABELA 175 CONFEITARIA DA INDONÉSIA NO MERCADO DE SUBSTITUTOS DE GORDURA, POR TIPO DE PRODUTO, 2020-2029 (US$ MILHÕES)
TABELA 176 CONFEITARIA NA INDONÉSIA NO MERCADO DE SUBSTITUTOS DE GORDURA, POR TIPO, 2020-2029 (US$ MILHÕES)
TABELA 177 ALIMENTOS FUNCIONAIS NO MERCADO DE SUBSTITUTOS DE GORDURA DA INDONÉSIA, POR TIPO, 2020-2029 (US$ MILHÕES)
TABELA 178 MOLHOS, SOPAS E MOLHO INGREDIENTES NO MERCADO DE SUBSTITUTOS DE GORDURA DA INDONÉSIA, POR TIPO, 2020-2029 (US$ MILHÕES)
TABELA 179 BEBIDAS NO MERCADO DE SUBSTITUTOS DE GORDURA DA INDONÉSIA, POR TIPO, 2020-2029 (US$ MILHÕES)
TABELA 180 INDONÉSIA OUTROS NO MERCADO DE SUBSTITUTOS DE GORDURA, POR TIPO, 2020-2029 (US$ MILHÕES)
TABELA 181 MERCADO DE SUBSTITUTOS DE GORDURA DE SINGAPURA, POR TIPO, 2020-2029 (US$ MILHÕES)
TABELA 182 MERCADO DE SUBSTITUTOS DE GORDURA À BASE DE CARBOIDRATOS EM SINGAPURA, POR TIPO, 2020-2029 (US$ MILHÕES)
TABELA 183 MERCADO DE SUBSTITUTOS DE GORDURA À BASE DE PROTEÍNA EM SINGAPURA, POR TIPO, 2020-2029 (US$ MILHÕES)
TABELA 184 MERCADO DE SUBSTITUTOS DE GORDURA À BASE DE GORDURA EM SINGAPURA, POR TIPO, 2020-2029 (US$ MILHÕES)
TABELA 185 MERCADO DE SUBSTITUTOS DE GORDURA EM SINGAPURA, POR FONTE, 2020-2029 (US$ MILHÕES)
TABELA 186 MERCADO DE SUBSTITUTOS DE GORDURA DE SINGAPURA, POR CATEGORIA, 2020-2029 (US$ MILHÕES)
TABELA 187 MERCADO DE SUBSTITUTOS DE GORDURA DE SINGAPURA, POR FORMA, 2020-2029 (US$ MILHÕES)
TABELA 188 MERCADO DE SUBSTITUTOS DE GORDURA DE SINGAPURA, POR APLICAÇÃO, 2020-2029 (US$ MILHÕES)
TABELA 189 PADARIA DE SINGAPURA NO MERCADO DE SUBSTITUTOS DE GORDURA, POR TIPO DE PRODUTO, 2020-2029 (US$ MILHÕES)
TABELA 190 PADARIA DE SINGAPURA NO MERCADO DE SUBSTITUTOS DE GORDURA, POR TIPO, 2020-2029 (US$ MILHÕES)
TABELA 191 PRODUTOS LÁCTEOS DE SINGAPURA NO MERCADO DE SUBSTITUTOS DE GORDURA, POR TIPO DE PRODUTO, 2020-2029 (US$ MILHÕES)
TABELA 192 IOGURTE DE SINGAPURA NO MERCADO DE SUBSTITUTOS DE GORDURA, POR TIPO DE PRODUTO, 2020-2029 (US$ MILHÕES)
TABELA 193 LEITE EM SINGAPURA NO MERCADO DE SUBSTITUTOS DE GORDURA, POR TIPO DE PRODUTO, 2020-2029 (US$ MILHÕES)
TABELA 194 PRODUTOS LÁCTEOS NO MERCADO DE SUBSTITUTOS DE GORDURA DE SINGAPURA, POR TIPO, 2020-2029 (US$ MILHÕES)
TABELA 195 ALIMENTOS DE CONVENIÊNCIA DE SINGAPURA NO MERCADO DE SUBSTITUTOS DE GORDURA, POR TIPO DE PRODUTO, 2020-2029 (US$ MILHÕES)
TABELA 196 ALIMENTOS DE CONVENIÊNCIA DE SINGAPURA NO MERCADO DE SUBSTITUTOS DE GORDURA, POR TIPO, 2020-2029 (US$ MILHÕES)
TABELA 197 CARNE PROCESSADA NO MERCADO DE SUBSTITUTOS DE GORDURA DE SINGAPURA, POR TIPO, 2020-2029 (US$ MILHÕES)
TABELA 198 CONFEITARIA DE SINGAPURA NO MERCADO DE SUBSTITUTOS DE GORDURA, POR TIPO DE PRODUTO, 2020-2029 (US$ MILHÕES)
TABELA 199 CONFEITARIA DE SINGAPURA NO MERCADO DE SUBSTITUTOS DE GORDURA, POR TIPO, 2020-2029 (US$ MILHÕES)
TABELA 200 ALIMENTOS FUNCIONAIS NO MERCADO DE SUBSTITUTOS DE GORDURA DE SINGAPURA, POR TIPO, 2020-2029 (US$ MILHÕES)
TABELA 201 MOLHOS, SOPAS E MOLHO INGAPURA NO MERCADO DE SUBSTITUTOS DE GORDURA, POR TIPO, 2020-2029 (US$ MILHÕES)
TABELA 202 BEBIDAS NO MERCADO DE SUBSTITUTOS DE GORDURA DE SINGAPURA, POR TIPO, 2020-2029 (US$ MILHÕES)
TABELA 203 CINGAPURA OUTROS NO MERCADO DE SUBSTITUTOS DE GORDURA, POR TIPO, 2020-2029 (US$ MILHÕES)
TABELA 204 MERCADO DE SUBSTITUTOS DE GORDURA DA COREIA DO SUL, POR TIPO, 2020-2029 (US$ MILHÕES)
TABELA 205 MERCADO DE SUBSTITUTOS DE GORDURA À BASE DE CARBOIDRATOS NA COREIA DO SUL, POR TIPO, 2020-2029 (US$ MILHÕES)
TABELA 206 MERCADO DE SUBSTITUTOS DE GORDURA À BASE DE PROTEÍNA NA COREIA DO SUL, POR TIPO, 2020-2029 (US$ MILHÕES)
TABELA 207 MERCADO DE SUBSTITUTOS DE GORDURA À BASE DE GORDURA DA COREIA DO SUL, POR TIPO, 2020-2029 (US$ MILHÕES)
TABELA 208 MERCADO DE SUBSTITUTOS DE GORDURA DA COREIA DO SUL, POR FONTE, 2020-2029 (US$ MILHÕES)
TABELA 209 MERCADO DE SUBSTITUTOS DE GORDURA DA COREIA DO SUL, POR CATEGORIA, 2020-2029 (US$ MILHÕES)
TABELA 210 MERCADO DE SUBSTITUTOS DE GORDURA DA COREIA DO SUL, POR FORMA, 2020-2029 (US$ MILHÕES)
TABELA 211 MERCADO DE SUBSTITUTOS DE GORDURA DA COREIA DO SUL, POR APLICAÇÃO, 2020-2029 (US$ MILHÕES)
TABELA 212 PADARIA DA COREIA DO SUL NO MERCADO DE SUBSTITUTOS DE GORDURA, POR TIPO DE PRODUTO, 2020-2029 (US$ MILHÕES)
TABELA 213 PADARIA DA COREIA DO SUL NO MERCADO DE SUBSTITUTOS DE GORDURA, POR TIPO, 2020-2029 (US$ MILHÕES)
TABELA 214 PRODUTOS LÁCTEOS DA COREIA DO SUL NO MERCADO DE SUBSTITUTOS DE GORDURA, POR TIPO DE PRODUTO, 2020-2029 (US$ MILHÕES)
TABELA 215 IOGURTE DA COREIA DO SUL NO MERCADO DE SUBSTITUTOS DE GORDURA, POR TIPO DE PRODUTO, 2020-2029 (US$ MILHÕES)
TABELA 216 MERCADO DE SUBSTITUTOS DE GORDURA NO LEITE DA COREIA DO SUL, POR TIPO DE PRODUTO, 2020-2029 (US$ MILHÕES)
TABELA 217 PRODUTOS LÁCTEOS NO MERCADO DE SUBSTITUTOS DE GORDURA DA COREIA DO SUL, POR TIPO, 2020-2029 (US$ MILHÕES)
TABELA 218 ALIMENTOS DE CONVENIÊNCIA DA COREIA DO SUL NO MERCADO DE SUBSTITUTOS DE GORDURA, POR TIPO DE PRODUTO, 2020-2029 (US$ MILHÕES)
TABELA 219 ALIMENTOS DE CONVENIÊNCIA DA COREIA DO SUL NO MERCADO DE SUBSTITUTOS DE GORDURA, POR TIPO, 2020-2029 (US$ MILHÕES)
TABELA 220 MERCADO DE SUBSTITUTOS DE GORDURA PROCESSADOS NA COREIA DO SUL, POR TIPO, 2020-2029 (US$ MILHÕES)
TABELA 221 CONFEITARIA DA COREIA DO SUL NO MERCADO DE SUBSTITUTOS DE GORDURA, POR TIPO DE PRODUTO, 2020-2029 (US$ MILHÕES)
TABELA 222 CONFEITARIA NO MERCADO DE SUBSTITUTOS DE GORDURA DA COREIA DO SUL, POR TIPO, 2020-2029 (US$ MILHÕES)
TABELA 223 ALIMENTOS FUNCIONAIS NO MERCADO DE SUBSTITUTOS DE GORDURA DA COREIA DO SUL, POR TIPO, 2020-2029 (US$ MILHÕES)
TABELA 224 MOLHOS, SOPAS E MOLHO NUTRICIONAL NO MERCADO DE SUBSTITUTOS DE GORDURA DA COREIA DO SUL, POR TIPO, 2020-2029 (US$ MILHÕES)
TABELA 225 BEBIDAS NO MERCADO DE SUBSTITUTOS DE GORDURA DA COREIA DO SUL, POR TIPO, 2020-2029 (US$ MILHÕES)
TABELA 226 COREIA DO SUL OUTROS NO MERCADO DE SUBSTITUTOS DE GORDURA, POR TIPO, 2020-2029 (US$ MILHÕES)
TABELA 227 MERCADO DE SUBSTITUTOS DE GORDURA DA MALÁSIA, POR TIPO, 2020-2029 (US$ MILHÕES)
TABELA 228 MERCADO DE SUBSTITUTOS DE GORDURA À BASE DE CARBOIDRATOS NA MALÁSIA, POR TIPO, 2020-2029 (US$ MILHÕES)
TABELA 229 MERCADO DE SUBSTITUTOS DE GORDURA À BASE DE PROTEÍNA DA MALÁSIA, POR TIPO, 2020-2029 (US$ MILHÕES)
TABELA 230 MERCADO DE SUBSTITUTOS DE GORDURA À BASE DE GORDURA DA MALÁSIA, POR TIPO, 2020-2029 (US$ MILHÕES)
TABELA 231 MERCADO DE SUBSTITUTOS DE GORDURA DA MALÁSIA, POR FONTE, 2020-2029 (US$ MILHÕES)
TABELA 232 MERCADO DE SUBSTITUTOS DE GORDURA DA MALÁSIA, POR CATEGORIA, 2020-2029 (US$ MILHÕES)
TABELA 233 MERCADO DE SUBSTITUTOS DE GORDURA DA MALÁSIA, POR FORMA, 2020-2029 (US$ MILHÕES)
TABELA 234 MERCADO DE SUBSTITUTOS DE GORDURA DA MALÁSIA, POR APLICAÇÃO, 2020-2029 (US$ MILHÕES)
TABELA 235 PADARIA DA MALÁSIA NO MERCADO DE SUBSTITUTOS DE GORDURA, POR TIPO DE PRODUTO, 2020-2029 (US$ MILHÕES)
TABELA 236 PADARIA DA MALÁSIA NO MERCADO DE SUBSTITUTOS DE GORDURA, POR TIPO, 2020-2029 (US$ MILHÕES)
TABELA 237 PRODUTOS LÁCTEOS DA MALÁSIA NO MERCADO DE SUBSTITUTOS DE GORDURA, POR TIPO DE PRODUTO, 2020-2029 (US$ MILHÕES)
TABELA 238 IOGURTE DA MALÁSIA NO MERCADO DE SUBSTITUTOS DE GORDURA, POR TIPO DE PRODUTO, 2020-2029 (US$ MILHÕES)
TABELA 239 MERCADO DE SUBSTITUTOS DE GORDURA NO LEITE DA MALÁSIA, POR TIPO DE PRODUTO, 2020-2029 (US$ MILHÕES)
TABELA 240 PRODUTOS LÁCTEOS DA MALÁSIA NO MERCADO DE SUBSTITUTOS DE GORDURA, POR TIPO, 2020-2029 (US$ MILHÕES)
TABELA 241 ALIMENTOS DE CONVENIÊNCIA DA MALÁSIA NO MERCADO DE SUBSTITUTOS DE GORDURA, POR TIPO DE PRODUTO, 2020-2029 (US$ MILHÕES)
TABELA 242 ALIMENTOS DE CONVENIÊNCIA DA MALÁSIA NO MERCADO DE SUBSTITUTOS DE GORDURA, POR TIPO, 2020-2029 (US$ MILHÕES)
TABELA 243 CARNE PROCESSADA NO MERCADO DE SUBSTITUTOS DE GORDURA DA MALÁSIA, POR TIPO, 2020-2029 (US$ MILHÕES)
TABELA 244 CONFEITARIA DA MALÁSIA NO MERCADO DE SUBSTITUTOS DE GORDURA, POR TIPO DE PRODUTO, 2020-2029 (US$ MILHÕES)
TABELA 245 CONFEITARIA DA MALÁSIA NO MERCADO DE SUBSTITUTOS DE GORDURA, POR TIPO, 2020-2029 (US$ MILHÕES)
TABELA 246 ALIMENTOS FUNCIONAIS NO MERCADO DE SUBSTITUTOS DE GORDURA DA MALÁSIA, POR TIPO, 2020-2029 (US$ MILHÕES)
TABELA 247 MOLHOS, SOPAS E MOLHO MALÁSIA NO MERCADO DE SUBSTITUTOS DE GORDURA, POR TIPO, 2020-2029 (US$ MILHÕES)
TABELA 248 BEBIDAS NO MERCADO DE SUBSTITUTOS DE GORDURA DA MALÁSIA, POR TIPO, 2020-2029 (US$ MILHÕES)
TABELA 249 MALÁSIA OUTROS NO MERCADO DE SUBSTITUTOS DE GORDURA, POR TIPO, 2020-2029 (US$ MILHÕES)
TABELA 250 MERCADO DE SUBSTITUTOS DE GORDURA DA TAILÂNDIA, POR TIPO, 2020-2029 (US$ MILHÕES)
TABELA 251 MERCADO DE SUBSTITUTOS DE GORDURA À BASE DE CARBOIDRATOS NA TAILÂNDIA, POR TIPO, 2020-2029 (US$ MILHÕES)
TABELA 252 MERCADO DE SUBSTITUTOS DE GORDURA À BASE DE PROTEÍNA NA TAILÂNDIA, POR TIPO, 2020-2029 (US$ MILHÕES)
TABELA 253 MERCADO DE SUBSTITUTOS DE GORDURA À BASE DE GORDURA DA TAILÂNDIA, POR TIPO, 2020-2029 (US$ MILHÕES)
TABELA 254 MERCADO DE SUBSTITUTOS DE GORDURA DA TAILÂNDIA, POR FONTE, 2020-2029 (US$ MILHÕES)
TABELA 255 MERCADO DE SUBSTITUTOS DE GORDURA DA TAILÂNDIA, POR CATEGORIA, 2020-2029 (US$ MILHÕES)
TABELA 256 MERCADO DE SUBSTITUTOS DE GORDURA DA TAILÂNDIA, POR FORMA, 2020-2029 (US$ MILHÕES)
TABELA 257 MERCADO DE SUBSTITUTOS DE GORDURA DA TAILÂNDIA, POR APLICAÇÃO, 2020-2029 (US$ MILHÕES)
TABELA 258 PADARIA DA TAILÂNDIA NO MERCADO DE SUBSTITUTOS DE GORDURA, POR TIPO DE PRODUTO, 2020-2029 (US$ MILHÕES)
TABELA 259 PADARIA DA TAILÂNDIA NO MERCADO DE SUBSTITUTOS DE GORDURA, POR TIPO, 2020-2029 (US$ MILHÕES)
TABELA 260 PRODUTOS LÁCTEOS DA TAILÂNDIA NO MERCADO DE SUBSTITUTOS DE GORDURA, POR TIPO DE PRODUTO, 2020-2029 (US$ MILHÕES)
TABELA 261 IOGURTE DA TAILÂNDIA NO MERCADO DE SUBSTITUTOS DE GORDURA, POR TIPO DE PRODUTO, 2020-2029 (US$ MILHÕES)
TABELA 262 MERCADO DE SUBSTITUTOS DE GORDURA NO LEITE DA TAILÂNDIA, POR TIPO DE PRODUTO, 2020-2029 (US$ MILHÕES)
TABELA 263 PRODUTOS LÁCTEOS DA TAILÂNDIA NO MERCADO DE SUBSTITUTOS DE GORDURA, POR TIPO, 2020-2029 (US$ MILHÕES)
TABELA 264 ALIMENTOS DE CONVENIÊNCIA DA TAILÂNDIA NO MERCADO DE SUBSTITUTOS DE GORDURA, POR TIPO DE PRODUTO, 2020-2029 (US$ MILHÕES)
TABELA 265 ALIMENTOS DE CONVENIÊNCIA DA TAILÂNDIA NO MERCADO DE SUBSTITUTOS DE GORDURA, POR TIPO, 2020-2029 (US$ MILHÕES)
TABELA 266 CARNE PROCESSADA NO MERCADO DE SUBSTITUTOS DE GORDURA DA TAILÂNDIA, POR TIPO, 2020-2029 (US$ MILHÕES)
TABELA 267 CONFEITARIA DA TAILÂNDIA NO MERCADO DE SUBSTITUTOS DE GORDURA, POR TIPO DE PRODUTO, 2020-2029 (US$ MILHÕES)
TABELA 268 CONFEITARIA DA TAILÂNDIA NO MERCADO DE SUBSTITUTOS DE GORDURA, POR TIPO, 2020-2029 (US$ MILHÕES)
TABELA 269 ALIMENTOS FUNCIONAIS NO MERCADO DE SUBSTITUTOS DE GORDURA DA TAILÂNDIA, POR TIPO, 2020-2029 (US$ MILHÕES)
TABELA 270 MOLHOS, SOPAS E MOLHO INDICADO NA TAILÂNDIA NO MERCADO DE SUBSTITUTOS DE GORDURA, POR TIPO, 2020-2029 (US$ MILHÕES)
TABELA 271 BEBIDAS NO MERCADO DE SUBSTITUTOS DE GORDURA DA TAILÂNDIA, POR TIPO, 2020-2029 (US$ MILHÕES)
TABELA 272 TAILÂNDIA OUTROS NO MERCADO DE SUBSTITUTOS DE GORDURA, POR TIPO, 2020-2029 (US$ MILHÕES)
TABELA 273 MERCADO DE SUBSTITUTOS DE GORDURA NAS FILIPINAS, POR TIPO, 2020-2029 (US$ MILHÕES)
TABELA 274 MERCADO DE SUBSTITUTOS DE GORDURA À BASE DE CARBOIDRATOS NAS FILIPINAS, POR TIPO, 2020-2029 (US$ MILHÕES)
TABELA 275 MERCADO DE SUBSTITUTOS DE GORDURA À BASE DE PROTEÍNA NAS FILIPINAS, POR TIPO, 2020-2029 (US$ MILHÕES)
TABELA 276 MERCADO DE SUBSTITUTOS DE GORDURA À BASE DE GORDURA NAS FILIPINAS, POR TIPO, 2020-2029 (US$ MILHÕES)
TABELA 277 MERCADO DE SUBSTITUTOS DE GORDURA NAS FILIPINAS, POR FONTE, 2020-2029 (US$ MILHÕES)
TABELA 278 MERCADO DE SUBSTITUTOS DE GORDURA NAS FILIPINAS, POR CATEGORIA, 2020-2029 (US$ MILHÕES)
TABELA 279 MERCADO DE SUBSTITUTOS DE GORDURA NAS FILIPINAS, POR FORMA, 2020-2029 (US$ MILHÕES)
TABELA 280 MERCADO DE SUBSTITUTOS DE GORDURA NAS FILIPINAS, POR APLICAÇÃO, 2020-2029 (US$ MILHÕES)
TABELA 281 PADARIA DAS FILIPINAS NO MERCADO DE SUBSTITUTOS DE GORDURA, POR TIPO DE PRODUTO, 2020-2029 (US$ MILHÕES)
TABELA 282 PADARIA DAS FILIPINAS NO MERCADO DE SUBSTITUTOS DE GORDURA, POR TIPO, 2020-2029 (US$ MILHÕES)
TABELA 283 PRODUTOS LÁCTEOS DAS FILIPINAS NO MERCADO DE SUBSTITUTOS DE GORDURA, POR TIPO DE PRODUTO, 2020-2029 (US$ MILHÕES)
TABELA 284 Iogurte das Filipinas no mercado de substitutos de gordura, por tipo de produto, 2020-2029 (US$ milhões)
TABELA 285 MERCADO DE SUBSTITUTOS DE GORDURA NO LEITE DAS FILIPINAS, POR TIPO DE PRODUTO, 2020-2029 (US$ MILHÕES)
TABELA 286 PRODUTOS LÁCTEOS DAS FILIPINAS NO MERCADO DE SUBSTITUTOS DE GORDURA, POR TIPO, 2020-2029 (US$ MILHÕES)
TABELA 287 ALIMENTOS DE CONVENIÊNCIA NAS FILIPINAS NO MERCADO DE SUBSTITUTOS DE GORDURA, POR TIPO DE PRODUTO, 2020-2029 (US$ MILHÕES)
TABELA 288 ALIMENTOS DE CONVENIÊNCIA NAS FILIPINAS NO MERCADO DE SUBSTITUTOS DE GORDURA, POR TIPO, 2020-2029 (US$ MILHÕES)
TABELA 289 MERCADO DE SUBSTITUTOS DE GORDURA PROCESSADA NAS FILIPINAS, POR TIPO, 2020-2029 (US$ MILHÕES)
TABELA 290 CONFEITARIA DAS FILIPINAS NO MERCADO DE SUBSTITUTOS DE GORDURA, POR TIPO DE PRODUTO, 2020-2029 (US$ MILHÕES)
TABELA 291 CONFEITARIA DAS FILIPINAS NO MERCADO DE SUBSTITUTOS DE GORDURA, POR TIPO, 2020-2029 (US$ MILHÕES)
TABELA 292 ALIMENTOS FUNCIONAIS NO MERCADO DE SUBSTITUTOS DE GORDURA NAS FILIPINAS, POR TIPO, 2020-2029 (US$ MILHÕES)
TABELA 293 MOLHOS, SOPAS E MOLHO DAS FILIPINAS NO MERCADO DE SUBSTITUTOS DE GORDURA, POR TIPO, 2020-2029 (US$ MILHÕES)
TABELA 294 BEBIDAS NAS FILIPINAS NO MERCADO DE SUBSTITUTOS DE GORDURA, POR TIPO, 2020-2029 (US$ MILHÕES)
TABELA 295 FILIPINAS OUTROS NO MERCADO DE SUBSTITUTOS DE GORDURA, POR TIPO, 2020-2029 (US$ MILHÕES)
TABELA 296 MERCADO DE SUBSTITUTOS DE GORDURA DO RESTO DA ÁSIA-PACÍFICO, POR TIPO, 2020-2029 (US$ MILHÕES)
Lista de Figura
FIGURA 1 MERCADO DE SUBSTITUTOS DE GORDURA DA ÁSIA-PACÍFICO: SEGMENTAÇÃO
FIGURA 2 MERCADO DE SUBSTITUTOS DE GORDURA DA ÁSIA-PACÍFICO: TRIANGULAÇÃO DE DADOS
FIGURA 3 MERCADO DE SUBSTITUTOS DE GORDURA DA ÁSIA-PACÍFICO: ANÁLISE DROC
FIGURA 4 MERCADO DE SUBSTITUTOS DE GORDURA DA ÁSIA-PACÍFICO: ANÁLISE DA ÁSIA-PACÍFICO X REGIONAL
FIGURA 5 MERCADO DE SUBSTITUTOS DE GORDURA DA ÁSIA-PACÍFICO: ANÁLISE DE PESQUISA DA EMPRESA
FIGURA 6 MERCADO DE SUBSTITUTOS DE GORDURA DA ÁSIA-PACÍFICO: DEMOGRAFIA DA ENTREVISTA
FIGURA 7 MERCADO DE SUBSTITUTOS DE GORDURA DA ÁSIA-PACÍFICO: GRADE DE POSIÇÃO DE MERCADO DBMR
FIGURA 8 MERCADO DE SUBSTITUTOS DE GORDURA DA ÁSIA-PACÍFICO: ANÁLISE DA PARTICIPAÇÃO DE FORNECEDORES
FIGURA 9 MERCADO DE SUBSTITUTOS DE GORDURA DA ÁSIA-PACÍFICO: SEGMENTAÇÃO
FIGURA 10 A REGIÃO DA AMÉRICA DO NORTE DEVE DOMINAR O MERCADO DE SUBSTITUTOS DE GORDURA DA ÁSIA-PACÍFICO E CRESCER COM O MAIOR CAGR NO PERÍODO PREVISTO DE 2022 A 2029
FIGURA 11 A CONSCIENTIZAÇÃO AUMENTADA ENTRE AS PESSOAS SOBRE O CONSUMO EXCESSIVO DE GORDURA DEVE IMPULSIONAR O CRESCIMENTO DO MERCADO DE SUBSTITUTOS DE GORDURA DA ÁSIA-PACÍFICO NO PERÍODO PREVISTO DE 2022 A 2029
FIGURA 12 O SEGMENTO DE PRODUTOS À BASE DE CARBOIDRATOS DEVE REPRESENTAR A MAIOR PARCIALIDADE DO MERCADO DE SUBSTITUTOS DE GORDURA DA ÁSIA-PACÍFICO EM 2022 E 2029
FIGURA 13 MOTIVADORES, RESTRIÇÕES, OPORTUNIDADES E DESAFIOS DO MERCADO DE SUBSTITUTOS DE GORDURA DA ÁSIA-PACÍFICO
FIGURA 14 PRINCIPAIS FONTES DE GORDURA NA DIETA DOS EUA
FIGURA 15 MERCADO DE SUBSTITUTOS DE GORDURA DA ÁSIA-PACÍFICO: POR TIPO, 2021
FIGURA 16 MERCADO DE SUBSTITUTOS DE GORDURA DA ÁSIA-PACÍFICO: POR FONTE, 2021
FIGURA 17 MERCADO DE SUBSTITUTOS DE GORDURA DA ÁSIA-PACÍFICO: POR CATEGORIA, 2021
FIGURA 18 MERCADO DE SUBSTITUTOS DE GORDURA DA ÁSIA-PACÍFICO, POR FORMA, 2021
FIGURA 19 MERCADO DE SUBSTITUTOS DE GORDURA DA ÁSIA-PACÍFICO: POR APLICAÇÃO, 2021
FIGURA 20 MERCADO DE SUBSTITUTOS DE GORDURA DA ÁSIA-PACÍFICO: RESUMO (2021)
FIGURA 21 MERCADO DE SUBSTITUTOS DE GORDURA DA ÁSIA-PACÍFICO: POR PAÍS (2021)
FIGURA 22 MERCADO DE SUBSTITUTOS DE GORDURA DA ÁSIA-PACÍFICO: POR PAÍS (2022 E 2029)
FIGURA 23 MERCADO DE REVESTIMENTOS DE GORDURA DA ÁSIA-PACÍFICO: POR PAÍS (2021 E 2029)
FIGURA 24 MERCADO DE SUBSTITUTOS DE GORDURA DA ÁSIA-PACÍFICO: POR TIPO (2022 E 2029)
FIGURA 25 MERCADO DE SUBSTITUTOS DE GORDURA DA ÁSIA-PACÍFICO: PARTICIPAÇÃO DA EMPRESA EM 2021 (%)
Metodologia de Investigação
A recolha de dados e a análise do ano base são feitas através de módulos de recolha de dados com amostras grandes. A etapa inclui a obtenção de informações de mercado ou dados relacionados através de diversas fontes e estratégias. Inclui examinar e planear antecipadamente todos os dados adquiridos no passado. Da mesma forma, envolve o exame de inconsistências de informação observadas em diferentes fontes de informação. Os dados de mercado são analisados e estimados utilizando modelos estatísticos e coerentes de mercado. Além disso, a análise da quota de mercado e a análise das principais tendências são os principais fatores de sucesso no relatório de mercado. Para saber mais, solicite uma chamada de analista ou abra a sua consulta.
A principal metodologia de investigação utilizada pela equipa de investigação do DBMR é a triangulação de dados que envolve a mineração de dados, a análise do impacto das variáveis de dados no mercado e a validação primária (especialista do setor). Os modelos de dados incluem grelha de posicionamento de fornecedores, análise da linha de tempo do mercado, visão geral e guia de mercado, grelha de posicionamento da empresa, análise de patentes, análise de preços, análise da quota de mercado da empresa, normas de medição, análise global versus regional e de participação dos fornecedores. Para saber mais sobre a metodologia de investigação, faça uma consulta para falar com os nossos especialistas do setor.
Personalização disponível
A Data Bridge Market Research é líder em investigação formativa avançada. Orgulhamo-nos de servir os nossos clientes novos e existentes com dados e análises que correspondem e atendem aos seus objetivos. O relatório pode ser personalizado para incluir análise de tendências de preços de marcas-alvo, compreensão do mercado para países adicionais (solicite a lista de países), dados de resultados de ensaios clínicos, revisão de literatura, mercado remodelado e análise de base de produtos . A análise de mercado dos concorrentes-alvo pode ser analisada desde análises baseadas em tecnologia até estratégias de carteira de mercado. Podemos adicionar quantos concorrentes necessitar de dados no formato e estilo de dados que procura. A nossa equipa de analistas também pode fornecer dados em tabelas dinâmicas de ficheiros Excel em bruto (livro de factos) ou pode ajudá-lo a criar apresentações a partir dos conjuntos de dados disponíveis no relatório.

