Asia Pacific Parcel Sortation Systems Market, By Type (Linear Parcel Sortation Systems and Loop Parcel Sortation Systems), Offering (Hardware, Software, and Services), Tray Size (Small, Medium and Large), Parcel Handling Capacity (Less than 20000 Parcels/Hr, 20000 To 30000 Parcels/Hr And More than 30000 Parcels/Hr), End User (Logistics, E Commerce, Pharmaceutical and Medical Supply, Food & Beverages and Others), Country (China, Japan, South Korea, India, Australia, Singapore, Thailand, Malaysia, Indonesia, Philippines, Rest of Asia-Pacific) Industry Trends and Forecast to 2029
 Market Analysis and Insights: Asia-Pacific Parcel Sortation Systems Market
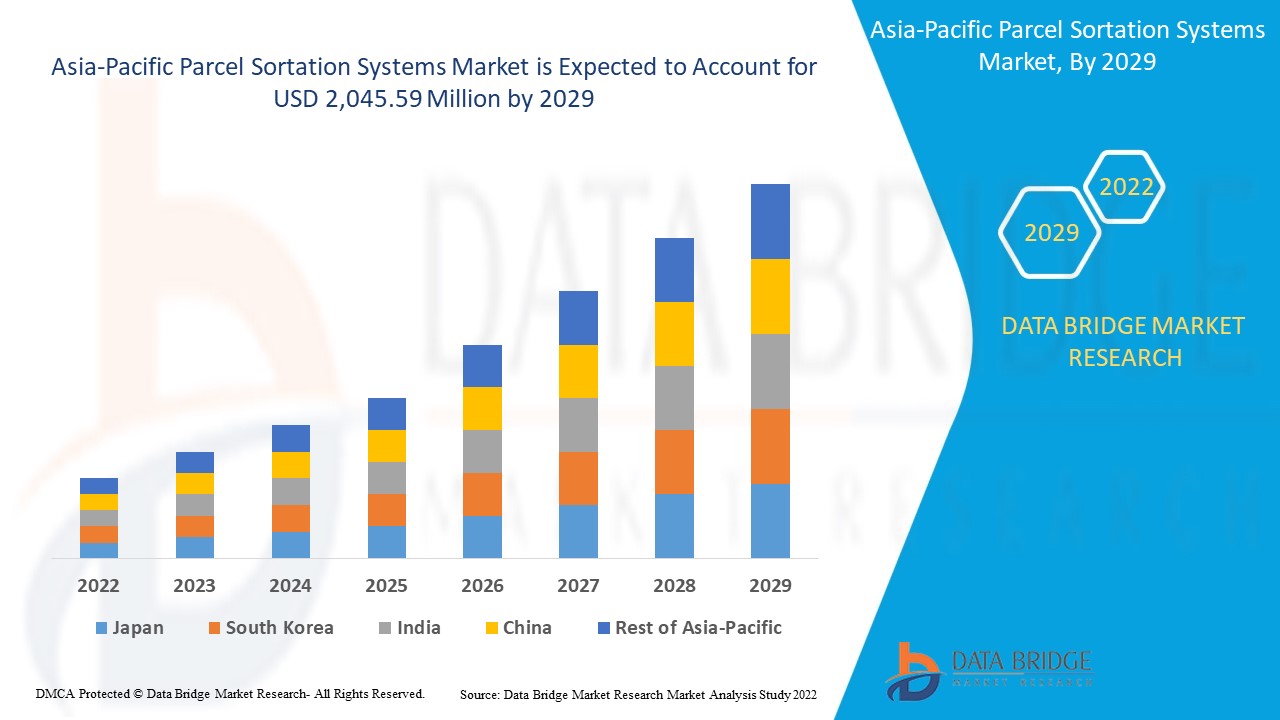
The Asia-Pacific Parcel Sortation Systems market is expected to gain market growth from 2022 to 2029. Data Bridge Market Research analyses that the market is growing with a CAGR of 14.9% in the forecast period of 2022 to 2029 and is expected to reach 2,045.59 million by 2029.
Parcel sortation is the process of identifying items on a conveyor system and diverting them to specific destinations using a variety of devices controlled by task-specific software. They can also read any applicable labels or even apply new ones. These operations are incredibly important to ensuring the packages get to their final destination, but arranging deliveries is the task that provides the most direct benefit to that end. Parcel sortation puts the packages into the correct delivery areas to get them on their way to their final destination. Sortation can have a significant impact on the efficiency of your fulfillment automation. Parcels come in a variety of shapes and sizes and need to be arranged accordingly. Conveyor systems and other mechanical processes can help streamline your fulfillment automation and keep things moving. In a distribution center, parcel sortation can be applicable at different steps of the order fulfillment process, such as receiving, picking, packing, and shipping. The selection of sortation systems is decided considering the following characteristics such as the fragility of the material to be handled, product geometry, materials, rate consideration, sorter function, available footprint, among others.
Increasing parcel volumes due to the change in the regional e commerce industry acts as a major factor in the market's growth. Developments in technologies such as AI and robots for sorting operations increased market's growth. However, high initial investment and deployment costs can act as a significantsignificant restraint for the development of the market. Asia-Pacific region has witnessed high investments in supply chain automation technologies this opens up opportunities in the market. Wide variety in parcel sizes and volume can act as a significant challenge for the growth of the market.
This parcel sortation systems market report provides details of market share, new developments, and product pipeline analysis, the impact of domestic and localized market players, analyses opportunities in terms of emerging revenue pockets, changes in market regulations, product approvals, strategic decisions, product launches, geographic expansions, and technological innovations in the market. To understand the analysis and the market scenario, contact us for an Analyst Brief. Our team will help you create a revenue impact solution to achieve your desired goal.
 Asia-Pacific Parcel Sortation Systems Market Scope and Market Size
The Asia-Pacific parcel sortation systems market is segmented into five segments based on type, offering, tray size, parcel handling capacity, and end-user.
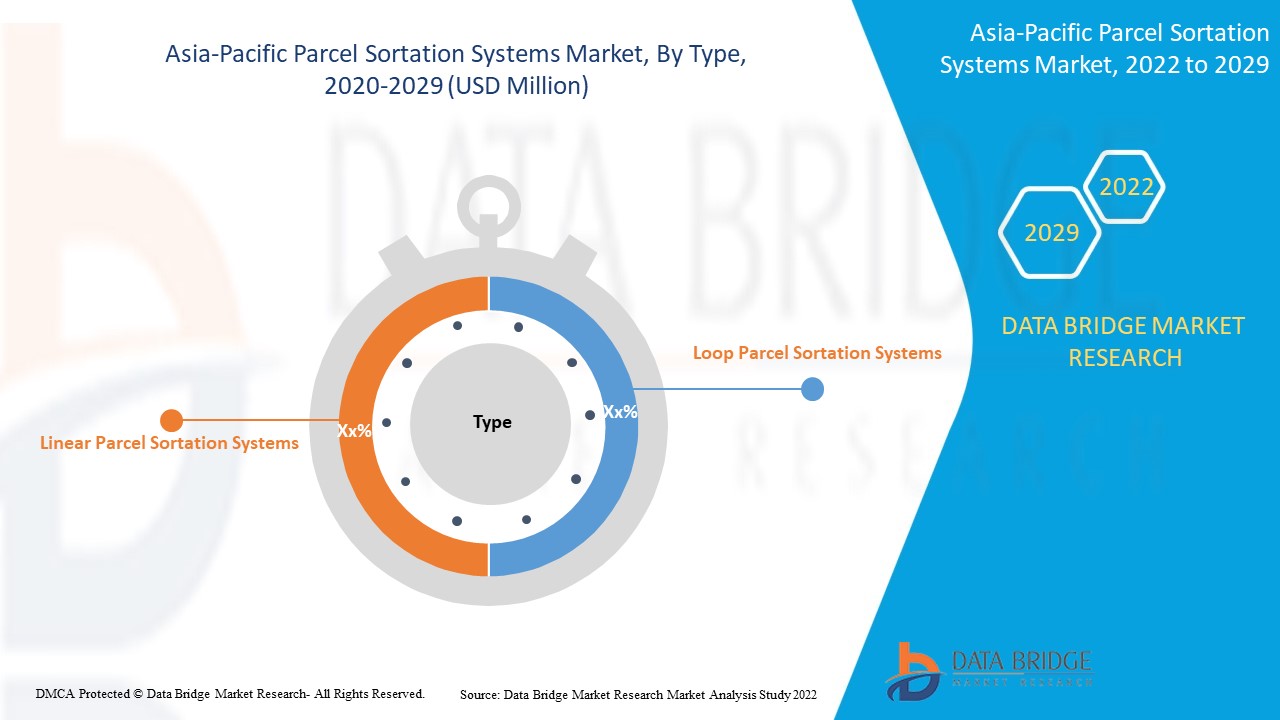
- On the basis of type, the Asia-Pacific parcel sortation systems market is segmented into linear parcel sortation systems and loop parcel sortation systems. In 2022, the linear parcel sortation systems segment is expected to dominate the market as the technological advancements in the technology has enabled them to offer high throughput, thus making them suitable for handling high parcel volumes
- On the basis of offering, the Asia-Pacific parcel sortation systems market is segmented into hardware, software, and services. In 2022, the hardware segment is expected to dominate the market as with the growing logistics infrastructure, the warehouses and fulfillment centers are increasingly adopting technological advanced sorting hardware to zmodernize the facility and increase their throughput
- On the basis of tray size, the Asia-Pacific parcel sortation systems market is segmented into small, medium, and large. In 2022, the medium segment is expected to dominate the market with increasing parcel volumes. The medium-sized trays prove to be ideal for handling the variation in parcel sizes and volumes
- On the basis of parcel handling capacity, the Asia-Pacific parcel sortation systems market is segmented into less than 20000 parcels/hr, 20000 to 30000 parcels/hr, and more than 30000 parcels/hr. In 2022, less than 20000 Parcels/hr is expected to dominate the market as the incorporation of sortation systems is increasing among the small and medium sized logistic facilities, these facilities handle and comparatively low volume and have a limited budget
- On the basis of end-user, the Asia-Pacific parcel sortation systems market is segmented into logistics, e commerce, pharmaceutical, medical supply, food & beverages, and others. In 2022, e-commerce is expected to dominate the market as the changing customer behavior in the region has led the e commerce industry to grow tremendously
Asia-Pacific Parcel Sortation Systems Market Country Level Analysis
Asia-Pacific Parcel Sortation Systems market is analysed, and market size information is provided by country, type, offering, tray size, parcel handling capacity, and end-user.
The countries covered in the Asia-Pacific Parcel Sortation Systems market report are China, Japan, India, South Korea, Australia, Indonesia, Singapore, Thailand, Malaysia, Philippines, and Asia-Pacific.
China is dominating the market in the Asia-Pacific region due to increasing investments in logistics infrastructure for increasing efficiency in the supply chain in urban planning. The proliferating growth in global ecommerce and changing consumer behavior in the country is further boosting the market growth.
The country section of the report also provides individual market impacting factors and changes in regulation in the market domestically that the current and future trends of the market. Data points such as new sales, replacement sales, country demographics, regulatory acts, and import-export tariffs are some of the major pointers used to forecast the market scenario for individual countries. Also, the presence and availability of global brands and their challenges faced due to significant or scarce competition from local and domestic brands, the impact of sales channels are considered while providing forecast analysis of the country data.
Rising Demand of Parcel Sortation Systems
Asia-Pacific Parcel Sortation Systems market also provides you with detailed market analysis for every country growth in the industry with sales, components sales, the impact of technological development in Parcel Sortation Systems, and changes in regulatory scenarios with their support for the Parcel Sortation Systems market. The data is available for the historic period 2012 to 2020.
Competitive Landscape and Asia-Pacific Parcel Sortation Systems Market Share Analysis
Asia-Pacific Parcel Sortation Systems market competitive landscape provides details by competitor. Details included are company overview, company financials, revenue generated, market potential, investment in research and development, new market initiatives, global presence, production sites and facilities, company strengths and weaknesses, product launch, product trials pipelines, product approvals, patents, product width and breadth, application dominance, technology lifeline curve. The above data points provided are only related to the companies’ focus related to the Asia-Pacific Parcel Sortation Systems market.
The major players covered in the report are Siemens Logistics GmbH (A Subsidiary of Siemens AG), Vanderlande Industries B.V., BEUMER GROUP, Bastian Solutions, LLC, FIVES, Dematic, Murata Machinery, Ltd., Interroll Group, Okura Yusoki Co., Ltd., Daifuku Co., Ltd., Equinox, Pitney Bowes Inc., MHS Global, SOLYSTIC SAS, BOWE SYSTEC GMBH, Honeywell International Inc. and Intralox among other domestic players. DBMR analysts understand competitive strengths and provide competitive analysis for each competitor separately.
Many product developments are also initiated by the companies worldwide, which a, so accelerate the growth of the Asia-Pacific Parcel Sortation Systems market.
For instance,
- In July 2021, Siemens Logistics GmbH announced the launch of Parcel Data Hub, a central data platform for parcel sorting centers to integrate data sets of various sources. With this, the company provided a platform to create the basis for seamless and efficient processes in sorting centers and eventually enables operational excellence. This enhanced the company’s offerings in the market.
- In June 2021, BEUMER GROUP announced the launch of the new BG Pouch System. The development came amidst the rapid growth of interest from omnichannel and D2C operators. The BG Pouch System was developed to relieve the unprecedented pressure to deliver financial and logistical efficiency in the demanding e-commerce environment and fits perfectly into BEUMER Group’s existing end-to-end integration solutions. With this, the company was able to expand its offering for the warehouse and distribution industry with a pouch sortation solution.
Partnership, joint ventures, and other strategies enhance the company's market share with increased coverage and presence. It also provides the benefit for organisation to improve their offering for Parcel Sortation Systems through expanded range of size.
SKU-
Obtenha acesso online ao relatório sobre a primeira nuvem de inteligência de mercado do mundo

- Painel interativo de análise de dados
- Painel de análise da empresa para oportunidades de elevado potencial de crescimento
- Acesso de analista de pesquisa para personalização e customização. consultas
- Análise da concorrência com painel interativo
- Últimas notícias, atualizações e atualizações Análise de tendências
- Aproveite o poder da análise de benchmark para um rastreio abrangente da concorrência
Índice
1 INTRODUÇÃO
1.1 OBJETIVOS DO ESTUDO
1.2 DEFINIÇÃO DE MERCADO
1.3 VISÃO GERAL DO MERCADO DE SISTEMAS DE TRIAGEM DE ENCOMENDAS DA ÁSIA-PACÍFICO
1.4 MOEDA E PREÇOS
1.5 LIMITAÇÕES
1.6 MERCADOS COBERTOS
2 SEGMENTAÇÃO DE MERCADO
2.1 MERCADOS COBERTOS
2.2 ÂMBITO GEOGRÁFICO
2,3 ANOS CONSIDERADOS PARA O ESTUDO
2.4 MODELO DE VALIDAÇÃO DE DADOS TRIPÉ DBMR
2.5 ENTREVISTAS PRINCIPAIS COM PRINCIPAIS LÍDERES DE OPINIÃO
2.6 GRADE DE POSIÇÃO DE MERCADO DBMR
2.7 ANÁLISE DA PARTICIPAÇÃO DO FORNECEDOR
2.8 GRADE DE COBERTURA DO USUÁRIO FINAL
2.9 MODELAGEM MULTIVARIADA
2.1 TIPO CURVA DE LINHA DO TEMPO
2.11 FONTES SECUNDÁRIAS
2.12 PREMISSAS
3 RESUMO EXECUTIVO
4 INSIGHTS PREMIUM
4.1 TENDÊNCIAS
4.1.1 AS COMPRAS PELA INTERNET CONTINUAM A CRESCER EXPONENCIALMENTE
4.1.2 TENDÊNCIA DE ENTREGA NO MESMO DIA
4.1.3 O FRETE GRÁTIS É UM INCENTIVO COMUM PARA VENDER PRODUTOS
4.1.4 ITENS GRANDES COLOCADOS ONLINE
4.1.5 AUMENTO DA DEMANDA POR ITENS PARA ENTREGA EM DOMICÍLIO
5 VISÃO GERAL DO MERCADO
5.1 MOTORISTAS
5.1.1 DESENVOLVIMENTO CONTÍNUO NA INDÚSTRIA DE COMÉRCIO ELETRÔNICO DA ÁSIA-PACÍFICO
5.1.2 MINIMIZAÇÃO DA INTERVENÇÃO MANUAL E REDUÇÃO DOS CUSTOS DE MÃO DE OBRA
5.1.3 DESENVOLVIMENTOS EM TECNOLOGIAS COMO IA E ROBÔS PARA OPERAÇÕES DE CLASSIFICAÇÃO
5.1.4 NECESSIDADE CRESCENTE DE REDUZIR OS CUSTOS DE ENTREGA DA ÚLTIMA MILHA
5.1.5 DESENVOLVIMENTO DE INFRAESTRUTURA LOGÍSTICA COM PLANEJAMENTO URBANO
5.2 RESTRIÇÕES
5.2.1 ALTOS INVESTIMENTOS INICIAIS
5.2.2 REGULAMENTAÇÕES GOVERNAMENTAIS IMPOSTAS ÀS TECNOLOGIAS DE AUTOMAÇÃO
5.3 OPORTUNIDADES
5.3.1 ADOÇÃO AMPLA DA TECNOLOGIA DE IOT
5.3.2 INTEGRAÇÃO DO SINGULADOR AUTOMÁTICO DE ENCOMENDAS NO SISTEMA DE TRIAGEM
5.3.3 AUMENTO DA ADOÇÃO DE SISTEMAS DE TRIAGEM AUTOMATIZADOS NOS AEROPORTOS PARA LIDAR COM O AUMENTO DO TRÁFEGO
5.3.4 ALTOS INVESTIMENTOS EM AUTOMAÇÃO DA CADEIA DE SUPRIMENTOS
5.4 DESAFIOS
5.4.1 ALTA VARIEDADE DE TAMANHOS E VOLUMES DE ENCOMENDAS
5.4.2 ESCASSEZ DE PROFISSIONAIS QUALIFICADOS E CONHECIMENTO TÉCNICO
5.4.3 ALTAS EXPECTATIVAS DO CLIENTE SOBRE OS PRAZOS DE ENTREGA
5.4.4 COMPLEXIDADES NA INTEGRIDADE DA AUTOMAÇÃO
5.4.5 APROVEITAMENTO ADEQUADO DO ESPAÇO
6 IMPACTOS DA COVID-19 NO MERCADO DE SISTEMAS DE TRIAGEM DE ENCOMENDAS DA ÁSIA-PACÍFICO
6.1 ANÁLISE DO IMPACTO DA COVID-19 NO MERCADO
6.2 CONSEQUÊNCIAS DA COVID-19 E INICIATIVA DO GOVERNO PARA IMPULSIONAR O MERCADO
6.3 DECISÕES ESTRATÉGICAS PARA FABRICANTES APÓS A COVID-19 PARA GANHAR PARTICIPAÇÃO COMPETITIVA NO MERCADO
6.4 IMPACTO NA DEMANDA
6.5 IMPACTO NA CADEIA DE SUPRIMENTOS
6.6 IMPACTO NO PREÇO
6.7 CONCLUSÃO
7 MERCADO DE SISTEMAS DE TRIAGEM DE ENCOMENDAS DA ÁSIA-PACÍFICO, POR TIPO
7.1 VISÃO GERAL
7.2 SISTEMAS DE CLASSIFICAÇÃO LINEAR DE ENCOMENDAS
7.2.1 CLASSIFICADOR DE SAPATOS
7.2.2 CLASSIFICADORES DE EMPURRÃO
7.2.3 CLASSIFICADORES DE CORREIA ESTREITA/POP-UP
7.2.4 CLASSIFICADORES ARB
7.2.5 CLASSIFICADORES DE PÁS
7.2.6 CLASSIFICADORES DE CORREIA LINEARES/VERTICAIS
7.2.7 CLASSIFICADORES DE PEQUENAS ENCOMENDAS
7.3 SISTEMAS DE CLASSIFICAÇÃO DE ENCOMENDAS EM LOOP
7.3.1 CLASSIFICADORES DE CORREIA CRUZADA (HORIZONTAL)
7.3.2 CLASSIFICADORES DE BANDEJAS INCLINÁVEIS
7.3.3 Classificadores planos/classificadores de compartimento de bombas
8 MERCADO DE SISTEMAS DE CLASSIFICAÇÃO DE ENCOMENDAS DA ÁSIA-PACÍFICO, OFERECENDO
8.1 VISÃO GERAL
8.2 HARDWARE
8.2.1 COMPONENTES ELÉTRICOS E MECÂNICOS
8.2.2 SENSOR
8.2.2.1 SENSOR DE PROXIMIDADE
8.2.2.2 SENSOR ÓPTICO
8.2.2.3 SENSOR DE DESLOCAMENTO
8.2.2.4 SENSOR DE PRESSÃO
8.2.2.5 SENSOR DE FLUXO ANALÓGICO
8.2.3 DESVIADORES
8.2.4 CÂMERAS
8.2.5 PROCESSADORES
8.2.6 VISORES
8.3 SOFTWARE
8.4 SERVIÇOS
9 MERCADO DE SISTEMAS DE CLASSIFICAÇÃO DE ENCOMENDAS DA ÁSIA-PACÍFICO, POR TAMANHO DE BANDEJA
9.1 VISÃO GERAL
9.2 MÉDIO
9.3 PEQUENO
9.4 GRANDE
10 MERCADO DE SISTEMAS DE TRIAGEM DE ENCOMENDAS DA ÁSIA-PACÍFICO, POR CAPACIDADE DE MANUSEIO DE ENCOMENDAS
10.1 VISÃO GERAL
10.2 MENOS DE 20000/H
10.3 20000 A 30000 ENCOMENDAS/HORA
10.4 MAIS DE 30000 ENCOMENDAS/HORA
11 MERCADO DE SISTEMAS DE TRIAGEM DE ENCOMENDAS DA ÁSIA-PACÍFICO, POR USUÁRIO FINAL
11.1 VISÃO GERAL
11.2 E COMÉRCIO
11.2.1 AEROPORTOS
11.2.2 AEROPORTOS INTERNACIONAIS
11.3 LOGÍSTICA
11.3.1 ARMAZENAMENTO E DEPÓSITO
11.3.2 CORREIO
11.3.3 SERVIÇOS POSTAIS
11.3.4 TRANSPORTE DE CARGA
11.4 PRODUTOS FARMACÊUTICOS E MATERIAIS MÉDICOS
11.4.1 DISTRIBUIDORES
11.4.2 FABRICANTES DE MEDICAMENTOS
11.4.3 FORNECEDORES DE INGREDIENTES FARMACÊUTICOS ATIVOS
11.5 ALIMENTOS E BEBIDAS
11.5.1 ALIMENTOS PROCESSADOS
11.5.2 INGREDIENTES CULINÁRIOS PROCESSADOS
11.5.3 ALIMENTOS NÃO PROCESSADOS OU MINIMAMENTE PROCESSADOS
11.6 OUTROS
12 MERCADO DE SISTEMAS DE TRIAGEM DE ENCOMENDAS DA ÁSIA-PACÍFICO, POR REGIÃO
12.1 ÁSIA-PACÍFICO
12.1.1 CHINA
12.1.2 JAPÃO
12.1.3 COREIA DO SUL
12.1.4 ÍNDIA
12.1.5 AUSTRÁLIA
12.1.6 SINGAPURA
12.1.7 INDONÉSIA
12.1.8 TAILÂNDIA
12.1.9 MALÁSIA
12.1.10 FILIPINAS
12.1.11 RESTANTE DA ÁSIA-PACÍFICO
13 MERCADO DE SISTEMAS DE CLASSIFICAÇÃO DE ENCOMENDAS DA ÁSIA-PACÍFICO: PANORAMA DA EMPRESA
13.1 ANÁLISE DE AÇÕES DA EMPRESA: ÁSIA-PACÍFICO
14 ANÁLISE SWOT
15 PERFIL DA EMPRESA
15.1 DAIFUKU CO., LTD.
15.1.1 RESUMO DA EMPRESA
15.1.2 ANÁLISE DE RECEITA
15.1.3 ANÁLISE DAS AÇÕES DA EMPRESA
15.1.4 PORTFÓLIO DE PRODUTOS
15.1.5 DESENVOLVIMENTOS RECENTES
15.2 DEMÁTICO
15.2.1 RESUMO DA EMPRESA
15.2.2 ANÁLISE DAS AÇÕES DA EMPRESA
15.2.3 PORTFÓLIO DE PRODUTOS
15.2.4 DESENVOLVIMENTOS RECENTES
15.3 VANDERLANDE INDUSTRIES BV
15.3.1 RESUMO DA EMPRESA
15.3.2 ANÁLISE DAS AÇÕES DA EMPRESA
15.3.3 PORTFÓLIO DE PRODUTOS
15.3.4 DESENVOLVIMENTOS RECENTES
15.4 PITNEY BOWES INC.
15.4.1 RESUMO DA EMPRESA
15.4.2 ANÁLISE DE RECEITA
15.4.3 ANÁLISE DAS AÇÕES DA EMPRESA
15.4.4 PORTFÓLIO DE PRODUTOS
15.4.5 DESENVOLVIMENTOS RECENTES
15.5 SIEMENS LOGISTICS GMBH (UMA SUBSIDIÁRIA DA SIEMENS AG)
15.5.1 RESUMO DA EMPRESA
15.5.2 ANÁLISE DE RECEITA
15.5.3 ANÁLISE DE AÇÕES DA EMPRESA
15.5.4 PORTFÓLIO DE PRODUTOS
15.5.5 DESENVOLVIMENTOS RECENTES
15.6 BASTIAN SOLUTIONS, LLC
15.6.1 RESUMO DA EMPRESA
15.6.2 PORTFÓLIO DE PRODUTOS
15.6.3 DESENVOLVIMENTOS RECENTES
15.7 GRUPO BEUMER
15.7.1 RESUMO DA EMPRESA
15.7.2 PORTFÓLIO DE PRODUTOS
15.7.3 DESENVOLVIMENTOS RECENTES
15.8 BOWE SYSTEC GMBH
15.8.1 RESUMO DA EMPRESA
15.8.2 PORTFÓLIO DE PRODUTOS
15.8.3 DESENVOLVIMENTOS RECENTES
15.9 EQUINÓCIO
15.9.1 RESUMO DA EMPRESA
15.9.2 PORTFÓLIO DE PRODUTOS
15.9.3 DESENVOLVIMENTOS RECENTES
15.1 CINCOS
15.10.1 RESUMO DA EMPRESA
15.10.2 PORTFÓLIO DE PRODUTOS
15.10.3 DESENVOLVIMENTOS RECENTES
15.11 GBI INTRALOGÍSTICA, INC
15.11.1 RESUMO DA EMPRESA
15.11.2 PORTFÓLIO DE PRODUTOS
15.11.3 DESENVOLVIMENTO RECENTE
15.12 HONEYWELL INTERNATIONAL INC
15.12.1 RESUMO DA EMPRESA
15.12.2 ANÁLISE DE RECEITA
15.12.3 PORTFÓLIO DE PRODUTOS
15.12.4 DESENVOLVIMENTO RECENTE
15.13 GRUPO INTERROLL
15.13.1 RESUMO DA EMPRESA
15.13.2 ANÁLISE DE RECEITA
15.13.3 PORTFÓLIO DE PRODUTOS
15.13.4 DESENVOLVIMENTOS RECENTES
15.14 INTRALOX
15.14.1 RESUMO DA EMPRESA
15.14.2 PORTFÓLIO DE PRODUTOS
15.14.3 DESENVOLVIMENTOS RECENTES
15.15 INVATA INTRALOGÍSTICA
15.15.1 RESUMO DA EMPRESA
15.15.2 PORTFÓLIO DE PRODUTOS
15.15.3 DESENVOLVIMENTOS RECENTES
15.16 MHS ÁSIA PACÍFICO
15.16.1 RESUMO DA EMPRESA
15.16.2 PORTFÓLIO DE PRODUTOS
15.16.3 DESENVOLVIMENTOS RECENTES
15.17 MURATA MACHINERY, LTD.
15.17.1 RESUMO DA EMPRESA
15.17.2 PORTFÓLIO DE PRODUTOS
15.17.3 DESENVOLVIMENTOS RECENTES
15.18 OKURA YUSOKI CO., LTD.
15.18.1 RESUMO DA EMPRESA
15.18.2 PORTFÓLIO DE PRODUTOS
15.18.3 DESENVOLVIMENTOS RECENTES
15.19 SOLYSTIC SAS
15.19.1 RESUMO DA EMPRESA
15.19.2 PORTFÓLIO DE PRODUTOS
15.19.3 DESENVOLVIMENTOS RECENTES
15.2 VIASTORE
15.20.1 RESUMO DA EMPRESA
15.20.2 PORTFÓLIO DE PRODUTOS
15.20.3 DESENVOLVIMENTO RECENTE
16 QUESTIONÁRIO
17 RELATÓRIOS RELACIONADOS
Lista de Tabela
TABELA 1 MERCADO DE SISTEMAS DE TRIAGEM DE ENCOMENDAS DA ÁSIA-PACÍFICO, POR TIPO, 2020-2029 (US$ MILHÕES)
TABELA 2 SISTEMAS DE CLASSIFICAÇÃO LINEAR DE ENCOMENDAS DA ÁSIA-PACÍFICO NO MERCADO DE SISTEMAS DE CLASSIFICAÇÃO DE ENCOMENDAS, POR REGIÃO, 2020-2029 (US$ MILHÕES)
TABELA 3 SISTEMAS DE CLASSIFICAÇÃO LINEAR DE ENCOMENDAS DA ÁSIA-PACÍFICO NO MERCADO DE SISTEMAS DE CLASSIFICAÇÃO DE ENCOMENDAS, POR TIPO, 2020-2029 (US$ MILHÕES)
TABELA 4 SISTEMAS DE CLASSIFICAÇÃO DE ENCOMENDAS DA ÁSIA-PACÍFICO NO MERCADO DE SISTEMAS DE CLASSIFICAÇÃO DE ENCOMENDAS, POR REGIÃO, 2020-2029 (US$ MILHÕES)
TABELA 5 SISTEMAS DE CLASSIFICAÇÃO DE ENCOMENDAS DA ÁSIA-PACÍFICO NO MERCADO DE SISTEMAS DE CLASSIFICAÇÃO DE ENCOMENDAS, POR TIPO, 2020-2029 (US$ MILHÕES)
TABELA 6 MERCADO DE SISTEMAS DE TRIAGEM DE ENCOMENDAS DA ÁSIA-PACÍFICO, POR OFERTA, 2020-2029 (US$ MILHÕES)
TABELA 7: MERCADO DE HARDWARE DA ÁSIA-PACÍFICO NO MERCADO DE SISTEMAS DE TRIAGEM DE ENCOMENDAS, POR REGIÃO, 2020-2029 (US$ MILHÕES)
TABELA 8: MERCADO DE HARDWARE DA ÁSIA-PACÍFICO NO MERCADO DE SISTEMAS DE TRIAGEM DE ENCOMENDAS, POR TIPO, 2020-2029 (US$ MILHÕES)
TABELA 9 SENSORES NO MERCADO DE SISTEMAS DE TRIAGEM DE ENCOMENDAS DA ÁSIA-PACÍFICO, POR TIPO, 2020-2029 (US$ MILHÕES)
TABELA 10 SOFTWARE NO MERCADO DE SISTEMAS DE TRIAGEM DE ENCOMENDAS DA ÁSIA-PACÍFICO, POR REGIÃO, 2020-2029 (US$ MILHÕES)
TABELA 11 SERVIÇOS DA ÁSIA-PACÍFICO NO MERCADO DE SISTEMAS DE TRIAGEM DE ENCOMENDAS, POR REGIÃO, 2020-2029 (US$ MILHÕES)
TABELA 12 MERCADO DE SISTEMAS DE CLASSIFICAÇÃO DE ENCOMENDAS DA ÁSIA-PACÍFICO, POR TAMANHO DE BANDEJA, 2020-2029 (US$ MILHÕES)
TABELA 13 MERCADO DE SISTEMAS DE TRIAGEM DE ENCOMENDAS DA ÁSIA-PACÍFICO, POR REGIÃO, 2020-2029 (US$ MILHÕES)
TABELA 14 MERCADO DE SISTEMAS DE TRIAGEM DE PEQUENAS ENCOMENDAS DA ÁSIA-PACÍFICO, POR REGIÃO, 2020-2029 (US$ MILHÕES)
TABELA 15 GRANDE MERCADO DE SISTEMAS DE TRIAGEM DE ENCOMENDAS NA ÁSIA-PACÍFICO, POR REGIÃO, 2020-2029 (US$ MILHÕES)
TABELA 16 MERCADO DE SISTEMAS DE TRIAGEM DE ENCOMENDAS DA ÁSIA-PACÍFICO, POR CAPACIDADE DE MANUSEIO DE ENCOMENDAS, 2020-2029 (US$ MILHÕES)
TABELA 17 ÁSIA-PACÍFICO MENOS DE 20.000 ENCOMENDAS/HORA NO MERCADO DE SISTEMAS DE TRIAGEM DE ENCOMENDAS, POR REGIÃO, 2020-2029 (US$ MILHÕES)
TABELA 18 ÁSIA-PACÍFICO 20.000 A 30.000 PACOTES/HORA NO MERCADO DE SISTEMAS DE TRIAGEM DE PACOTES, POR REGIÃO, 2020-2029 (US$ MILHÕES)
TABELA 19 ÁSIA-PACÍFICO MAIS DE 30.000 PACOTES/HORA NO MERCADO DE SISTEMAS DE TRIAGEM DE PACOTES, POR REGIÃO, 2020-2029 (US$ MILHÕES)
TABELA 20 MERCADO DE SISTEMAS DE TRIAGEM DE ENCOMENDAS DA ÁSIA-PACÍFICO, POR USUÁRIO FINAL, 2020-2029 (US$ MILHÕES)
TABELA 21 COMÉRCIO ELETRÔNICO DA ÁSIA-PACÍFICO NO MERCADO DE SISTEMAS DE TRIAGEM DE ENCOMENDAS, POR REGIÃO, 2020-2029 (US$ MILHÕES)
TABELA 22 COMÉRCIO ELETRÔNICO DA ÁSIA-PACÍFICO NO MERCADO DE SISTEMAS DE TRIAGEM DE ENCOMENDAS, POR TIPO, 2020-2029 (US$ MILHÕES)
TABELA 23 LOGÍSTICA DA ÁSIA-PACÍFICO NO MERCADO DE SISTEMAS DE TRIAGEM DE ENCOMENDAS, POR REGIÃO, 2020-2029 (US$ MILHÕES)
TABELA 24 LOGÍSTICA DA ÁSIA-PACÍFICO NO MERCADO DE SISTEMAS DE TRIAGEM DE ENCOMENDAS, POR TIPO, 2020-2029 (US$ MILHÕES)
TABELA 25 PRODUTOS FARMACÊUTICOS E SUPRIMENTOS MÉDICOS NA ÁSIA-PACÍFICO NO MERCADO DE SISTEMAS DE TRIAGEM DE ENCOMENDAS, POR REGIÃO, 2020-2029 (US$ MILHÕES)
TABELA 26 PRODUTOS FARMACÊUTICOS E SUPRIMENTOS MÉDICOS NA ÁSIA-PACÍFICO NO MERCADO DE SISTEMAS DE TRIAGEM DE ENCOMENDAS, POR TIPO, 2020-2029 (US$ MILHÕES)
TABELA 27 MERCADO DE ALIMENTOS E BEBIDAS DA ÁSIA-PACÍFICO EM SISTEMAS DE CLASSIFICAÇÃO DE ENCOMENDAS, POR REGIÃO, 2020-2029 (US$ MILHÕES)
TABELA 28 MERCADO DE ALIMENTOS E BEBIDAS DA ÁSIA-PACÍFICO EM SISTEMAS DE CLASSIFICAÇÃO DE ENCOMENDAS, POR TIPO, 2020-2029 (US$ MILHÕES)
TABELA 29 ÁSIA-PACÍFICO OUTROS NO MERCADO DE SISTEMAS DE TRIAGEM DE ENCOMENDAS, POR REGIÃO, 2020-2029 (US$ MILHÕES)
TABELA 30 MERCADO DE SISTEMAS DE TRIAGEM DE ENCOMENDAS DA ÁSIA-PACÍFICO, POR PAÍS, 2020-2029 (US$ MILHÕES)
TABELA 31 MERCADO DE SISTEMAS DE TRIAGEM DE ENCOMENDAS DA ÁSIA-PACÍFICO, POR TIPO, 2020-2029 (US$ MILHÕES)
TABELA 32 SISTEMAS DE CLASSIFICAÇÃO LINEAR DE ENCOMENDAS DA ÁSIA-PACÍFICO NO MERCADO DE SISTEMAS DE CLASSIFICAÇÃO DE ENCOMENDAS, POR TIPO, 2020-2029 (US$ MILHÕES)
TABELA 33 SISTEMAS DE CLASSIFICAÇÃO DE ENCOMENDAS DA ÁSIA-PACÍFICO NO MERCADO DE SISTEMAS DE CLASSIFICAÇÃO DE ENCOMENDAS, POR TIPO, 2020-2029 (US$ MILHÕES)
TABELA 34 MERCADO DE SISTEMAS DE TRIAGEM DE ENCOMENDAS DA ÁSIA-PACÍFICO, POR OFERTA, 2020-2029 (US$ MILHÕES)
TABELA 35 HARDWARE NO MERCADO DE SISTEMAS DE TRIAGEM DE ENCOMENDAS DA ÁSIA-PACÍFICO, POR TIPO, 2020-2029 (US$ MILHÕES)
TABELA 36 SENSORES DA ÁSIA-PACÍFICO NO MERCADO DE SISTEMAS DE TRIAGEM DE ENCOMENDAS, POR TIPO, 2020-2029 (US$ MILHÕES)
TABELA 37 MERCADO DE SISTEMAS DE TRIAGEM DE ENCOMENDAS DA ÁSIA-PACÍFICO, POR TAMANHO DE BANDEJA, 2020-2029 (US$ MILHÕES)
TABELA 38 MERCADO DE SISTEMAS DE TRIAGEM DE ENCOMENDAS DA ÁSIA-PACÍFICO, POR CAPACIDADE DE MANUSEIO DE ENCOMENDAS, 2020-2029 (US$ MILHÕES)
TABELA 39 MERCADO DE SISTEMAS DE TRIAGEM DE ENCOMENDAS DA ÁSIA-PACÍFICO, POR USUÁRIO FINAL, 2020-2029 (US$ MILHÕES)
TABELA 40 COMÉRCIO ELETRÔNICO NA ÁSIA-PACÍFICO NO MERCADO DE SISTEMAS DE TRIAGEM DE ENCOMENDAS, POR TIPO, 2020-2029 (US$ MILHÕES)
TABELA 41 LOGÍSTICA NA ÁSIA-PACÍFICO NO MERCADO DE SISTEMAS DE TRIAGEM DE ENCOMENDAS, POR TIPO, 2020-2029 (US$ MILHÕES)
TABELA 42 PRODUTOS FARMACÊUTICOS E SUPRIMENTOS MÉDICOS NA ÁSIA-PACÍFICO NO MERCADO DE SISTEMAS DE TRIAGEM DE ENCOMENDAS, POR TIPO, 2020-2029 (US$ MILHÕES)
TABELA 43 MERCADO DE ALIMENTOS E BEBIDAS NA ÁSIA-PACÍFICO EM SISTEMAS DE CLASSIFICAÇÃO DE ENCOMENDAS, POR TIPO, 2020-2029 (US$ MILHÕES)
TABELA 44 MERCADO DE SISTEMAS DE TRIAGEM DE ENCOMENDAS DA CHINA, POR TIPO, 2020-2029 (US$ MILHÕES)
TABELA 45 SISTEMAS DE CLASSIFICAÇÃO LINEAR DE ENCOMENDAS DA CHINA NO MERCADO DE SISTEMAS DE CLASSIFICAÇÃO DE ENCOMENDAS, POR TIPO, 2020-2029 (US$ MILHÕES)
TABELA 46 SISTEMAS DE CLASSIFICAÇÃO DE ENCOMENDAS DA CHINA LOOP NO MERCADO DE SISTEMAS DE CLASSIFICAÇÃO DE ENCOMENDAS, POR TIPO, 2020-2029 (US$ MILHÕES)
TABELA 47 MERCADO DE SISTEMAS DE TRIAGEM DE ENCOMENDAS DA CHINA, POR OFERTA, 2020-2029 (US$ MILHÕES)
TABELA 48: MERCADO DE HARDWARE DA CHINA PARA SISTEMAS DE TRIAGEM DE ENCOMENDAS, POR TIPO, 2020-2029 (US$ MILHÕES)
TABELA 49 SENSORES DA CHINA NO MERCADO DE SISTEMAS DE TRIAGEM DE ENCOMENDAS, POR TIPO, 2020-2029 (US$ MILHÕES)
TABELA 50 MERCADO DE SISTEMAS DE CLASSIFICAÇÃO DE ENCOMENDAS DA CHINA, POR TAMANHO DE BANDEJA, 2020-2029 (US$ MILHÕES)
TABELA 51 MERCADO DE SISTEMAS DE TRIAGEM DE ENCOMENDAS DA CHINA, POR CAPACIDADE DE MANUSEIO DE ENCOMENDAS, 2020-2029 (US$ MILHÕES)
TABELA 52 MERCADO DE SISTEMAS DE TRIAGEM DE ENCOMENDAS DA CHINA, POR USUÁRIO FINAL, 2020-2029 (US$ MILHÕES)
TABELA 53 COMÉRCIO ELETRÔNICO DA CHINA NO MERCADO DE SISTEMAS DE TRIAGEM DE ENCOMENDAS, POR TIPO, 2020-2029 (US$ MILHÕES)
TABELA 54 LOGÍSTICA CHINESA NO MERCADO DE SISTEMAS DE TRIAGEM DE ENCOMENDAS, POR TIPO, 2020-2029 (US$ MILHÕES)
TABELA 55 PRODUTOS FARMACÊUTICOS E SUPRIMENTOS MÉDICOS NA CHINA NO MERCADO DE SISTEMAS DE TRIAGEM DE ENCOMENDAS, POR TIPO, 2020-2029 (US$ MILHÕES)
TABELA 56 MERCADO DE ALIMENTOS E BEBIDAS DA CHINA EM SISTEMAS DE CLASSIFICAÇÃO DE ENCOMENDAS, POR TIPO, 2020-2029 (US$ MILHÕES)
TABELA 57 MERCADO DE SISTEMAS DE TRIAGEM DE ENCOMENDAS NO JAPÃO, POR TIPO, 2020-2029 (US$ MILHÕES)
TABELA 58 SISTEMAS DE CLASSIFICAÇÃO LINEAR DE ENCOMENDAS DO JAPÃO NO MERCADO DE SISTEMAS DE CLASSIFICAÇÃO DE ENCOMENDAS, POR TIPO, 2020-2029 (US$ MILHÕES)
TABELA 59 SISTEMAS DE CLASSIFICAÇÃO DE ENCOMENDAS DO JAPÃO NO MERCADO DE SISTEMAS DE CLASSIFICAÇÃO DE ENCOMENDAS, POR TIPO, 2020-2029 (US$ MILHÕES)
TABELA 60 MERCADO DE SISTEMAS DE TRIAGEM DE ENCOMENDAS DO JAPÃO, POR OFERTA, 2020-2029 (US$ MILHÕES)
TABELA 61: HARDWARE NO MERCADO DE SISTEMAS DE TRIAGEM DE ENCOMENDAS DO JAPÃO, POR TIPO, 2020-2029 (US$ MILHÕES)
TABELA 62 SENSORES NO MERCADO DE SISTEMAS DE TRIAGEM DE ENCOMENDAS DO JAPÃO, POR TIPO, 2020-2029 (US$ MILHÕES)
TABELA 63 MERCADO DE SISTEMAS DE CLASSIFICAÇÃO DE ENCOMENDAS NO JAPÃO, POR TAMANHO DE BANDEJA, 2020-2029 (US$ MILHÕES)
TABELA 64 MERCADO DE SISTEMAS DE TRIAGEM DE ENCOMENDAS NO JAPÃO, POR CAPACIDADE DE MANUSEIO DE ENCOMENDAS, 2020-2029 (US$ MILHÕES)
TABELA 65 MERCADO DE SISTEMAS DE TRIAGEM DE ENCOMENDAS NO JAPÃO, POR USUÁRIO FINAL, 2020-2029 (US$ MILHÕES)
TABELA 66 COMÉRCIO ELETRÔNICO NO JAPÃO NO MERCADO DE SISTEMAS DE TRIAGEM DE ENCOMENDAS, POR TIPO, 2020-2029 (US$ MILHÕES)
TABELA 67 LOGÍSTICA NO JAPÃO NO MERCADO DE SISTEMAS DE TRIAGEM DE ENCOMENDAS, POR TIPO, 2020-2029 (US$ MILHÕES)
TABELA 68 PRODUTOS FARMACÊUTICOS E MÉDICOS NO MERCADO DE SISTEMAS DE TRIAGEM DE ENCOMENDAS DO JAPÃO, POR TIPO, 2020-2029 (US$ MILHÕES)
TABELA 69 MERCADO DE ALIMENTOS E BEBIDAS NO JAPÃO EM SISTEMAS DE CLASSIFICAÇÃO DE ENCOMENDAS, POR TIPO, 2020-2029 (US$ MILHÕES)
TABELA 70 MERCADO DE SISTEMAS DE TRIAGEM DE ENCOMENDAS DA COREIA DO SUL, POR TIPO, 2020-2029 (US$ MILHÕES)
TABELA 71 SISTEMAS DE TRIAGEM LINEAR DE ENCOMENDAS DA COREIA DO SUL NO MERCADO DE SISTEMAS DE TRIAGEM DE ENCOMENDAS, POR TIPO, 2020-2029 (US$ MILHÕES)
TABELA 72 SISTEMAS DE CLASSIFICAÇÃO DE ENCOMENDAS EM LOOP DA COREIA DO SUL NO MERCADO DE SISTEMAS DE CLASSIFICAÇÃO DE ENCOMENDAS, POR TIPO, 2020-2029 (US$ MILHÕES)
TABELA 73 MERCADO DE SISTEMAS DE TRIAGEM DE ENCOMENDAS DA COREIA DO SUL, POR OFERTA, 2020-2029 (US$ MILHÕES)
TABELA 74: MERCADO DE HARDWARE PARA SISTEMAS DE TRIAGEM DE ENCOMENDAS DA COREIA DO SUL, POR TIPO, 2020-2029 (US$ MILHÕES)
TABELA 75 SENSORES DA COREIA DO SUL NO MERCADO DE SISTEMAS DE TRIAGEM DE ENCOMENDAS, POR TIPO, 2020-2029 (US$ MILHÕES)
TABELA 76 MERCADO DE SISTEMAS DE TRIAGEM DE ENCOMENDAS DA COREIA DO SUL, POR TAMANHO DE BANDEJA, 2020-2029 (US$ MILHÕES)
TABELA 77 MERCADO DE SISTEMAS DE TRIAGEM DE ENCOMENDAS DA COREIA DO SUL, POR CAPACIDADE DE MANUSEIO DE ENCOMENDAS, 2020-2029 (US$ MILHÕES)
TABELA 78 MERCADO DE SISTEMAS DE TRIAGEM DE ENCOMENDAS DA COREIA DO SUL, POR USUÁRIO FINAL, 2020-2029 (US$ MILHÕES)
TABELA 79 COMÉRCIO ELETRÔNICO DA COREIA DO SUL NO MERCADO DE SISTEMAS DE TRIAGEM DE ENCOMENDAS, POR TIPO, 2020-2029 (US$ MILHÕES)
TABELA 80 LOGÍSTICA DA COREIA DO SUL NO MERCADO DE SISTEMAS DE TRIAGEM DE ENCOMENDAS, POR TIPO, 2020-2029 (US$ MILHÕES)
TABELA 81 PRODUTOS FARMACÊUTICOS E MÉDICOS NO MERCADO DE SISTEMAS DE TRIAGEM DE ENCOMENDAS DA COREIA DO SUL, POR TIPO, 2020-2029 (US$ MILHÕES)
TABELA 82 MERCADO DE ALIMENTOS E BEBIDAS EM SISTEMAS DE TRIAGEM DE ENCOMENDAS DA COREIA DO SUL, POR TIPO, 2020-2029 (US$ MILHÕES)
TABELA 83 MERCADO DE SISTEMAS DE TRIAGEM DE ENCOMENDAS DA ÍNDIA, POR TIPO, 2020-2029 (US$ MILHÕES)
TABELA 84 SISTEMAS DE CLASSIFICAÇÃO LINEAR DE ENCOMENDAS DA ÍNDIA NO MERCADO DE SISTEMAS DE CLASSIFICAÇÃO DE ENCOMENDAS, POR TIPO, 2020-2029 (US$ MILHÕES)
TABELA 85 SISTEMAS DE CLASSIFICAÇÃO DE ENCOMENDAS EM LOOP DA ÍNDIA NO MERCADO DE SISTEMAS DE CLASSIFICAÇÃO DE ENCOMENDAS, POR TIPO, 2020-2029 (US$ MILHÕES)
TABELA 86 MERCADO DE SISTEMAS DE TRIAGEM DE ENCOMENDAS DA ÍNDIA, POR OFERTA, 2020-2029 (US$ MILHÕES)
TABELA 87 MERCADO DE HARDWARE NA ÍNDIA PARA SISTEMAS DE TRIAGEM DE ENCOMENDAS, POR TIPO, 2020-2029 (US$ MILHÕES)
TABELA 88 SENSORES NO MERCADO DE SISTEMAS DE TRIAGEM DE ENCOMENDAS DA ÍNDIA, POR TIPO, 2020-2029 (US$ MILHÕES)
TABELA 89 MERCADO DE SISTEMAS DE CLASSIFICAÇÃO DE ENCOMENDAS DA ÍNDIA, POR TAMANHO DE BANDEJA, 2020-2029 (US$ MILHÕES)
TABELA 90 MERCADO DE SISTEMAS DE TRIAGEM DE ENCOMENDAS DA ÍNDIA, POR CAPACIDADE DE MANUSEIO DE ENCOMENDAS, 2020-2029 (US$ MILHÕES)
TABELA 91 MERCADO DE SISTEMAS DE TRIAGEM DE ENCOMENDAS DA ÍNDIA, POR USUÁRIO FINAL, 2020-2029 (US$ MILHÕES)
TABELA 92 COMÉRCIO ELETRÔNICO NA ÍNDIA NO MERCADO DE SISTEMAS DE TRIAGEM DE ENCOMENDAS, POR TIPO, 2020-2029 (US$ MILHÕES)
TABELA 93 LOGÍSTICA NA ÍNDIA NO MERCADO DE SISTEMAS DE TRIAGEM DE ENCOMENDAS, POR TIPO, 2020-2029 (US$ MILHÕES)
TABELA 94 PRODUTOS FARMACÊUTICOS E SUPRIMENTOS MÉDICOS NA ÍNDIA NO MERCADO DE SISTEMAS DE TRIAGEM DE ENCOMENDAS, POR TIPO, 2020-2029 (US$ MILHÕES)
TABELA 95 MERCADO DE ALIMENTOS E BEBIDAS NA ÍNDIA EM SISTEMAS DE CLASSIFICAÇÃO DE PACOTES, POR TIPO, 2020-2029 (US$ MILHÕES)
TABELA 96 MERCADO DE SISTEMAS DE TRIAGEM DE ENCOMENDAS DA AUSTRÁLIA, POR TIPO, 2020-2029 (US$ MILHÕES)
TABELA 97 SISTEMAS DE CLASSIFICAÇÃO LINEAR DE ENCOMENDAS DA AUSTRÁLIA NO MERCADO DE SISTEMAS DE CLASSIFICAÇÃO DE ENCOMENDAS, POR TIPO, 2020-2029 (US$ MILHÕES)
TABELA 98 SISTEMAS DE CLASSIFICAÇÃO DE ENCOMENDAS EM LOOP DA AUSTRÁLIA NO MERCADO DE SISTEMAS DE CLASSIFICAÇÃO DE ENCOMENDAS, POR TIPO, 2020-2029 (US$ MILHÕES)
TABELA 99 MERCADO DE SISTEMAS DE TRIAGEM DE ENCOMENDAS DA AUSTRÁLIA, POR OFERTA, 2020-2029 (US$ MILHÕES)
TABELA 100: MERCADO DE HARDWARE NA AUSTRÁLIA PARA SISTEMAS DE TRIAGEM DE ENCOMENDAS, POR TIPO, 2020-2029 (US$ MILHÕES)
TABELA 101 SENSORES NO MERCADO DE SISTEMAS DE TRIAGEM DE ENCOMENDAS DA AUSTRÁLIA, POR TIPO, 2020-2029 (US$ MILHÕES)
TABELA 102 MERCADO DE SISTEMAS DE CLASSIFICAÇÃO DE ENCOMENDAS DA AUSTRÁLIA, POR TAMANHO DE BANDEJA, 2020-2029 (US$ MILHÕES)
TABELA 103 MERCADO DE SISTEMAS DE TRIAGEM DE ENCOMENDAS DA AUSTRÁLIA, POR CAPACIDADE DE MANUSEIO DE ENCOMENDAS, 2020-2029 (US$ MILHÕES)
TABELA 104 MERCADO DE SISTEMAS DE TRIAGEM DE ENCOMENDAS DA AUSTRÁLIA, POR USUÁRIO FINAL, 2020-2029 (US$ MILHÕES)
TABELA 105 COMÉRCIO ELETRÔNICO NA AUSTRÁLIA NO MERCADO DE SISTEMAS DE TRIAGEM DE ENCOMENDAS, POR TIPO, 2020-2029 (US$ MILHÕES)
TABELA 106 LOGÍSTICA AUSTRÁLIA NO MERCADO DE SISTEMAS DE TRIAGEM DE ENCOMENDAS, POR TIPO, 2020-2029 (US$ MILHÕES)
TABELA 107 PRODUTOS FARMACÊUTICOS E MÉDICOS NO MERCADO DE SISTEMAS DE TRIAGEM DE ENCOMENDAS DA AUSTRÁLIA, POR TIPO, 2020-2029 (US$ MILHÕES)
TABELA 108 MERCADO DE ALIMENTOS E BEBIDAS NA AUSTRÁLIA EM SISTEMAS DE TRIAGEM DE ENCOMENDAS, POR TIPO, 2020-2029 (US$ MILHÕES)
TABELA 109 MERCADO DE SISTEMAS DE TRIAGEM DE ENCOMENDAS DE SINGAPURA, POR TIPO, 2020-2029 (US$ MILHÕES)
TABELA 110 SISTEMAS DE CLASSIFICAÇÃO LINEAR DE ENCOMENDAS DE SINGAPURA NO MERCADO DE SISTEMAS DE CLASSIFICAÇÃO DE ENCOMENDAS, POR TIPO, 2020-2029 (US$ MILHÕES)
TABELA 111 SISTEMAS DE CLASSIFICAÇÃO DE ENCOMENDAS EM CIRCUITO DE SINGAPURA NO MERCADO DE SISTEMAS DE CLASSIFICAÇÃO DE ENCOMENDAS, POR TIPO, 2020-2029 (US$ MILHÕES)
TABELA 112 MERCADO DE SISTEMAS DE TRIAGEM DE ENCOMENDAS DE SINGAPURA, POR OFERTA, 2020-2029 (US$ MILHÕES)
TABELA 113 HARDWARE NO MERCADO DE SISTEMAS DE TRIAGEM DE ENCOMENDAS DE SINGAPURA, POR TIPO, 2020-2029 (US$ MILHÕES)
TABELA 114 SENSORES DE SINGAPURA NO MERCADO DE SISTEMAS DE TRIAGEM DE ENCOMENDAS, POR TIPO, 2020-2029 (US$ MILHÕES)
TABELA 115 MERCADO DE SISTEMAS DE TRIAGEM DE ENCOMENDAS DE SINGAPURA, POR TAMANHO DE BANDEJA, 2020-2029 (US$ MILHÕES)
TABELA 116 MERCADO DE SISTEMAS DE TRIAGEM DE ENCOMENDAS DE SINGAPURA, POR CAPACIDADE DE MANUSEIO DE ENCOMENDAS, 2020-2029 (US$ MILHÕES)
TABELA 117 MERCADO DE SISTEMAS DE TRIAGEM DE ENCOMENDAS DE SINGAPURA, POR USUÁRIO FINAL, 2020-2029 (US$ MILHÕES)
TABELA 118 COMÉRCIO ELETRÔNICO DE SINGAPURA NO MERCADO DE SISTEMAS DE TRIAGEM DE ENCOMENDAS, POR TIPO, 2020-2029 (US$ MILHÕES)
TABELA 119 LOGÍSTICA DE SINGAPURA NO MERCADO DE SISTEMAS DE TRIAGEM DE ENCOMENDAS, POR TIPO, 2020-2029 (US$ MILHÕES)
TABELA 120 PRODUTOS FARMACÊUTICOS E MÉDICOS DE SINGAPURA NO MERCADO DE SISTEMAS DE TRIAGEM DE ENCOMENDAS, POR TIPO, 2020-2029 (US$ MILHÕES)
TABELA 121 MERCADO DE ALIMENTOS E BEBIDAS EM SISTEMAS DE TRIAGEM DE ENCOMENDAS DE SINGAPURA, POR TIPO, 2020-2029 (US$ MILHÕES)
TABELA 122 MERCADO DE SISTEMAS DE TRIAGEM DE ENCOMENDAS DA INDONÉSIA, POR TIPO, 2020-2029 (US$ MILHÕES)
TABELA 123 SISTEMAS DE CLASSIFICAÇÃO LINEAR DE ENCOMENDAS DA INDONÉSIA NO MERCADO DE SISTEMAS DE CLASSIFICAÇÃO DE ENCOMENDAS, POR TIPO, 2020-2029 (US$ MILHÕES)
TABELA 124 SISTEMAS DE CLASSIFICAÇÃO DE ENCOMENDAS EM LOOP DA INDONÉSIA NO MERCADO DE SISTEMAS DE CLASSIFICAÇÃO DE ENCOMENDAS, POR TIPO, 2020-2029 (US$ MILHÕES)
TABELA 125 MERCADO DE SISTEMAS DE TRIAGEM DE ENCOMENDAS DA INDONÉSIA, POR OFERTA, 2020-2029 (US$ MILHÕES)
TABELA 126 MERCADO DE HARDWARE NA INDONÉSIA PARA SISTEMAS DE TRIAGEM DE ENCOMENDAS, POR TIPO, 2020-2029 (US$ MILHÕES)
TABELA 127 SENSORES NO MERCADO DE SISTEMAS DE TRIAGEM DE ENCOMENDAS DA INDONÉSIA, POR TIPO, 2020-2029 (US$ MILHÕES)
TABELA 128 MERCADO DE SISTEMAS DE CLASSIFICAÇÃO DE ENCOMENDAS DA INDONÉSIA, POR TAMANHO DE BANDEJA, 2020-2029 (US$ MILHÕES)
TABELA 129 MERCADO DE SISTEMAS DE TRIAGEM DE ENCOMENDAS DA INDONÉSIA, POR CAPACIDADE DE MANUSEIO DE ENCOMENDAS, 2020-2029 (US$ MILHÕES)
TABELA 130 MERCADO DE SISTEMAS DE TRIAGEM DE ENCOMENDAS DA INDONÉSIA, POR USUÁRIO FINAL, 2020-2029 (US$ MILHÕES)
TABELA 131 COMÉRCIO ELETRÔNICO NA INDONÉSIA NO MERCADO DE SISTEMAS DE TRIAGEM DE ENCOMENDAS, POR TIPO, 2020-2029 (US$ MILHÕES)
TABELA 132 LOGÍSTICA NA INDONÉSIA NO MERCADO DE SISTEMAS DE TRIAGEM DE ENCOMENDAS, POR TIPO, 2020-2029 (US$ MILHÕES)
TABELA 133 PRODUTOS FARMACÊUTICOS E MÉDICOS NO MERCADO DE SISTEMAS DE TRIAGEM DE ENCOMENDAS DA INDONÉSIA, POR TIPO, 2020-2029 (US$ MILHÕES)
TABELA 134 MERCADO DE ALIMENTOS E BEBIDAS NA INDONÉSIA EM SISTEMAS DE TRIAGEM DE ENCOMENDAS, POR TIPO, 2020-2029 (US$ MILHÕES)
TABELA 135 MERCADO DE SISTEMAS DE TRIAGEM DE ENCOMENDAS DA TAILÂNDIA, POR TIPO, 2020-2029 (US$ MILHÕES)
TABELA 136 SISTEMAS DE CLASSIFICAÇÃO LINEAR DE ENCOMENDAS DA TAILÂNDIA NO MERCADO DE SISTEMAS DE CLASSIFICAÇÃO DE ENCOMENDAS, POR TIPO, 2020-2029 (US$ MILHÕES)
TABELA 137 SISTEMAS DE CLASSIFICAÇÃO DE ENCOMENDAS DA TAILÂNDIA LOOP NO MERCADO DE SISTEMAS DE CLASSIFICAÇÃO DE ENCOMENDAS, POR TIPO, 2020-2029 (US$ MILHÕES)
TABELA 138 MERCADO DE SISTEMAS DE TRIAGEM DE ENCOMENDAS DA TAILÂNDIA, POR OFERTA, 2020-2029 (US$ MILHÕES)
TABELA 139 - MERCADO DE HARDWARE NA TAILÂNDIA PARA SISTEMAS DE TRIAGEM DE ENCOMENDAS, POR TIPO, 2020-2029 (US$ MILHÕES)
TABELA 140 SENSORES NO MERCADO DE SISTEMAS DE TRIAGEM DE ENCOMENDAS DA TAILÂNDIA, POR TIPO, 2020-2029 (US$ MILHÕES)
TABELA 141 MERCADO DE SISTEMAS DE TRIAGEM DE ENCOMENDAS DA TAILÂNDIA, POR TAMANHO DE BANDEJA, 2020-2029 (US$ MILHÕES)
TABELA 142 MERCADO DE SISTEMAS DE TRIAGEM DE ENCOMENDAS DA TAILÂNDIA, POR CAPACIDADE DE MANUSEIO DE ENCOMENDAS, 2020-2029 (US$ MILHÕES)
TABELA 143 MERCADO DE SISTEMAS DE TRIAGEM DE ENCOMENDAS DA TAILÂNDIA, POR USUÁRIO FINAL, 2020-2029 (US$ MILHÕES)
TABELA 144 COMÉRCIO ELETRÔNICO DA TAILÂNDIA NO MERCADO DE SISTEMAS DE TRIAGEM DE ENCOMENDAS, POR TIPO, 2020-2029 (US$ MILHÕES)
TABELA 145 LOGÍSTICA DA TAILÂNDIA NO MERCADO DE SISTEMAS DE TRIAGEM DE ENCOMENDAS, POR TIPO, 2020-2029 (US$ MILHÕES)
TABELA 146 PRODUTOS FARMACÊUTICOS E MÉDICOS DA TAILÂNDIA NO MERCADO DE SISTEMAS DE TRIAGEM DE ENCOMENDAS, POR TIPO, 2020-2029 (US$ MILHÕES)
TABELA 147 MERCADO DE ALIMENTOS E BEBIDAS DA TAILÂNDIA EM SISTEMAS DE CLASSIFICAÇÃO DE ENCOMENDAS, POR TIPO, 2020-2029 (US$ MILHÕES)
TABELA 148 MERCADO DE SISTEMAS DE TRIAGEM DE ENCOMENDAS DA MALÁSIA, POR TIPO, 2020-2029 (US$ MILHÕES)
TABELA 149 SISTEMAS DE CLASSIFICAÇÃO LINEAR DE ENCOMENDAS DA MALÁSIA NO MERCADO DE SISTEMAS DE CLASSIFICAÇÃO DE ENCOMENDAS, POR TIPO, 2020-2029 (US$ MILHÕES)
TABELA 150 SISTEMAS DE CLASSIFICAÇÃO DE ENCOMENDAS LOOP DA MALÁSIA NO MERCADO DE SISTEMAS DE CLASSIFICAÇÃO DE ENCOMENDAS, POR TIPO, 2020-2029 (US$ MILHÕES)
TABELA 151 MERCADO DE SISTEMAS DE TRIAGEM DE ENCOMENDAS DA MALÁSIA, POR OFERTA, 2020-2029 (US$ MILHÕES)
TABELA 152 MERCADO DE HARDWARE NA MALÁSIA PARA SISTEMAS DE TRIAGEM DE ENCOMENDAS, POR TIPO, 2020-2029 (US$ MILHÕES)
TABELA 153 SENSORES DA MALÁSIA NO MERCADO DE SISTEMAS DE TRIAGEM DE ENCOMENDAS, POR TIPO, 2020-2029 (US$ MILHÕES)
TABELA 154 MERCADO DE SISTEMAS DE TRIAGEM DE ENCOMENDAS DA MALÁSIA, POR TAMANHO DE BANDEJA, 2020-2029 (US$ MILHÕES)
TABELA 155 MERCADO DE SISTEMAS DE TRIAGEM DE ENCOMENDAS DA MALÁSIA, POR CAPACIDADE DE MANUSEIO DE ENCOMENDAS, 2020-2029 (US$ MILHÕES)
TABELA 156 MERCADO DE SISTEMAS DE TRIAGEM DE ENCOMENDAS DA MALÁSIA, POR USUÁRIO FINAL, 2020-2029 (US$ MILHÕES)
TABELA 157 COMÉRCIO ELETRÔNICO DA MALÁSIA NO MERCADO DE SISTEMAS DE TRIAGEM DE ENCOMENDAS, POR TIPO, 2020-2029 (US$ MILHÕES)
TABELA 158 LOGÍSTICA DA MALÁSIA NO MERCADO DE SISTEMAS DE TRIAGEM DE ENCOMENDAS, POR TIPO, 2020-2029 (US$ MILHÕES)
TABELA 159 PRODUTOS FARMACÊUTICOS E MÉDICOS DA MALÁSIA NO MERCADO DE SISTEMAS DE TRIAGEM DE ENCOMENDAS, POR TIPO, 2020-2029 (US$ MILHÕES)
TABELA 160 MERCADO DE ALIMENTOS E BEBIDAS DA MALÁSIA EM SISTEMAS DE TRIAGEM DE ENCOMENDAS, POR TIPO, 2020-2029 (US$ MILHÕES)
TABELA 161 MERCADO DE SISTEMAS DE TRIAGEM DE ENCOMENDAS NAS FILIPINAS, POR TIPO, 2020-2029 (US$ MILHÕES)
TABELA 162 SISTEMAS DE CLASSIFICAÇÃO LINEAR DE ENCOMENDAS NAS FILIPINAS NO MERCADO DE SISTEMAS DE CLASSIFICAÇÃO DE ENCOMENDAS, POR TIPO, 2020-2029 (US$ MILHÕES)
TABELA 163 SISTEMAS DE CLASSIFICAÇÃO DE ENCOMENDAS EM LOOP DAS FILIPINAS NO MERCADO DE SISTEMAS DE CLASSIFICAÇÃO DE ENCOMENDAS, POR TIPO, 2020-2029 (US$ MILHÕES)
TABELA 164 MERCADO DE SISTEMAS DE TRIAGEM DE ENCOMENDAS NAS FILIPINAS, POR OFERTA, 2020-2029 (US$ MILHÕES)
TABELA 165 MERCADO DE HARDWARE NAS FILIPINAS PARA SISTEMAS DE TRIAGEM DE ENCOMENDAS, POR TIPO, 2020-2029 (US$ MILHÕES)
TABELA 166 SENSORES NAS FILIPINAS NO MERCADO DE SISTEMAS DE TRIAGEM DE ENCOMENDAS, POR TIPO, 2020-2029 (US$ MILHÕES)
TABELA 167 MERCADO DE SISTEMAS DE TRIAGEM DE ENCOMENDAS NAS FILIPINAS, POR TAMANHO DE BANDEJA, 2020-2029 (US$ MILHÕES)
TABELA 168 MERCADO DE SISTEMAS DE TRIAGEM DE ENCOMENDAS NAS FILIPINAS, POR CAPACIDADE DE MANUSEIO DE ENCOMENDAS, 2020-2029 (US$ MILHÕES)
TABELA 169 MERCADO DE SISTEMAS DE TRIAGEM DE ENCOMENDAS NAS FILIPINAS, POR USUÁRIO FINAL, 2020-2029 (US$ MILHÕES)
TABELA 170 COMÉRCIO ELETRÔNICO NAS FILIPINAS NO MERCADO DE SISTEMAS DE TRIAGEM DE ENCOMENDAS, POR TIPO, 2020-2029 (US$ MILHÕES)
TABELA 171 LOGÍSTICA NAS FILIPINAS NO MERCADO DE SISTEMAS DE TRIAGEM DE ENCOMENDAS, POR TIPO, 2020-2029 (US$ MILHÕES)
TABELA 172 MERCADO DE SISTEMAS DE TRIAGEM DE PACOTES E PRODUTOS FARMACÊUTICOS E MÉDICOS NAS FILIPINAS, POR TIPO, 2020-2029 (US$ MILHÕES)
TABELA 173 MERCADO DE ALIMENTOS E BEBIDAS NAS FILIPINAS EM SISTEMAS DE TRIAGEM DE ENCOMENDAS, POR TIPO, 2020-2029 (US$ MILHÕES)
TABELA 174 MERCADO DE SISTEMAS DE TRIAGEM DE ENCOMENDAS DO RESTO DA ÁSIA-PACÍFICO, POR TIPO, 2020-2029 (US$ MILHÕES)
Lista de Figura
FIGURA 1 MERCADO DE SISTEMAS DE TRIAGEM DE ENCOMENDAS DA ÁSIA-PACÍFICO: SEGMENTAÇÃO
FIGURA 2 MERCADO DE SISTEMAS DE TRIAGEM DE ENCOMENDAS DA ÁSIA-PACÍFICO: TRIANGULAÇÃO DE DADOS
FIGURA 3 MERCADO DE SISTEMAS DE TRIAGEM DE ENCOMENDAS DA ÁSIA-PACÍFICO: ANÁLISE DROC
FIGURA 4 MERCADO DE SISTEMAS DE TRIAGEM DE ENCOMENDAS DA ÁSIA-PACÍFICO: ANÁLISE DE MERCADO DA ÁSIA-PACÍFICO VS MERCADO REGIONAL
FIGURA 5 MERCADO DE SISTEMAS DE CLASSIFICAÇÃO DE ENCOMENDAS DA ÁSIA-PACÍFICO: ANÁLISE DE PESQUISA DA EMPRESA
FIGURA 6 MERCADO DE SISTEMAS DE TRIAGEM DE ENCOMENDAS DA ÁSIA-PACÍFICO: DEMOGRAFIA DA ENTREVISTA
FIGURA 7 MERCADO DE SISTEMAS DE CLASSIFICAÇÃO DE ENCOMENDAS DA ÁSIA-PACÍFICO: GRADE DE POSIÇÃO DE MERCADO DBMR
FIGURA 8 MERCADO DE SISTEMAS DE TRIAGEM DE ENCOMENDAS DA ÁSIA-PACÍFICO: ANÁLISE DA PARTICIPAÇÃO DE FORNECEDORES
FIGURA 9 MERCADO DE SISTEMAS DE TRIAGEM DE ENCOMENDAS DA ÁSIA-PACÍFICO: GRADE DE COBERTURA DE APLICAÇÕES
FIGURA 10 MERCADO DE SISTEMAS DE TRIAGEM DE ENCOMENDAS DA ÁSIA-PACÍFICO: SEGMENTAÇÃO
FIGURA 11 O DESENVOLVIMENTO CONTÍNUO NA INDÚSTRIA DE COMÉRCIO ELETRÔNICO DA ÁSIA-PACÍFICO É O PRINCIPAL FATOR QUE IMPULSIONA O CRESCIMENTO DO MERCADO DE SISTEMAS DE TRIAGEM DE ENCOMENDAS DA ÁSIA-PACÍFICO NO PERÍODO PREVISTO DE 2022 A 2029
FIGURA 12 O SEGMENTO DE SISTEMAS DE TRIAGEM DE ENCOMENDAS LINEARES DEVE SER REPRESENTANTE DA MAIOR PARCIALIDADE DO MERCADO DE SISTEMAS DE TRIAGEM DE ENCOMENDAS DA ÁSIA-PACÍFICO EM 2022 E 2029
FIGURA 13 ESPERA-SE QUE A ÁSIA-PACÍFICO DOMINE E SEJA A REGIÃO DE CRESCIMENTO MAIS RÁPIDO NO MERCADO DE SISTEMAS DE TRIAGEM DE ENCOMENDAS DA ÁSIA-PACÍFICO NO PERÍODO PREVISTO DE 2022 A 2029
FIGURA 14 VENDAS MUNDIAIS DE COMÉRCIO ELETRÔNICO NO VAREJO, DE 2014 A 2023
FIGURA 15 PARTICIPAÇÃO DE CONSUMIDORES QUE ESCOLHERAM DIFERENTES OPÇÕES DE ENTREGA, PORCENTAGEM DO VOLUME X2C
FIGURA 16 MOTIVADORES, RESTRIÇÕES, OPORTUNIDADES E DESAFIOS DO MERCADO DE SISTEMAS DE TRIAGEM DE ENCOMENDAS DA ÁSIA-PACÍFICO
FIGURA 17 MERCADO DE SISTEMAS DE TRIAGEM DE ENCOMENDAS DA ÁSIA-PACÍFICO, POR TIPO, 2021
FIGURA 18 MERCADO DE SISTEMAS DE TRIAGEM DE ENCOMENDAS DA ÁSIA-PACÍFICO, POR OFERTA, 2021
FIGURA 19 MERCADO DE SISTEMAS DE TRIAGEM DE ENCOMENDAS DA ÁSIA-PACÍFICO, POR TAMANHO DE BANDEJA, 2021
FIGURA 20 MERCADO DE SISTEMAS DE TRIAGEM DE ENCOMENDAS DA ÁSIA-PACÍFICO, POR CAPACIDADE DE MANUSEIO DE ENCOMENDAS, 2021
FIGURA 21 MERCADO DE SISTEMAS DE TRIAGEM DE ENCOMENDAS DA ÁSIA-PACÍFICO, POR USUÁRIO FINAL, 2021
FIGURA 22 MERCADO DE SISTEMAS DE TRIAGEM DE ENCOMENDAS DA ÁSIA-PACÍFICO: RESUMO (2021)
FIGURA 23 MERCADO DE SISTEMAS DE TRIAGEM DE ENCOMENDAS DA ÁSIA-PACÍFICO: POR PAÍS (2021)
FIGURA 24 MERCADO DE SISTEMAS DE TRIAGEM DE ENCOMENDAS DA ÁSIA-PACÍFICO: POR PAÍS (2022 E 2029)
FIGURA 25 MERCADO DE SISTEMAS DE TRIAGEM DE ENCOMENDAS DA ÁSIA-PACÍFICO: POR PAÍS (2021 E 2029)
FIGURA 26 MERCADO DE SISTEMAS DE TRIAGEM DE ENCOMENDAS DA ÁSIA-PACÍFICO: POR TIPO (2022-2029)
FIGURA 27 MERCADO DE SISTEMAS DE TRIAGEM DE ENCOMENDAS DA ÁSIA-PACÍFICO: PARTICIPAÇÃO DA EMPRESA EM 2021 (%)
Metodologia de Investigação
A recolha de dados e a análise do ano base são feitas através de módulos de recolha de dados com amostras grandes. A etapa inclui a obtenção de informações de mercado ou dados relacionados através de diversas fontes e estratégias. Inclui examinar e planear antecipadamente todos os dados adquiridos no passado. Da mesma forma, envolve o exame de inconsistências de informação observadas em diferentes fontes de informação. Os dados de mercado são analisados e estimados utilizando modelos estatísticos e coerentes de mercado. Além disso, a análise da quota de mercado e a análise das principais tendências são os principais fatores de sucesso no relatório de mercado. Para saber mais, solicite uma chamada de analista ou abra a sua consulta.
A principal metodologia de investigação utilizada pela equipa de investigação do DBMR é a triangulação de dados que envolve a mineração de dados, a análise do impacto das variáveis de dados no mercado e a validação primária (especialista do setor). Os modelos de dados incluem grelha de posicionamento de fornecedores, análise da linha de tempo do mercado, visão geral e guia de mercado, grelha de posicionamento da empresa, análise de patentes, análise de preços, análise da quota de mercado da empresa, normas de medição, análise global versus regional e de participação dos fornecedores. Para saber mais sobre a metodologia de investigação, faça uma consulta para falar com os nossos especialistas do setor.
Personalização disponível
A Data Bridge Market Research é líder em investigação formativa avançada. Orgulhamo-nos de servir os nossos clientes novos e existentes com dados e análises que correspondem e atendem aos seus objetivos. O relatório pode ser personalizado para incluir análise de tendências de preços de marcas-alvo, compreensão do mercado para países adicionais (solicite a lista de países), dados de resultados de ensaios clínicos, revisão de literatura, mercado remodelado e análise de base de produtos . A análise de mercado dos concorrentes-alvo pode ser analisada desde análises baseadas em tecnologia até estratégias de carteira de mercado. Podemos adicionar quantos concorrentes necessitar de dados no formato e estilo de dados que procura. A nossa equipa de analistas também pode fornecer dados em tabelas dinâmicas de ficheiros Excel em bruto (livro de factos) ou pode ajudá-lo a criar apresentações a partir dos conjuntos de dados disponíveis no relatório.

