Asia-Pacific Vertical Farming Market, By Growth Mechanism (Hydroponics, Aeroponics, and Aquaponics), Structure (Shipping Containers and Building Based), Type (Biopesticides, Biofertilizer, and Biostimulants), Crop Type (Leafy Green, Pollinated Plants, and Nutraceutical Plant), Application (Indoor, and Outdoor), Component (Lighting, Hydroponic Component, Climate Control, and Sensors) Industry Trends and Forecast to 2030.
Asia-Pacific Vertical Farming Market Analysis and Insights
Vertical farms are modular and can be adapted to suit any structure. As they produce 75 times more food per square foot than a conventional farm, vertical farms can also feed more people than standard farming can. There are also no pesticides and no fungicides used by Vertical Farms to make food better and cleaner. Vertical farms often minimise the use of water because indoor farms require 90 percent less water than outdoor farms, so it doesn't matter whether you have a rainy or dry season. Indoor Farming will also regulate the fertilisation of nutrients by plants, so that the food provided is highly nutritious. Grow a large amount of food and use less water in a comparatively small room. 6,500 square meters = a crop of 900,000 kilos. Vertical farming strategies may help conserve farmland and rainforests and also provide time to regenerate and replenish topsoil for other lands and also help minimise the consumption of fuel.
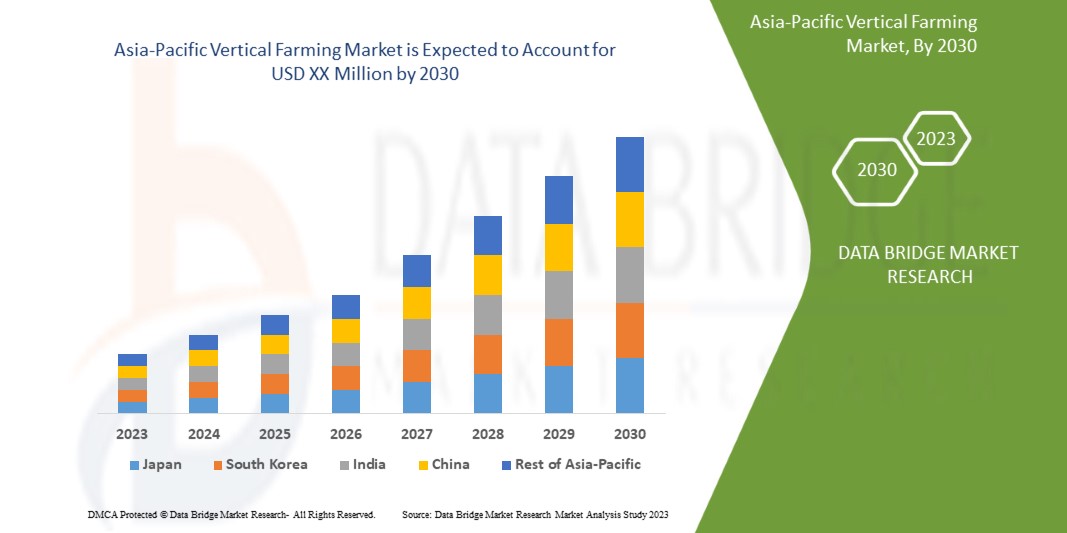
Data Bridge Market Research analyses that the Asia-Pacific vertical farming market will grow at a CAGR of 27.5% during the forecast period of 2023 to 2030.
|
Report Metric |
Details |
|
Forecast Period |
2023 to 2030 |
|
Base Year |
2022 |
|
Historic Years |
2021 (Customizable to 2020 - 2016) |
|
Quantitative Units |
Revenue in USD Million, Pricing in USD |
|
Segments Covered |
By Growth Mechanism (Hydroponics, Aeroponics, and Aquaponics), Structure (Shipping Containers and Building Based), Type (Biopesticides, Biofertilizer, and Biostimulants), Crop Type (Leafy Green, Pollinated Plants, and Nutraceutical Plant), Application (Indoor, and Outdoor), Component (Lighting, Hydroponic Component, Climate Control, and Sensors). |
|
Countries Covered |
Japan, China, South Korea, India, Australia, Singapore, Thailand, Indonesia, Malaysia, Philippines, Rest of Asia-Pacific. |
|
Market Players Covered |
Signify Holding, CubicFarm Systems Corp., InFarm, Gills N Claws Pte Ltd, Sky Greens, SPREAD Co., Ltd., Triton Foodworks, SANANBIO, EVERLIGHT, OSRAM GmbH, Valoya, Heliospectra AB, Jain Irrigation Systems Ltd, Glenorie Hydroponics, Sino Opto Technology Co., Ltd among others. |
Market Definition
Vertical farming is the method of processing food such as in a skyscraper, used factory, or shipping container done in vertically stacked layers. Indoor farming methods and controlled-environment agriculture (CEA) technologies are used for modern vertical farming concepts, where all environmental conditions can be controlled. Artificial regulation of illumination, environmental control (humidity, temperature, gases and among others) and fertigation are utilised for these services. Few vertical farms use methods similar to greenhouses, where artificial lighting and metal reflectors can be used to maximise natural sunlight.
Asia-Pacific Vertical Farming Market Dynamics
This section deals with understanding the market drivers, opportunities, restraints, and challenges. All of this is discussed in detail as below:
Drivers
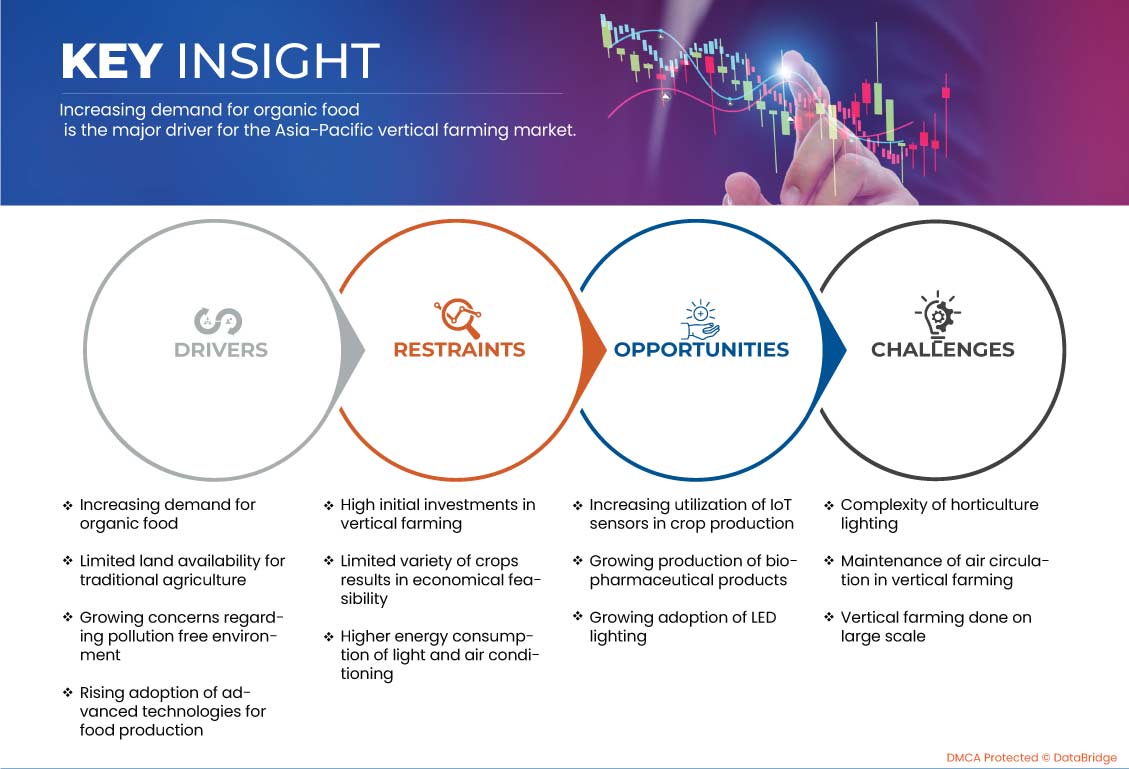
INCREASING DEMAND FOR ORGANIC FOOD
As crops are grown without the use of chemical pesticides in a well-controlled indoor environment, vertical farming enables us to grow pesticide-free and organic crops. Organic food applies to goods produced through the agriculture sector that do not require industrial fertilizers, chemicals and development regulators. Today, consumers around the world have become more mindful of the origins of food they eat on a regular basis and have moved from crops that are processed with additives and pesticides to organic foods. Moreover, the rising purchasing power of people and changing consumer preference over the organic or pollution free food is augmenting the growth towards health consciousness.
All countries with relatively high organic food intake have high per capita income levels, such as China, which has adopted "green" foods to bring organic foods into the country. Japan, in Asia represents the single largest organic food market. Per capita spending on organic foods is marginally correlated favourably with per capita income levels, but Japan is a significant exception. Broadly speaking, organic goods tend to be premium goods in the sense that their consumption is higher in high per capita income countries. In several middle-income countries, piecemeal knowledge about organic food markets shows that supermarket markets are still in the early stages of growth. Around 50 different organic items are sold in major supermarkets in major countries.
Imported organic foods and beverages as well as domestically produced organic fruit, vegetables, rice, and tea are sold primarily in specialty stores in Taiwan. Organic foods are available on a limited basis in Hong Kong. The market for organic foods is just beginning to be evident only at a single store, stores stocked locally produced organic foods like vegetables, eggs, and cheese. Some middle income countries will likely have larger shares of organic products in the future but current sales appear to be very modest in absolute terms.
Principles of minimization of the chemical inputs in the agriculture and hence is environment friendly. Thus, vertical farming techniques can be utilized to increase the production and productivity to meet the growing food demands. The increasing demand for the organic food is driving the growth of the Asia-pacific vertical farming market.
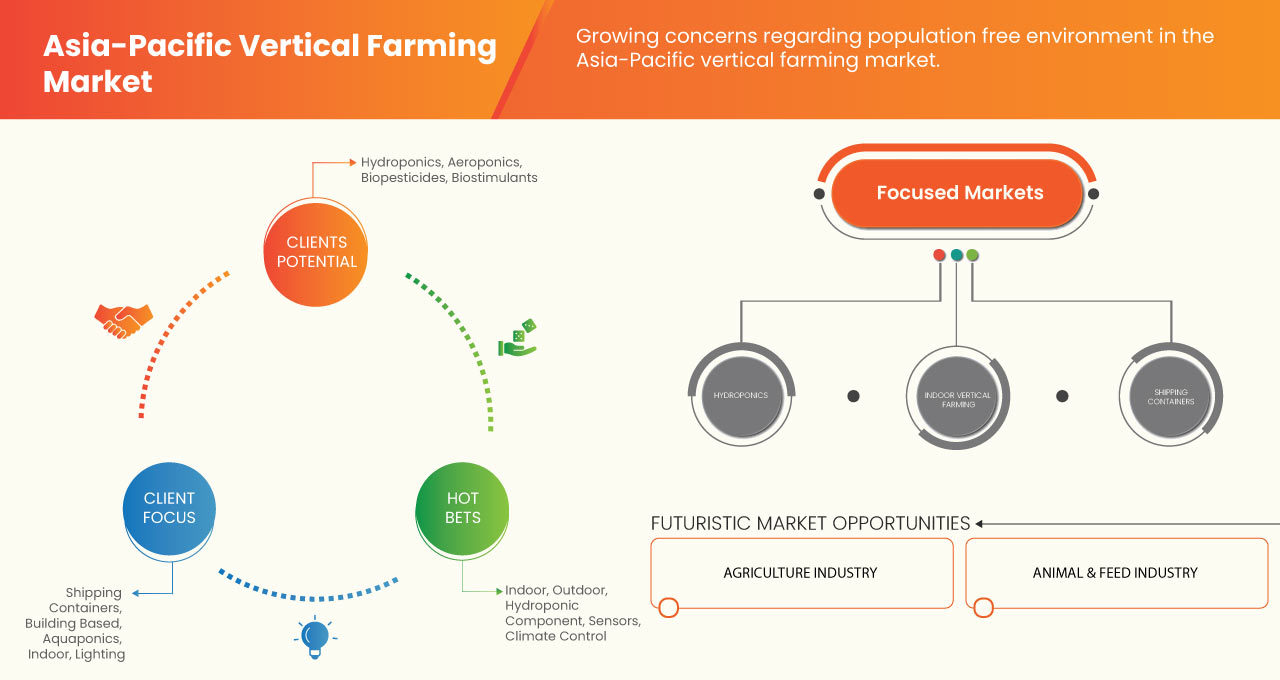
GROWING CONCERNS REGARDING POLLUTION FREE ENVIRONMENT
Air pollution is the world’s single greatest environmental risk to health. Some 6.5 million people across the world die prematurely every year from exposure to outdoor and indoor air pollution. Pollution is not a modern phenomenon; it can be largely regulated and sometimes avoided, but it is greatly ignored. Land and soil pollution is largely the product of poor agricultural practices, inefficient irrigation, improper solid waste management – including unsafe storage of obsolete stockpiles of hazardous chemicals and nuclear waste – and a range of industrial, military and extractive activities. Better awareness, new forms of consumption and development, as well as creative technical methods, mean that many nations, cities and industries are now effectively solving significant problems with emissions. Indoor vertical farming can significantly lessen the occupational hazards associated with traditional farming. Farmers are not exposed to hazards related to heavy farming equipment, diseases like malaria, poisonous chemicals and so on. As it does not disturb animals and trees inland areas, it is good for biodiversity as well. The workplace risks associated with conventional farming can be greatly minimised by indoor vertical farming. Farmers are not exposed to risks associated with heavy agricultural machines, pathogens such as malaria, hazardous substances, etc. Since inland areas do not disturb animals and vegetation, it is also ideal for biodiversity. In 2019, humans emitted 54 billion tonnes of carbon dioxide equivalent (CO2eq), of which 17 billion tonnes (31%) came from agrifood systems.
Pollution can have negative impacts and disproportionate burdens on women and men, and particularly on the poor and the vulnerable such as the elderly, children and the disabled, affecting their rights to health, water, food, life, housing and development. Many toxic dumpsites are located in poor areas, leading to environmental injustice. Pollution has significant economic costs from the point of view of health, productivity losses, health-care costs and ecosystem damages. Vertical farming can save large amount of water usage and minimize the effect of greenhouse effect.
Hence, the growing concerns regarding pollution free environment is driving the growth of the vertical farming market.
Opportunities
INCREASING UTILIZATION OF IOT SENSORS IN CROP PRODUCTION
Smart farming offers awareness to growers who want to stay clear of problems and intervene before profits are affected by small or big problems through connected devices, the Internet of Things. It comes into play that tells farmers what they need to know about soil, humidity, water levels, and other important metrics. When practicing vertical farming, most of the farmers would like to monitor the farming conditions, and yet limited knowledge on data management have forced them to investigate plant conditions with naked eyes. Therefore, vertical farming monitoring system with Internet of Thing (IoT) is introduced as a platform to collect data and visualize it through a web-based applications. It is a more convenient way to keep track on the vertical farming performance, and contribute to the research and development on agriculture field with real case data analysis. With the help of the system, a reliable environment for farming activities could be formed. Consequently, crops are grown under a controlled surrounding, and get rid of the dangers caused by extreme weather such as droughts and floods.
Even the government is starting to embrace new smart farming opportunities. At its Beltsville Area Research Facility, the United States Department of Agriculture (USDA) recently turned a 7,000-acre farm into a testbed for IoT technology and related advancements, such as Artificial Intelligence (AI). Reportedly, this initiative will help thousands of data scientists gather information faster.
IoT sensors can provide information about crop health in real time and display the existence of pests clearly. For evaluating crops over a wide area, low-resolution image sensors are suitable. These instruments take photos of pests that cannot be observed with the human eye.
The Internet of Things (IoT) is a successful technology that offers efficient and reliable solutions. Solutions to the modernisation of multiple domains. Solutions based on IoT are being created to Maintain and monitor agricultural farms automatically with minimal human involvement.
Hence, the increasing utilization of IoT sensors in crop production has provided with the ample opportunities for the growth of Asia-Pacific vertical farming market.
Restraints/Challenges
HIGH INITIAL INVESTMENTS IN VERTICAL FARMING
The biggest hurdle to the introduction of vertical farming are the high upfront costs. High capital costs are the product of both the higher per square metre land prices in urban centres and the facilities required to manage plant development. Vertical cultivation happens without the involvement of insects in a controlled climate. As such, the method of pollination has to be performed manually, which would be labour intensive and expensive. As high as energy prices are in vertical farming, due to their concentration in urban centres where incomes are higher, as well as the need for more skilled workers, labour costs may be much higher. However, automation at vertical farms can contribute to the need for fewer employees. In vertical farms, manual pollination can become one of the more labor-intensive functions. Although the start-up costs of vertical farming are high, the long-term advantages are gradually being understood and accepted by all - even retailers - participating in the food supply chain. The reality that the upfront capital needed to build and develop a vertical farm is significant is no running away. The prospective long-term potential growth and benefits offered by being at the forefront of this emerging industry, however, make it an enticing investment proposal for those with funds. A vertical farm instead of automation relies more on manual labour for watering and harvesting. The cost of powering LED grow lights is one of the biggest hurdles a vertical farm must overcome for its produce to be competitive with fruits and vegetables from a traditional farm. As businesses contend with the energy costs of keeping a regulated atmosphere 24/7 and the challenge of coordinating the labour-intensive method of operating a vertical farm, the industry is riddled with bankruptcies.
Hence, high initial investments in vertical farming is retarding the growth of the Asia-Pacific vertical farming market.
Recent Developments
- In May 2022, Signify the world leader in lighting, has completed the acquisition of Fluence from ams OSRAM. The transaction strengthens our Asia-Pacific Agriculture lighting growth platform and extends our position in the attractive North American horticultural lighting market.
- In June 2022, Jain Irrigation Systems Limited., India (Jain Irrigation) and Temasek-owned Rivulis Pte Ltd., Singapore (Rivulis) are pleased to announce that Jain International Trading B.V. (a wholly owned subsidiary of Jain Irrigation) and Rivulis have entered into definitive transaction agreements.
Asia-Pacific Vertical Farming Market Scope
The Asia-Pacific vertical farming market is segmented based on growth mechanism, structure, type, crop type, application and component. .The growth amongst these segments will help you analyze major growth segments in the industries and provide the users with a valuable market overview and market insights to make strategic decisions to identify core market applications.
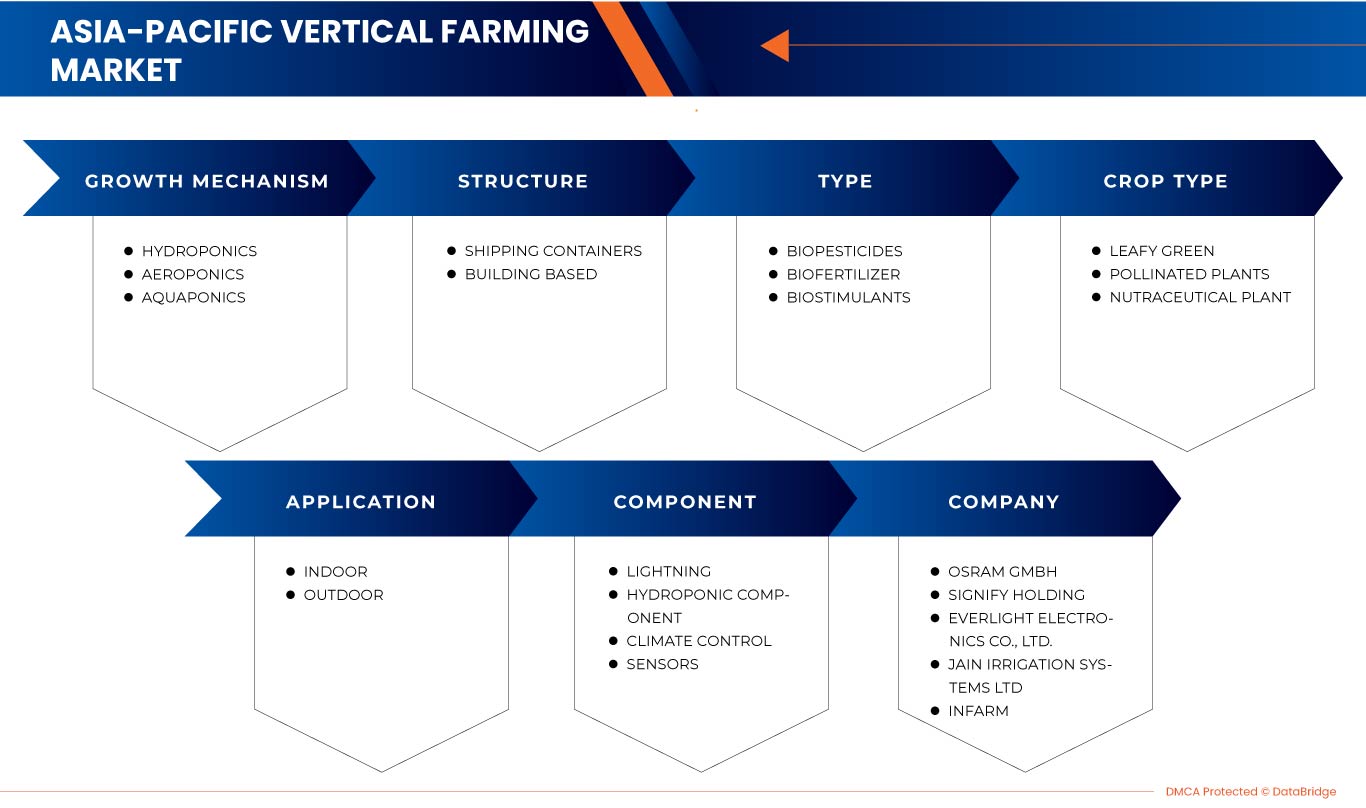
Growth Mechanism
- Hydroponics
- Aeroponics
- Aquaponics
On the basis of growth mechanism, the Asia-Pacific vertical farming market is segmented into hydroponics, aeroponics and aquaponics.
Structure
- Shipping Containers
- Building Based
On the basis of structure, the Asia-Pacific vertical farming market is segmented into shipping containers and building based.
Type
- Biopesticides
- Biofertilizer
- Biostimulants
On the basis of type, the Asia-Pacific vertical farming market is segmented into biopesticides, biofertilizer and biostimulants.
Crop Type
- Leafy Green
- Pollinated Plants
- Nutraceutical Plant
On the basis of crop type, the Asia-Pacific vertical farming market is segmented into leafy green, pollinated plants and nutraceutical plant.
Application
- Indoor
- Outdoor
On the basis of application, the Asia-Pacific vertical farming market is segmented into indoor and outdoor. Component
- Lighting
- Hydroponic Component
- Climate Control
- Sensors
On the basis of component, the Asia-Pacific vertical farming market is segmented into lighting, hydroponic component, climate control and sensors.
Asia-Pacific Vertical Farming Market Regional Analysis/Insights
The Asia-Pacific vertical farming market are analyzed, and market size insights and trends are provided based on as referenced above.
The countries covered in the Asia-Pacific vertical farming market report are Japan, China, South Korea, India, Australia, Singapore, Thailand, Indonesia, Malaysia, Philippines, Rest of Asia-Pacific.
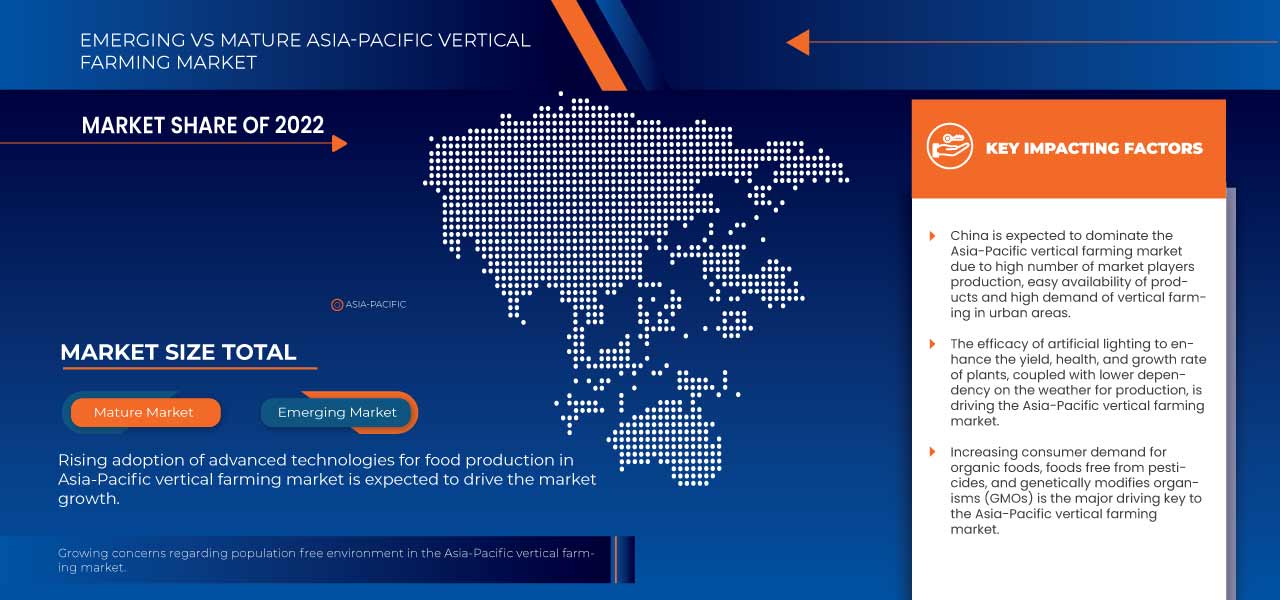
China is expected to dominate the Asia-Pacific vertical farming market in terms of market share and revenue. It is estimated to maintain its dominance during the forecast period due to strong market players and high demand for vertical farming in the china region.
The region section of the report also provides individual market impacting factors and changes in regulations in the market that impact the current and future trends of the market. Data points, such as new and replacement sales, country demographics, disease epidemiology, and import-export tariffs, are some of the major pointers used to forecast the market scenario for individual countries. In addition, the presence and availability of Asia-Pacific brands and their challenges faced due to high competition from local and domestic brands and the impact of sales channels are considered while providing forecast analysis of the country data.
Competitive Landscape and Asia-Pacific Vertical Farming Market Share Analysis
The vertical farming market provide details about the competitors. Details include company overview, company financials, revenue generated, market potential, investment in research and development, new market initiatives, Asia-Pacific presence, production sites and facilities, production capacities, company strengths and weaknesses, product launch, product width and breadth, and application dominance. The above data points are only related to the companies' focus on the vertical farming market.
Some of the major players operating in the Asia-Pacific vertical farming market are Signify Holding, CubicFarm Systems Corp., InFarm, Gills N Claws Pte Ltd, Sky Greens, SPREAD Co., Ltd., Triton Foodworks, SANANBIO, EVERLIGHT, OSRAM GmbH, Valoya, Heliospectra AB, Jain Irrigation Systems Ltd, Glenorie Hydroponics, Sino Opto Technology Co., Ltd among others.
SKU-
Obtenha acesso online ao relatório sobre a primeira nuvem de inteligência de mercado do mundo

- Painel interativo de análise de dados
- Painel de análise da empresa para oportunidades de elevado potencial de crescimento
- Acesso de analista de pesquisa para personalização e customização. consultas
- Análise da concorrência com painel interativo
- Últimas notícias, atualizações e atualizações Análise de tendências
- Aproveite o poder da análise de benchmark para um rastreio abrangente da concorrência
Índice
1 INTRODUCTION
1.1 OBJECTIVES OF THE STUDY
1.2 MARKET DEFINITION
1.3 OVERVIEW OF ASIA-PACIFIC VERTICAL FARMING MARKET
1.4 LIMITATIONS
1.5 MARKETS COVERED
2 MARKET SEGMENTATION
2.1 MARKETS COVERED
2.2 GEOGRAPHICAL SCOPE
2.3 YEARS CONSIDERED FOR THE STUDY
2.4 CURRENCY AND PRICING
2.5 DBMR TRIPOD DATA VALIDATION MODEL
2.6 MULTIVARIATE MODELLING
2.7 GROWTH MECHANISM LIFELINE CURVE
2.8 PRIMARY INTERVIEWS WITH KEY OPINION LEADERS
2.9 DBMR MARKET POSITION GRID
2.1 SECONDARY SOURCES
2.11 PREMISSAS
3 RESUMO EXECUTIVO
4 INSIGHTS PREMIUM
5 VISÃO GERAL DO MERCADO
5.1 MOTORISTAS
5.1.1 AUMENTO DA DEMANDA POR ALIMENTOS ORGÂNICOS
5.1.2 DISPONIBILIDADE LIMITADA DE TERRAS PARA AGRICULTURA TRADICIONAL
5.1.3 PREOCUPAÇÕES CRESCENTES COM UM AMBIENTE LIVRE DE POLUIÇÃO
5.1.4 ADOÇÃO CRESCENTE DE TECNOLOGIAS AVANÇADAS PARA PRODUÇÃO DE ALIMENTOS
5.2 RESTRIÇÕES
5.2.1 ALTOS INVESTIMENTOS INICIAIS NA AGRICULTURA VERTICAL
5.2.2 VARIEDADE LIMITADA DE CULTURAS RESULTA EM VIABILIDADE ECONÔMICA
5.2.3 MAIOR CONSUMO DE ENERGIA DE LUZ E AR CONDICIONADO
5.3 OPORTUNIDADES
5.3.1 AUMENTO DA UTILIZAÇÃO DE SENSORES DE IOT NA PRODUÇÃO DE CULTURAS
5.3.2 CRESCENTE PRODUÇÃO DE PRODUTOS BIOFARMACÊUTICOS
5.3.3 ADOÇÃO CRESCENTE DE ILUMINAÇÃO LED
5.4 DESAFIOS
5.4.1 COMPLEXIDADE DA ILUMINAÇÃO PARA HORTICULTURA
5.4.2 MANUTENÇÃO DA CIRCULAÇÃO DE AR NA AGRICULTURA VERTICAL
5.4.3 AGRICULTURA VERTICAL REALIZADA EM GRANDE ESCALA
6 ANÁLISE DE IMPACTO DA COVID-19
7 MERCADO DE AGRICULTURA VERTICAL DA APAC, POR MECANISMO DE CRESCIMENTO
7.1 VISÃO GERAL
7.2 HIDROPONIA
7.3 AEROPONIA
7.4 AQUAPONIA
8 MERCADO DE AGRICULTURA VERTICAL DA APAC, POR ESTRUTURA
8.1 VISÃO GERAL
8.2 CONTÊINERES DE TRANSPORTE
8.3 BASEADO EM EDIFÍCIOS
9 MERCADO DE AGRICULTURA VERTICAL DA APAC, POR TIPO
9.1 VISÃO GERAL
9.2 BIOPESTICIDAS
9.2.1 MICROBIANOS
9.2.2 FEROMÔNIOS
9.2.3 EXTRATOS DE PLANTAS
9.3 BIOFERTILIZANTE
9.3.1 FIXAÇÃO DE NITROGÊNIO
9.3.2 SOLUBILIZANTE DE FOSFATO
9.3.3 MOBILIZADOR DE POTÁSSIO
9.4 BIOESTIMULANTES
9.4.1 LÍQUIDO
9.4.2 SECO
10 MERCADOS DE AGRICULTURA VERTICAL DA ÁFRICA DO PACÍFICO, POR TIPO DE CULTURA
10.1 VISÃO GERAL
10.2 FOLHAS VERDES
10.3 PLANTAS POLINIZADAS
10.4 PLANTA NUTRACÊUTICA
11 MERCADO DE AGRICULTURA VERTICAL DA APAC, POR APLICAÇÃO
11.1 VISÃO GERAL
11.2 INTERNO
11.3 EXTERNO
12 MERCADO DE AGRICULTURA VERTICAL DA APAC, POR COMPONENTE
12.1 VISÃO GERAL
12.2 ILUMINAÇÃO
12.2.1 LUZ DE CULTIVO
12.2.2 CULTIVO DE LASTRO
12.2.3 REFLETORES DE CULTIVO
12.3 COMPONENTE HIDROPÔNICO
12.3.1 BOMBA E IRRIGAÇÃO
12.3.2 FILTRAÇÃO DE ÁGUA
12.3.3 MEDIDORES E SOLUÇÕES
12.3.4 OUTROS
12.4 CONTROLE CLIMÁTICO
12.4.1 VENTILADORES DE VENTILAÇÃO
12.4.2 PURIFICAÇÃO/CONTROLE DO AR
12,5 SENSORES
12.5.1 SENSORES DE CO2
12.5.2 SENSORES DE TEMPERATURA
12.5.3 SENSORES DE NUTRIENTES
12.5.4 SENSORES DE CULTURA
12.5.5 SENSORES DE PH
12.5.6 OUTROS
13 MERCADO DE AGRICULTURA VERTICAL DA ÁFRICA DO PACÍFICO, POR PAÍS
13.1 CHINA
13.2 JAPÃO
13.3 COREIA DO SUL
13.4 SINGAPURA
13.5 AUSTRÁLIA
13.6 ÍNDIA
13.7 TAILÂNDIA
13.8 INDONÉSIA
13.9 MALÁSIA
13.1 FILIPINAS
13.11 RESTO DA APAC
14 PAISAGISMO DA EMPRESA
14.1 ANÁLISE DE AÇÕES DA EMPRESA: ÁSIA-PACÍFICO
15 ANÁLISE SWOT
16 PERFIL DA EMPRESA
16.1 OSRAM GmbH
16.1.1 RESUMO DA EMPRESA
16.1.2 ANÁLISE DE RECEITA
16.1.3 PORTFÓLIO DE PRODUTOS
16.1.4 DESENVOLVIMENTOS RECENTES
16.2 SIGNIFICAR DETENÇÃO
16.2.1 RESUMO DA EMPRESA
16.2.2 ANÁLISE DE RECEITA
16.2.3 PORTFÓLIO DE MARCAS
16.2.4 DESENVOLVIMENTOS RECENTES
16.3 LUZ ETERNA
16.3.1 RESUMO DA EMPRESA
16.3.2 ANÁLISE DE RECEITA
16.3.3 PORTFÓLIO DE PRODUTOS
16.3.4 DESENVOLVIMENTO RECENTE
16.4 SISTEMAS DE IRRIGAÇÃO JAIN LTDA
16.4.1 RESUMO DA EMPRESA
16.4.2 ANÁLISE DE RECEITA
16.4.3 PORTFÓLIO DE PRODUTOS
16.4.4 DESENVOLVIMENTO RECENTE
16.5 INFARM
16.5.1 RESUMO DA EMPRESA
16.5.2 PORTFÓLIO DE TECNOLOGIA
16.5.3 DESENVOLVIMENTO RECENTE
16.6 CUBICFARM SYSTEMS CORP.
16.6.1 RESUMO DA EMPRESA
16.6.2 ANÁLISE DE RECEITA
16.6.3 PORTFÓLIO DE PRODUTOS
16.6.4 DESENVOLVIMENTOS RECENTES
16.7 GILLS N CLAWS PTE LTD
16.7.1 RESUMO DA EMPRESA
16.7.2 PORTFÓLIO DE PRODUTOS
16.7.3 DESENVOLVIMENTOS RECENTES
16.8 GLENORIE HIDROPONIA
16.8.1 RESUMO DA EMPRESA
16.8.2 PORTFÓLIO DE PRODUTOS
16.9 HELIOSPECTRA AB
16.9.1 RESUMO DA EMPRESA
16.9.2 ANÁLISE DE RECEITA
16.9.3 PORTFÓLIO DE PRODUTOS
16.9.4 DESENVOLVIMENTOS RECENTES
16.1 SANANBIO
16.10.1 RESUMO DA EMPRESA
16.10.2 PORTFÓLIO DE PRODUTOS
16.10.3 DESENVOLVIMENTO RECENTE
16.11 SINO OPTO TECNOLOGIA CO., LTDA.
16.11.1 RESUMO DA EMPRESA
16.11.2 PORTFÓLIO DE PRODUTOS
16.11.3 DESENVOLVIMENTOS RECENTES
16.12 VERDES CÉU
16.12.1 RESUMO DA EMPRESA
16.12.2 PORTFÓLIO DE PRODUTOS
16.12.3 DESENVOLVIMENTOS RECENTES
16.13 SPREAD CO., LTD.
16.13.1 RESUMO DA EMPRESA
16.13.2 PORTFÓLIO DE PRODUTOS
16.13.3 DESENVOLVIMENTO RECENTE
16.14 TRITON FOODWORKS
16.14.1 RESUMO DA EMPRESA
16.14.2 PORTFÓLIO DE PRODUTOS
16.14.3 DESENVOLVIMENTOS RECENTES
16h15 VALOYA
16.15.1 RESUMO DA EMPRESA
16.15.2 PORTFÓLIO DE PRODUTOS
16.15.3 DESENVOLVIMENTOS RECENTES
17 QUESTIONÁRIO
18 RELATÓRIOS RELACIONADOS
Lista de Tabela
TABELA 1 MERCADO DE AGRICULTURA VERTICAL DA ÁFRICA DO PACÍFICO, POR MECANISMO DE CRESCIMENTO, 2021-2030 (US$ MILHÕES)
TABELA 2 MERCADO DE AGRICULTURA VERTICAL DA ÁFRICA DO PACÍFICO, POR ESTRUTURA, 2021-2030 (US$ MILHÕES)
TABELA 3 MERCADO DE AGRICULTURA VERTICAL DA ÁFRICA DO PACÍFICO, POR TIPO, 2021-2030 (US$ MILHÕES)
TABELA 4 BIOPESTICIDAS NO MERCADO DE AGRICULTURA VERTICAL DA ÁFRICA DO PACÍFICO, POR TIPO, 2021-2030 (US$ MILHÕES)
TABELA 5 BIOFERTILIZANTES NO MERCADO DE AGRICULTURA VERTICAL DA ÁFRICA DO PACÍFICO, POR TIPO, 2021-2030 (US$ MILHÕES)
TABELA 6 BIOESTIMULANTES NO MERCADO DE AGRICULTURA VERTICAL DA ÁFRICA DO PACÍFICO, POR TIPO, 2021-2030 (US$ MILHÕES)
TABELA 7 MERCADO DE AGRICULTURA VERTICAL DA ÁFRICA DO PACÍFICO, POR TIPO DE CULTURA, 2021-2030 (US$ MILHÕES)
TABELA 8 MERCADO DE AGRICULTURA VERTICAL DA ÁFRICA DO PACÍFICO, POR APLICAÇÃO, 2021-2030 (US$ MILHÕES)
TABELA 9 MERCADO DE AGRICULTURA VERTICAL DA ÁFRICA DO PACÍFICO, POR COMPONENTE, 2021-2030 (US$ MILHÕES)
TABELA 10 ILUMINAÇÃO APAC NO MERCADO DE AGRICULTURA VERTICAL, POR COMPONENTE, 2021-2030 (US$ MILHÕES)
TABELA 11 COMPONENTE HIDROPÔNICO DA ÁFRICA DO PACÍFICO NO MERCADO DE AGRICULTURA VERTICAL, POR COMPONENTE, 2021-2030 (US$ MILHÕES)
TABELA 12 CONTROLE CLIMÁTICO NA ÁFRICA DO PACÍFICO NO MERCADO DE AGRICULTURA VERTICAL, POR COMPONENTE, 2021-2030 (US$ MILHÕES)
TABELA 13 SENSORES DA ÁFRICA DO PACÍFICO NO MERCADO DE AGRICULTURA VERTICAL, POR COMPONENTE, 2021-2030 (US$ MILHÕES)
TABELA 14 MERCADO DE AGRICULTURA VERTICAL DA ÁFRICA DO PACÍFICO, POR PAÍS, 2021-2030 (US$ MILHÕES)
TABELA 15 MERCADO DE AGRICULTURA VERTICAL DA CHINA, POR MECANISMO DE CRESCIMENTO, 2021-2030 (US$ MILHÕES)
TABELA 16 MERCADO DE AGRICULTURA VERTICAL DA CHINA, POR ESTRUTURA, 2021-2030 (US$ MILHÕES)
TABELA 17 MERCADO DE AGRICULTURA VERTICAL DA CHINA, POR TIPO, 2021-2030 (US$ MILHÕES)
TABELA 18: BIOPESTICIDAS NA CHINA NO MERCADO DE AGRICULTURA VERTICAL, POR TIPO, 2021-2030 (US$ MILHÕES)
TABELA 19: MERCADO DE BIOFERTILIZANTES NA CHINA PARA AGRICULTURA VERTICAL, POR TIPO, 2021-2030 (US$ MILHÕES)
TABELA 20 BIOESTIMULANTES DA CHINA NO MERCADO DE AGRICULTURA VERTICAL, POR TIPO, 2021-2030 (US$ MILHÕES)
TABELA 21 MERCADO DE AGRICULTURA VERTICAL DA CHINA, POR TIPO DE CULTURA, 2021-2030 (US$ MILHÕES)
TABELA 22 MERCADO DE AGRICULTURA VERTICAL DA CHINA, POR APLICAÇÃO, 2021-2030 (US$ MILHÕES)
TABELA 23 MERCADO DE AGRICULTURA VERTICAL DA CHINA, POR COMPONENTE, 2021-2030 (US$ MILHÕES)
TABELA 24 ILUMINAÇÃO DA CHINA NO MERCADO DE AGRICULTURA VERTICAL, POR COMPONENTE, 2021-2030 (US$ MILHÕES)
TABELA 25 COMPONENTE HIDROPÔNICO DA CHINA NO MERCADO DE AGRICULTURA VERTICAL, POR COMPONENTE, 2021-2030 (US$ MILHÕES)
TABELA 26 CONTROLE CLIMÁTICO NA CHINA NO MERCADO DE AGRICULTURA VERTICAL, POR COMPONENTE, 2021-2030 (US$ MILHÕES)
TABELA 27 SENSORES DA CHINA NO MERCADO DE AGRICULTURA VERTICAL, POR COMPONENTE, 2021-2030 (US$ MILHÕES)
TABELA 28 MERCADO DE AGRICULTURA VERTICAL DO JAPÃO, POR MECANISMO DE CRESCIMENTO, 2021-2030 (US$ MILHÕES)
TABELA 29 MERCADO AGRÍCOLA VERTICAL DO JAPÃO, POR ESTRUTURA, 2021-2030 (US$ MILHÕES)
TABELA 30 MERCADO DE AGRICULTURA VERTICAL DO JAPÃO, POR TIPO, 2021-2030 (US$ MILHÕES)
TABELA 31 BIOPESTICIDAS NO MERCADO DE AGRICULTURA VERTICAL DO JAPÃO, POR TIPO, 2021-2030 (US$ MILHÕES)
TABELA 32 BIOFERTILIZANTES NO MERCADO DE AGRICULTURA VERTICAL DO JAPÃO, POR TIPO, 2021-2030 (US$ MILHÕES)
TABELA 33 BIOESTIMULANTES NO MERCADO DE AGRICULTURA VERTICAL DO JAPÃO, POR TIPO, 2021-2030 (US$ MILHÕES)
TABELA 34 MERCADO AGRÍCOLA VERTICAL DO JAPÃO, POR TIPO DE CULTURA, 2021-2030 (US$ MILHÕES)
TABELA 35 MERCADO DE AGRICULTURA VERTICAL DO JAPÃO, POR APLICAÇÃO, 2021-2030 (US$ MILHÕES)
TABELA 36 MERCADO DE AGRICULTURA VERTICAL DO JAPÃO, POR COMPONENTE, 2021-2030 (US$ MILHÕES)
TABELA 37 ILUMINAÇÃO NO MERCADO DE AGRICULTURA VERTICAL DO JAPÃO, POR COMPONENTE, 2021-2030 (US$ MILHÕES)
TABELA 38 COMPONENTE HIDROPÔNICO DO JAPÃO NO MERCADO DE AGRICULTURA VERTICAL, POR COMPONENTE, 2021-2030 (US$ MILHÕES)
TABELA 39 CONTROLE CLIMÁTICO NO MERCADO DE AGRICULTURA VERTICAL DO JAPÃO, POR COMPONENTE, 2021-2030 (US$ MILHÕES)
TABELA 40 SENSORES DO JAPÃO NO MERCADO DE AGRICULTURA VERTICAL, POR COMPONENTE, 2021-2030 (US$ MILHÕES)
TABELA 41 MERCADO DE AGRICULTURA VERTICAL DA COREIA DO SUL, POR MECANISMO DE CRESCIMENTO, 2021-2030 (US$ MILHÕES)
TABELA 42 MERCADO AGRÍCOLA VERTICAL DA COREIA DO SUL, POR ESTRUTURA, 2021-2030 (US$ MILHÕES)
TABELA 43 MERCADO DE AGRICULTURA VERTICAL DA COREIA DO SUL, POR TIPO, 2021-2030 (US$ MILHÕES)
TABELA 44 BIOPESTICIDAS NO MERCADO DE AGRICULTURA VERTICAL DA COREIA DO SUL, POR TIPO, 2021-2030 (US$ MILHÕES)
TABELA 45 BIOFERTILIZANTES NO MERCADO DE AGRICULTURA VERTICAL DA COREIA DO SUL, POR TIPO, 2021-2030 (US$ MILHÕES)
TABELA 46 BIOESTIMULANTES NO MERCADO DE AGRICULTURA VERTICAL DA COREIA DO SUL, POR TIPO, 2021-2030 (US$ MILHÕES)
TABELA 47 MERCADO AGRÍCOLA VERTICAL DA COREIA DO SUL, POR TIPO DE CULTURA, 2021-2030 (US$ MILHÕES)
TABELA 48 MERCADO DE AGRICULTURA VERTICAL DA COREIA DO SUL, POR APLICAÇÃO, 2021-2030 (US$ MILHÕES)
TABELA 49 MERCADO DE AGRICULTURA VERTICAL DA COREIA DO SUL, POR COMPONENTE, 2021-2030 (US$ MILHÕES)
TABELA 50 ILUMINAÇÃO DA COREIA DO SUL NO MERCADO DE AGRICULTURA VERTICAL, POR COMPONENTE, 2021-2030 (US$ MILHÕES)
TABELA 51 COMPONENTE HIDROPÔNICO DA COREIA DO SUL NO MERCADO DE AGRICULTURA VERTICAL, POR COMPONENTE, 2021-2030 (US$ MILHÕES)
TABELA 52 CONTROLE CLIMÁTICO NO MERCADO DE AGRICULTURA VERTICAL DA COREIA DO SUL, POR COMPONENTE, 2021-2030 (US$ MILHÕES)
TABELA 53 SENSORES DA COREIA DO SUL NO MERCADO DE AGRICULTURA VERTICAL, POR COMPONENTE, 2021-2030 (US$ MILHÕES)
TABELA 54 MERCADO DE AGRICULTURA VERTICAL DE SINGAPURA, POR MECANISMO DE CRESCIMENTO, 2021-2030 (US$ MILHÕES)
TABELA 55 MERCADO DE AGRICULTURA VERTICAL DE SINGAPURA, POR ESTRUTURA, 2021-2030 (US$ MILHÕES)
TABELA 56 MERCADO DE AGRICULTURA VERTICAL DE SINGAPURA, POR TIPO, 2021-2030 (US$ MILHÕES)
TABELA 57 BIOPESTICIDAS NO MERCADO DE AGRICULTURA VERTICAL DE SINGAPURA, POR TIPO, 2021-2030 (US$ MILHÕES)
TABELA 58 BIOFERTILIZANTES NO MERCADO DE AGRICULTURA VERTICAL DE SINGAPURA, POR TIPO, 2021-2030 (US$ MILHÕES)
TABELA 59 BIOESTIMULANTES NO MERCADO DE AGRICULTURA VERTICAL DE SINGAPURA, POR TIPO, 2021-2030 (US$ MILHÕES)
TABELA 60 MERCADO DE AGRICULTURA VERTICAL DE SINGAPURA, POR TIPO DE CULTURA, 2021-2030 (US$ MILHÕES)
TABELA 61 MERCADO DE AGRICULTURA VERTICAL DE SINGAPURA, POR APLICAÇÃO, 2021-2030 (US$ MILHÕES)
TABELA 62 MERCADO DE AGRICULTURA VERTICAL DE SINGAPURA, POR COMPONENTE, 2021-2030 (US$ MILHÕES)
TABELA 63 ILUMINAÇÃO DE SINGAPURA NO MERCADO DE AGRICULTURA VERTICAL, POR COMPONENTE, 2021-2030 (US$ MILHÕES)
TABELA 64 COMPONENTE HIDROPÔNICO DE SINGAPURA NO MERCADO DE AGRICULTURA VERTICAL, POR COMPONENTE, 2021-2030 (US$ MILHÕES)
TABELA 65 CONTROLE CLIMÁTICO NO MERCADO DE AGRICULTURA VERTICAL DE SINGAPURA, POR COMPONENTE, 2021-2030 (US$ MILHÕES)
TABELA 66 SENSORES DE SINGAPURA NO MERCADO DE AGRICULTURA VERTICAL, POR COMPONENTE, 2021-2030 (US$ MILHÕES)
TABELA 67 MERCADO DE AGRICULTURA VERTICAL DA AUSTRÁLIA, POR MECANISMO DE CRESCIMENTO, 2021-2030 (US$ MILHÕES)
TABELA 68 MERCADO AGRÍCOLA VERTICAL DA AUSTRÁLIA, POR ESTRUTURA, 2021-2030 (US$ MILHÕES)
TABELA 69 MERCADO DE AGRICULTURA VERTICAL DA AUSTRÁLIA, POR TIPO, 2021-2030 (US$ MILHÕES)
TABELA 70 BIOPESTICIDAS NO MERCADO DE AGRICULTURA VERTICAL DA AUSTRÁLIA, POR TIPO, 2021-2030 (US$ MILHÕES)
TABELA 71 BIOFERTILIZANTES NO MERCADO DE AGRICULTURA VERTICAL DA AUSTRÁLIA, POR TIPO, 2021-2030 (US$ MILHÕES)
TABELA 72 BIOESTIMULANTES NO MERCADO DE AGRICULTURA VERTICAL DA AUSTRÁLIA, POR TIPO, 2021-2030 (US$ MILHÕES)
TABELA 73 MERCADO DE AGRICULTURA VERTICAL DA AUSTRÁLIA, POR TIPO DE CULTURA, 2021-2030 (US$ MILHÕES)
TABELA 74 MERCADO DE AGRICULTURA VERTICAL DA AUSTRÁLIA, POR APLICAÇÃO, 2021-2030 (US$ MILHÕES)
TABELA 75 MERCADO DE AGRICULTURA VERTICAL DA AUSTRÁLIA, POR COMPONENTE, 2021-2030 (US$ MILHÕES)
TABELA 76 ILUMINAÇÃO NA AUSTRÁLIA NO MERCADO DE AGRICULTURA VERTICAL, POR COMPONENTE, 2021-2030 (US$ MILHÕES)
TABELA 77 COMPONENTE HIDROPÔNICO DA AUSTRÁLIA NO MERCADO DE AGRICULTURA VERTICAL, POR COMPONENTE, 2021-2030 (US$ MILHÕES)
TABELA 78 CONTROLE CLIMÁTICO NA AUSTRÁLIA NO MERCADO DE AGRICULTURA VERTICAL, POR COMPONENTE, 2021-2030 (US$ MILHÕES)
TABELA 79 SENSORES DA AUSTRÁLIA NO MERCADO DE AGRICULTURA VERTICAL, POR COMPONENTE, 2021-2030 (US$ MILHÕES)
TABELA 80 MERCADO DE AGRICULTURA VERTICAL DA ÍNDIA, POR MECANISMO DE CRESCIMENTO, 2021-2030 (US$ MILHÕES)
TABELA 81 MERCADO DE AGRICULTURA VERTICAL DA ÍNDIA, POR ESTRUTURA, 2021-2030 (US$ MILHÕES)
TABELA 82 MERCADO DE AGRICULTURA VERTICAL DA ÍNDIA, POR TIPO, 2021-2030 (US$ MILHÕES)
TABELA 83 BIOPESTICIDAS NO MERCADO DE AGRICULTURA VERTICAL DA ÍNDIA, POR TIPO, 2021-2030 (US$ MILHÕES)
TABELA 84 MERCADO DE BIOFERTILIZANTES NA AGRICULTURA VERTICAL DA ÍNDIA, POR TIPO, 2021-2030 (US$ MILHÕES)
TABELA 85 BIOESTIMULANTES NO MERCADO DE AGRICULTURA VERTICAL DA ÍNDIA, POR TIPO, 2021-2030 (US$ MILHÕES)
TABELA 86 MERCADO DE AGRICULTURA VERTICAL DA ÍNDIA, POR TIPO DE CULTURA, 2021-2030 (US$ MILHÕES)
TABELA 87 MERCADO DE AGRICULTURA VERTICAL DA ÍNDIA, POR APLICAÇÃO, 2021-2030 (US$ MILHÕES)
TABELA 88 MERCADO DE AGRICULTURA VERTICAL DA ÍNDIA, POR COMPONENTE, 2021-2030 (US$ MILHÕES)
TABELA 89 ILUMINAÇÃO DA ÍNDIA NO MERCADO DE AGRICULTURA VERTICAL, POR COMPONENTE, 2021-2030 (US$ MILHÕES)
TABELA 90 COMPONENTE HIDROPÔNICO DA ÍNDIA NO MERCADO DE AGRICULTURA VERTICAL, POR COMPONENTE, 2021-2030 (US$ MILHÕES)
TABELA 91 CONTROLE CLIMÁTICO NA ÍNDIA NO MERCADO DE AGRICULTURA VERTICAL, POR COMPONENTE, 2021-2030 (US$ MILHÕES)
TABELA 92 SENSORES DA ÍNDIA NO MERCADO DE AGRICULTURA VERTICAL, POR COMPONENTE, 2021-2030 (US$ MILHÕES)
TABELA 93 MERCADO DE AGRICULTURA VERTICAL DA TAILÂNDIA, POR MECANISMO DE CRESCIMENTO, 2021-2030 (US$ MILHÕES)
TABELA 94 MERCADO DE AGRICULTURA VERTICAL DA TAILÂNDIA, POR ESTRUTURA, 2021-2030 (US$ MILHÕES)
TABELA 95 MERCADO DE AGRICULTURA VERTICAL DA TAILÂNDIA, POR TIPO, 2021-2030 (US$ MILHÕES)
TABELA 96 BIOPESTICIDAS NA TAILÂNDIA NO MERCADO DE AGRICULTURA VERTICAL, POR TIPO, 2021-2030 (US$ MILHÕES)
TABELA 97 BIOFERTILIZANTES NO MERCADO DE AGRICULTURA VERTICAL DA TAILÂNDIA, POR TIPO, 2021-2030 (US$ MILHÕES)
TABELA 98 BIOESTIMULANTES NO MERCADO DE AGRICULTURA VERTICAL DA TAILÂNDIA, POR TIPO, 2021-2030 (US$ MILHÕES)
TABELA 99 MERCADO DE AGRICULTURA VERTICAL DA TAILÂNDIA, POR TIPO DE CULTURA, 2021-2030 (US$ MILHÕES)
TABELA 100 MERCADO DE AGRICULTURA VERTICAL DA TAILÂNDIA, POR APLICAÇÃO, 2021-2030 (US$ MILHÕES)
TABELA 101 MERCADO DE AGRICULTURA VERTICAL DA TAILÂNDIA, POR COMPONENTE, 2021-2030 (US$ MILHÕES)
TABELA 102 ILUMINAÇÃO NA TAILÂNDIA NO MERCADO DE AGRICULTURA VERTICAL, POR COMPONENTE, 2021-2030 (US$ MILHÕES)
TABELA 103 COMPONENTE HIDROPÔNICO DA TAILÂNDIA NO MERCADO DE AGRICULTURA VERTICAL, POR COMPONENTE, 2021-2030 (US$ MILHÕES)
TABELA 104 CONTROLE CLIMÁTICO NA TAILÂNDIA NO MERCADO DE AGRICULTURA VERTICAL, POR COMPONENTE, 2021-2030 (US$ MILHÕES)
TABELA 105 SENSORES DA TAILÂNDIA NO MERCADO DE AGRICULTURA VERTICAL, POR COMPONENTE, 2021-2030 (US$ MILHÕES)
TABELA 106 MERCADO DE AGRICULTURA VERTICAL DA INDONÉSIA, POR MECANISMO DE CRESCIMENTO, 2021-2030 (US$ MILHÕES)
TABELA 107 MERCADO DE AGRICULTURA VERTICAL DA INDONÉSIA, POR ESTRUTURA, 2021-2030 (US$ MILHÕES)
TABELA 108 MERCADO DE AGRICULTURA VERTICAL DA INDONÉSIA, POR TIPO, 2021-2030 (US$ MILHÕES)
TABELA 109 BIOPESTICIDAS NO MERCADO DE AGRICULTURA VERTICAL DA INDONÉSIA, POR TIPO, 2021-2030 (US$ MILHÕES)
TABELA 110 BIOFERTILIZANTES NO MERCADO DE AGRICULTURA VERTICAL DA INDONÉSIA, POR TIPO, 2021-2030 (US$ MILHÕES)
TABELA 111 BIOESTIMULANTES NO MERCADO DE AGRICULTURA VERTICAL DA INDONÉSIA, POR TIPO, 2021-2030 (US$ MILHÕES)
TABELA 112 MERCADO DE AGRICULTURA VERTICAL DA INDONÉSIA, POR TIPO DE CULTURA, 2021-2030 (US$ MILHÕES)
TABELA 113 MERCADO DE AGRICULTURA VERTICAL DA INDONÉSIA, POR APLICAÇÃO, 2021-2030 (US$ MILHÕES)
TABELA 114 MERCADO DE AGRICULTURA VERTICAL DA INDONÉSIA, POR COMPONENTE, 2021-2030 (US$ MILHÕES)
TABELA 115 ILUMINAÇÃO NA INDONÉSIA NO MERCADO DE AGRICULTURA VERTICAL, POR COMPONENTE, 2021-2030 (US$ MILHÕES)
TABELA 116 COMPONENTE HIDROPÔNICO DA INDONÉSIA NO MERCADO DE AGRICULTURA VERTICAL, POR COMPONENTE, 2021-2030 (US$ MILHÕES)
TABELA 117 CONTROLE CLIMÁTICO NA INDONÉSIA NO MERCADO DE AGRICULTURA VERTICAL, POR COMPONENTE, 2021-2030 (US$ MILHÕES)
TABELA 118 SENSORES DA INDONÉSIA NO MERCADO DE AGRICULTURA VERTICAL, POR COMPONENTE, 2021-2030 (US$ MILHÕES)
TABELA 119 MERCADO DE AGRICULTURA VERTICAL DA MALÁSIA, POR MECANISMO DE CRESCIMENTO, 2021-2030 (US$ MILHÕES)
TABELA 120 MERCADO DE AGRICULTURA VERTICAL DA MALÁSIA, POR ESTRUTURA, 2021-2030 (US$ MILHÕES)
TABELA 121 MERCADO DE AGRICULTURA VERTICAL DA MALÁSIA, POR TIPO, 2021-2030 (US$ MILHÕES)
TABELA 122 BIOPESTICIDAS NO MERCADO DE AGRICULTURA VERTICAL DA MALÁSIA, POR TIPO, 2021-2030 (US$ MILHÕES)
TABELA 123 BIOFERTILIZANTES NO MERCADO DE AGRICULTURA VERTICAL DA MALÁSIA, POR TIPO, 2021-2030 (US$ MILHÕES)
TABELA 124 BIOESTIMULANTES NO MERCADO DE AGRICULTURA VERTICAL DA MALÁSIA, POR TIPO, 2021-2030 (US$ MILHÕES)
TABELA 125 MERCADO DE AGRICULTURA VERTICAL DA MALÁSIA, POR TIPO DE CULTURA, 2021-2030 (US$ MILHÕES)
TABELA 126 MERCADO DE AGRICULTURA VERTICAL DA MALÁSIA, POR APLICAÇÃO, 2021-2030 (MILHÕES DE DÓLARES)
TABELA 127 MERCADO DE AGRICULTURA VERTICAL DA MALÁSIA, POR COMPONENTE, 2021-2030 (US$ MILHÕES)
TABELA 128 ILUMINAÇÃO DA MALÁSIA NO MERCADO DE AGRICULTURA VERTICAL, POR COMPONENTE, 2021-2030 (US$ MILHÕES)
TABELA 129 COMPONENTE HIDROPÔNICO DA MALÁSIA NO MERCADO DE AGRICULTURA VERTICAL, POR COMPONENTE, 2021-2030 (US$ MILHÕES)
TABELA 130 CONTROLE CLIMÁTICO NO MERCADO DE AGRICULTURA VERTICAL DA MALÁSIA, POR COMPONENTE, 2021-2030 (US$ MILHÕES)
TABELA 131 SENSORES DA MALÁSIA NO MERCADO DE AGRICULTURA VERTICAL, POR COMPONENTE, 2021-2030 (US$ MILHÕES)
TABELA 132 MERCADO DE AGRICULTURA VERTICAL DAS FILIPINAS, POR MECANISMO DE CRESCIMENTO, 2021-2030 (US$ MILHÕES)
TABELA 133 MERCADO DE AGRICULTURA VERTICAL DAS FILIPINAS, POR ESTRUTURA, 2021-2030 (US$ MILHÕES)
TABELA 134 MERCADO DE AGRICULTURA VERTICAL DAS FILIPINAS, POR TIPO, 2021-2030 (US$ MILHÕES)
TABELA 135 BIOPESTICIDAS NAS FILIPINAS NO MERCADO DE AGRICULTURA VERTICAL, POR TIPO, 2021-2030 (US$ MILHÕES)
TABELA 136 MERCADO DE BIOFERTILIZANTES NAS FILIPINAS PARA AGRICULTURA VERTICAL, POR TIPO, 2021-2030 (US$ MILHÕES)
TABLE 137 PHILIPPINES BIOSTIMULANTS IN VERTICAL FARMING MARKET, BY TYPE, 2021-2030 (USD MILLION)
TABLE 138 PHILIPPINES VERTICAL FARMING MARKET, BY CROP TYPE, 2021-2030 (USD MILLION)
TABLE 139 PHILIPPINES VERTICAL FARMING MARKET, BY APPLICATION, 2021-2030 (USD MILLION)
TABLE 140 PHILIPPINES VERTICAL FARMING MARKET, BY COMPONENT, 2021-2030 (USD MILLION)
TABLE 141 PHILIPPINES LIGHTING IN VERTICAL FARMING MARKET, BY COMPONENT, 2021-2030 (USD MILLION)
TABLE 142 PHILIPPINES HYDROPONIC COMPONENT IN VERTICAL FARMING MARKET, BY COMPONENT, 2021-2030 (USD MILLION)
TABLE 143 PHILIPPINES CLIMATE CONTROL IN VERTICAL FARMING MARKET, BY COMPONENT, 2021-2030 (USD MILLION)
TABLE 144 PHILIPPINES SENSORS IN VERTICAL FARMING MARKET, BY COMPONENT, 2021-2030 (USD MILLION)
TABLE 145 REST OF APAC VERTICAL FARMING MARKET, BY GROWTH MECHANISM, 2021-2030 (USD MILLION)
Lista de Figura
FIGURE 1 ASIA-PACIFIC VERTICAL FARMING MARKET: SEGMENTATION
FIGURE 2 ASIA-PACIFIC VERTICAL FARMING MARKET: DATA TRIANGULATION
FIGURE 3 ASIA-PACIFIC VERTICAL FARMING MARKET : DROC ANALYSIS
FIGURE 4 ASIA-PACIFIC VERTICAL FARMING MARKET: GLOBAL VS REGIONAL MARKET ANALYSIS
FIGURE 5 ASIA-PACIFIC VERTICAL FARMING MARKET: COMPANY RESEARCH ANALYSIS
FIGURE 6 ASIA-PACIFIC VERTICAL FARMING MARKET: INTERVIEW DEMOGRAPHICS
FIGURE 7 ASIA-PACIFIC VERTICAL FARMING MARKET: DBMR MARKET POSITION GRID
FIGURE 8 ASIA-PACIFIC VERTICAL FARMING MARKET: SEGMENTATION
FIGURE 9 THE GROWING PRODUCTION OF BIOPHARMACEUTICAL PRODUCTS IS DRIVING THE GROWTH OF ASIA-PACIFIC VERTICAL FARMING MARKET IN THE FORECAST PERIOD OF 2023 TO 2030
FIGURE 10 HYDROPONICS SEGMENT IS EXPECTED TO ACCOUNT FOR THE LARGEST SHARE OF THE ASIA-PACIFIC VERTICAL FARMING MARKET IN 2023 & 2030
FIGURE 11 DRIVERS, RESTRAINTS, OPPORTUNITIES AND CHALLENGES OF ASIA-PACIFIC VERTICAL FARMING MARKET
FIGURE 12 APAC VERTICAL FARMING MARKET: BY GROWTH MECHANISM, 2022
FIGURE 13 APAC VERTICAL FARMING MARKET: BY STRUCTURE, 2022
FIGURE 14 APAC VERTICAL FARMING MARKET: BY TYPE, 2022
FIGURE 15 APAC VERTICAL FARMING MARKET: BY CROP TYPE, 2022
FIGURE 16 APAC VERTICAL FARMING MARKET: BY APPLICATION, 2022
FIGURE 17 APAC VERTICAL FARMING MARKET: BY COMPONENT, 2022
FIGURE 18 APAC VERTICAL FARMING MARKET: SNAPSHOT (2022)
FIGURE 19 APAC VERTICAL FARMING MARKET: BY COUNTRY (2022)
FIGURE 20 APAC VERTICAL FARMING MARKET: BY COUNTRY (2023 & 2030)
FIGURE 21 APAC VERTICAL FARMING MARKET: BY COUNTRY (2022 & 2030)
FIGURE 22 APAC VERTICAL FARMING MARKET: BY GROWTH MECHANISM (2023 - 2030)
FIGURE 23 ASIA-PACIFIC VERTICAL FARMING MARKET: COMPANY SHARE 2022 (%)
Metodologia de Investigação
A recolha de dados e a análise do ano base são feitas através de módulos de recolha de dados com amostras grandes. A etapa inclui a obtenção de informações de mercado ou dados relacionados através de diversas fontes e estratégias. Inclui examinar e planear antecipadamente todos os dados adquiridos no passado. Da mesma forma, envolve o exame de inconsistências de informação observadas em diferentes fontes de informação. Os dados de mercado são analisados e estimados utilizando modelos estatísticos e coerentes de mercado. Além disso, a análise da quota de mercado e a análise das principais tendências são os principais fatores de sucesso no relatório de mercado. Para saber mais, solicite uma chamada de analista ou abra a sua consulta.
A principal metodologia de investigação utilizada pela equipa de investigação do DBMR é a triangulação de dados que envolve a mineração de dados, a análise do impacto das variáveis de dados no mercado e a validação primária (especialista do setor). Os modelos de dados incluem grelha de posicionamento de fornecedores, análise da linha de tempo do mercado, visão geral e guia de mercado, grelha de posicionamento da empresa, análise de patentes, análise de preços, análise da quota de mercado da empresa, normas de medição, análise global versus regional e de participação dos fornecedores. Para saber mais sobre a metodologia de investigação, faça uma consulta para falar com os nossos especialistas do setor.
Personalização disponível
A Data Bridge Market Research é líder em investigação formativa avançada. Orgulhamo-nos de servir os nossos clientes novos e existentes com dados e análises que correspondem e atendem aos seus objetivos. O relatório pode ser personalizado para incluir análise de tendências de preços de marcas-alvo, compreensão do mercado para países adicionais (solicite a lista de países), dados de resultados de ensaios clínicos, revisão de literatura, mercado remodelado e análise de base de produtos . A análise de mercado dos concorrentes-alvo pode ser analisada desde análises baseadas em tecnologia até estratégias de carteira de mercado. Podemos adicionar quantos concorrentes necessitar de dados no formato e estilo de dados que procura. A nossa equipa de analistas também pode fornecer dados em tabelas dinâmicas de ficheiros Excel em bruto (livro de factos) ou pode ajudá-lo a criar apresentações a partir dos conjuntos de dados disponíveis no relatório.

