Ecuador Rice Market
Tamanho do mercado em biliões de dólares
CAGR :
% 
 USD
142.29 Billion
USD
184.61 Billion
2024
2032
USD
142.29 Billion
USD
184.61 Billion
2024
2032
| 2025 –2032 | |
| USD 142.29 Billion | |
| USD 184.61 Billion | |
| % | |
|
Segmentação do mercado de arroz do Equador, por tipo (arroz Arcoz Largo, arroz parboilizado, arroz Arroz Redondo, arroz Calrose, arroz Basmati, arroz jasmim, arroz de sushi, arroz glutinoso, arroz selvagem, arroz arbóreo, arroz Basmati 370, arroz butanês, arroz Bomba, arroz louro da Califórnia, arroz Camargue, arroz Carnaroli, arroz de couve-flor, arroz Colusari, arroz Doongara, arroz egípcio, arroz glutinoso (pegajoso), arroz Matta, arroz Mahogany Japonica, arroz Koshihikari, arroz Calmochi, arroz Rosematta, arroz Akitakomachi e outros), cor do arroz (arroz branco, arroz integral, arroz vermelho e arroz preto), tamanho do grão/tamanho do grão (arroz de grão longo, arroz de grão médio e arroz de grão curto), natureza (convencional e orgânico), teor de amido (amilose e amilopectina), forma de processamento (arroz beneficiado regular, parboilizado, arroz pré-cozido, Misturas de arroz temperadas, arroz pronto para servir, arroz congelado individualmente (IQF), arroz de retorta e outros), grau de moagem (arroz branco, arroz integral e arroz em casca), polimento (polido e não polido), fortificação (regular/não fortificado e fortificado), aroma (arroz não aromático e arroz aromático), derivados de arroz (farinha de arroz, óleo de farelo de arroz, arroz quebrado, amido de arroz, farelo de arroz, proteína de arroz, xarope de arroz, casca de arroz, leite de arroz , vinagre de arroz, álcoois à base de arroz e outros), usuário final (consumo direto/doméstico, alimentos e bebidas, ração, produtos farmacêuticos, cosméticos e cuidados pessoais, suplementos alimentares e outros), canal de distribuição (offline e online) - tendências e previsões do setor até 2032
Análise do Mercado de Arroz do Equador
O mercado de arroz do Equador é impulsionado pela crescente necessidade de sistemas confiáveis e de alto desempenho na agricultura. O mercado de arroz do Equador está apresentando um crescimento significativo. O arroz equatoriano é preferido por sua eficiência superior, desempenho robusto e custo-benefício, tornando-o ideal para aplicações de produção e processamento em larga escala. Avanços tecnológicos em irrigação, equipamentos agrícolas e sistemas de processamento aumentam a produtividade e a eficiência operacional, contribuindo para melhores rendimentos e redução do consumo de energia. O crescimento do mercado é ainda apoiado por políticas governamentais, iniciativas de agricultura sustentável e pela crescente demanda por arroz produzido localmente. No entanto, desafios como preços de mercado flutuantes, variabilidade climática e altos custos operacionais representam barreiras ao crescimento. No entanto, a adoção de tecnologias agrícolas modernas, logística aprimorada e investimentos crescentes em infraestrutura apresentam oportunidades significativas, tornando o mercado mais competitivo e impulsionado pela inovação.
Tamanho do mercado de arroz do Equador
Espera-se que o mercado de arroz do Equador alcance US$ 184,61 milhões até 2032, ante US$ 142,29 milhões em 2024, crescendo com um CAGR substancial de 3,34% no período previsto de 2025 a 2032. Além dos insights sobre cenários de mercado, como valor de mercado, taxa de crescimento, segmentação, cobertura geográfica e principais participantes, os relatórios de mercado selecionados pela Data Bridge Market Research também incluem análises aprofundadas de especialistas, produção e capacidade de empresas representadas geograficamente, layouts de rede de distribuidores e parceiros, análise detalhada e atualizada de tendências de preços e análise de déficit da cadeia de suprimentos e demanda.
Tendências do mercado de arroz do Equador
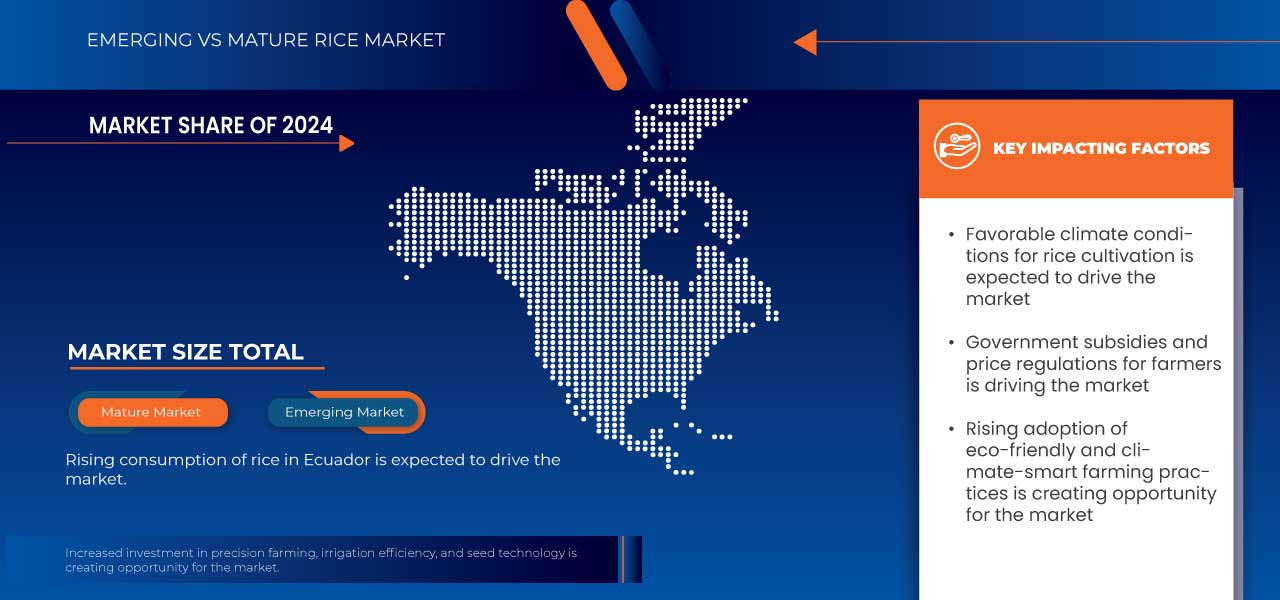
“Aumento do consumo de arroz no Equador”
O mercado de arroz equatoriano é impulsionado pelo crescimento populacional do país, o que levou a uma demanda crescente por alimentos básicos acessíveis e de baixo custo. O arroz, sendo uma fonte versátil e econômica de carboidratos, é a escolha preferida de famílias de todas as faixas de renda. Além disso, a urbanização desempenhou um papel significativo no aumento do consumo de arroz. À medida que mais pessoas migram para áreas urbanas, a demanda por opções de alimentos práticos e prontos para cozinhar aumentou, sendo o arroz um ingrediente essencial em muitos pratos tradicionais e modernos.
Escopo do Relatório e Segmentação do Mercado de Arroz do Equador
|
Atributos |
Principais insights do mercado de arroz do Equador |
|
Segmentos abrangidos |
|
|
Territórios abrangidos |
Guayas, Los Ríos, Manabí, Loja, El Oro, Esmeraldas, Cañar, Azuay, Bolívar, Carchi, Chimborazo, Cotopaxi, Galápagos, Imbabura, Morona Santiago, Napo, Orellana, Pastaza, Pichincha, Santa Elena, Santo Domingo De Los Tsáchilas, Sucumbíos, Tungurahua, Zamora-Chinchipe |
|
Principais participantes do mercado |
|
|
Oportunidades de mercado |
|
|
Conjuntos de informações de dados de valor agregado |
Além dos insights sobre cenários de mercado, como valor de mercado, taxa de crescimento, segmentação, cobertura geográfica e principais participantes, os relatórios de mercado selecionados pela Data Bridge Market Research também incluem análises aprofundadas de especialistas, produção e capacidade de empresas representadas geograficamente, layouts de rede de distribuidores e parceiros, análises detalhadas e atualizadas de tendências de preços e análises de déficit da cadeia de suprimentos e demanda. |
Definição do Mercado de Arroz do Equador
O arroz é um cereal básico cultivado globalmente e serve como principal fonte de alimento para mais da metade da população mundial. Pertencente ao gênero Oryza, as variedades mais comuns são Oryza sativa (arroz asiático) e Oryza glaberrima (arroz africano). É rico em carboidratos, fornecendo energia essencial, e está disponível em vários tipos, incluindo arroz branco, integral, basmati e jasmim. O arroz cresce em diversos ambientes, desde arrozais alagados até terras altas secas. É um ingrediente fundamental em muitas culinárias, usado em pratos como sushi, biryani e risoto. Sua versatilidade, valor nutricional e importância global o tornam uma commodity agrícola essencial.
Dinâmica do mercado de arroz do Equador
Motoristas
- Aumento do consumo de arroz no Equador
O rápido crescimento da automação industrial é um dos principais impulsionadores da crescente demanda global por arroz equatoriano. À medida que as indústrias adotam sistemas mais automatizados para melhorar a eficiência operacional, reduzir custos e aumentar a produtividade, a necessidade de motores confiáveis e de alto desempenho que possam lidar com processos complexos torna-se mais evidente. O arroz equatoriano, conhecido por sua eficiência energética, precisão e desempenho consistente, é crucial para apoiar essa mudança rumo à automação.
Um dos principais impulsionadores do aumento do consumo de arroz é o crescimento populacional do Equador, que levou a uma maior demanda por alimentos básicos acessíveis e de baixo custo. O arroz, sendo uma fonte versátil e econômica de carboidratos, é a escolha preferida de famílias de todas as faixas de renda. Além disso, a urbanização desempenhou um papel significativo no aumento do consumo de arroz. À medida que mais pessoas migram para áreas urbanas, a demanda por opções de alimentos práticos e prontos para cozinhar aumentou, sendo o arroz um ingrediente-chave em muitos pratos tradicionais e modernos. Além disso, a mudança nos padrões alimentares está contribuindo para a crescente demanda por arroz. Embora o arroz sempre tenha sido um alimento básico na culinária equatoriana, seu consumo é ainda mais amplificado pela crescente popularidade de produtos à base de arroz e alimentos processados. A indústria alimentícia está respondendo a essa tendência com a introdução de produtos inovadores à base de arroz, como arroz pré-cozido, farinha de arroz e refeições prontas para consumo, atendendo ao estilo de vida agitado dos consumidores urbanos.
Por exemplo,
- Em abril de 2024, de acordo com um relatório do USDA, o consumo de arroz no Equador continua a aumentar, com o consumo total previsto para o ano comercial de 2024/25 em 915.000 toneladas, ligeiramente superior ao do ano anterior. O consumo per capita é de 50 kg/ano, com uma meta industrial de 51 kg. O arroz continua sendo o principal carboidrato nas regiões costeiras, consumido até três vezes ao dia, enquanto as populações das terras altas o consomem pelo menos uma vez ao dia. Além disso, fatores como a deterioração de estoques antigos e o aumento do uso de subprodutos do arroz na alimentação animal estão contribuindo para o aumento do consumo geral.
- De acordo com os dados do CEIC, a população do Equador tem crescido de forma constante, atingindo aproximadamente 18 milhões de pessoas em 2023, contra 16 milhões em 2010. Esse crescimento aumentou diretamente a demanda por alimentos básicos como o arroz, que é um alimento básico para a maioria das famílias.
O crescente consumo de arroz no Equador é um dos principais impulsionadores do mercado de arroz do país, impulsionado pelo crescimento populacional, urbanização, mudanças na dieta alimentar e políticas governamentais favoráveis. Esses fatores, em conjunto, contribuem para um mercado robusto e em expansão, apresentando oportunidades significativas para agricultores, processadores e varejistas na cadeia de valor do arroz.
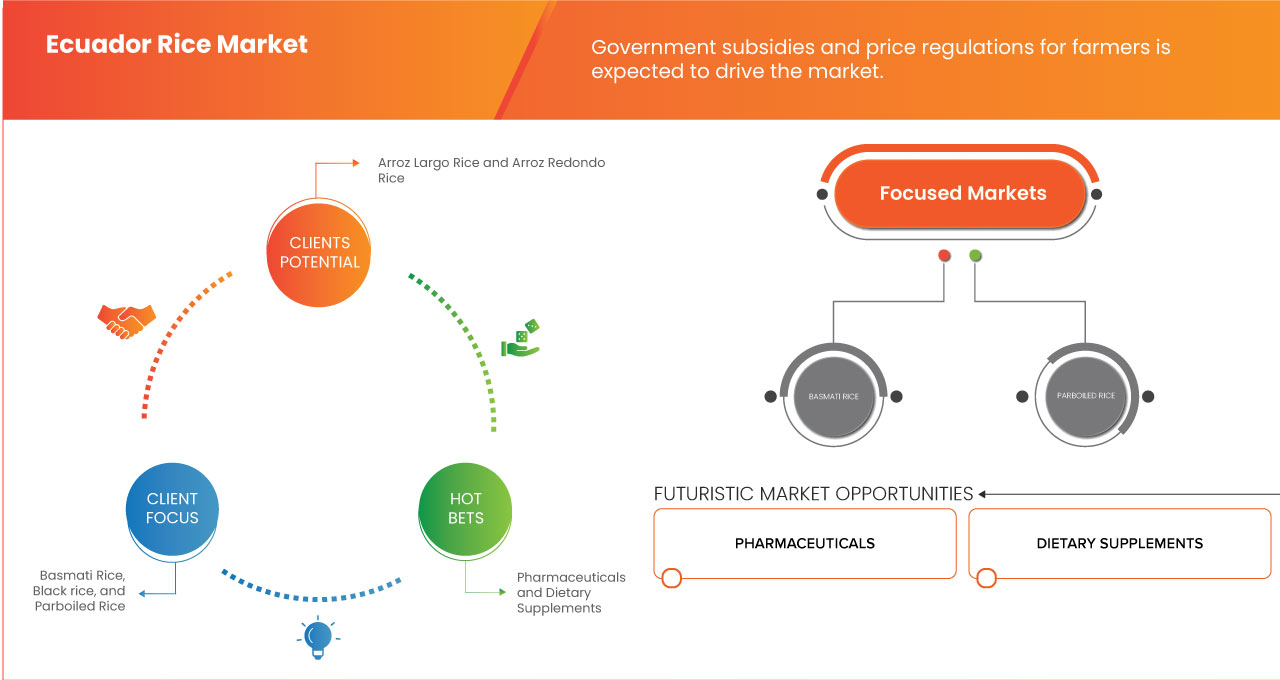
- Subsídios governamentais e regulamentações de preços para agricultores
Os subsídios governamentais fornecem apoio financeiro essencial aos produtores de arroz, permitindo-lhes cobrir os altos custos de insumos como sementes, fertilizantes e máquinas. Ao reduzir o ônus financeiro dos produtores, esses subsídios incentivam o aumento da produção e o investimento em práticas agrícolas modernas. Por exemplo, o governo equatoriano implementou programas para distribuir variedades de sementes de alto rendimento e promover técnicas agrícolas sustentáveis, o que levou ao aumento da produtividade e à produção de arroz de melhor qualidade. Esse apoio não apenas impulsiona a oferta interna, mas também fortalece a competitividade do arroz equatoriano no mercado regional.
Além do exposto, a regulamentação de preços é fundamental para manter a estabilidade do mercado. O governo estabelece preços mínimos garantidos para o arroz a fim de proteger os agricultores da volatilidade dos preços causada por flutuações nos mercados globais ou condições climáticas imprevisíveis. Isso garante que os agricultores recebam uma compensação justa por seus produtos, incentivando-os a continuar o cultivo mesmo em períodos desafiadores. Para os consumidores, o controle de preços ajuda a manter o arroz acessível, garantindo o acesso a esse alimento básico para todos os segmentos da população. Esse duplo benefício promove um ambiente de mercado equilibrado, onde tanto a oferta quanto a demanda são gerenciadas de forma eficaz.
Além disso, essas políticas contribuem para a segurança alimentar, reduzindo a dependência da importação de arroz. Ao apoiar os agricultores locais e estabilizar os preços, o governo garante um fornecimento consistente de arroz, mesmo em períodos de instabilidade do mercado global.
Por exemplo,
- Segundo artigo publicado pela FAO (Organização das Nações Unidas para a Alimentação e a Agricultura), o governo equatoriano, por meio do Ministério da Agricultura e Pecuária (MAG), implementou programas como o Projeto de Desenvolvimento Agrícola, que fornece aos agricultores acesso subsidiado a sementes, fertilizantes e sistemas de irrigação de alta qualidade.
- Em abril de 2022, de acordo com um artigo publicado no Tridge, o governo equatoriano estabeleceu preços mínimos garantidos para o arroz a fim de proteger os agricultores da volatilidade do mercado. Por exemplo, em 2022, o governo estabeleceu um preço mínimo de US$ 32 por quintal (100 kg) de arroz em casca. Esse preço mínimo garante que os agricultores recebam um retorno justo sobre seu investimento, mesmo com flutuações nos preços globais.
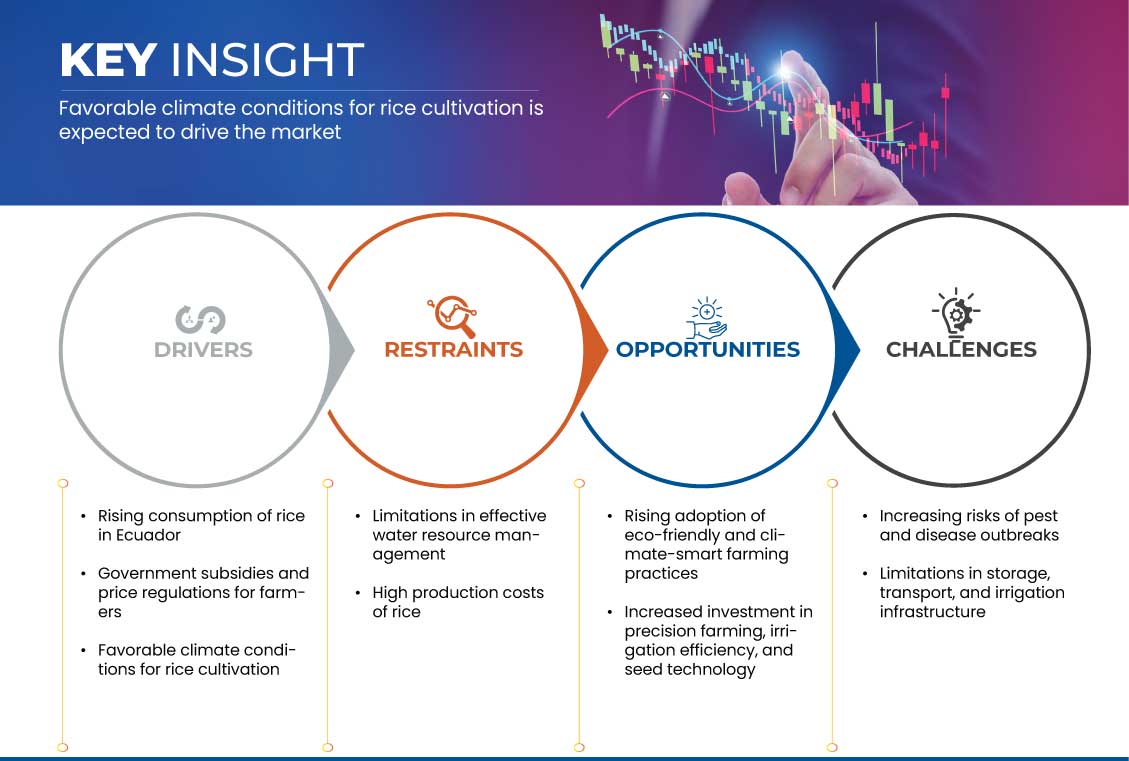
Oportunidades
- Adoção crescente de práticas agrícolas ecologicamente corretas e climaticamente inteligentes
Os produtores de arroz equatorianos podem adotar uma agricultura ecologicamente correta e climaticamente inteligente para aumentar a produtividade, reduzir custos e permanecer competitivos. As principais oportunidades residem na adoção de técnicas sustentáveis de gestão da água. Com o Equador enfrentando desafios em termos de recursos hídricos, a implementação de sistemas de irrigação eficientes, como gotejamento e irrigação de precisão, pode otimizar o uso da água, mantendo altos rendimentos. Isso não apenas reduz os custos de produção, mas também garante a sustentabilidade a longo prazo no cultivo do arroz. Além disso, fertilizantes orgânicos e biofertilizantes estão ganhando força como alternativas viáveis aos fertilizantes químicos. Com o aumento dos custos globais dos fertilizantes, os produtores de arroz equatorianos podem reduzir os gastos com insumos, migrando para melhoradores naturais do solo que melhoram a saúde do solo e reduzem o impacto ambiental. Essa mudança pode posicionar o arroz equatoriano como um produto premium e ecologicamente correto, atraindo mercados nacionais e internacionais com foco em sustentabilidade.
Outra grande oportunidade é a integração de variedades de arroz resistentes ao clima, tolerantes à seca e resistentes a pragas e doenças. Investir em Pesquisa e Desenvolvimento (P&D) para variedades de sementes melhoradas pode aumentar a produtividade, reduzir a dependência de agroquímicos e reforçar a segurança alimentar.
Além disso, a ascensão dos mercados de créditos de carbono e das certificações de sustentabilidade oferece aos produtores de arroz equatorianos um caminho para o acesso a incentivos financeiros. Ao adotar técnicas agrícolas de baixa emissão, como cultivo mínimo e práticas de redução de metano, os produtores podem obter créditos de carbono, criando uma fonte adicional de receita.
Por exemplo,
- Em 2023, de acordo com as Nações Unidas em Quito, Equador, o projeto Agricultura Sustentável com Inclusão e Participação de Gênero vem empoderando agricultores, especialmente mulheres, há mais de uma década. Ao fornecer treinamento, assistência técnica e recursos, o programa permitiu que milhares de pessoas estabelecessem hortas urbanas e adotassem práticas agrícolas sustentáveis. Esta iniciativa não apenas melhora a segurança alimentar e nutricional, mas também promove a independência econômica e a solidariedade comunitária entre os participantes.
À medida que a demanda do consumidor por produtos sustentáveis e ecologicamente corretos cresce, o setor de arroz do Equador pode capitalizar essas tendências para aumentar as exportações, melhorar a lucratividade e garantir a resiliência do mercado a longo prazo.
- Aumento do investimento em agricultura de precisão, eficiência de irrigação e tecnologia de sementes
À medida que as tendências agrícolas globais mudam para soluções baseadas em tecnologia, os produtores de arroz equatorianos podem aproveitar a agricultura de precisão, a eficiência da irrigação e as inovações em tecnologia de sementes para aumentar a produtividade, reduzir o desperdício de recursos e melhorar a competitividade no mercado.
Tecnologias de agricultura de precisão, como imagens de satélite, sensores de solo e análise de dados, permitem que os agricultores monitorem a saúde do solo, otimizem o uso de fertilizantes e prevejam a produtividade com maior precisão. Ao integrar essas ferramentas, os produtores de arroz equatorianos podem aumentar a eficiência, minimizar os custos de insumos e melhorar o desempenho geral da cultura. A adoção de máquinas automatizadas e equipamentos guiados por GPS também pode agilizar as operações de campo, reduzindo os custos de mão de obra e melhorando a eficiência da colheita. A eficiência da irrigação é outra grande área de oportunidade. Com o Equador enfrentando restrições de recursos hídricos, o investimento em irrigação por gotejamento, nivelamento de terrenos a laser e sistemas de irrigação sensíveis à umidade pode ajudar os agricultores a otimizar o uso da água e manter a produtividade mesmo em regiões propensas à seca. Essas tecnologias aprimoram os esforços de conservação de água, garantindo a sustentabilidade a longo prazo da produção de arroz, ao mesmo tempo que reduzem a dependência de padrões erráticos de chuva.
Avanços na tecnologia de sementes podem proporcionar uma oportunidade adicional de crescimento para a indústria arrozeira equatoriana. Variedades de arroz de alto rendimento, resistentes à seca e a pragas podem aumentar significativamente a produtividade, reduzindo a dependência de agroquímicos. Ao investir em Pesquisa e Desenvolvimento (P&D) e promover o uso de sementes geneticamente melhoradas, o Equador pode aumentar a produtividade do arroz, fortalecer a segurança alimentar e expandir as oportunidades de exportação.
Por exemplo,
- Em outubro de 2024, de acordo com um artigo de pesquisa publicado na ResearchGate GmbH, a integração da tecnologia de drones na agricultura está transformando a agricultura tradicional, permitindo a agricultura de precisão, o monitoramento da saúde das culturas e a pulverização eficiente de pesticidas. Agricultores que utilizam drones podem avaliar rapidamente as condições do campo, detectar doenças precocemente e aplicar insumos com mais precisão, reduzindo o desperdício e aumentando a produtividade. Estudos de caso em todo o mundo mostram que os drones aumentam a produtividade, minimizam o impacto ambiental e apoiam práticas agrícolas sustentáveis, tornando-os uma ferramenta valiosa para a agricultura moderna.
- Em agosto de 2023, de acordo com um artigo publicado pelo Banco Mundial, o Projeto de Irrigação Tecnificada (PIT), apoiado pelo Banco Mundial e pela AECID, melhorou significativamente o acesso à água para mais de 6.000 famílias e 6.300 hectares no Equador. Os agricultores agora se beneficiam da gestão eficiente da água, resultando em maior produtividade agrícola e aumento da renda.
A integração dessas práticas agrícolas modernas não só aumentará a eficiência da produção de arroz no Equador, como também posicionará o país como um ator de liderança no cultivo sustentável e tecnologicamente avançado de arroz. Essa mudança para uma agricultura impulsionada pela inovação abrirá portas para maior lucratividade, melhor qualidade e maior resiliência às flutuações climáticas e de mercado.
Restrições/Desafios
- Indústrias aumentam riscos de surtos de pragas e doenças
A crescente frequência e gravidade dos surtos de pragas e doenças representam um desafio significativo para o mercado de arroz do Equador, ameaçando a produtividade, a qualidade e a lucratividade. Com a mudança das condições climáticas, temperaturas e níveis de umidade mais altos estão criando um ambiente mais favorável para pragas e patógenos, levando a maiores perdas de safra e aumento dos custos de produção.
Pragas como a sogata (Tagosodes orizicolus), brocas do colmo do arroz e percevejos do arroz estão se tornando mais prevalentes, causando danos severos às plantas de arroz ao se alimentarem da seiva e enfraquecerem os colmos. Isso leva a menores produtividades e baixa qualidade dos grãos, impactando tanto o fornecimento doméstico quanto o potencial de exportação. Além disso, a resistência de insetos aos métodos de controle químico está tornando o manejo de pragas cada vez mais difícil e caro para os agricultores. No front das doenças, infecções fúngicas como a brusone do arroz (Pyricularia oryzae) e o vírus da hoja blanca, transmitidos por pragas, estão se espalhando mais rapidamente. Essas doenças causam descoloração das folhas, crescimento atrofiado e formação reduzida de grãos, reduzindo significativamente a produção geral da colheita. Com variedades inadequadas de arroz resistentes a doenças e acesso limitado a soluções avançadas de proteção de cultivos, os agricultores equatorianos enfrentam dificuldades crescentes para mitigar esses riscos.
O ônus econômico do controle de pragas e doenças está aumentando, com os agricultores sendo forçados a aumentar o uso de pesticidas, investir em sementes caras e resistentes a doenças e adotar práticas de monitoramento mais intensivas. Isso não só aumenta os custos de produção, como também gera preocupações quanto à sustentabilidade ambiental e à saúde do solo a longo prazo.
Por exemplo,
- Em outubro de 2024, de acordo com um artigo de pesquisa publicado pela Universidade da Flórida, a brusone do arroz, um patógeno fúngico altamente destrutivo, representa uma séria ameaça à rizicultura equatoriana, reduzindo significativamente a produtividade e a qualidade da colheita. Com a doença capaz de destruir de 10% a 30% do arroz colhido globalmente, os produtores de arroz equatorianos, especialmente em Guayas e Los Ríos, estão cada vez mais vulneráveis devido às condições climáticas úmidas que favorecem o crescimento de fungos.
Os riscos crescentes de surtos de pragas e doenças representam um sério desafio para o mercado de arroz do Equador, afetando a produtividade, a qualidade e a lucratividade geral das colheitas. Com condições climáticas favoráveis acelerando a disseminação de pragas como a sogata e a broca-do-colmo, bem como de doenças como a brusone do arroz e o vírus da hoja blanca, os agricultores enfrentam custos de produção crescentes e maior incerteza. A dependência de controles químicos, a falta de acesso generalizado a variedades resistentes a doenças e as preocupações ambientais complicam ainda mais a situação.
- Limitações na Gestão Eficaz dos Recursos Hídricos
A infraestrutura de irrigação precária e o controle insuficiente da água em áreas de sequeiro geram incerteza para os agricultores, levando a produtividades inconsistentes e maiores riscos à produção. Esses desafios não só impactam o crescimento e a qualidade das culturas, como também contribuem para flutuações na oferta, que afetam os preços e a competitividade no mercado.
A produção de arroz do Equador depende em grande parte de um sistema de duas estações, com cultivo tanto durante as estações chuvosa quanto seca. No entanto, sistemas de irrigação ineficientes restringem a capacidade dos agricultores de maximizar a produção durante os períodos de seca, tornando a produção de arroz altamente dependente da precipitação. Em áreas de sequeiro, a falta de regulação hídrica adequada leva ao excesso de água em algumas regiões e à escassez em outras, causando desenvolvimento irregular das culturas e perdas de produtividade. Além disso, a ineficiência na gestão da água aumenta a vulnerabilidade às variações climáticas, particularmente durante os eventos El Niño e La Niña, que trazem condições climáticas extremas. Chuvas fortes podem levar a campos de arroz inundados, danificando as plantações, enquanto secas prolongadas criam escassez de água, reduzindo as áreas de plantio e a produção geral. Essas incertezas interrompem a cadeia de suprimentos, levando à volatilidade dos preços e afetando produtores e consumidores.
A infraestrutura hídrica inadequada também limita a expansão das operações de cultivo de arroz e desestimula o investimento no setor. Os agricultores enfrentam custos operacionais mais elevados, pois dependem de métodos alternativos de irrigação mais caros, o que reduz a lucratividade e torna o cultivo de arroz menos sustentável a longo prazo.
Por exemplo
- De acordo com um artigo publicado no SDGF, o Equador enfrenta problemas de gestão de recursos hídricos, incluindo rios poluídos, diminuição da disponibilidade de águas superficiais e aquíferos superexplorados. A ausência de políticas nacionais para a água e dados hidrológicos desatualizados enfraqueceram ainda mais a governança hídrica. A coordenação ineficiente entre instituições e a gestão inadequada de bacias hidrográficas levaram à má distribuição de recursos. Financiamento insuficiente e regulamentações frágeis dificultam o acesso sustentável à água para a agricultura e outros setores.
Fatores de gestão dos recursos hídricos representam uma restrição significativa ao mercado de arroz do Equador, reduzindo a eficiência da produção, aumentando os riscos climáticos e criando instabilidade na cadeia de suprimentos. Sem acesso confiável à água, o setor luta para manter um crescimento estável, impactando tanto o abastecimento doméstico quanto a competitividade do mercado.
Escopo do mercado de arroz do Equador
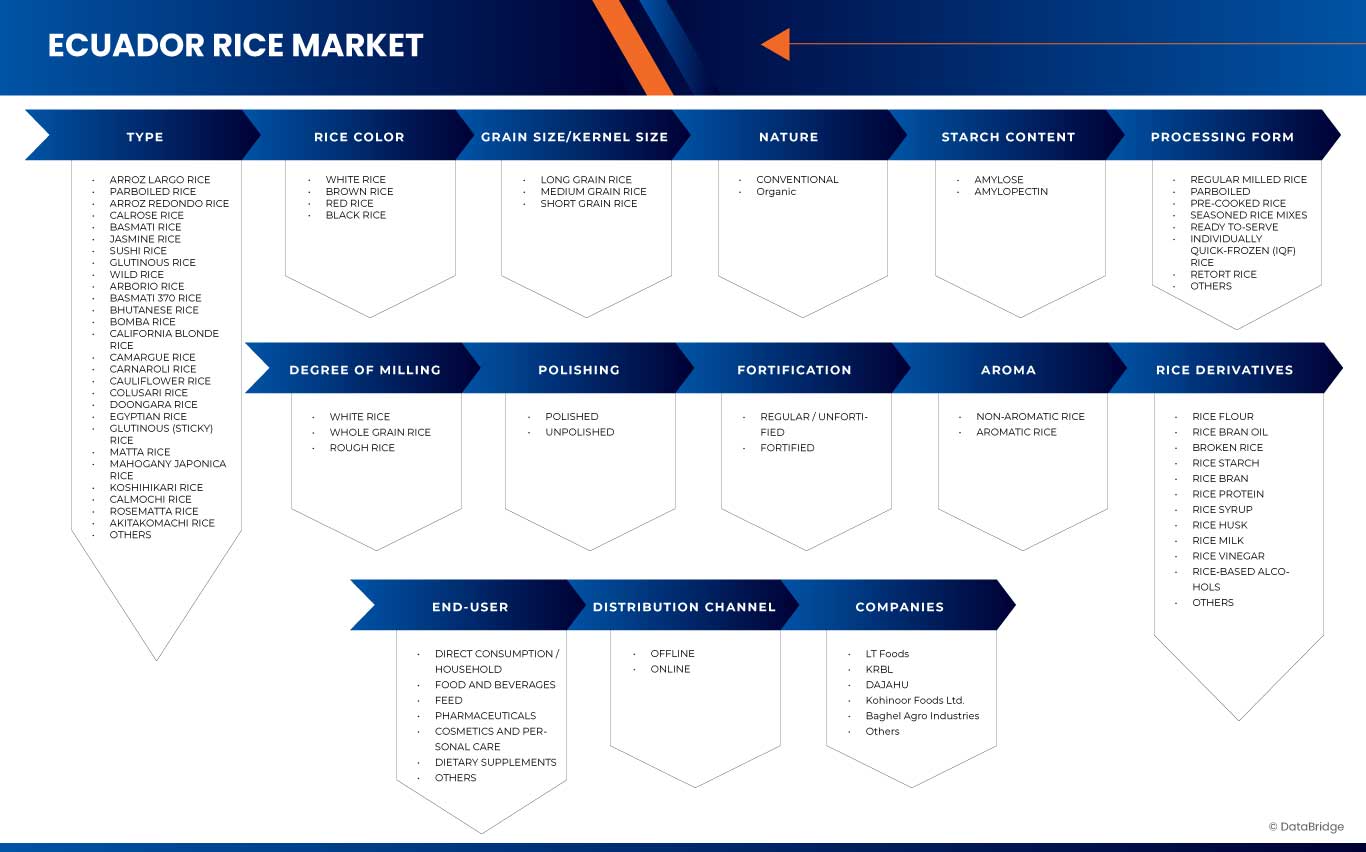
O mercado é segmentado com base no tipo, cor do arroz, tamanho do grão/grão, natureza, teor de amido, forma de processamento, grau de moagem, polimento, fortificação, aroma, derivados do arroz, usuário final e canal de distribuição. O crescimento entre esses segmentos ajudará você a analisar os segmentos de baixo crescimento nos setores e fornecerá aos usuários uma visão geral e insights valiosos do mercado para ajudá-los a tomar decisões estratégicas para identificar as principais aplicações de mercado.
Tipo
- Arroz Largo Arroz
- Arroz parboilizado
- Arroz Redondo
- Arroz Calrose
- Arroz Basmati
- Arroz Jasmim
- Arroz de sushi
- Arroz glutinoso
- Arroz selvagem
- Arroz Arbóreo
- Arroz Basmati 370
- Arroz butanês
- Arroz Bomba
- Arroz Loiro da Califórnia
- Arroz de Camarga
- Arroz Carnaroli
- Arroz de couve-flor
- Arroz Colusari
- Arroz Doongara
- Arroz egípcio
- Arroz glutinoso (pegajoso)
- Arroz Matta
- Arroz Mogno Japonica
- Arroz Koshihikari
- Arroz Calmochi
- Arroz Rosematta
- Arroz Akitakomachi
- Outros
Cor de arroz
- Arroz branco
- Arroz integral
- Arroz Vermelho
- Arroz preto
Tamanho do grão/tamanho do núcleo
- Arroz de grão longo
- Arroz de grão médio
- Arroz de grão curto
Natureza
- Convencional
- Orgânico
Conteúdo de amido
- Amilose
- Amilopectina
Formulário de Processamento
- Arroz beneficiado regular
- Parboilizado
- Arroz pré-cozido
- Misturas de arroz temperadas
- Pronto para servir
- Arroz congelado individualmente (IQF)
- Arroz de Retorta
- Outros
Grau de Fresagem
- Arroz branco
- Arroz integral
- Arroz em casca
Polimento
- Polido
- Não polido
Fortificação
- Regular / Não fortificado
- Fortificado
- Fortificado, por Processo
- Secagem
- Revestimento
- Extrusão a quente
- Encapsulamento
- Outros
- Fortificado, por Processo
Aroma
- Arroz Não Aromático
- Arroz aromático
- Arroz aromático, por tipo
- Basmati
- Jasmim
- Arborio
- Arroz doce
- Vermelho Aromático
- Japonica preta
- Outros
- Arroz aromático, por tipo
Derivados de arroz
- Farinha de arroz
- Óleo de farelo de arroz
- Arroz quebrado
- Amido de arroz
- Farelo de arroz
- Proteína de arroz
- Xarope de arroz
- Casca de arroz
- Leite de arroz
- Vinagre de arroz
- Álcoois à base de arroz
- Outros
Usuário final
- Consumo Direto / Domicílio
- Alimentos e Bebidas
- Alimentos e Bebidas, Por Tipo
- Comida
- Alimentos, por tipo
- Padaria
- Padaria, por tipo
- Pães e Rolinhos
- Biscoitos e bolachas
- Bolos e Doces
- Muffins
- Rosquinhas
- Outros
- Pães e Rolinhos
- Padaria, por tipo
- Comida
- Alimentos e Bebidas, Por Tipo
- Alimentos processados
- Alimentos processados, por tipo
- Macarrão
- Massa
- Salgadinhos Extrudados
- Sopas e Molhos
- Outros
- Alimentos processados, por tipo
- Alimentos alternativos aos laticínios
- Confeitaria
- Confeitaria, por tipo
- Chocolates
- Confeitaria de açúcar
- Gomas
- Balas duras
- Outros
- Confeitaria, por tipo
- Fórmula infantil
- Fórmula infantil, por tipo
- Fórmula infantil padrão
- Fórmula de acompanhamento
- Leite para crescer
- Fórmula Especializada
- Outros
- Fórmula infantil, por tipo
- Cereais matinais
- Produtos lácteos
- Produtos Lácteos, Por Tipo
- Iogurte
- Queijo
- Sorvete
- Manteiga
- Outros
- Produtos de carne e aves
- Molhos e temperos
- Outros
- Produtos Lácteos, Por Tipo
- Bebidas
- Bebidas, por tipo
- Sucos
- Refrigerantes
- Bebidas à base de laticínios
- Bebidas de iogurte
- Bebidas Saudáveis
- Bebidas saudáveis, por tipo
- Bebidas de hidratação com eletrólitos
- Bebidas proteicas
- Reforçadores da imunidade
- Injeções no intestino
- Outros
- Água Probiótica
- Bebidas de Kombucha
- Outros
- Bebidas, por tipo
- Alimentar
- Feed, por categoria
- Aves
- Aves, por tipo
- Frangos de corte
- Camadas
- Criadores
- Pintinhos e perus
- Outros
- Aves, por tipo
- Ruminantes
- Ruminantes, por tipo
- Gado leiteiro
- Gado de corte
- Bezerros
- Outros
- Ruminantes, por tipo
- Suínos
- Suínos, por tipo
- Produtor
- Iniciante
- Semear
- Outros
- Suínos, por tipo
- Bicho de estimação
- Animal de estimação, por tipo
- Cachorro
- Gato
- Coelho
- Cavalo
- Ratos
- Outros
- Animal de estimação, por tipo
- Animal aquático
- Animal aquático, por tipo
- Crustáceos
- Crustáceos, por tipo
- Tilápia
- Carpa
- Truta
- Salmão
- Outros
- Animal aquático, por tipo
- Peixe
- Peixe, por tipo
- Camarão
- Caranguejos
- Krill
- Outros
- Peixe, por tipo
- Moluscos
- Moluscos, por tipo
- Ostras
- Mexilhões
- Outros
- Outros
- Moluscos, por tipo
- Aves
- Outros
- Alimentação, por função de saúde
- Ingestão e eficiência alimentar
- Colheita
- Saúde Intestinal
- Nutrição
- Produção e qualidade de ovos
- Imunidade
- Outros
- Ingestão e eficiência alimentar
- Alimentação, por função de saúde
- Feed, por categoria
- Produtos farmacêuticos
- Produtos Farmacêuticos, Por Aplicação
- Saúde Gastrointestinal
- Modulação do Sistema Imunológico
- Distúrbios intestinais
- Distúrbios metabólicos
- Saúde Cardiovascular
- Gestão de Alergias
- Doenças inflamatórias intestinais
- Infecções respiratórias
- Saúde Mental (Psicobióticos)
- Intolerância à lactose
- Obesidade
- Infecções Urogenitais
- Infecções Urogenitais, Por Tipo
- Diabetes tipo 2
- Câncer
- Infecções Urogenitais, Por Tipo
- Produtos Farmacêuticos, Por Aplicação
- Saúde Oral e Dentária
- Outros
- Produtos farmacêuticos, subprodutos
- Comprimidos
- Cápsulas
- Bebidas Probióticas
- Pós
- Outros
- Produtos farmacêuticos, subprodutos
- Cosméticos e Cuidados Pessoais
- Cosméticos e Cuidados Pessoais, Por Categoria
- Produtos para cuidados faciais
- Produtos para cuidados faciais, por tipo
- Cremes e Loções
- Soros
- Esfoliantes e máscaras
- Outros
- Produtos para cuidados faciais
- Cosméticos e Cuidados Pessoais, Por Categoria
- Produtos para cuidados com os cabelos
- Produtos para cuidados com os cabelos, por tipo
- Xampu
- Condicionadores
- Outros
- Produtos para cuidados corporais
- Produtos de maquiagem
- Outros
- Produtos para cuidados com os cabelos, por tipo
- Suplementos Alimentares
- Suplementos alimentares, por tipo
- Saúde imunológica
- Saúde intestinal e digestiva
- Gestão de Energia e Peso
- Saúde da Mulher
- Esportes Fitness
- Saúde Geral
- Saúde óssea e articular
- Saúde Gastrointestinal
- Saúde Mental/Cérebro
- Pele/Cabelo/Unhas
- Saúde Cardíaca
- Diabetes
- Anticâncer
- Imunidade
- Outros
- Suplementos alimentares, por tipo
- Suplementos alimentares, forma de subproduto
- Cápsulas
- Pós
- Cápsulas macias
- Mastigáveis e gomas
- Outros
- Outros
Canal de Distribuição
- Off-line
- Offline, por tipo
- Vendas no varejo
- Vendas no varejo, por tipo de canal
- Supermercados / Hipermercados
- Mercados locais
- Lojas especializadas
- Outros
- Vendas no varejo, por tipo de canal
- Vendas no varejo
- Atacadistas / Distribuidores
- Restaurantes
- Cadeias alimentares (incluindo culinária nacional e internacional)
- Agricultura
- Programas Alimentares do Governo (como Subsídios)
- Distribuição Pública de Alimentos
- Outros
- Offline, por tipo
- On-line
- Online, por tipo
- Sites de propriedade da empresa
- Sites de comércio eletrônico
- Online, por tipo
Território
- Guayas
- Los Rios
- Manabí
- Loja
- El Oro
- Esmeraldas
- Cañar
- Azuay
- Bolívar
- Carchi
- Chimborazo
- Cotopaxi
- Galápagos
- Imbabura
- Morona Santiago
- Napo
- Orellana
- Pastaza
- Pichincha
- Santa Elena
- Santo Domingo De Los Tsáchilas
- Sucumbíos
- Tungurahua
- Zamora-Chinchipe
Análise regional do mercado de arroz do Equador
O mercado é analisado e insights sobre o tamanho do mercado e tendências são fornecidos por tipo, cor do arroz, tamanho do grão/grão, natureza, teor de amido, forma de processamento, grau de moagem, polimento, fortificação, aroma, derivados de arroz, usuário final, canal de distribuição, conforme referenciado acima.
Os territórios abrangidos pelo mercado são Guayas, Los Ríos, Manabí, Loja, El Oro, Esmeraldas, Cañar, Azuay, Bolívar, Carchi, Chimborazo, Cotopaxi, Galápagos, Imbabura, Morona Santiago, Napo, Orellana, Pastaza, Pichincha, Santa Elena, Santo Domingo De Los Tsáchilas, Sucumbíos, Tungurahua e Zamora-Chinchipe.
Espera-se que Guayas domine o mercado devido ao seu clima favorável, solo fértil e alta capacidade de produção de arroz. Como principal província produtora de arroz do Equador, Guayas sustenta uma forte oferta doméstica, atendendo à demanda do consumidor e impulsionando o crescimento do mercado com eficiência.
Guayas é a região que mais cresce no mercado, impulsionada por seu centro econômico, industrialização, desenvolvimento de infraestrutura e investimentos crescentes.
A seção sobre países do relatório também apresenta fatores individuais que impactam o mercado e mudanças na regulamentação do mercado doméstico, que impactam as tendências atuais e futuras do mercado. Pontos de dados como análise da cadeia de valor a montante e a jusante, tendências técnicas, análise das cinco forças de Porter e estudos de caso são alguns dos indicadores utilizados para prever o cenário de mercado para cada país. Além disso, a presença e a disponibilidade de marcas regionais e seus desafios enfrentados devido à concorrência forte ou escassa de marcas locais e nacionais, o impacto de tarifas domésticas e rotas comerciais são considerados na análise de previsão dos dados do país.
Participação no mercado de arroz do Equador
O cenário competitivo do mercado fornece detalhes por concorrentes. Os detalhes incluem visão geral da empresa, finanças da empresa, receita gerada, potencial de mercado, investimento em pesquisa e desenvolvimento, novas iniciativas de mercado, presença regional, locais e instalações de produção, capacidades de produção, pontos fortes e fracos da empresa, lançamento de produto, amplitude e abrangência do produto e domínio da aplicação. Os pontos de dados fornecidos acima referem-se apenas ao foco das empresas em relação ao mercado.
Os líderes do mercado de arroz do Equador que operam no mercado são:
- LT Foods (Índia)
- KRBL (Índia)
- DAJAHU (Equador)
- Kohinoor (Índia)
- Foods Ltd. (Índia)
- Baghel Agro Industries (Índia)
- HealGuru International (Índia)
- Moinho de arroz e leguminosas Vikas (Índia)
- Al-Fiza Herbal (Índia)
Últimos desenvolvimentos no mercado de arroz do Equador
- Em novembro de 2024, a LT Foods, uma empresa global de bens de consumo de movimento rápido (FMCG), expandiu-se para a Arábia Saudita com a inauguração de um novo escritório em Riad. Este movimento estratégico visa explorar o mercado de arroz e alimentos à base de arroz do Reino, avaliado em US$ 2 bilhões. Nos próximos cinco anos, a LT Foods planeja investir SAR 185 milhões em armazenagem, estoques e pessoal, visando uma receita de SAR 435 milhões. Com marcas como DAAWAT, Hadeel e Mufaddal, a empresa busca atender à crescente demanda por produtos de arroz premium na região.
- Em dezembro de 2023, a marca principal da LT Foods, DAAWAT, foi premiada como a "Marca Mais Popular" na classificação de arroz seco da Canstar Blue na Austrália. O reconhecimento se baseou na obtenção de cinco estrelas em diversos parâmetros, incluindo sabor, textura, conveniência da embalagem, variedade e variedade, e satisfação geral. Esta distinção reflete o compromisso da DAAWAT em fornecer produtos de arroz de alta qualidade que repercutam entre os consumidores australianos.
- Em setembro de 2023, a LT Foods expandiu seu portfólio de superalimentos com o lançamento do "Arroz Vermelho de Cozimento Rápido Daawat", voltado para consumidores preocupados com a saúde. Este arroz rico em nutrientes é rico em fitonutrientes e fibras, oferecendo múltiplos benefícios à saúde e sendo cozido em apenas 15 minutos. Embalado em uma lata colecionável e reutilizável de 1 kg, está disponível nas principais plataformas de e-commerce e lojas de varejo modernas em vários estados indianos. Este lançamento segue o sucesso do "Arroz Preto de Cozimento Rápido Daawat", reforçando o compromisso da LT Foods em oferecer opções alimentares práticas e saudáveis.
SKU-
Obtenha acesso online ao relatório sobre a primeira nuvem de inteligência de mercado do mundo

- Painel interativo de análise de dados
- Painel de análise da empresa para oportunidades de elevado potencial de crescimento
- Acesso de analista de pesquisa para personalização e customização. consultas
- Análise da concorrência com painel interativo
- Últimas notícias, atualizações e atualizações Análise de tendências
- Aproveite o poder da análise de benchmark para um rastreio abrangente da concorrência
Índice
1 INTRODUÇÃO
1.1 OBJETIVOS DO ESTUDO
1.2 DEFINIÇÃO DE MERCADO
1.3 VISÃO GERAL
1.4 LIMITAÇÕES
1,5 MERCADOS COBERTOS
2 SEGMENTAÇÃO DE MERCADO
2.1 MERCADOS COBERTOS
2.2 ÂMBITO GEOGRÁFICO
2,3 ANOS CONSIDERADOS PARA O ESTUDO
2.4 MOEDA E PREÇOS
2.5 MODELO DE VALIDAÇÃO DE DADOS TRIPÉ DBMR
2.6 MODELAGEM MULTIVARIADA
2.7 ENTREVISTAS PRINCIPAIS COM PRINCIPAIS LÍDERES DE OPINIÃO
2.8 GRADE DE POSIÇÃO DE MERCADO DBMR
2.9 ANÁLISE DE PARTICIPAÇÃO DE FORNECEDORES DBMR
2.1 GRADE DE USUÁRIO FINAL DE MERCADO
2.11 FONTES SECUNDÁRIAS
2.12 PREMISSAS
3 RESUMO EXECUTIVO
4 INSIGHTS PREMIUM
4.1 DERIVADOS DE ARROZ DO EQUADOR
4.1.1 PRODUÇÃO DE ARROZ NO EQUADOR
4.1.2 DERIVADOS DO ARROZ: CRESCENTE DEMANDA E APLICAÇÕES
4.1.2.1 ÓLEO DE FARELO DE ARROZ
4.1.2.2 FARINHA DE ARROZ
4.1.2.3 AMIDO DE ARROZ
4.1.2.4 FARELO DE ARROZ E RAÇÃO ANIMAL
4.1.2.5 PRODUTOS DE ARROZ FERMENTADOS
4.1.2.6 CONCORRÊNCIA GLOBAL E DINÂMICA DE MERCADO
4.1.3 CONCLUSÃO
4.2 FATORES QUE INFLUENCIAM A DECISÃO DE COMPRA DOS USUÁRIOS FINAIS
4.2.1 PREÇO E ACESSIBILIDADE
4.2.2 QUALIDADE E CARACTERÍSTICAS DO GRÃO
4.2.3 MARCA E EMBALAGEM
4.2.4 DISPONIBILIDADE E ACESSIBILIDADE
4.2.5 BENEFÍCIOS PARA A SAÚDE E NUTRICIONAIS
4.2.6 PREFERÊNCIAS CULTURAIS E REGIONAIS
4.2.7 CONSCIÊNCIA DO CONSUMIDOR E INFLUÊNCIA DE MARKETING
4.2.8 CONSIDERAÇÕES AMBIENTAIS E ÉTICAS
4.2.9 CONCLUSÃO
4.3 ESTRATÉGIAS DE CRESCIMENTO ADOTADAS PELOS PRINCIPAIS ATORES DO MERCADO
4.3.1 INVESTIMENTO EM TECNOLOGIAS AGRÍCOLAS MODERNAS
4.3.2 DIVERSIFICAÇÃO DE PRODUTOS E OFERTAS DE VALOR AGREGADO
4.3.3 EXPANSÃO DOS CANAIS DE DISTRIBUIÇÃO
4.3.4 PARCERIAS E COLABORAÇÕES ESTRATÉGICAS
4.3.5 FOCO NA SUSTENTABILIDADE E EM PRÁTICAS ECOLÓGICAS
4.3.6 POSICIONAMENTO DE MARCA E INOVAÇÕES DE MARKETING
4.3.7 CONCLUSÃO
4.4 TENDÊNCIAS DA INDÚSTRIA E PERSPECTIVAS FUTURAS NO MERCADO DE ARROZ DO EQUADOR
4.4.1 AUMENTO DA ADOÇÃO DA AGRICULTURA DE PRECISÃO
4.4.2 CRESCIMENTO DE PRÁTICAS SUSTENTÁVEIS E RESILIENTES AO CLIMA
4.4.3 EXPANSÃO DOS MARKETPLACES DIGITAIS E DO COMÉRCIO ELETRÔNICO
4.4.4 APOIO GOVERNAMENTAL E REFORMAS POLÍTICAS
4.4.5 AUMENTO DO INTERESSE EM OPORTUNIDADES DE EXPORTAÇÃO
4.4.6 PERSPECTIVAS FUTURAS
4.5 VISÃO GERAL DAS INOVAÇÕES TECNOLÓGICAS
4.5.1 SISTEMAS DE IRRIGAÇÃO TECNOLÓGICOS
4.5.2 SISTEMA DE INTENSIFICAÇÃO DO ARROZ (SRI)
4.5.3 TECNOLOGIA DE DRONE PARA PROTEÇÃO DE CULTURAS
4.5.4 AGRICULTURA DIGITAL – AGRICULTURA AGRÍCOLA E INTELIGENTE
4.5.5 CONCLUSÃO
4.6 AS CINCO FORÇAS DE PORTER
4.6.1 AMEAÇA DE NOVOS ENTRADANTES
4.6.2 PODER DE BARGANHA DOS FORNECEDORES
4.6.3 PODER DE BARGANHA DOS COMPRADORES
4.6.4 AMEAÇA DE PRODUTOS SUBSTITUTOS
4.6.5 RIVALIDADE DA INDÚSTRIA
4.6.6 CONCLUSÃO
4.7 ANÁLISE DE PREÇOS
4.8 CAPACIDADE DE PRODUÇÃO DOS PRINCIPAIS FABRICANTES
4.9 ANÁLISE DA CADEIA DE VALOR
4.9.1 AQUISIÇÃO DE MATÉRIA-PRIMA (VARIEDADES DE SEMENTES E INSUMOS AGRÍCOLAS)
4.9.2 MOAGEM E PROCESSAMENTO DE ARROZ
4.9.3 COMPOSTOS E ADITIVOS
4.9.4 COMPOSTOS E ADITIVOS
4.9.5 EMBALAGEM E ETIQUETAGEM
4.9.6 APLICAÇÕES DE USO FINAL (PRODUTOS FINAIS)
4.9.7 CONCLUSÃO
4.1 PERSPECTIVA DA MARCA
4.10.1 ANÁLISE COMPARATIVA DE MARCAS
4.10.2 VISÃO GERAL DO PRODUTO VS MARCA
4.10.3 ANÁLISE DE MARCA PRÓPRIA VS MARCA
4.11 CENÁRIO DE MUDANÇAS CLIMÁTICAS PARA O MERCADO DE ARROZ DO EQUADOR
4.11.1 PREOCUPAÇÕES AMBIENTAIS
4.11.2 RESPOSTA DA INDÚSTRIA
4.11.3 PAPEL DO GOVERNO
4.11.4 RECOMENDAÇÕES DO ANALISTA
4.11.5 CONCLUSÃO
4.12 IMPACTO DA DESACELERAÇÃO ECONÔMICA NO MERCADO DE ARROZ DO EQUADOR
4.12.1 IMPACTO NO PREÇO
4.12.2 IMPACTO NA CADEIA DE SUPRIMENTOS
4.12.3 IMPACTO NA REMESSA
4.12.4 IMPACTO NAS DECISÕES ESTRATÉGICAS DA EMPRESA
4.12.5 CONCLUSÃO
4.13 CENÁRIO DE IMPORTAÇÃO E EXPORTAÇÃO
4.13.1 CONCLUSÃO
4.14 COBERTURA DE MATÉRIA-PRIMA
4.14.1 INSUMOS AGRÍCOLAS (SEMENTES E MANEJO DE CULTURAS)
4.14.2 DEFESA DA CULTURA DE ARROZ (PESTICIDAS, HERBICIDAS E FUNGICIDAS)
4.14.3 MOAGEM E PROCESSAMENTO DE MATÉRIAS-PRIMAS DE ARROZ
4.14.4 MATERIAIS DE EMBALAGEM
4.14.5 INICIATIVAS DE RECICLAGEM E SUSTENTABILIDADE
4.14.6 CONCLUSÃO
4.15 ANÁLISE DA CADEIA DE SUPRIMENTOS
4.15.1 VISÃO GERAL
4.15.2 CENÁRIO DE CUSTOS LOGÍSTICOS
4.15.3 IMPORTÂNCIA DOS PRESTADORES DE SERVIÇOS LOGÍSTICOS
5 COBERTURA REGULAMENTAR
6 VISÃO GERAL DO MERCADO
6.1 MOTORISTAS
6.1.1 RISING CONSUMPTION OF RICE IN ECUADOR
6.1.2 GOVERNMENT SUBSIDIES AND PRICE REGULATIONS FOR FARMERS
6.1.3 FAVORABLE CLIMATE CONDITIONS FOR RICE CULTIVATION
6.2 RESTRAINTS
6.2.1 LIMITATIONS IN EFFECTIVE WATER RESOURCE MANAGEMENT
6.2.2 HIGH PRODUCTION COSTS OF RICE
6.3 OPPORTUNITIES
6.3.1 RISING ADOPTION OF ECO-FRIENDLY AND CLIMATE-SMART FARMING PRACTICES
6.3.2 INCREASED INVESTMENT IN PRECISION FARMING, IRRIGATION EFFICIENCY, AND SEED TECHNOLOGY
6.4 CHALLENGES
6.4.1 INCREASING RISKS OF PEST AND DISEASE OUTBREAKS
6.4.2 LIMITATIONS IN STORAGE, TRANSPORT, AND IRRIGATION INFRASTRUCTURE
7 ECUADOR RICE MARKET, BY TYPE
7.1 OVERVIEW
7.2 ARROZ LARGO RICE
7.3 PARBOILED RICE
7.4 ARROZ REDONDO RICE
7.5 CALROSE RICE
7.6 BASMATI RICE
7.7 JASMINE RICE
7.8 SUSHI RICE
7.9 GLUTINOUS RICE
7.1 WILD RICE
7.11 ARBORIO RICE
7.12 BASMATI 370 RICE
7.13 BHUTANESE RICE
7.14 BOMBA RICE
7.15 CALIFORNIA BLONDE RICE
7.16 CAMARGUE RICE
7.17 CARNAROLI RICE
7.18 CAULIFLOWER RICE
7.19 COLUSARI RICE
7.2 DOONGARA RICE
7.21 EGYPTIAN RICE
7.22 GLUTINOUS (STICKY) RICE
7.23 MATTA RICE
7.24 MAHOGANY JAPONICA RICE
7.25 KOSHIHIKARI RICE
7.26 CALMOCHI RICE
7.27 ROSEMATTA RICE
7.28 AKITAKOMACHI RICE
7.29 OTHERS
8 ECUADOR RICE MARKET, BY RICE COLOR
8.1 OVERVIEW
8.2 WHITE RICE
8.3 BROWN RICE
8.4 RED RICE
8.5 BLACK RICE
9 ECUADOR RICE MARKET, BY GRAIN SIZE/KERNEL SIZE
9.1 OVERVIEW
9.2 LONG GRAIN RICE
9.3 MEDIUM GRAIN RICE
9.4 SHORT GRAIN RICE
10 ECUADOR RICE MARKET, BY NATURE
10.1 OVERVIEW
10.2 CONVENTIONAL
10.3 ORGANIC
11 ECUADOR RICE MARKET, BY STARCH CONTENT
11.1 OVERVIEW
11.2 AMYLOSE
11.3 AMYLOPECTIN
12 ECUADOR RICE MARKET, BY PROCESSING FORM
12.1 OVERVIEW
12.2 REGULAR MILLED RICE
12.3 PARBOILED
12.4 PRE-COOKED RICE
12.5 SEASONED RICE MIXES
12.6 READY TO-SERVE
12.7 INDIVIDUALLY QUICK-FROZEN (IQF) RICE
12.8 RETORT RICE
12.9 OTHERS
13 ECUADOR RICE MARKET, BY DEGREE OF MILLING
13.1 OVERVIEW
13.2 WHITE RICE
13.3 WHOLE GRAIN RICE
13.4 ROUGH RICE
14 ECUADOR RICE MARKET, BY POLISHING
14.1 OVERVIEW
14.2 POLISHED
14.3 UNPOLISHED
15 ECUADOR RICE MARKET, BY FORTIFICATION
15.1 OVERVIEW
15.2 REGULAR / UNFORTIFIED
15.3 FORTIFIED
16 ECUADOR RICE MARKET, BY AROMA
16.1 OVERVIEW
16.2 NON-AROMATIC RICE
16.3 AROMATIC RICE
17 ECUADOR RICE MARKET, BY RICE DERIVATIVES
17.1 OVERVIEW
17.2 RICE FLOUR
17.3 RICE BRAN OIL
17.4 BROKEN RICE
17.5 RICE STARCH
17.6 RICE BRAN
17.7 RICE PROTEIN
17.8 RICE SYRUP
17.9 RICE HUSK
17.1 RICE MILK
17.11 RICE VINEGAR
17.12 RICE-BASED ALCOHOLS
17.13 OTHERS
18 ECUADOR RICE MARKET, BY END-USER
18.1 OVERVIEW
18.2 DIRECT CONSUMPTION / HOUSEHOLD
18.3 FOOD AND BEVERAGES
18.4 FEED
18.5 PHARMACEUTICALS
18.6 COSMETICS AND PERSONAL CARE
18.7 DIETARY SUPPLEMENTS
18.8 OTHERS
19 ECUADOR RICE MARKET, BY DISTRIBUTION CHANNEL
19.1 OVERVIEW
19.2 OFFLINE
19.3 ONLINE
20 ECUADOR RICE MARKET
20.1 ECUADOR
20.1.1 GUAYAS
20.1.2 LOS RÍOS
20.1.3 MANABÍ
20.1.4 LOJA
20.1.5 EL ORO
20.1.6 ESMERALDAS
20.1.7 CAÑAR
20.1.8 AZUAY
20.1.9 BOLÍVAR
20.1.10 CARCHI
20.1.11 CHIMBORAZO
20.1.12 COTOPAXI
20.1.13 GALÁPAGOS
20.1.14 IMBABURA
20.1.15 MORONA SANTIAGO
20.1.16 NAPO
20.1.17 ORELLANA
20.1.18 PASTAZA
20.1.19 PICHINCHA
20.1.20 SANTA ELENA
20.1.21 SANTO DOMINGO DE LOS TSÁCHILAS
20.1.22 SUCUMBÍOS
20.1.23 TUNGURAHUA
20.1.24 ZAMORA-CHINCHIPE
21 ECUADOR RICE MARKET: COMPANY LANDSCAPE
21.1 COMPANY SHARE ANALYSIS: ECUADOR
22 SWOT ANALYSIS
23 COMPANY PROFILES
23.1 LT FOODS
23.1.1 COMPANY SNAPSHOT
23.1.2 REVENUE ANALYSIS
23.1.3 PRODUCT PORTFOLIO
23.1.4 RECENT DEVELOPMENT
23.2 KRBL
23.2.1 COMPANY SNAPSHOT
23.2.2 REVENUE ANALYSIS
23.2.3 PRODUCT PORTFOLIO
23.2.4 RECENT DEVELOPMENT
23.3 DAJAHU
23.3.1 COMPANY SNAPSHOT
23.3.2 PRODUCT PORTFOLIO
23.3.3 RECENT DEVELOPMENT
23.4 KOHINOOR FOODS LTD
23.4.1 COMPANY SNAPSHOT
23.4.2 REVENUE ANALYSIS
23.4.3 PRODUCT PORTFOLIO
23.4.4 RECENT DEVELOPMENT
23.5 BAGHEL AGRO INDUSTRIES
23.5.1 COMPANY SNAPSHOT
23.5.2 PRODUCT PORTFOLIO
23.5.3 RECENT DEVELOPMENT
23.6 AL-FIZA HERBAL
23.6.1 COMPANY SNAPSHOT
23.6.2 PRODUCT PORTFOLIO
23.6.3 RECENT DEVELOPMENT
23.7 HEALGURU INTERNATIONAL
23.7.1 COMPANY SNAPSHOT
23.7.2 PRODUCT PORTFOLIO
23.7.3 RECENT DEVELOPMENT
23.8 VIKAS RICE AND PULSE MILL
23.8.1 COMPANY SNAPSHOT
23.8.2 PRODUCT PORTFOLIO
23.8.3 RECENT DEVELOPMENT
24 QUESTIONNAIRE
25 RELATED REPORTS
Lista de Tabela
TABELA 1 CAPACIDADE DE PRODUÇÃO DOS PRINCIPAIS FABRICANTES
TABELA 2 CENÁRIO DE IMPORTAÇÃO, POR PAÍS (USD MIL)
TABELA 3 CENÁRIO DE IMPORTAÇÃO, POR PAÍS (TONELADAS)
TABELA 4 CENÁRIO DE EXPORTAÇÃO, POR PAÍS (USD MIL)
TABELA 5 CENÁRIO DE EXPORTAÇÃO, POR PAÍS (TONELADAS)
TABELA 6 COBERTURA REGULAMENTAR
TABELA 7 MERCADO DE ARROZ DO EQUADOR, POR TIPO, 2018-2032 (MIL USD)
TABELA 8 MERCADO DE ARROZ DO EQUADOR, POR TIPO, 2018-2032 (TONELADAS)
TABELA 9 MERCADO DE ARROZ DO EQUADOR, POR TIPO, 2018-2032 (USD/KG)
TABELA 10 MERCADO DE ARROZ DO EQUADOR, POR COR DO ARROZ, 2018-2032 (MIL USD)
TABELA 11 MERCADO DE ARROZ DO EQUADOR, POR COR DO ARROZ, 2018-2032 (TONELADAS)
TABELA 12 MERCADO DE ARROZ DO EQUADOR, POR COR DO ARROZ, 2018-2032 (USD/KG)
TABELA 13 MERCADO DE ARROZ DO EQUADOR, POR TAMANHO DO GRÃO/TAMANHO DO GRÃO, 2018-2032 (MIL USD)
TABELA 14 MERCADO DE ARROZ DO EQUADOR, POR TAMANHO DO GRÃO/TAMANHO DO GRÃO, 2018-2032 (TONELADAS)
TABELA 15 MERCADO DE ARROZ DO EQUADOR, POR TAMANHO DO GRÃO/TAMANHO DO GRÃO, 2018-2032 (USD/KG)
TABELA 16 MERCADO DE ARROZ DO EQUADOR, POR NATUREZA, 2018-2032 (MIL USD)
TABELA 17 MERCADO DE ARROZ DO EQUADOR, POR NATUREZA, 2018-2032 (TONELADAS)
TABELA 18 MERCADO DE ARROZ DO EQUADOR, POR NATUREZA, 2018-2032 (USD/KG)
TABELA 19 MERCADO DE ARROZ DO EQUADOR, POR TEOR DE AMIDO, 2018-2032 (MIL USD)
TABELA 20 MERCADO DE ARROZ DO EQUADOR, POR TEOR DE AMIDO, 2018-2032 (TONELADAS)
TABELA 21 MERCADO DE ARROZ DO EQUADOR, POR TEOR DE AMIDO, 2018-2032 (TONELADAS)
TABELA 22 MERCADO DE ARROZ DO EQUADOR, POR FORMULÁRIO DE PROCESSAMENTO, 2018-2032 (MIL USD)
TABELA 23 MERCADO DE ARROZ DO EQUADOR, POR FORMULÁRIO DE PROCESSAMENTO, 2018-2032 (TONELADAS)
TABELA 24 MERCADO DE ARROZ DO EQUADOR, POR FORMULÁRIO DE PROCESSAMENTO, 2018-2032 (USD/KG)
TABELA 25 MERCADO DE ARROZ DO EQUADOR, POR GRAU DE MOAGEM, 2018-2032 (MIL USD)
TABELA 26 MERCADO DE ARROZ DO EQUADOR, POR GRAU DE MOAGEM, 2018-2032 (TONELADAS)
TABELA 27 MERCADO DE ARROZ DO EQUADOR, POR GRAU DE MOAGEM, 2018-2032 (USD/KG)
TABELA 28 MERCADO DE ARROZ DO EQUADOR, POR POLIMENTO, 2018-2032 (MIL USD)
TABELA 29 MERCADO DE ARROZ DO EQUADOR, POR POLIMENTO, 2018-2032 (TONELADAS)
TABELA 30 MERCADO DE ARROZ DO EQUADOR, POR POLIMENTO, 2018-2032 (USD/KG)
TABELA 31 MERCADO DE ARROZ DO EQUADOR, POR FORTIFICAÇÃO, 2018-2032 (MIL USD)
TABELA 32 MERCADO DE ARROZ DO EQUADOR, POR FORTIFICAÇÃO, 2018-2032 (TONELADAS)
TABELA 33 MERCADO DE ARROZ DO EQUADOR, POR FORTIFICAÇÃO, 2018-2032 (USD/KG)
TABELA 34 EQUADOR FORTIFICADO NO MERCADO DE ARROZ, POR PROCESSO, 2018-2032 (MIL USD)
TABELA 35 MERCADO DE ARROZ DO EQUADOR, POR AROMA, 2018-2032 (MIL USD)
TABELA 36 MERCADO DE ARROZ DO EQUADOR, POR AROMA, 2018-2032 (TONELADAS)
TABELA 37 MERCADO DE ARROZ DO EQUADOR, POR AROMA, 2018-2032 (USD/KG)
TABELA 38 ARROZ AROMÁTICO DO EQUADOR NO MERCADO DE ARROZ, POR TIPO, 2018-2032 (MIL USD)
TABELA 39 MERCADO DE ARROZ DO EQUADOR, POR DERIVADOS DE ARROZ, 2018-2032 (MIL USD)
TABELA 40 MERCADO DE ARROZ DO EQUADOR, POR DERIVADOS DE ARROZ, 2018-2032 (TONELADAS)
TABELA 41 MERCADO DE ARROZ DO EQUADOR, POR DERIVADOS DE ARROZ, 2018-2032 (USD/KG)
TABELA 42 MERCADO DE ARROZ DO EQUADOR, POR USUÁRIO FINAL, 2018-2032 (MIL USD)
TABELA 43 MERCADO DE ARROZ DO EQUADOR, POR USUÁRIO FINAL, 2018-2032 (TONELADAS)
TABELA 44 MERCADO DE ARROZ DO EQUADOR, POR USUÁRIO FINAL, 2018-2032 (USD/KG)
TABELA 45 ALIMENTOS E BEBIDAS NO MERCADO DE ARROZ DO EQUADOR, POR TIPO, 2018-2032 (MIL USD)
TABELA 46 MERCADO DE ALIMENTOS NO ARROZ DO EQUADOR, POR TIPO, 2018-2032 (MIL USD)
TABELA 47 PADARIA DO EQUADOR NO MERCADO DE ARROZ, POR TIPO, 2018-2032 (MIL USD)
TABELA 48 ALIMENTOS PROCESSADOS NO MERCADO DE ARROZ DO EQUADOR, POR TIPO, 2018-2032 (MIL USD)
TABELA 49 DOCES DO EQUADOR NO MERCADO DE ARROZ, POR TIPO, 2018-2032 (MIL USD)
TABELA 50 FÓRMULA INFANTIL NO MERCADO DE ARROZ DO EQUADOR, POR TIPO, 2018-2032 (MIL USD)
TABELA 51 PRODUTOS LÁCTEOS DO EQUADOR NO MERCADO DE ARROZ, POR TIPO, 2018-2032 (MIL USD)
TABELA 52 BEBIDAS DO EQUADOR NO MERCADO DE ARROZ, POR TIPO, 2018-2032 (MIL USD)
TABELA 53 BEBIDAS SAUDÁVEIS NO MERCADO DE ARROZ DO EQUADOR, POR TIPO, 2018-2032 (MIL USD)
TABELA 54 RAÇÃO NO MERCADO DE ARROZ DO EQUADOR, POR CATEGORIA, 2018-2032 (MIL USD)
TABELA 55 AVES DO EQUADOR NO MERCADO DE ARROZ, POR TIPO, 2018-2032 (MIL USD)
TABELA 56 RUMINANTES DO EQUADOR NO MERCADO DE ARROZ, POR TIPO, 2018-2032 (MIL USD)
TABELA 57 SUÍNOS DO EQUADOR NO MERCADO DE ARROZ, POR TIPO, 2018-2032 (MIL USD)
TABELA 58 PET DO EQUADOR NO MERCADO DE ARROZ, POR TIPO, 2018-2032 (MIL USD)
TABELA 59 ANIMAIS AQUÁTICOS NO MERCADO DE ARROZ DO EQUADOR, POR TIPO, 2018-2032 (MIL USD)
TABELA 60 CRUSTÁCEOS DO EQUADOR NO MERCADO DE ARROZ, POR TIPO, 2018-2032 (MIL USD)
TABELA 61 MERCADO DE PEIXES NO ARROZ DO EQUADOR, POR TIPO, 2018-2032 (MIL USD)
TABELA 62 MOLUSCOS DO EQUADOR NO MERCADO DE ARROZ, POR TIPO, 2018-2032 (MIL USD)
TABELA 63 ALIMENTOS NO MERCADO DE ARROZ DO EQUADOR, POR FUNÇÃO DE SAÚDE, 2018-2032 (MIL USD)
TABELA 64 PRODUTOS FARMACÊUTICOS DO EQUADOR NO MERCADO DE ARROZ, POR APLICAÇÃO, 2018-2032 (MIL USD)
TABELA 65 INFECÇÕES UROGENITAIS NO MERCADO DE ARROZ DO EQUADOR, POR TIPO, 2018-2032 (MIL USD)
TABELA 66 PRODUTOS FARMACÊUTICOS NO MERCADO DE ARROZ DO EQUADOR, POR FORMA DE PRODUTO, 2018-2032 (MIL USD)
TABELA 67 COSMÉTICOS E CUIDADOS PESSOAIS DO EQUADOR NO MERCADO DE ARROZ, POR CATEGORIA, 2018-2032 (MIL USD)
TABELA 68 PRODUTOS DE CUIDADOS FACIAIS DO EQUADOR NO MERCADO DE ARROZ, POR TIPO, 2018-2032 (MIL USD)
TABELA 69 PRODUTOS PARA CUIDADOS COM OS CABELOS NO MERCADO DE ARROZ DO EQUADOR, POR TIPO, 2018-2032 (MIL USD)
TABELA 70 SUPLEMENTOS ALIMENTARES NO MERCADO DE ARROZ DO EQUADOR, POR TIPO, 2018-2032 (MIL USD)
TABELA 71 SUPLEMENTOS ALIMENTARES NO MERCADO DE ARROZ DO EQUADOR, POR FORMA DE PRODUTO, 2018-2032 (MIL USD)
TABELA 72 MERCADO DE ARROZ DO EQUADOR, POR CANAL DE DISTRIBUIÇÃO, 2018-2032 (MIL USD)
TABELA 73 MERCADO DE ARROZ DO EQUADOR, POR CANAL DE DISTRIBUIÇÃO, 2018-2032 (TONELADAS)
TABELA 74 MERCADO DE ARROZ DO EQUADOR, POR CANAL DE DISTRIBUIÇÃO, 2018-2032 (USD/KG)
TABELA 75 EQUADOR OFFLINE NO MERCADO DE ARROZ, POR TIPO, 2018-2032 (USD MIL)
TABELA 76 VENDAS NO VAREJO DO EQUADOR NO MERCADO DE ARROZ, POR TIPO DE CANAL, 2018-2032 (MIL USD)
TABELA 77 EQUADOR ONLINE NO MERCADO DE ARROZ, POR TIPO, 2018-2032 (USD MIL)
TABELA 78 MERCADO DE ARROZ DO EQUADOR, POR TERRITÓRIO, 2018-2032 (MIL USD)
TABELA 79 MERCADO DE ARROZ DO EQUADOR, POR TERRITÓRIO, 2018-2032 (TONELADAS)
TABELA 80 MERCADO DE ARROZ GUAYAS, POR TIPO, 2018-2032 (MIL USD)
TABELA 81 MERCADO DE ARROZ GUAYAS, POR TIPO, 2018-2032 (TONELADAS)
TABELA 82 MERCADO DE ARROZ GUAYAS, POR TIPO, 2018-2032 (USD/KG)
TABELA 83 MERCADO DE ARROZ GUAYAS, POR COR DE ARROZ, 2018-2032 (MIL USD)
TABELA 84 MERCADO DE ARROZ GUAYAS, POR COR DE ARROZ, 2018-2032 (TONELADAS)
TABELA 85 MERCADO DE ARROZ GUAYAS, POR COR DE ARROZ, 2018-2032 (USD/KG)
TABELA 86 MERCADO DE ARROZ GUAYAS, POR TAMANHO DO GRÃO/TAMANHO DO GRÃO, 2018-2032 (MIL USD)
TABELA 87 MERCADO DE ARROZ GUAYAS, POR TAMANHO DO GRÃO/TAMANHO DO GRÃO, 2018-2032 (TONELADAS)
TABELA 88 MERCADO DE ARROZ GUAYAS, POR TAMANHO DO GRÃO/TAMANHO DO GRÃO, 2018-2032 (USD/KG)
TABELA 89 MERCADO DE ARROZ GUAYAS, POR NATUREZA, 2018-2032 (MIL USD)
TABELA 90 MERCADO DE ARROZ GUAYAS, POR NATUREZA, 2018-2032 (TONELADAS)
TABELA 91 MERCADO DE ARROZ GUAYAS, POR NATUREZA, 2018-2032 (USD/KG)
TABELA 92 MERCADO DE ARROZ GUAYAS, POR TEOR DE AMIDO, 2018-2032 (MIL USD)
TABELA 93 MERCADO DE ARROZ GUAYAS, POR TEOR DE AMIDO, 2018-2032 (TONELADAS)
TABELA 94 MERCADO DE ARROZ GUAYAS, POR TEOR DE AMIDO, 2018-2032 (USD/KG)
TABELA 95 MERCADO DE ARROZ GUAYAS, POR FORMULÁRIO DE PROCESSAMENTO, 2018-2032 (MIL USD)
TABELA 96 MERCADO DE ARROZ GUAYAS, POR FORMULÁRIO DE PROCESSAMENTO, 2018-2032 (TONELADAS)
TABELA 97 MERCADO DE ARROZ GUAYAS, POR FORMULÁRIO DE PROCESSAMENTO, 2018-2032 (USD/KG)
TABELA 98 MERCADO DE ARROZ GUAYAS, POR GRAU DE MOAGEM, 2018-2032 (MIL USD)
TABELA 99 MERCADO DE ARROZ GUAYAS, POR GRAU DE MOAGEM, 2018-2032 (TONELADAS)
TABELA 100 MERCADO DE ARROZ GUAYAS, POR GRAU DE MOAGEM, 2018-2032 (USD/KG)
TABELA 101 MERCADO DE ARROZ GUAYAS, POR POLIMENTO, 2018-2032 (MIL USD)
TABELA 102 MERCADO DE ARROZ GUAYAS, POR POLIMENTO, 2018-2032 (TONELADAS)
TABELA 103 MERCADO DE ARROZ GUAYAS, POR POLIMENTO, 2018-2032 (USD/KG)
TABELA 104 MERCADO DE ARROZ GUAYAS, POR FORTIFICAÇÃO, 2018-2032 (MIL USD)
TABELA 105 MERCADO DE ARROZ GUAYAS, POR FORTIFICAÇÃO, 2018-2032 (TONELADAS)
TABELA 106 MERCADO DE ARROZ GUAYAS, POR FORTIFICAÇÃO, 2018-2032 (USD/KG)
TABELA 107 GUAYAS FORTIFICADOS NO MERCADO DE ARROZ, POR PROCESSO, 2018-2032 (USD MIL)
TABELA 108 MERCADO DE ARROZ GUAYAS, POR AROMA, 2018-2032 (USD MIL)
TABELA 109 MERCADO DE ARROZ GUAYAS, POR AROMA, 2018-2032 (TONELADAS)
TABELA 110 MERCADO DE ARROZ GUAYAS, POR AROMA, 2018-2032 (USD/KG)
TABELA 111 ARROZ AROMÁTICO GUAYAS NO MERCADO DE ARROZ, POR TIPO, 2018-2032 (USD MIL)
TABELA 112 MERCADO DE ARROZ GUAYAS, POR DERIVADOS DE ARROZ, 2018-2032 (USD MIL)
TABELA 113 MERCADO DE ARROZ GUAYAS, POR DERIVADOS DE ARROZ, 2018-2032 (TONELADAS)
TABELA 114 MERCADO DE ARROZ GUAYAS, POR DERIVADOS DE ARROZ, 2018-2032 (USD/KG)
TABELA 115 MERCADO DE ARROZ GUAYAS, POR USUÁRIO FINAL, 2018-2032 (MIL USD)
TABELA 116 MERCADO DE ARROZ GUAYAS, POR USUÁRIO FINAL, 2018-2032 (TONELADAS)
TABELA 117 MERCADO DE ARROZ GUAYAS, POR USUÁRIO FINAL, 2018-2032 (USD/KG)
TABELA 118 ALIMENTOS E BEBIDAS DE GUAYAS NO MERCADO DE ARROZ, POR TIPO, 2018-2032 (USD MIL)
TABELA 119 ALIMENTOS GUAYAS NO MERCADO DE ARROZ, POR TIPO, 2018-2032 (USD MIL)
TABELA 120 PADARIA GUAYAS NO MERCADO DE ARROZ, POR TIPO, 2018-2032 (USD MIL)
TABELA 121 ALIMENTOS PROCESSADOS DE GUAYAS NO MERCADO DE ARROZ, POR TIPO, 2018-2032 (MIL USD).
TABELA 122 DOCES DE GUAYAS NO MERCADO DE ARROZ, POR TIPO, 2018-2032 (USD MIL)
TABELA 123 FÓRMULA INFANTIL GUAYAS NO MERCADO DE ARROZ, POR TIPO, 2018-2032 (MIL USD)
TABELA 124 PRODUTOS LÁCTEOS DO GUAYAS NO MERCADO DE ARROZ, POR TIPO, 2018-2032 (USD MIL)
TABELA 125 BEBIDAS DE GUAYAS NO MERCADO DE ARROZ, POR TIPO, 2018-2032 (USD MIL)
TABELA 126 BEBIDAS SAUDÁVEIS DE GUAYAS NO MERCADO DE ARROZ, POR TIPO, 2018-2032 (USD MIL)
TABELA 127 ALIMENTAÇÃO DE GUAYAS NO MERCADO DE ARROZ, POR CATEGORIA, 2018-2032 (MIL USD)
TABELA 128 AVES DE GUAYAS NO MERCADO DE ARROZ, POR TIPO, 2018-2032 (USD MIL)
TABELA 129 RUMINANTES DO GUAYAS NO MERCADO DE ARROZ, POR TIPO, 2018-2032 (USD MIL)
TABELA 130 SUÍNOS GUAYAS NO MERCADO DE ARROZ, POR TIPO, 2018-2032 (USD MIL)
TABELA 131 GUAYAS PET NO MERCADO DE ARROZ, POR TIPO, 2018-2032 (USD MIL)
TABELA 132 ANIMAIS AQUÁTICOS GUAYAS NO MERCADO DE ARROZ, POR TIPO, 2018-2032 (USD MIL)
TABELA 133 CRUSTÁCEOS DE GUAYAS NO MERCADO DE ARROZ, POR TIPO, 2018-2032 (MIL USD)
TABELA 134 PEIXE GUAYAS NO MERCADO DE ARROZ, POR TIPO, 2018-2032 (USD MIL)
TABELA 135 MOLUSCOS DE GUAYAS NO MERCADO DE ARROZ, POR TIPO, 2018-2032 (USD MIL)
TABELA 136 ALIMENTAÇÃO DE GUAYAS NO MERCADO DE ARROZ, POR FUNÇÃO DE SAÚDE, 2018-2032 (MIL USD).
TABELA 137 PRODUTOS FARMACÊUTICOS DE GUAYAS NO MERCADO DE ARROZ, POR APLICAÇÃO, 2018-2032 (MIL USD)
TABELA 138 INFECÇÕES UROGENITAIS POR GUAYAS NO MERCADO DE ARROZ, POR TIPO, 2018-2032 (MIL USD)
TABELA 139 PRODUTOS FARMACÊUTICOS DE GUAYAS NO MERCADO DE ARROZ, POR FORMA DE PRODUTO, 2018-2032 (MIL USD)
TABELA 140 COSMÉTICOS E CUIDADOS PESSOAIS DE GUAYAS NO MERCADO DE ARROZ, POR CATEGORIA, 2018-2032 (USD MIL)
TABELA 141 PRODUTOS DE CUIDADOS FACIAIS DE GUAYAS NO MERCADO DE ARROZ, POR TIPO, 2018-2032 (MIL USD)
TABELA 142 PRODUTOS PARA CUIDADOS COM OS CABELOS GUAYAS NO MERCADO DE ARROZ, POR TIPO, 2018-2032 (MIL USD)
TABELA 143 SUPLEMENTOS ALIMENTARES DE GUAYAS NO MERCADO DE ARROZ, POR TIPO, 2018-2032 (MIL USD)
TABELA 144 SUPLEMENTOS ALIMENTARES DE GUAYAS NO MERCADO DE ARROZ, POR FORMA DE PRODUTO, 2018-2032 (MIL USD)
TABELA 145 MERCADO DE ARROZ GUAYAS, POR CANAL DE DISTRIBUIÇÃO, 2018-2032 (MIL USD)
TABELA 146 MERCADO DE ARROZ GUAYAS, POR CANAL DE DISTRIBUIÇÃO, 2018-2032 (TONELADAS)
TABELA 147 MERCADO DE ARROZ GUAYAS, POR CANAL DE DISTRIBUIÇÃO, 2018-2032 (USD/KG)
TABELA 148 GUAYAS OFFLINE NO MERCADO DE ARROZ, POR TIPO, 2018-2032 (USD MIL)
TABELA 149 VENDAS NO VAREJO DE GUAYAS NO MERCADO DE ARROZ, POR TIPO DE CANAL, 2018-2032 (MIL USD)
TABELA 150 GUAYAS ONLINE NO MERCADO DE ARROZ, POR TIPO, 2018-2032 (USD MIL)
TABELA 151 MERCADO DE ARROZ DE LOS RÍOS, POR TIPO, 2018-2032 (MIL USD)
TABELA 152 MERCADO DE ARROZ DE LOS RÍOS, POR TIPO, 2018-2032 (TONELADAS)
TABELA 153 MERCADO DE ARROZ DE LOS RÍOS, POR TIPO, 2018-2032 (USD/KG)
TABELA 154 MERCADO DE ARROZ DE LOS RÍOS, POR COR DE ARROZ, 2018-2032 (MIL USD)
TABELA 155 MERCADO DE ARROZ DE LOS RÍOS, POR COR DE ARROZ, 2018-2032 (TONELADAS)
TABELA 156 MERCADO DE ARROZ DE LOS RÍOS, POR COR DE ARROZ, 2018-2032 (USD/KG)
TABELA 157 MERCADO DE ARROZ DE LOS RÍOS, POR TAMANHO DO GRÃO/TAMANHO DO GRÃO, 2018-2032 (MIL USD)
TABELA 158 MERCADO DE ARROZ DE LOS RÍOS, POR TAMANHO DO GRÃO/TAMANHO DO GRÃO, 2018-2032 (TONELADAS)
TABELA 159 MERCADO DE ARROZ DE LOS RÍOS, POR TAMANHO DO GRÃO/TAMANHO DO GRÃO, 2018-2032 (USD/KG)
TABELA 160 MERCADO DE ARROZ DE LOS RÍOS, POR NATUREZA, 2018-2032 (MIL USD)
TABELA 161 MERCADO DE ARROZ DE LOS RÍOS, POR NATUREZA, 2018-2032 (TONELADAS)
TABELA 162 MERCADO DE ARROZ DE LOS RÍOS, POR NATUREZA, 2018-2032 (USD/KG)
TABELA 163 MERCADO DE ARROZ DE LOS RÍOS, POR TEOR DE AMIDO, 2018-2032 (MIL USD)
TABELA 164 MERCADO DE ARROZ DE LOS RÍOS, POR TEOR DE AMIDO, 2018-2032 (TONELADAS)
TABELA 165 MERCADO DE ARROZ DE LOS RÍOS, POR TEOR DE AMIDO, 2018-2032 (USD/KG)
TABELA 166 MERCADO DE ARROZ DE LOS RÍOS, POR FORMULÁRIO DE PROCESSAMENTO, 2018-2032 (MIL USD)
TABELA 167 MERCADO DE ARROZ DE LOS RÍOS, POR FORMULÁRIO DE PROCESSAMENTO, 2018-2032 (TONELADAS)
TABELA 168 MERCADO DE ARROZ DE LOS RÍOS, POR FORMULÁRIO DE PROCESSAMENTO, 2018-2032 (USD/KG)
TABELA 169 MERCADO DE ARROZ DE LOS RÍOS, POR GRAU DE MOAGEM, 2018-2032 (MIL USD)
TABELA 170 MERCADO DE ARROZ DE LOS RÍOS, POR GRAU DE MOAGEM, 2018-2032 (TONELADAS)
TABELA 171 MERCADO DE ARROZ DE LOS RÍOS, POR GRAU DE MOAGEM, 2018-2032 (USD/KG)
TABELA 172 MERCADO DE ARROZ DE LOS RÍOS, POR POLIMENTO, 2018-2032 (MIL USD)
TABELA 173 MERCADO DE ARROZ DE LOS RÍOS, POR POLIMENTO, 2018-2032 (TONELADAS)
TABELA 174 MERCADO DE ARROZ DE LOS RÍOS, POR POLIMENTO, 2018-2032 (USD/KG)
TABELA 175 MERCADO DE ARROZ DE LOS RÍOS, POR FORTIFICAÇÃO, 2018-2032 (MIL USD)
TABELA 176 MERCADO DE ARROZ DE LOS RÍOS, POR FORTIFICAÇÃO, 2018-2032 (TONELADAS)
TABELA 177 MERCADO DE ARROZ DE LOS RÍOS, POR FORTIFICAÇÃO, 2018-2032 (USD/KG)
TABELA 178 LOS RÍOS FORTIFICADOS NO MERCADO DE ARROZ, POR PROCESSO, 2018-2032 (MIL USD)
TABELA 179 MERCADO DE ARROZ DE LOS RÍOS, POR AROMA, 2018-2032 (USD MIL)
TABELA 180 MERCADO DE ARROZ DE LOS RÍOS, DA AROMA, 2018-2032 (TONELADAS)
TABELA 181 MERCADO DE ARROZ DE LOS RÍOS, POR AROMA, 2018-2032 (USD/KG)
TABELA 182 ARROZ AROMÁTICO LOS RÍOS NO MERCADO DE ARROZ, POR TIPO, 2018-2032 (MIL USD)
TABELA 183 MERCADO DE ARROZ DE LOS RÍOS, POR DERIVADOS DE ARROZ, 2018-2032 (MIL USD)
TABELA 184 MERCADO DE ARROZ DE LOS RÍOS, POR DERIVADOS DE ARROZ, 2018-2032 (TONELADAS)
TABELA 185 MERCADO DE ARROZ DE LOS RÍOS, POR DERIVADOS DE ARROZ, 2018-2032 (USD/KG)
TABELA 186 MERCADO DE ARROZ DE LOS RÍOS, POR USUÁRIO FINAL, 2018-2032 (MIL USD)
TABELA 187 MERCADO DE ARROZ DE LOS RÍOS, POR USUÁRIO FINAL, 2018-2032 (TONELADAS)
TABELA 188 MERCADO DE ARROZ DE LOS RÍOS, POR USUÁRIO FINAL, 2018-2032 (USD/KG)
TABELA 189 ALIMENTOS E BEBIDAS NO MERCADO DE ARROZ DE LOS RÍOS, POR TIPO, 2018-2032 (MIL USD)
TABELA 190 ALIMENTOS DE LOS RÍOS NO MERCADO DE ARROZ, POR TIPO, 2018-2032 (MIL USD)
TABELA 191 PADARIA LOS RÍOS NO MERCADO DE ARROZ, POR TIPO, 2018-2032 (MIL USD)
TABELA 192 ALIMENTOS PROCESSADOS NO MERCADO DE ARROZ DE LOS RÍOS, POR TIPO, 2018-2032 (MIL USD)
TABELA 193 CONFEITARIA DE LOS RÍOS NO MERCADO DE ARROZ, POR TIPO, 2018-2032 (MIL USD)
TABELA 194 FÓRMULA INFANTIL LOS RÍOS NO MERCADO DE ARROZ, POR TIPO, 2018-2032 (MIL USD)
TABELA 195 PRODUTOS LÁCTEOS DE LOS RÍOS NO MERCADO DE ARROZ, POR TIPO, 2018-2032 (MIL USD)
TABELA 196 BEBIDAS DE LOS RÍOS NO MERCADO DE ARROZ, POR TIPO, 2018-2032 (USD MIL)
TABELA 197 BEBIDAS SAUDÁVEIS DE LOS RÍOS NO MERCADO DE ARROZ, POR TIPO, 2018-2032 (MIL USD)
TABELA 198 ALIMENTAÇÃO DE LOS RÍOS NO MERCADO DE ARROZ, POR CATEGORIA, 2018-2032 (MIL USD)
TABELA 199 AVES DE LOS RÍOS NO MERCADO DE ARROZ, POR TIPO, 2018-2032 (MIL USD)
TABELA 200 RUMINANTES DE LOS RÍOS NO MERCADO DE ARROZ, POR TIPO, 2018-2032 (MIL USD)
TABELA 201 SUÍNOS DE LOS RÍOS NO MERCADO DE ARROZ, POR TIPO, 2018-2032 (MIL USD)
TABELA 202 LOS RÍOS PET NO MERCADO DE ARROZ, POR TIPO, 2018-2032 (USD MIL)
TABELA 203 ANIMAIS AQUÁTICOS NO MERCADO DE ARROZ DE LOS RÍOS, POR TIPO, 2018-2032 (MIL USD)
TABELA 204 CRUSTÁCEOS DE LOS RÍOS NO MERCADO DE ARROZ, POR TIPO, 2018-2032 (MIL USD)
TABELA 205 PEIXE DE LOS RÍOS NO MERCADO DE ARROZ, POR TIPO, 2018-2032 (MIL USD)
TABELA 206 MOLUSCOS DE LOS RÍOS NO MERCADO DE ARROZ, POR TIPO, 2018-2032 (MIL USD)
TABELA 207 ALIMENTOS DE LOS RÍOS NO MERCADO DE ARROZ, POR FUNÇÃO DE SAÚDE, 2018-2032 (MIL USD)
TABELA 208 PRODUTOS FARMACÊUTICOS DE LOS RÍOS NO MERCADO DE ARROZ, POR APLICAÇÃO, 2018-2032 (MIL USD)
TABELA 209 INFECÇÕES UROGENITAIS NO MERCADO DE ARROZ DE LOS RÍOS, POR TIPO, 2018-2032 (MIL USD)
TABELA 210 PRODUTOS FARMACÊUTICOS DE LOS RÍOS NO MERCADO DE ARROZ, POR FORMULÁRIO DE PRODUTO, 2018-2032 (MIL USD)
TABELA 211 LOS RÍOS COSMÉTICOS E CUIDADOS PESSOAIS NO MERCADO DE ARROZ, POR CATEGORIA, 2018-2032 (MIL USD)
TABELA 212 PRODUTOS DE CUIDADOS FACIAIS DE LOS RÍOS NO MERCADO DE ARROZ, POR TIPO, 2018-2032 (MIL USD)
TABELA 213 PRODUTOS PARA CUIDADOS COM OS CABELOS DE LOS RÍOS NO MERCADO DE ARROZ, POR TIPO, 2018-2032 (MIL USD)
TABELA 214 SUPLEMENTOS ALIMENTARES NO MERCADO DE ARROZ DE LOS RÍOS, POR TIPO, 2018-2032 (MIL USD)
TABELA 215 SUPLEMENTOS ALIMENTARES NO MERCADO DE ARROZ DE LOS RÍOS, POR FORMA DE PRODUTO, 2018-2032 (MIL USD)
TABELA 216 MERCADO DE ARROZ DE LOS RÍOS, POR CANAL DE DISTRIBUIÇÃO, 2018-2032 (MIL USD)
TABELA 217 MERCADO DE ARROZ DE LOS RÍOS, POR CANAL DE DISTRIBUIÇÃO, 2018-2032 (TONELADAS)
TABELA 218 MERCADO DE ARROZ DE LOS RÍOS, POR CANAL DE DISTRIBUIÇÃO, 2018-2032 (USD/KG)
TABELA 219 LOS RÍOS OFFLINE NO MERCADO DE ARROZ, POR TIPO, 2018-2032 (USD MIL)
TABELA 220 VENDAS NO VAREJO DE LOS RÍOS NO MERCADO DE ARROZ, POR TIPO DE CANAL, 2018-2032 (MIL USD)
TABELA 221 LOS RÍOS ONLINE NO MERCADO DE ARROZ, POR TIPO, 2018-2032 (USD MIL)
TABELA 222 MERCADO DE ARROZ DE MANABÍ, POR TIPO, 2018-2032 (MIL USD)
TABELA 223 MERCADO DE ARROZ DE MANABÍ, POR TIPO, 2018-2032 (TONELADAS)
TABELA 224 MERCADO DE ARROZ MANABÍ, POR TIPO, 2018-2032 (USD/KG)
TABELA 225 MERCADO DE ARROZ DE MANABÍ, POR COR DE ARROZ, 2018-2032 (USD MIL)
TABELA 226 MERCADO DE ARROZ DE MANABÍ, POR COR DE ARROZ, 2018-2032 (TONELADAS)
TABELA 227 MERCADO DE ARROZ MANABÍ, POR COR DE ARROZ, 2018-2032 (USD/KG)
TABELA 228 MERCADO DE ARROZ MANABÍ, POR TAMANHO DO GRÃO/TAMANHO DO GRÃO, 2018-2032 (MIL USD)
TABELA 229 MERCADO DE ARROZ DE MANABÍ, POR TAMANHO DO GRÃO/TAMANHO DO GRÃO, 2018-2032 (TONELADAS)
TABELA 230 MERCADO DE ARROZ MANABÍ, POR TAMANHO DO GRÃO/TAMANHO DO GRÃO, 2018-2032 (USD/KG)
TABELA 231 MERCADO DE ARROZ DE MANABÍ, POR NATUREZA, 2018-2032 (MIL USD)
TABELA 232 MERCADO DE ARROZ DE MANABÍ, POR NATUREZA, 2018-2032 (TONELADAS)
TABELA 233 MERCADO DE ARROZ MANABÍ, POR NATUREZA, 2018-2032 (USD/KG)
TABELA 234 MERCADO DE ARROZ MANABÍ, POR TEOR DE AMIDO, 2018-2032 (MIL USD)
TABELA 235 MERCADO DE ARROZ DE MANABÍ, POR TEOR DE AMIDO, 2018-2032 (TONELADAS)
TABELA 236 MERCADO DE ARROZ MANABÍ, POR TEOR DE AMIDO, 2018-2032 (USD/KG)
TABELA 237 MERCADO DE ARROZ MANABÍ, POR FORMULÁRIO DE PROCESSAMENTO, 2018-2032 (MIL USD)
TABELA 238 MERCADO DE ARROZ DE MANABÍ, POR FORMULÁRIO DE PROCESSAMENTO, 2018-2032 (TONELADAS)
TABELA 239 MERCADO DE ARROZ MANABÍ, POR FORMULÁRIO DE PROCESSAMENTO, 2018-2032 (USD/KG)
TABELA 240 MERCADO DE ARROZ MANABÍ, POR GRAU DE MOAGEM, 2018-2032 (MIL USD)
TABELA 241 MERCADO DE ARROZ DE MANABÍ, POR GRAU DE MOAGEM, 2018-2032 (TONELADAS)
TABELA 242 MERCADO DE ARROZ MANABÍ, POR GRAU DE MOAGEM, 2018-2032 (USD/KG)
TABELA 243 MERCADO DE ARROZ MANABÍ, POR POLIMENTO, 2018-2032 (MIL USD)
TABELA 244 MERCADO DE ARROZ DE MANABÍ, POR POLIMENTO, 2018-2032 (TONELADAS)
TABELA 245 MERCADO DE ARROZ DE MANABÍ, POR POLIMENTO, 2018-2032 (USD/KG)
TABELA 246 MERCADO DE ARROZ DE MANABÍ, POR FORTIFICAÇÃO, 2018-2032 (MIL USD)
TABELA 247 MERCADO DE ARROZ DE MANABÍ, POR FORTIFICAÇÃO, 2018-2032 (TONELADAS)
TABELA 248 MERCADO DE ARROZ DE MANABÍ, POR FORTIFICAÇÃO, 2018-2032 (USD/KG)
TABELA 249 MANABÍ FORTIFICADO NO MERCADO DE ARROZ, POR PROCESSO, 2018-2032 (USD MIL)
TABELA 250 MERCADO DE ARROZ MANABÍ, POR AROMA, 2018-2032 (USD MIL)
TABELA 251 MERCADO DE ARROZ DE MANABÍ, POR AROMA, 2018-2032 (TONELADAS)
TABELA 252 MERCADO DE ARROZ MANABÍ, POR AROMA, 2018-2032 (USD/KG)
TABELA 253 ARROZ AROMÁTICO MANABÍ NO MERCADO DE ARROZ, POR TIPO, 2018-2032 (USD MIL)
TABELA 254 MERCADO DE ARROZ MANABÍ, POR DERIVADOS DE ARROZ, 2018-2032 (USD MIL)
TABELA 255 MERCADO DE ARROZ DE MANABÍ, POR DERIVADOS DE ARROZ, 2018-2032 (TONELADAS)
TABELA 256 MERCADO DE ARROZ MANABÍ, POR DERIVADOS DE ARROZ, 2018-2032 (USD/KG)
TABELA 257 MERCADO DE ARROZ MANABÍ, POR USUÁRIO FINAL, 2018-2032 (MIL USD)
TABELA 258 MERCADO DE ARROZ DE MANABÍ, POR USUÁRIO FINAL, 2018-2032 (TONELADAS)
TABELA 259 MERCADO DE ARROZ MANABÍ, POR USUÁRIO FINAL, 2018-2032 (USD/KG)
TABELA 260 ALIMENTOS E BEBIDAS MANABÍ NO MERCADO DE ARROZ, POR TIPO, 2018-2032 (USD MIL)
TABELA 261 ALIMENTOS MANABÍ NO MERCADO DE ARROZ, POR TIPO, 2018-2032 (USD MIL)
TABELA 262 PADARIA MANABÍ NO MERCADO DE ARROZ, POR TIPO, 2018-2032 (USD MIL)
TABELA 263 ALIMENTOS PROCESSADOS MANABÍ NO MERCADO DE ARROZ, POR TIPO, 2018-2032 (USD MIL)
TABELA 264 CONFEITARIA MANABÍ NO MERCADO DE ARROZ, POR TIPO, 2018-2032 (USD MIL)
TABELA 265 FÓRMULA INFANTIL MANABÍ NO MERCADO DE ARROZ, POR TIPO, 2018-2032 (MIL USD)
TABELA 266 PRODUTOS LÁCTEOS MANABÍ NO MERCADO DE ARROZ, POR TIPO, 2018-2032 (USD MIL)
TABELA 267 BEBIDAS MANABÍ NO MERCADO DE ARROZ, POR TIPO, 2018-2032 (USD MIL)
TABELA 268 BEBIDAS SAUDÁVEIS MANABÍ NO MERCADO DE ARROZ, POR TIPO, 2018-2032 (USD MIL)
TABELA 269 ALIMENTAÇÃO MANABÍ NO MERCADO DE ARROZ, POR CATEGORIA, 2018-2032 (USD MIL)
TABELA 270 AVES MANABÍ NO MERCADO DE ARROZ, POR TIPO, 2018-2032 (USD MIL)
TABELA 271 RUMINANTES MANABÍ NO MERCADO DE ARROZ, POR TIPO, 2018-2032 (USD MIL)
TABELA 272 SUÍNOS MANABÍ NO MERCADO DE ARROZ, POR TIPO, 2018-2032 (USD MIL)
TABELA 273 MANABÍ PET NO MERCADO DE ARROZ, POR TIPO, 2018-2032 (USD MIL)
TABELA 274 ANIMAIS AQUÁTICOS MANABÍ NO MERCADO DE ARROZ, POR TIPO, 2018-2032 (USD MIL)
TABELA 275 CRUSTÁCEOS MANABÍ NO MERCADO DE ARROZ, POR TIPO, 2018-2032 (USD MIL)
TABELA 276 PEIXE MANABÍ NO MERCADO DE ARROZ, POR TIPO, 2018-2032 (USD MIL)
TABELA 277 MOLUSCOS MANABÍ NO MERCADO DE ARROZ, POR TIPO, 2018-2032 (USD MIL)
TABELA 278 ALIMENTOS MANABÍ NO MERCADO DE ARROZ, POR FUNÇÃO DE SAÚDE, 2018-2032 (MIL USD)
TABELA 279 PRODUTOS FARMACÊUTICOS MANABÍ NO MERCADO DE ARROZ, POR APLICAÇÃO, 2018-2032 (USD MIL)
TABELA 280 INFECÇÕES UROGENITAIS MANABÍ NO MERCADO DE ARROZ, POR TIPO, 2018-2032 (USD MIL)
TABELA 281 PRODUTOS FARMACÊUTICOS MANABÍ NO MERCADO DE ARROZ, POR FORMA DE PRODUTO, 2018-2032 (MIL USD)
TABELA 282 MANABÍ COSMÉTICOS E CUIDADOS PESSOAIS NO MERCADO DE ARROZ, POR CATEGORIA, 2018-2032 (USD MIL)
TABELA 283 PRODUTOS DE CUIDADOS FACIAIS MANABÍ NO MERCADO DE ARROZ, POR TIPO, 2018-2032 (MIL USD)
TABELA 284 PRODUTOS PARA CUIDADOS COM OS CABELOS NO MERCADO DE ARROZ, POR TIPO, 2018-2032 (MIL USD)
TABELA 285 SUPLEMENTOS ALIMENTARES MANABÍ NO MERCADO DE ARROZ, POR TIPO, 2018-2032 (MIL USD)
TABELA 286 SUPLEMENTOS ALIMENTARES MANABÍ NO MERCADO DE ARROZ, POR FORMA DE PRODUTO, 2018-2032 (MIL USD)
TABELA 287 MERCADO DE ARROZ DE MANABÍ, POR CANAL DE DISTRIBUIÇÃO, 2018-2032 (MIL USD)
TABELA 288 MERCADO DE ARROZ DE MANABÍ, POR CANAL DE DISTRIBUIÇÃO, 2018-2032 (TONELADAS)
TABELA 289 MERCADO DE ARROZ DE MANABÍ, POR CANAL DE DISTRIBUIÇÃO, 2018-2032 (USD/KG)
TABELA 290 MANABÍ OFFLINE NO MERCADO DE ARROZ, POR TIPO, 2018-2032 (USD MIL)
TABELA 291 VENDAS NO VAREJO DE MANABÍ NO MERCADO DE ARROZ, POR TIPO DE CANAL, 2018-2032 (MIL USD)
TABELA 292 MANABÍ ONLINE NO MERCADO DE ARROZ, POR TIPO, 2018-2032 (USD MIL)
TABELA 293 MERCADO DE ARROZ LOJA, POR TIPO, 2018-2032 (USD MIL)
TABELA 294 MERCADO DE ARROZ LOJA, POR TIPO, 2018-2032 (TONELADAS)
TABELA 295 MERCADO DE ARROZ LOJA, POR TIPO, 2018-2032 (USD/KG)
TABELA 296 LOJA MERCADO DE ARROZ, POR COR DE ARROZ, 2018-2032 (USD MIL)
TABELA 297 LOJA MERCADO DE ARROZ, POR COR DE ARROZ, 2018-2032 (TONELADAS)
TABELA 298 MERCADO DE ARROZ LOJA, POR COR DE ARROZ, 2018-2032 (USD/KG)
TABELA 299 MERCADO DE ARROZ LOJA, POR TAMANHO DO GRÃO/TAMANHO DO GRÃO, 2018-2032 (MIL USD)
TABELA 300 MERCADO DE ARROZ LOJA, POR TAMANHO DO GRÃO/TAMANHO DO GRÃO, 2018-2032 (TONELADAS)
TABELA 301 MERCADO DE ARROZ LOJA, POR TAMANHO DO GRÃO/TAMANHO DO GRÃO, 2018-2032 (USD/KG)
TABELA 302 MERCADO DE ARROZ LOJA, POR NATUREZA, 2018-2032 (USD MIL)
TABELA 303 MERCADO DE ARROZ LOJA, POR NATUREZA, 2018-2032 (TONELADAS)
TABELA 304 MERCADO DE ARROZ LOJA, POR NATUREZA, 2018-2032 (USD/KG)
TABELA 305 MERCADO DE ARROZ LOJA, POR TEOR DE AMIDO, 2018-2032 (MIL USD)
TABELA 306 MERCADO DE ARROZ LOJA, POR TEOR DE AMIDO, 2018-2032 (TONELADAS)
TABELA 307 MERCADO DE ARROZ LOJA, POR TEOR DE AMIDO, 2018-2032 (USD/KG)
TABELA 308 LOJA MERCADO DE ARROZ, POR FORMULÁRIO DE PROCESSAMENTO, 2018-2032 (USD MIL)
TABELA 309 LOJA MERCADO DE ARROZ, POR FORMULÁRIO DE PROCESSAMENTO, 2018-2032 (TONELADAS)
TABELA 310 MERCADO DE ARROZ LOJA, POR FORMULÁRIO DE PROCESSAMENTO, 2018-2032 (USD/KG)
TABELA 311 MERCADO DE ARROZ LOJA, POR GRAU DE MOAGEM, 2018-2032 (USD MIL)
TABELA 312 MERCADO DE ARROZ LOJA, POR GRAU DE MOAGEM, 2018-2032 (TONELADAS)
TABELA 313 MERCADO DE ARROZ LOJA, POR GRAU DE MOAGEM, 2018-2032 (USD/KG)
TABELA 314 MERCADO DE ARROZ LOJA, POR POLIMENTO, 2018-2032 (USD MIL)
TABELA 315 LOJA MERCADO DE ARROZ, POR POLIMENTO, 2018-2032 (TONELADAS)
TABELA 316 MERCADO DE ARROZ LOJA, POR POLIMENTO, 2018-2032 (USD/KG)
TABELA 317 MERCADO DE ARROZ LOJA, POR FORTIFICAÇÃO, 2018-2032 (USD MIL)
TABELA 318 MERCADO DE ARROZ LOJA, POR FORTIFICAÇÃO, 2018-2032 (TONELADAS)
TABELA 319 MERCADO DE ARROZ LOJA, POR FORTIFICAÇÃO, 2018-2032 (USD/KG)
TABELA 320 LOJA FORTIFICADA NO MERCADO DE ARROZ, POR PROCESSO, 2018-2032 (USD MIL)
TABELA 321 MERCADO DE ARROZ LOJA, POR AROMA, 2018-2032 (USD MIL)
TABELA 322 LOJA MERCADO DE ARROZ, POR AROMA, 2018-2032 (TONELADAS)
TABELA 323 MERCADO DE ARROZ LOJA, POR AROMA, 2018-2032 (USD/KG)
TABELA 324 LOJA ARROZ AROMÁTICO NO MERCADO DE ARROZ, POR TIPO, 2018-2032 (USD MIL)
TABELA 325 LOJA MERCADO DE ARROZ, POR DERIVADOS DE ARROZ, 2018-2032 (USD MIL)
TABELA 326 MERCADO DE ARROZ LOJA, POR DERIVADOS DE ARROZ, 2018-2032 (TONELADAS)
TABELA 327 MERCADO DE ARROZ LOJA, POR DERIVADOS DE ARROZ, 2018-2032 (USD/KG)
TABELA 328 MERCADO DE ARROZ LOJA, POR USUÁRIO FINAL, 2018-2032 (USD MIL)
TABELA 329 MERCADO DE ARROZ LOJA, POR USUÁRIO FINAL, 2018-2032 (TONELADAS)
TABELA 330 MERCADO DE ARROZ LOJA, POR USUÁRIO FINAL, 2018-2032 (USD/KG)
TABELA 331 LOJA ALIMENTOS E BEBIDAS NO MERCADO DE ARROZ, POR TIPO, 2018-2032 (USD MIL)
TABELA 332 LOJA DE ALIMENTOS NO MERCADO DE ARROZ, POR TIPO, 2018-2032 (USD MIL)
TABELA 333 LOJA DE PADARIA NO MERCADO DE ARROZ, POR TIPO, 2018-2032 (USD MIL)
TABELA 334 LOJA DE ALIMENTOS PROCESSADOS NO MERCADO DE ARROZ, POR TIPO, 2018-2032 (USD MIL)
TABELA 335 LOJA DE CONFEITARIA NO MERCADO DE ARROZ, POR TIPO, 2018-2032 (USD MIL)
TABELA 336 LOJA FÓRMULA INFANTIL NO MERCADO DE ARROZ, POR TIPO, 2018-2032 (USD MIL)
TABELA 337 LOJA DE PRODUTOS LÁCTEOS NO MERCADO DE ARROZ, POR TIPO, 2018-2032 (USD MIL)
TABELA 338 LOJA BEBIDAS NO MERCADO DE ARROZ, POR TIPO, 2018-2032 (USD MIL)
TABELA 339 LOJA BEBIDAS SAUDÁVEIS NO MERCADO DE ARROZ, POR TIPO, 2018-2032 (USD MIL)
TABELA 340 LOJA FEED NO MERCADO DE ARROZ, POR CATEGORIA, 2018-2032 (USD MIL)
TABELA 341 LOJA AVES NO MERCADO DE ARROZ, POR TIPO, 2018-2032 (USD MIL)
TABELA 342 LOJA RUMINANTES NO MERCADO DE ARROZ, POR TIPO, 2018-2032 (USD MIL)
TABELA 343 LOJA SUÍNA NO MERCADO DE ARROZ, POR TIPO, 2018-2032 (USD MIL)
TABELA 344 LOJA PET NO MERCADO DE ARROZ, POR TIPO, 2018-2032 (USD MIL)
TABELA 345 LOJA DE ANIMAIS AQUÁTICOS NO MERCADO DE ARROZ, POR TIPO, 2018-2032 (USD MIL)
TABELA 346 CRUSTÁCEOS LOJA NO MERCADO DE ARROZ, POR TIPO, 2018-2032 (USD MIL)
TABELA 347 LOJA DE PEIXES NO MERCADO DE ARROZ, POR TIPO, 2018-2032 (USD MIL)
TABELA 348 LOJA MOLUSCOS NO MERCADO DE ARROZ, POR TIPO, 2018-2032 (USD MIL)
TABELA 349 LOJA FEED NO MERCADO DE ARROZ, POR FUNÇÃO DE SAÚDE, 2018-2032 (USD MIL)
TABELA 350 LOJA FARMACÊUTICOS NO MERCADO DE ARROZ, POR APLICAÇÃO, 2018-2032 (USD MIL)
TABELA 351 LOJA INFECÇÕES UROGENITAIS NO MERCADO DE ARROZ, POR TIPO, 2018-2032 (USD MIL)
TABELA 352 LOJA FARMACÊUTICOS NO MERCADO DE ARROZ, POR FORMULÁRIO DE PRODUTO, 2018-2032 (MIL USD)
TABELA 353 LOJA COSMÉTICOS E CUIDADOS PESSOAIS NO MERCADO DE ARROZ, POR CATEGORIA, 2018-2032 (USD MIL)
TABELA 354 PRODUTOS DE CUIDADOS FACIAIS DA LOJA NO MERCADO DE ARROZ, POR TIPO, 2018-2032 (USD MIL)
TABELA 355 PRODUTOS PARA CUIDADOS COM OS CABELOS DA LOJA NO MERCADO DE ARROZ, POR TIPO, 2018-2032 (MIL USD)
TABELA 356 LOJA SUPLEMENTOS ALIMENTARES NO MERCADO DE ARROZ, POR TIPO, 2018-2032 (USD MIL)
TABELA 357 LOJA SUPLEMENTOS ALIMENTARES NO MERCADO DE ARROZ, POR FORMULÁRIO DE PRODUTO, 2018-2032 (MIL USD)
TABELA 358 MERCADO DE ARROZ LOJA, POR CANAL DE DISTRIBUIÇÃO, 2018-2032 (USD MIL)
TABELA 359 MERCADO DE ARROZ DA LOJA, POR CANAL DE DISTRIBUIÇÃO, 2018-2032 (TONELADAS)
TABELA 360 MERCADO DE ARROZ DA LOJA, POR CANAL DE DISTRIBUIÇÃO, 2018-2032 (USD/KG)
TABELA 361 LOJA OFFLINE NO MERCADO DE ARROZ, POR TIPO, 2018-2032 (USD MIL)
TABELA 362 VENDAS NO VAREJO DA LOJA NO MERCADO DE ARROZ, POR TIPO DE CANAL, 2018-2032 (MIL USD)
TABELA 363 LOJA ONLINE NO MERCADO DE ARROZ, POR TIPO, 2018-2032 (USD MIL)
TABELA 364 MERCADO DE ARROZ DE EL ORO, POR TIPO, 2018-2032 (MIL USD)
TABELA 365 MERCADO DE ARROZ DE EL ORO, POR TIPO, 2018-2032 (TONELADAS)
TABELA 366 MERCADO DE ARROZ DE EL ORO, POR TIPO, 2018-2032 (USD/KG)
TABELA 367 MERCADO DE ARROZ DE EL ORO, POR COR DE ARROZ, 2018-2032 (MIL USD)
TABELA 368 MERCADO DE ARROZ EL ORO, POR COR DE ARROZ, 2018-2032 (TONELADAS)
TABELA 369 MERCADO DE ARROZ DE EL ORO, POR COR DE ARROZ, 2018-2032 (USD/KG)
TABELA 370 MERCADO DE ARROZ EL ORO, POR TAMANHO DO GRÃO/TAMANHO DO GRÃO, 2018-2032 (MIL USD)
TABELA 371 MERCADO DE ARROZ DE EL ORO, POR TAMANHO DO GRÃO/TAMANHO DO GRÃO, 2018-2032 (TONELADAS)
TABELA 372 MERCADO DE ARROZ DE EL ORO, POR TAMANHO DO GRÃO/TAMANHO DO GRÃO, 2018-2032 (USD/KG)
TABELA 373 MERCADO DE ARROZ DE EL ORO, POR NATUREZA, 2018-2032 (MIL USD)
TABELA 374 MERCADO DE ARROZ DE EL ORO, POR NATUREZA, 2018-2032 (TONELADAS)
TABELA 375 MERCADO DE ARROZ DE EL ORO, POR NATUREZA, 2018-2032 (USD/KG)
TABELA 376 MERCADO DE ARROZ DE EL ORO, POR TEOR DE AMIDO, 2018-2032 (MIL USD)
TABELA 377 MERCADO DE ARROZ DE EL ORO, POR TEOR DE AMIDO, 2018-2032 (TONELADAS)
TABELA 378 MERCADO DE ARROZ DE EL ORO, POR TEOR DE AMIDO, 2018-2032 (USD/KG)
TABELA 379 MERCADO DE ARROZ DE EL ORO, POR FORMULÁRIO DE PROCESSAMENTO, 2018-2032 (MIL USD)
TABELA 380 MERCADO DE ARROZ DE EL ORO, POR FORMULÁRIO DE PROCESSAMENTO, 2018-2032 (TONELADAS)
TABELA 381 MERCADO DE ARROZ DE EL ORO, POR FORMULÁRIO DE PROCESSAMENTO, 2018-2032 (USD/KG)
TABELA 382 MERCADO DE ARROZ DE EL ORO, POR GRAU DE MOAGEM, 2018-2032 (MIL USD)
TABELA 383 MERCADO DE ARROZ DE EL ORO, POR GRAU DE MOAGEM, 2018-2032 (TONELADAS)
TABELA 384 MERCADO DE ARROZ DE EL ORO, POR GRAU DE MOAGEM, 2018-2032 (USD/KG)
TABELA 385 MERCADO DE ARROZ EL ORO, POR POLIMENTO, 2018-2032 (MIL USD)
TABELA 386 MERCADO DE ARROZ EL ORO, POR POLIMENTO, 2018-2032 (TONELADAS)
TABELA 387 MERCADO DE ARROZ EL ORO, POR POLIMENTO, 2018-2032 (USD/KG)
TABELA 388 MERCADO DE ARROZ DE EL ORO, POR FORTIFICAÇÃO, 2018-2032 (MIL USD)
TABELA 389 MERCADO DE ARROZ DE EL ORO, POR FORTIFICAÇÃO, 2018-2032 (TONELADAS)
TABELA 390 MERCADO DE ARROZ EL ORO, POR FORTIFICAÇÃO, 2018-2032 (USD/KG)
TABELA 391 EL ORO FORTIFICADO NO MERCADO DE ARROZ, POR PROCESSO, 2018-2032 (USD MIL)
TABELA 392 MERCADO DE ARROZ EL ORO, POR AROMA, 2018-2032 (MIL USD)
TABELA 393 MERCADO DE ARROZ EL ORO, DA AROMA, 2018-2032 (TONELADAS)
TABELA 394 MERCADO DE ARROZ EL ORO, POR AROMA, 2018-2032 (USD/KG)
TABELA 395 ARROZ AROMÁTICO EL ORO NO MERCADO DE ARROZ, POR TIPO, 2018-2032 (MIL USD)
TABELA 396 MERCADO DE ARROZ DE EL ORO, POR DERIVADOS DE ARROZ, 2018-2032 (MIL USD)
TABELA 397 MERCADO DE ARROZ DE EL ORO, POR DERIVADOS DE ARROZ, 2018-2032 (TONELADAS)
TABELA 398 MERCADO DE ARROZ DE EL ORO, POR DERIVADOS DE ARROZ, 2018-2032 (USD/KG)
TABELA 399 MERCADO DE ARROZ DE EL ORO, POR USUÁRIO FINAL, 2018-2032 (MIL USD)
TABELA 400 MERCADO DE ARROZ EL ORO, POR USUÁRIO FINAL, 2018-2032 (TONELADAS)
TABELA 401 MERCADO DE ARROZ DE EL ORO, POR USUÁRIO FINAL, 2018-2032 (USD/KG)
TABELA 402 ALIMENTOS E BEBIDAS NO MERCADO DE ARROZ DE EL ORO, POR TIPO, 2018-2032 (MIL USD)
TABELA 403 ALIMENTOS DE EL ORO NO MERCADO DE ARROZ, POR TIPO, 2018-2032 (MIL USD)
TABELA 404 PADARIA EL ORO NO MERCADO DE ARROZ, POR TIPO, 2018-2032 (MIL USD)
TABELA 405 ALIMENTOS PROCESSADOS NO MERCADO DE ARROZ DE EL ORO, POR TIPO, 2018-2032 (MIL USD)
TABELA 406 CONFEITARIA EL ORO NO MERCADO DE ARROZ, POR TIPO, 2018-2032 (USD MIL)
TABELA 407 FÓRMULA INFANTIL EL ORO NO MERCADO DE ARROZ, POR TIPO, 2018-2032 (MIL USD)
TABELA 408 PRODUTOS LÁCTEOS DE EL ORO NO MERCADO DE ARROZ, POR TIPO, 2018-2032 (MIL USD)
TABELA 409 BEBIDAS EL ORO NO MERCADO DE ARROZ, POR TIPO, 2018-2032 (MIL USD)
TABELA 410 BEBIDAS SAUDÁVEIS EL ORO NO MERCADO DE ARROZ, POR TIPO, 2018-2032 (MIL USD)
TABELA 411 ALIMENTAÇÃO EL ORO NO MERCADO DE ARROZ, POR CATEGORIA, 2018-2032 (MIL USD)
TABELA 412 AVES DE EL ORO NO MERCADO DE ARROZ, POR TIPO, 2018-2032 (MIL USD)
TABELA 413 RUMINANTES DE EL ORO NO MERCADO DE ARROZ, POR TIPO, 2018-2032 (MIL USD)
TABELA 414 SUÍNOS EL ORO NO MERCADO DE ARROZ, POR TIPO, 2018-2032 (MIL USD)
TABELA 415 EL ORO PET NO MERCADO DE ARROZ, POR TIPO, 2018-2032 (USD MIL)
TABELA 416 ANIMAIS AQUÁTICOS DE EL ORO NO MERCADO DE ARROZ, POR TIPO, 2018-2032 (MIL USD)
TABELA 417 CRUSTÁCEOS DE EL ORO NO MERCADO DE ARROZ, POR TIPO, 2018-2032 (MIL USD)
TABELA 418 PEIXE DE EL ORO NO MERCADO DE ARROZ, POR TIPO, 2018-2032 (MIL USD)
TABELA 419 MOLUSCOS DE EL ORO NO MERCADO DE ARROZ, POR TIPO, 2018-2032 (MIL USD)
TABELA 420 ALIMENTOS EL ORO NO MERCADO DE ARROZ, POR FUNÇÃO DE SAÚDE, 2018-2032 (MIL USD)
TABELA 421 PRODUTOS FARMACÊUTICOS DE EL ORO NO MERCADO DE ARROZ, POR APLICAÇÃO, 2018-2032 (MIL USD)
TABELA 422 INFECÇÕES UROGENITAIS DE EL ORO NO MERCADO DE ARROZ, POR TIPO, 2018-2032 (MIL USD)
TABELA 423 PRODUTOS FARMACÊUTICOS DE EL ORO NO MERCADO DE ARROZ, POR FORMULÁRIO DE PRODUTO, 2018-2032 (MIL USD)
TABELA 424 EL ORO COSMÉTICOS E CUIDADOS PESSOAIS NO MERCADO DE ARROZ, POR CATEGORIA, 2018-2032 (MIL USD)
TABELA 425 PRODUTOS DE CUIDADOS FACIAIS EL ORO NO MERCADO DE ARROZ, POR TIPO, 2018-2032 (MIL USD)
TABELA 426 PRODUTOS PARA CUIDADOS COM OS CABELOS EL ORO NO MERCADO DE ARROZ, POR TIPO, 2018-2032 (MIL USD)
TABELA 427 SUPLEMENTOS ALIMENTARES DE EL ORO NO MERCADO DE ARROZ, POR TIPO, 2018-2032 (MIL USD)
TABELA 428 SUPLEMENTOS ALIMENTARES DE EL ORO NO MERCADO DE ARROZ, POR FORMA DE PRODUTO, 2018-2032 (MIL USD)
TABELA 429 MERCADO DE ARROZ DE EL ORO, POR CANAL DE DISTRIBUIÇÃO, 2018-2032 (MIL USD)
TABELA 430 MERCADO DE ARROZ EL ORO, POR CANAL DE DISTRIBUIÇÃO, 2018-2032 (TONELADAS)
TABELA 431 MERCADO DE ARROZ DE EL ORO, POR CANAL DE DISTRIBUIÇÃO, 2018-2032 (USD/KG)
TABELA 432 EL ORO OFFLINE NO MERCADO DE ARROZ, POR TIPO, 2018-2032 (USD MIL)
TABELA 433 VENDAS NO VAREJO DE EL ORO NO MERCADO DE ARROZ, POR TIPO DE CANAL, 2018-2032 (MIL USD)
TABELA 434 EL ORO ONLINE NO MERCADO DE ARROZ, POR TIPO, 2018-2032 (USD MIL)
TABELA 435 MERCADO DE ARROZ DE ESMERALDAS, POR TIPO, 2018-2032 (USD MIL)
TABELA 436 MERCADO DE ARROZ DE ESMERALDAS, POR TIPO, 2018-2032 (TONELADAS)
TABELA 437 MERCADO DE ARROZ ESMERALDAS, POR TIPO, 2018-2032 (USD/KG)
TABELA 438 MERCADO DE ARROZ DE ESMERALDAS, POR COR DE ARROZ, 2018-2032 (USD MIL)
TABELA 439 MERCADO DE ARROZ DE ESMERALDAS, POR COR DE ARROZ, 2018-2032 (TONELADAS)
TABELA 440 MERCADO DE ARROZ DE ESMERALDAS, POR COR DE ARROZ, 2018-2032 (USD/KG)
TABELA 441 MERCADO DE ARROZ DE ESMERALDAS, POR TAMANHO DO GRÃO/TAMANHO DO GRÃO, 2018-2032 (MIL USD)
TABELA 442 MERCADO DE ARROZ DE ESMERALDAS, POR TAMANHO DO GRÃO/TAMANHO DO GRÃO, 2018-2032 (TONELADAS)
TABELA 443 MERCADO DE ARROZ ESMERALDAS, POR TAMANHO DO GRÃO/TAMANHO DO GRÃO, 2018-2032 (USD/KG)
TABELA 444 MERCADO DE ARROZ DE ESMERALDAS, POR NATUREZA, 2018-2032 (USD MIL)
TABELA 445 MERCADO DE ARROZ DE ESMERALDAS, POR NATUREZA, 2018-2032 (TONELADAS)
TABELA 446 MERCADO DE ARROZ DE ESMERALDAS, POR NATUREZA, 2018-2032 (USD/KG)
TABELA 447 MERCADO DE ARROZ DE ESMERALDAS, POR TEOR DE AMIDO, 2018-2032 (MIL USD)
TABELA 448 MERCADO DE ARROZ DE ESMERALDAS, POR TEOR DE AMIDO, 2018-2032 (TONELADAS)
TABELA 449 MERCADO DE ARROZ ESMERALDAS, POR TEOR DE AMIDO, 2018-2032 (USD/KG)
TABELA 450 MERCADO DE ARROZ ESMERALDAS, POR FORMULÁRIO DE PROCESSAMENTO, 2018-2032 (USD MIL)
TABELA 451 MERCADO DE ARROZ DE ESMERALDAS, POR FORMULÁRIO DE PROCESSAMENTO, 2018-2032 (TONELADAS)
TABELA 452 MERCADO DE ARROZ ESMERALDAS, POR FORMULÁRIO DE PROCESSAMENTO, 2018-2032 (USD/KG)
TABELA 453 MERCADO DE ARROZ DE ESMERALDAS, POR GRAU DE MOAGEM, 2018-2032 (MIL USD)
TABELA 454 MERCADO DE ARROZ DE ESMERALDAS, POR GRAU DE MOAGEM, 2018-2032 (TONELADAS)
TABELA 455 MERCADO DE ARROZ DE ESMERALDAS, POR GRAU DE MOAGEM, 2018-2032 (USD/KG)
TABELA 456 MERCADO DE ARROZ DE ESMERALDAS, POR POLIMENTO, 2018-2032 (USD MIL)
TABELA 457 MERCADO DE ARROZ DE ESMERALDAS, POR POLIMENTO, 2018-2032 (TONELADAS)
TABELA 458 MERCADO DE ARROZ DE ESMERALDAS, POR POLIMENTO, 2018-2032 (USD/KG)
TABELA 459 MERCADO DE ARROZ DE ESMERALDAS, POR FORTIFICAÇÃO, 2018-2032 (USD MIL)
TABELA 460 MERCADO DE ARROZ DE ESMERALDAS, POR FORTIFICAÇÃO, 2018-2032 (TONELADAS)
TABELA 461 MERCADO DE ARROZ DE ESMERALDAS, POR FORTIFICAÇÃO, 2018-2032 (USD/KG)
TABELA 462 ESMERALDAS FORTIFICADAS NO MERCADO DE ARROZ, POR PROCESSO, 2018-2032 (USD MIL)
TABELA 463 MERCADO DE ARROZ ESMERALDAS, POR AROMA, 2018-2032 (USD MIL)
TABELA 464 MERCADO DE ARROZ DE ESMERALDAS, POR AROMA, 2018-2032 (TONELADAS)
TABELA 465 MERCADO DE ARROZ ESMERALDAS, POR AROMA, 2018-2032 (USD/KG)
TABELA 466 ARROZ AROMÁTICO ESMERALDAS NO MERCADO DE ARROZ, POR TIPO, 2018-2032 (USD MIL)
TABELA 467 MERCADO DE ARROZ DE ESMERALDAS, POR DERIVADOS DE ARROZ, 2018-2032 (USD MIL)
TABELA 468 MERCADO DE ARROZ DE ESMERALDAS, POR DERIVADOS DE ARROZ, 2018-2032 (TONELADAS)
TABELA 469 MERCADO DE ARROZ DE ESMERALDAS, POR DERIVADOS DE ARROZ, 2018-2032 (USD/KG)
TABELA 470 MERCADO DE ARROZ DE ESMERALDAS, POR USUÁRIO FINAL, 2018-2032 (MIL USD)
TABELA 471 MERCADO DE ARROZ DE ESMERALDAS, POR USUÁRIO FINAL, 2018-2032 (TONELADAS)
TABELA 472 MERCADO DE ARROZ DE ESMERALDAS, POR USUÁRIO FINAL, 2018-2032 (USD/KG)
TABELA 473 ALIMENTOS E BEBIDAS DE ESMERALDAS NO MERCADO DE ARROZ, POR TIPO, 2018-2032 (USD MIL)
TABELA 474 ALIMENTOS DE ESMERALDAS NO MERCADO DE ARROZ, POR TIPO, 2018-2032 (USD MIL)
TABELA 475 PADARIA ESMERALDAS NO MERCADO DE ARROZ, POR TIPO, 2018-2032 (USD MIL)
TABELA 476 ALIMENTOS PROCESSADOS DE ESMERALDAS NO MERCADO DE ARROZ, POR TIPO, 2018-2032 (USD MIL)
TABELA 477 DOCES ESMERALDAS NO MERCADO DE ARROZ, POR TIPO, 2018-2032 (USD MIL)
TABELA 478 FÓRMULA INFANTIL ESMERALDAS NO MERCADO DE ARROZ, POR TIPO, 2018-2032 (USD MIL)
TABELA 479 PRODUTOS LATICÍNIOS DE ESMERALDAS NO MERCADO DE ARROZ, POR TIPO, 2018-2032 (USD MIL)
TABELA 480 BEBIDAS ESMERALDAS NO MERCADO DE ARROZ, POR TIPO, 2018-2032 (USD MIL)
TABELA 481 BEBIDAS SAUDÁVEIS ESMERALDAS NO MERCADO DE ARROZ, POR TIPO, 2018-2032 (USD MIL)
TABELA 482 RAÇÃO ESMERALDAS NO MERCADO DE ARROZ, POR CATEGORIA, 2018-2032 (USD MIL)
TABELA 483 AVES ESMERALDAS NO MERCADO DE ARROZ, POR TIPO, 2018-2032 (USD MIL)
TABELA 484 RUMINANTES ESMERALDAS NO MERCADO DE ARROZ, POR TIPO, 2018-2032 (USD MIL)
TABELA 485 SUÍNOS ESMERALDAS NO MERCADO DE ARROZ, POR TIPO, 2018-2032 (USD MIL)
TABELA 486 ESMERALDAS PET NO MERCADO DE ARROZ, POR TIPO, 2018-2032 (USD MIL)
TABELA 487 ANIMAIS AQUÁTICOS ESMERALDAS NO MERCADO DE ARROZ, POR TIPO, 2018-2032 (USD MIL)
TABELA 488 CRUSTÁCEOS ESMERALDAS NO MERCADO DE ARROZ, POR TIPO, 2018-2032 (USD MIL)
TABELA 489 PEIXES ESMERALDAS NO MERCADO DE ARROZ, POR TIPO, 2018-2032 (USD MIL)
TABELA 490 MOLUSCOS ESMERALDAS NO MERCADO DE ARROZ, POR TIPO, 2018-2032 (USD MIL)
TABELA 491 ALIMENTAÇÃO DE ESMERALDAS NO MERCADO DE ARROZ, POR FUNÇÃO DE SAÚDE, 2018-2032 (MIL USD)
TABELA 492 PRODUTOS FARMACÊUTICOS ESMERALDAS NO MERCADO DE ARROZ, POR APLICAÇÃO, 2018-2032 (MIL USD)
TABELA 493 INFECÇÕES UROGENITAIS POR ESMERALDAS NO MERCADO DE ARROZ, POR TIPO, 2018-2032 (USD MIL)
TABELA 494 PRODUTOS FARMACÊUTICOS ESMERALDAS NO MERCADO DE ARROZ, POR FORMULÁRIO DE PRODUTO, 2018-2032 (MIL USD)
TABELA 495 ESMERALDAS COSMÉTICOS E CUIDADOS PESSOAIS NO MERCADO DE ARROZ, POR CATEGORIA, 2018-2032 (USD MIL)
TABELA 496 PRODUTOS DE CUIDADOS FACIAIS ESMERALDAS NO MERCADO DE ARROZ, POR TIPO, 2018-2032 (MIL USD)
TABELA 497 PRODUTOS PARA CUIDADOS COM OS CABELOS ESMERALDAS NO MERCADO DE ARROZ, POR TIPO, 2018-2032 (MIL USD)
TABELA 498 SUPLEMENTOS ALIMENTARES ESMERALDAS NO MERCADO DE ARROZ, POR TIPO, 2018-2032 (USD MIL)
TABELA 499 SUPLEMENTOS ALIMENTARES ESMERALDAS NO MERCADO DE ARROZ, POR FORMA DE PRODUTO, 2018-2032 (MIL USD)
TABELA 500 MERCADO DE ARROZ DE ESMERALDAS, POR CANAL DE DISTRIBUIÇÃO, 2018-2032 (USD MIL)
TABELA 501 MERCADO DE ARROZ DE ESMERALDAS, POR CANAL DE DISTRIBUIÇÃO, 2018-2032 (TONELADAS)
TABELA 502 MERCADO DE ARROZ DE ESMERALDAS, POR CANAL DE DISTRIBUIÇÃO, 2018-2032 (USD/KG)
TABELA 503 ESMERALDAS OFFLINE NO MERCADO DE ARROZ, POR TIPO, 2018-2032 (USD MIL)
TABELA 504 VENDAS NO VAREJO DE ESMERALDAS NO MERCADO DE ARROZ, POR TIPO DE CANAL, 2018-2032 (USD MIL)
TABELA 505 ESMERALDAS ONLINE NO MERCADO DE ARROZ, POR TIPO, 2018-2032 (USD MIL)
TABELA 506 MERCADO DE ARROZ DE CAÑAR, POR TIPO, 2018-2032 (MIL USD)
TABELA 507 MERCADO DE ARROZ DE CAÑAR, POR TIPO, 2018-2032 (TONELADAS)
TABELA 508 MERCADO DE ARROZ DE CAÑAR, POR TIPO, 2018-2032 (USD/KG)
TABELA 509 MERCADO DE ARROZ DE CAÑAR, POR COR DE ARROZ, 2018-2032 (MIL USD)
TABELA 510 MERCADO DE ARROZ DE CAÑAR, POR COR DE ARROZ, 2018-2032 (TONELADAS)
TABELA 511 MERCADO DE ARROZ DE CAÑAR, POR COR DE ARROZ, 2018-2032 (USD/KG)
TABELA 512 MERCADO DE ARROZ DE CAÑAR, POR TAMANHO DO GRÃO/TAMANHO DO GRÃO, 2018-2032 (MIL USD)
TABELA 513 MERCADO DE ARROZ DE CAÑAR, POR TAMANHO DO GRÃO/TAMANHO DO GRÃO, 2018-2032 (TONELADAS)
TABELA 514 MERCADO DE ARROZ DE CAÑAR, POR TAMANHO DO GRÃO/TAMANHO DO GRÃO, 2018-2032 (USD/KG)
TABELA 515 MERCADO DE ARROZ DE CAÑAR, POR NATUREZA, 2018-2032 (MIL USD)
TABELA 516 MERCADO DE ARROZ DE CAÑAR, POR NATUREZA, 2018-2032 (TONELADAS)
TABELA 517 MERCADO DE ARROZ DE CAÑAR, POR NATUREZA, 2018-2032 (USD/KG)
TABELA 518 MERCADO DE ARROZ DE CAÑAR, POR TEOR DE AMIDO, 2018-2032 (MIL USD)
TABELA 519 MERCADO DE ARROZ DE CAÑAR, POR TEOR DE AMIDO, 2018-2032 (TONELADAS)
TABELA 520 MERCADO DE ARROZ DE CAÑAR, POR TEOR DE AMIDO, 2018-2032 (USD/KG)
TABELA 521 MERCADO DE ARROZ DE CAÑAR, POR FORMULÁRIO DE PROCESSAMENTO, 2018-2032 (MIL USD)
TABELA 522 MERCADO DE ARROZ DE CAÑAR, POR FORMULÁRIO DE PROCESSAMENTO, 2018-2032 (TONELADAS)
TABELA 523 MERCADO DE ARROZ DE CAÑAR, POR FORMULÁRIO DE PROCESSAMENTO, 2018-2032 (USD/KG)
TABELA 524 MERCADO DE ARROZ DE CAÑAR, POR GRAU DE MOAGEM, 2018-2032 (MIL USD)
TABELA 525 MERCADO DE ARROZ DE CAÑAR, POR GRAU DE MOAGEM, 2018-2032 (TONELADAS)
TABELA 526 MERCADO DE ARROZ DE CAÑAR, POR GRAU DE MOAGEM, 2018-2032 (USD/KG)
TABELA 527 MERCADO DE ARROZ DE CAÑAR, POR POLIMENTO, 2018-2032 (MIL USD)
TABELA 528 MERCADO DE ARROZ DE CAÑAR, POR POLIMENTO, 2018-2032 (TONELADAS)
TABELA 529 MERCADO DE ARROZ DE CAÑAR, POR POLIMENTO, 2018-2032 (USD/KG)
TABELA 530 MERCADO DE ARROZ DE CAÑAR, POR FORTIFICAÇÃO, 2018-2032 (MIL USD)
TABELA 531 MERCADO DE ARROZ DE CAÑAR, POR FORTIFICAÇÃO, 2018-2032 (TONELADAS)
TABELA 532 MERCADO DE ARROZ DE CAÑAR, POR FORTIFICAÇÃO, 2018-2032 (USD/KG)
TABELA 533 CAÑAR FORTIFICADO NO MERCADO DE ARROZ, POR PROCESSO, 2018-2032 (MIL USD)
TABELA 534 MERCADO DE ARROZ DE CAÑAR, POR AROMA, 2018-2032 (MIL USD)
TABELA 535 MERCADO DE ARROZ DE CAÑAR, DA AROMA, 2018-2032 (TONELADAS)
TABELA 536 MERCADO DE ARROZ DE CAÑAR, POR AROMA, 2018-2032 (USD/KG)
TABELA 537 ARROZ AROMÁTICO CAÑAR NO MERCADO DE ARROZ, POR TIPO, 2018-2032 (MIL USD)
TABELA 538 MERCADO DE ARROZ DE CAÑAR, POR DERIVADOS DE ARROZ, 2018-2032 (MIL USD)
TABELA 539 MERCADO DE ARROZ DE CAÑAR, POR DERIVADOS DE ARROZ, 2018-2032 (TONELADAS)
TABELA 540 MERCADO DE ARROZ DE CAÑAR, POR DERIVADOS DE ARROZ, 2018-2032 (USD/KG)
TABELA 541 MERCADO DE ARROZ DE CAÑAR, POR USUÁRIO FINAL, 2018-2032 (MIL USD)
TABELA 542 MERCADO DE ARROZ DE CAÑAR, POR USUÁRIO FINAL, 2018-2032 (TONELADAS)
TABELA 543 MERCADO DE ARROZ DE CAÑAR, POR USUÁRIO FINAL, 2018-2032 (USD/KG)
TABELA 544 ALIMENTOS E BEBIDAS NO MERCADO DE ARROZ DE CAÑAR, POR TIPO, 2018-2032 (MIL USD)
TABELA 545 ALIMENTOS CAÑAR NO MERCADO DE ARROZ, POR TIPO, 2018-2032 (MIL USD)
TABELA 546 PADARIA CAÑAR NO MERCADO DE ARROZ, POR TIPO, 2018-2032 (USD MIL)
TABELA 547 ALIMENTOS PROCESSADOS NO MERCADO DE ARROZ DE CAÑAR, POR TIPO, 2018-2032 (MIL USD)
TABELA 548 DOCES CAÑAR NO MERCADO DE ARROZ, POR TIPO, 2018-2032 (USD MIL)
TABELA 549 FÓRMULA INFANTIL CAÑAR NO MERCADO DE ARROZ, POR TIPO, 2018-2032 (MIL USD)
TABELA 550 PRODUTOS LÁCTEOS DE CAÑAR NO MERCADO DE ARROZ, POR TIPO, 2018-2032 (MIL USD)
TABELA 551 BEBIDAS DE CAÑAR NO MERCADO DE ARROZ, POR TIPO, 2018-2032 (MIL USD)
TABELA 552 BEBIDAS SAUDÁVEIS CAÑAR NO MERCADO DE ARROZ, POR TIPO, 2018-2032 (MIL USD)
TABELA 553 RAÇÃO CAÑAR NO MERCADO DE ARROZ, POR CATEGORIA, 2018-2032 (MIL USD)
TABELA 554 AVES DE CAÑAR NO MERCADO DE ARROZ, POR TIPO, 2018-2032 (MIL USD)
TABELA 555 RUMINANTES CAÑAR NO MERCADO DE ARROZ, POR TIPO, 2018-2032 (USD MIL)
TABELA 556 SUÍNOS CAÑAR NO MERCADO DE ARROZ, POR TIPO, 2018-2032 (MIL USD)
TABELA 557 CAÑAR PET NO MERCADO DE ARROZ, POR TIPO, 2018-2032 (USD MIL)
TABELA 558 ANIMAIS AQUÁTICOS CAÑAR NO MERCADO DE ARROZ, POR TIPO, 2018-2032 (MIL USD)
TABELA 559 CRUSTÁCEOS DE CAÑAR NO MERCADO DE ARROZ, POR TIPO, 2018-2032 (MIL USD)
TABELA 560 PEIXE CAÑAR NO MERCADO DE ARROZ, POR TIPO, 2018-2032 (MIL USD)
TABELA 561 MOLUSCOS DE CAÑAR NO MERCADO DE ARROZ, POR TIPO, 2018-2032 (MIL USD)
TABELA 562 ALIMENTAÇÃO DE CAÑAR NO MERCADO DE ARROZ, POR FUNÇÃO DE SAÚDE, 2018-2032 (MIL USD)
TABELA 563 PRODUTOS FARMACÊUTICOS CAÑAR NO MERCADO DE ARROZ, POR APLICAÇÃO, 2018-2032 (MIL USD)
TABELA 564 INFECÇÕES UROGENITAIS DE CAÑAR NO MERCADO DE ARROZ, POR TIPO, 2018-2032 (MIL USD)
TABELA 565 PRODUTOS FARMACÊUTICOS CAÑAR NO MERCADO DE ARROZ, POR FORMULÁRIO DE PRODUTO, 2018-2032 (MIL USD)
TABELA 566 CAÑAR COSMÉTICOS E CUIDADOS PESSOAIS NO MERCADO DE ARROZ, POR CATEGORIA, 2018-2032 (MIL USD)
TABELA 567 PRODUTOS DE CUIDADOS FACIAIS CAÑAR NO MERCADO DE ARROZ, POR TIPO, 2018-2032 (MIL USD)
TABELA 568 PRODUTOS PARA CUIDADOS COM OS CABELOS CAÑAR NO MERCADO DE ARROZ, POR TIPO, 2018-2032 (MIL USD)
TABELA 569 SUPLEMENTOS ALIMENTARES NO MERCADO DE ARROZ DE CAÑAR, POR TIPO, 2018-2032 (MIL USD)
TABELA 570 SUPLEMENTOS ALIMENTARES CAÑAR NO MERCADO DE ARROZ, POR FORMA DE PRODUTO, 2018-2032 (MIL USD)
TABELA 571 MERCADO DE ARROZ DE CAÑAR, POR CANAL DE DISTRIBUIÇÃO, 2018-2032 (MIL USD)
TABELA 572 MERCADO DE ARROZ DE CAÑAR, POR CANAL DE DISTRIBUIÇÃO, 2018-2032 (TONELADAS)
TABELA 573 MERCADO DE ARROZ DE CAÑAR, POR CANAL DE DISTRIBUIÇÃO, 2018-2032 (USD/KG)
TABELA 574 CAÑAR OFFLINE NO MERCADO DE ARROZ, POR TIPO, 2018-2032 (USD MIL)
TABELA 575 VENDAS NO VAREJO DE CAÑAR NO MERCADO DE ARROZ, POR TIPO DE CANAL, 2018-2032 (MIL USD)
TABELA 576 CAÑAR ONLINE NO MERCADO DE ARROZ, POR TIPO, 2018-2032 (USD MIL)
TABELA 577 MERCADO DE ARROZ AZUAY, POR TIPO, 2018-2032 (MIL USD)
TABELA 578 MERCADO DE ARROZ DE AZUAY, POR TIPO, 2018-2032 (TONELADAS)
TABELA 579 MERCADO DE ARROZ AZUAY, POR TIPO, 2018-2032 (USD/KG)
TABELA 580 MERCADO DE ARROZ AZUAY, POR COR DE ARROZ, 2018-2032 (MIL USD)
TABELA 581 MERCADO DE ARROZ DE AZUAY, POR COR DE ARROZ, 2018-2032 (TONELADAS)
TABELA 582 MERCADO DE ARROZ AZUAY, POR COR DE ARROZ, 2018-2032 (USD/KG)
TABELA 583 MERCADO DE ARROZ AZUAY, POR TAMANHO DO GRÃO/TAMANHO DO GRÃO, 2018-2032 (MIL USD)
TABELA 584 MERCADO DE ARROZ AZUAY, POR TAMANHO DO GRÃO/TAMANHO DO GRÃO, 2018-2032 (TONELADAS)
TABELA 585 MERCADO DE ARROZ AZUAY, POR TAMANHO DO GRÃO/TAMANHO DO GRÃO, 2018-2032 (USD/KG)
TABELA 586 MERCADO DE ARROZ DE AZUAY, POR NATUREZA, 2018-2032 (MIL USD)
TABELA 587 MERCADO DE ARROZ DE AZUAY, POR NATUREZA, 2018-2032 (TONELADAS)
TABELA 588 MERCADO DE ARROZ AZUAY, POR NATUREZA, 2018-2032 (USD/KG)
TABELA 589 MERCADO DE ARROZ AZUAY, POR TEOR DE AMIDO, 2018-2032 (MIL USD)
TABELA 590 MERCADO DE ARROZ AZUAY, POR TEOR DE AMIDO, 2018-2032 (TONELADAS)
TABELA 591 MERCADO DE ARROZ AZUAY, POR TEOR DE AMIDO, 2018-2032 (USD/KG)
TABELA 592 MERCADO DE ARROZ AZUAY, POR FORMULÁRIO DE PROCESSAMENTO, 2018-2032 (MIL USD)
TABELA 593 MERCADO DE ARROZ AZUAY, POR FORMULÁRIO DE PROCESSAMENTO, 2018-2032 (TONELADAS)
TABELA 594 MERCADO DE ARROZ AZUAY, POR FORMULÁRIO DE PROCESSAMENTO, 2018-2032 (USD/KG)
TABELA 595 MERCADO DE ARROZ AZUAY, POR GRAU DE MOAGEM, 2018-2032 (MIL USD)
TABELA 596 MERCADO DE ARROZ AZUAY, POR GRAU DE MOAGEM, 2018-2032 (TONELADAS)
TABELA 597 MERCADO DE ARROZ AZUAY, POR GRAU DE MOAGEM, 2018-2032 (USD/KG)
TABELA 598 MERCADO DE ARROZ AZUAY, POR POLIMENTO, 2018-2032 (MIL USD)
TABELA 599 MERCADO DE ARROZ AZUAY, POR POLIMENTO, 2018-2032 (TONELADAS)
TABELA 600 MERCADO DE ARROZ AZUAY, POR POLIMENTO, 2018-2032 (USD/KG)
TABELA 601 MERCADO DE ARROZ AZUAY, POR FORTIFICAÇÃO, 2018-2032 (MIL USD)
TABELA 602 MERCADO DE ARROZ DE AZUAY, POR FORTIFICAÇÃO, 2018-2032 (TONELADAS)
TABELA 603 MERCADO DE ARROZ AZUAY, POR FORTIFICAÇÃO, 2018-2032 (USD/KG)
TABELA 604 AZUAY FORTIFICADO NO MERCADO DE ARROZ, POR PROCESSO, 2018-2032 (USD MIL)
TABELA 605 MERCADO DE ARROZ AZUAY, POR AROMA, 2018-2032 (MIL USD)
TABELA 606 MERCADO DE ARROZ AZUAY, DA AROMA, 2018-2032 (TONELADAS)
TABELA 607 MERCADO DE ARROZ AZUAY, POR AROMA, 2018-2032 (USD/KG)
TABELA 608 ARROZ AROMÁTICO AZUAY NO MERCADO DE ARROZ, POR TIPO, 2018-2032 (MIL USD)
TABELA 609 MERCADO DE ARROZ AZUAY, POR DERIVADOS DE ARROZ, 2018-2032 (MIL USD)
TABELA 610 MERCADO DE ARROZ AZUAY, POR DERIVADOS DE ARROZ, 2018-2032 (TONELADAS)
TABELA 611 MERCADO DE ARROZ AZUAY, POR DERIVADOS DE ARROZ, 2018-2032 (USD/KG)
TABELA 612 MERCADO DE ARROZ AZUAY, POR USUÁRIO FINAL, 2018-2032 (MIL USD)
TABELA 613 MERCADO DE ARROZ AZUAY, POR USUÁRIO FINAL, 2018-2032 (TONELADAS)
TABELA 614 MERCADO DE ARROZ AZUAY, POR USUÁRIO FINAL, 2018-2032 (USD/KG)
TABELA 615 ALIMENTOS E BEBIDAS AZUAY NO MERCADO DE ARROZ, POR TIPO, 2018-2032 (MIL USD)
TABELA 616 ALIMENTOS AZUAY NO MERCADO DE ARROZ, POR TIPO, 2018-2032 (MIL USD)
TABELA 617 PADARIA AZUAY NO MERCADO DE ARROZ, POR TIPO, 2018-2032 (MIL USD)
TABELA 618 ALIMENTOS PROCESSADOS AZUAY NO MERCADO DE ARROZ, POR TIPO, 2018-2032 (MIL USD)
TABELA 619 DOCES AZUAY NO MERCADO DE ARROZ, POR TIPO, 2018-2032 (USD MIL)
TABELA 620 FÓRMULA INFANTIL AZUAY NO MERCADO DE ARROZ, POR TIPO, 2018-2032 (MIL USD)
TABELA 621 PRODUTOS LÁCTEOS AZUAY NO MERCADO DE ARROZ, POR TIPO, 2018-2032 (MIL USD)
TABELA 622 BEBIDAS AZUAY NO MERCADO DE ARROZ, POR TIPO, 2018-2032 (USD MIL)
TABELA 623 BEBIDAS SAUDÁVEIS AZUAY NO MERCADO DE ARROZ, POR TIPO, 2018-2032 (MIL USD)
TABELA 624 RAÇÃO AZUAY NO MERCADO DE ARROZ, POR CATEGORIA, 2018-2032 (MIL USD)
TABELA 625 AVES AZUAY NO MERCADO DE ARROZ, POR TIPO, 2018-2032 (MIL USD)
TABELA 626 RUMINANTES AZUAY NO MERCADO DE ARROZ, POR TIPO, 2018-2032 (USD MIL)
TABELA 627 SUÍNOS AZUAY NO MERCADO DE ARROZ, POR TIPO, 2018-2032 (MIL USD)
TABELA 628 AZUAY PET NO MERCADO DE ARROZ, POR TIPO, 2018-2032 (USD MIL)
TABELA 629 ANIMAIS AQUÁTICOS AZUAY NO MERCADO DE ARROZ, POR TIPO, 2018-2032 (MIL USD)
TABELA 630 CRUSTÁCEOS AZUAY NO MERCADO DE ARROZ, POR TIPO, 2018-2032 (MIL USD)
TABELA 631 PEIXE AZUAY NO MERCADO DE ARROZ, POR TIPO, 2018-2032 (MIL USD)
TABELA 632 MOLUSCOS AZUAY NO MERCADO DE ARROZ, POR TIPO, 2018-2032 (MIL USD)
TABELA 633 ALIMENTOS AZUAY NO MERCADO DE ARROZ, POR FUNÇÃO DE SAÚDE, 2018-2032 (MIL USD)
TABELA 634 PRODUTOS FARMACÊUTICOS AZUAY NO MERCADO DE ARROZ, POR APLICAÇÃO, 2018-2032 (MIL USD)
TABELA 635 INFECÇÕES UROGENITAIS DE AZUAY NO MERCADO DE ARROZ, POR TIPO, 2018-2032 (MIL USD)
TABELA 636 PRODUTOS FARMACÊUTICOS AZUAY NO MERCADO DE ARROZ, POR FORMULÁRIO DE PRODUTO, 2018-2032 (MIL USD)
TABELA 637 AZUAY COSMÉTICOS E CUIDADOS PESSOAIS NO MERCADO DE ARROZ, POR CATEGORIA, 2018-2032 (MIL USD)
TABELA 638 PRODUTOS DE CUIDADOS FACIAIS AZUAY NO MERCADO DE ARROZ, POR TIPO, 2018-2032 (MIL USD)
TABELA 639 PRODUTOS PARA CUIDADOS COM OS CABELOS DA AZUAY NO MERCADO DE ARROZ, POR TIPO, 2018-2032 (MIL USD)
TABELA 640 SUPLEMENTOS ALIMENTARES AZUAY NO MERCADO DE ARROZ, POR TIPO, 2018-2032 (MIL USD)
TABELA 641 SUPLEMENTOS ALIMENTARES AZUAY NO MERCADO DE ARROZ, POR FORMULÁRIO DE PRODUTO, 2018-2032 (MIL USD)
TABELA 642 MERCADO DE ARROZ AZUAY, POR CANAL DE DISTRIBUIÇÃO, 2018-2032 (MIL USD)
TABELA 643 MERCADO DE ARROZ DE AZUAY, POR CANAL DE DISTRIBUIÇÃO, 2018-2032 (TONELADAS)
TABELA 644 MERCADO DE ARROZ AZUAY, POR CANAL DE DISTRIBUIÇÃO, 2018-2032 (USD/KG)
TABELA 645 AZUAY OFFLINE NO MERCADO DE ARROZ, POR TIPO, 2018-2032 (USD MIL)
TABELA 646 VENDAS NO VAREJO DA AZUAY NO MERCADO DE ARROZ, POR TIPO DE CANAL, 2018-2032 (MIL USD)
TABELA 647 AZUAY ONLINE NO MERCADO DE ARROZ, POR TIPO, 2018-2032 (USD MIL)
TABELA 648 MERCADO DE ARROZ DE BOLÍVAR, POR TIPO, 2018-2032 (MIL USD)
TABELA 649 MERCADO DE ARROZ DE BOLÍVAR, POR TIPO, 2018-2032 (TONELADAS)
TABELA 650 MERCADO DE ARROZ BOLÍVAR, POR TIPO, 2018-2032 (USD/KG)
TABELA 651 MERCADO DE ARROZ DE BOLÍVAR, POR COR DE ARROZ, 2018-2032 (USD MIL)
TABELA 652 MERCADO DE ARROZ DE BOLÍVAR, POR COR DE ARROZ, 2018-2032 (TONELADAS)
TABELA 653 MERCADO DE ARROZ DE BOLÍVAR, POR COR DE ARROZ, 2018-2032 (USD/KG)
TABELA 654 MERCADO DE ARROZ DE BOLÍVAR, POR TAMANHO DO GRÃO/TAMANHO DO GRÃO, 2018-2032 (MIL USD)
TABELA 655 MERCADO DE ARROZ DE BOLÍVAR, POR TAMANHO DO GRÃO/TAMANHO DO GRÃO, 2018-2032 (TONELADAS)
TABELA 656 MERCADO DE ARROZ DE BOLÍVAR, POR TAMANHO DO GRÃO/TAMANHO DO GRÃO, 2018-2032 (USD/KG)
TABELA 657 MERCADO DE ARROZ DE BOLÍVAR, POR NATUREZA, 2018-2032 (USD MIL)
TABELA 658 MERCADO DE ARROZ DE BOLÍVAR, POR NATUREZA, 2018-2032 (TONELADAS)
TABELA 659 MERCADO DE ARROZ DE BOLÍVAR, POR NATUREZA, 2018-2032 (USD/KG)
TABELA 660 MERCADO DE ARROZ DE BOLÍVAR, POR TEOR DE AMIDO, 2018-2032 (MIL USD)
TABELA 661 MERCADO DE ARROZ DE BOLÍVAR, POR TEOR DE AMIDO, 2018-2032 (TONELADAS)
TABELA 662 MERCADO DE ARROZ BOLÍVAR, POR TEOR DE AMIDO, 2018-2032 (USD/KG)
TABELA 663 MERCADO DE ARROZ DE BOLÍVAR, POR FORMULÁRIO DE PROCESSAMENTO, 2018-2032 (MIL USD)
TABELA 664 MERCADO DE ARROZ DE BOLÍVAR, POR FORMULÁRIO DE PROCESSAMENTO, 2018-2032 (TONELADAS)
TABELA 665 MERCADO DE ARROZ DE BOLÍVAR, POR FORMULÁRIO DE PROCESSAMENTO, 2018-2032 (USD/KG)
TABELA 666 MERCADO DE ARROZ DE BOLÍVAR, POR GRAU DE MOAGEM, 2018-2032 (MIL USD)
TABELA 667 MERCADO DE ARROZ DE BOLÍVAR, POR GRAU DE MOAGEM, 2018-2032 (TONELADAS)
TABELA 668 MERCADO DE ARROZ BOLÍVAR, POR GRAU DE MOAGEM, 2018-2032 (USD/KG)
TABELA 669 MERCADO DE ARROZ DE BOLÍVAR, POR POLIMENTO, 2018-2032 (USD MIL)
TABELA 670 MERCADO DE ARROZ DE BOLÍVAR, POR POLIMENTO, 2018-2032 (TONELADAS)
TABELA 671 MERCADO DE ARROZ BOLÍVAR, POR POLIMENTO, 2018-2032 (USD/KG)
TABELA 672 MERCADO DE ARROZ DE BOLÍVAR, POR FORTIFICAÇÃO, 2018-2032 (MIL USD)
TABELA 673 MERCADO DE ARROZ DE BOLÍVAR, POR FORTIFICAÇÃO, 2018-2032 (TONELADAS)
TABELA 674 MERCADO DE ARROZ BOLÍVAR, POR FORTIFICAÇÃO, 2018-2032 (USD/KG)
TABELA 675 BOLÍVAR FORTIFICADO NO MERCADO DE ARROZ, POR PROCESSO, 2018-2032 (USD MIL)
TABELA 676 MERCADO DE ARROZ DE BOLÍVAR, POR AROMA, 2018-2032 (USD MIL)
TABELA 677 MERCADO DE ARROZ DE BOLÍVAR, POR AROMA, 2018-2032 (TONELADAS)
TABELA 678 MERCADO DE ARROZ BOLÍVAR, POR AROMA, 2018-2032 (USD/KG)
TABELA 679 ARROZ AROMÁTICO BOLÍVAR NO MERCADO DE ARROZ, POR TIPO, 2018-2032 (USD MIL)
TABELA 680 MERCADO DE ARROZ BOLÍVAR, POR DERIVADOS DE ARROZ, 2018-2032 (USD MIL)
TABELA 681 MERCADO DE ARROZ BOLÍVAR, POR DERIVADOS DE ARROZ, 2018-2032 (TONELADAS)
TABELA 682 MERCADO DE ARROZ BOLÍVAR, POR DERIVADOS DE ARROZ, 2018-2032 (USD/KG)
TABELA 683 MERCADO DE ARROZ BOLÍVAR, POR USUÁRIO FINAL, 2018-2032 (MIL USD)
TABELA 684 MERCADO DE ARROZ DE BOLÍVAR, POR USUÁRIO FINAL, 2018-2032 (TONELADAS)
TABELA 685 MERCADO DE ARROZ BOLÍVAR, POR USUÁRIO FINAL, 2018-2032 (USD/KG)
TABELA 686 ALIMENTOS E BEBIDAS DE BOLÍVAR NO MERCADO DE ARROZ, POR TIPO, 2018-2032 (USD MIL)
TABELA 687 ALIMENTOS BOLÍVAR NO MERCADO DE ARROZ, POR TIPO, 2018-2032 (USD MIL)
TABELA 688 PADARIA BOLÍVAR NO MERCADO DE ARROZ, POR TIPO, 2018-2032 (USD MIL)
TABELA 689 ALIMENTOS PROCESSADOS BOLÍVAR NO MERCADO DE ARROZ, POR TIPO, 2018-2032 (USD MIL)
TABELA 690 DOCES BOLÍVARES NO MERCADO DE ARROZ, POR TIPO, 2018-2032 (USD MIL)
TABELA 691 FÓRMULA INFANTIL BOLÍVAR NO MERCADO DE ARROZ, POR TIPO, 2018-2032 (USD MIL)
TABELA 692 PRODUTOS LÁCTEOS DE BOLÍVAR NO MERCADO DE ARROZ, POR TIPO, 2018-2032 (USD MIL)
TABELA 693 BEBIDAS DE BOLÍVAR NO MERCADO DE ARROZ, POR TIPO, 2018-2032 (USD MIL)
TABELA 694 BEBIDAS SAUDÁVEIS BOLÍVAR NO MERCADO DE ARROZ, POR TIPO, 2018-2032 (USD MIL)
TABELA 695 BOLÍVAR PARA RAÇÃO NO MERCADO DE ARROZ, POR CATEGORIA, 2018-2032 (USD MIL)
TABELA 696 AVES DE BOLÍVAR NO MERCADO DE ARROZ, POR TIPO, 2018-2032 (USD MIL)
TABELA 697 RUMINANTES BOLÍVARES NO MERCADO DE ARROZ, POR TIPO, 2018-2032 (USD MIL)
TABELA 698 SUÍNOS BOLÍVAR NO MERCADO DE ARROZ, POR TIPO, 2018-2032 (USD MIL)
TABELA 699 BOLÍVAR PET NO MERCADO DE ARROZ, POR TIPO, 2018-2032 (USD MIL)
TABELA 700 BOLÍVAR DE ANIMAIS AQUÁTICOS NO MERCADO DE ARROZ, POR TIPO, 2018-2032 (USD MIL)
TABELA 701 CRUSTÁCEOS BOLÍVARES NO MERCADO DE ARROZ, POR TIPO, 2018-2032 (MIL USD)
TABELA 702 PEIXE BOLÍVAR NO MERCADO DE ARROZ, POR TIPO, 2018-2032 (USD MIL)
TABELA 703 MOLUSCOS BOLÍVAR NO MERCADO DE ARROZ, POR TIPO, 2018-2032 (USD MIL)
TABELA 704 ALIMENTOS PARA BOLÍVAR NO MERCADO DE ARROZ, POR FUNÇÃO DE SAÚDE, 2018-2032 (MIL USD)
TABELA 705 PRODUTOS FARMACÊUTICOS BOLÍVAR NO MERCADO DE ARROZ, POR APLICAÇÃO, 2018-2032 (MIL USD)
TABELA 706 INFECÇÕES UROGENITAIS DE BOLÍVAR NO MERCADO DE ARROZ, POR TIPO, 2018-2032 (USD MIL)
TABELA 707 PRODUTOS FARMACÊUTICOS BOLÍVAR NO MERCADO DE ARROZ, POR FORMULÁRIO DE PRODUTO, 2018-2032 (MIL USD)
TABELA 708 BOLÍVAR COSMÉTICOS E CUIDADOS PESSOAIS NO MERCADO DE ARROZ, POR CATEGORIA, 2018-2032 (USD MIL)
TABELA 709 PRODUTOS DE CUIDADOS FACIAIS BOLÍVAR NO MERCADO DE ARROZ, POR TIPO, 2018-2032 (MIL USD)
TABELA 710 PRODUTOS PARA CUIDADOS COM OS CABELOS BOLÍVAR NO MERCADO DE ARROZ, POR TIPO, 2018-2032 (USD MIL)
TABELA 711 SUPLEMENTOS ALIMENTARES BOLÍVAR NO MERCADO DE ARROZ, POR TIPO, 2018-2032 (USD MIL)
TABELA 712 SUPLEMENTOS ALIMENTARES BOLÍVAR NO MERCADO DE ARROZ, POR FORMULÁRIO DE PRODUTO, 2018-2032 (MIL USD)
TABELA 713 MERCADO DE ARROZ DE BOLÍVAR, POR CANAL DE DISTRIBUIÇÃO, 2018-2032 (USD MIL)
TABELA 714 MERCADO DE ARROZ DE BOLÍVAR, POR CANAL DE DISTRIBUIÇÃO, 2018-2032 (TONELADAS)
TABELA 715 MERCADO DE ARROZ DE BOLÍVAR, POR CANAL DE DISTRIBUIÇÃO, 2018-2032 (USD/KG)
TABELA 716 BOLÍVAR OFFLINE NO MERCADO DE ARROZ, POR TIPO, 2018-2032 (USD MIL)
TABELA 717 VENDAS NO VAREJO DE BOLÍVAR NO MERCADO DE ARROZ, POR TIPO DE CANAL, 2018-2032 (MIL USD)
TABELA 718 BOLÍVAR ONLINE NO MERCADO DE ARROZ, POR TIPO, 2018-2032 (USD MIL)
TABELA 719 MERCADO DE ARROZ CARCHI, POR TIPO, 2018-2032 (MIL USD)
TABELA 720 MERCADO DE ARROZ CARCHI, POR TIPO, 2018-2032 (TONELADAS)
TABELA 721 MERCADO DE ARROZ CARCHI, POR TIPO, 2018-2032 (USD/KG)
TABELA 722 MERCADO DE ARROZ CARCHI, POR COR DE ARROZ, 2018-2032 (MIL USD)
TABELA 723 MERCADO DE ARROZ CARCHI, POR COR DE ARROZ, 2018-2032 (TONELADAS)
TABELA 724 MERCADO DE ARROZ CARCHI, POR COR DE ARROZ, 2018-2032 (USD/KG)
TABELA 725 MERCADO DE ARROZ CARCHI, POR TAMANHO DO GRÃO/TAMANHO DO GRÃO, 2018-2032 (MIL USD)
TABELA 726 MERCADO DE ARROZ CARCHI, POR TAMANHO DO GRÃO/TAMANHO DO GRÃO, 2018-2032 (TONELADAS)
TABELA 727 MERCADO DE ARROZ CARCHI, POR TAMANHO DO GRÃO/TAMANHO DO GRÃO, 2018-2032 (USD/KG)
TABELA 728 MERCADO DE ARROZ CARCHI, POR NATUREZA, 2018-2032 (MIL USD)
TABELA 729 MERCADO DE ARROZ CARCHI, POR NATUREZA, 2018-2032 (TONELADAS)
TABELA 730 MERCADO DE ARROZ CARCHI, POR NATUREZA, 2018-2032 (USD/KG)
TABELA 731 MERCADO DE ARROZ CARCHI, POR TEOR DE AMIDO, 2018-2032 (MIL USD)
TABELA 732 MERCADO DE ARROZ CARCHI, POR TEOR DE AMIDO, 2018-2032 (TONELADAS)
TABELA 733 MERCADO DE ARROZ CARCHI, POR TEOR DE AMIDO, 2018-2032 (USD/KG)
TABELA 734 MERCADO DE ARROZ CARCHI, POR FORMULÁRIO DE PROCESSAMENTO, 2018-2032 (MIL USD)
TABELA 735 MERCADO DE ARROZ CARCHI, POR FORMULÁRIO DE PROCESSAMENTO, 2018-2032 (TONELADAS)
TABELA 736 MERCADO DE ARROZ CARCHI, POR FORMULÁRIO DE PROCESSAMENTO, 2018-2032 (USD/KG)
TABELA 737 MERCADO DE ARROZ CARCHI, POR GRAU DE MOAGEM, 2018-2032 (MIL USD)
TABELA 738 MERCADO DE ARROZ CARCHI, POR GRAU DE MOAGEM, 2018-2032 (TONELADAS)
TABELA 739 MERCADO DE ARROZ CARCHI, POR GRAU DE MOAGEM, 2018-2032 (USD/KG)
TABELA 740 MERCADO DE ARROZ CARCHI, POR POLIMENTO, 2018-2032 (MIL USD)
TABELA 741 MERCADO DE ARROZ CARCHI, POR POLIMENTO, 2018-2032 (TONELADAS)
TABELA 742 MERCADO DE ARROZ CARCHI, POR POLIMENTO, 2018-2032 (USD/KG)
TABELA 743 MERCADO DE ARROZ CARCHI, POR FORTIFICAÇÃO, 2018-2032 (MIL USD)
TABELA 744 MERCADO DE ARROZ CARCHI, POR FORTIFICAÇÃO, 2018-2032 (TONELADAS)
TABELA 745 MERCADO DE ARROZ CARCHI, POR FORTIFICAÇÃO, 2018-2032 (USD/KG)
TABELA 746 CARCHI FORTIFICADO NO MERCADO DE ARROZ, POR PROCESSO, 2018-2032 (MIL USD)
TABELA 747 MERCADO DE ARROZ CARCHI, POR AROMA, 2018-2032 (MIL USD)
TABELA 748 MERCADO DE ARROZ CARCHI, POR AROMA, 2018-2032 (TONELADAS)
TABELA 749 MERCADO DE ARROZ CARCHI, POR AROMA, 2018-2032 (USD/KG)
TABELA 750 ARROZ CARCHI AROMÁTICO NO MERCADO DE ARROZ, POR TIPO, 2018-2032 (MIL USD)
TABELA 751 MERCADO DE ARROZ CARCHI, POR DERIVADOS DE ARROZ, 2018-2032 (MIL USD)
TABELA 752 MERCADO DE ARROZ CARCHI, POR DERIVADOS DE ARROZ, 2018-2032 (TONELADAS)
TABELA 753 MERCADO DE ARROZ CARCHI, POR DERIVADOS DE ARROZ, 2018-2032 (USD/KG)
TABELA 754 MERCADO DE ARROZ CARCHI, POR USUÁRIO FINAL, 2018-2032 (MIL USD)
TABELA 755 MERCADO DE ARROZ CARCHI, POR USUÁRIO FINAL, 2018-2032 (TONELADAS)
TABELA 756 MERCADO DE ARROZ CARCHI, POR USUÁRIO FINAL, 2018-2032 (USD/KG)
TABELA 757 ALIMENTOS E BEBIDAS CARCHI NO MERCADO DE ARROZ, POR TIPO, 2018-2032 (MIL USD)
TABELA 758 ALIMENTOS CARCHI NO MERCADO DE ARROZ, POR TIPO, 2018-2032 (MIL USD)
TABELA 759 PADARIA CARCHI NO MERCADO DE ARROZ, POR TIPO, 2018-2032 (MIL USD)
TABELA 760 ALIMENTOS PROCESSADOS CARCHI NO MERCADO DE ARROZ, POR TIPO, 2018-2032 (MIL USD)
TABELA 761 CONFEITARIA CARCHI NO MERCADO DE ARROZ, POR TIPO, 2018-2032 (USD MIL)
TABELA 762 FÓRMULA INFANTIL CARCHI NO MERCADO DE ARROZ, POR TIPO, 2018-2032 (MIL USD)
TABELA 763 PRODUTOS LÁCTEOS CARCHI NO MERCADO DE ARROZ, POR TIPO, 2018-2032 (MIL USD)
TABELA 764 BEBIDAS CARCHI NO MERCADO DE ARROZ, POR TIPO, 2018-2032 (USD MIL)
TABELA 765 BEBIDAS SAUDÁVEIS CARCHI NO MERCADO DE ARROZ, POR TIPO, 2018-2032 (MIL USD)
TABELA 766 RAÇÃO CARCHI NO MERCADO DE ARROZ, POR CATEGORIA, 2018-2032 (MIL USD)
TABELA 767 AVES CARCHI NO MERCADO DE ARROZ, POR TIPO, 2018-2032 (MIL USD)
TABELA 768 RUMINANTES CARCHI NO MERCADO DE ARROZ, POR TIPO, 2018-2032 (USD MIL)
TABELA 769 SUÍNOS CARCHI NO MERCADO DE ARROZ, POR TIPO, 2018-2032 (MIL USD)
TABELA 770 CARCHI PET NO MERCADO DE ARROZ, POR TIPO, 2018-2032 (USD MIL)
TABELA 771 ANIMAIS AQUÁTICOS CARCHI NO MERCADO DE ARROZ, POR TIPO, 2018-2032 (MIL USD)
TABELA 772 CRUSTÁCEOS CARCHI NO MERCADO DE ARROZ, POR TIPO, 2018-2032 (MIL USD)
TABELA 773 CARCHI NO MERCADO DE ARROZ, POR TIPO, 2018-2032 (MIL USD)
TABELA 774 MOLUSCOS CARCHI NO MERCADO DE ARROZ, POR TIPO, 2018-2032 (MIL USD)
TABELA 775 ALIMENTOS DE CARCHI NO MERCADO DE ARROZ, POR FUNÇÃO DE SAÚDE, 2018-2032 (MIL USD)
TABELA 776 PRODUTOS FARMACÊUTICOS CARCHI NO MERCADO DE ARROZ, POR APLICAÇÃO, 2018-2032 (MIL USD)
TABELA 777 INFECÇÕES UROGENITAIS POR CARCHI NO MERCADO DE ARROZ, POR TIPO, 2018-2032 (MIL USD)
TABELA 778 PRODUTOS FARMACÊUTICOS CARCHI NO MERCADO DE ARROZ, POR FORMULÁRIO DE PRODUTO, 2018-2032 (MIL USD)
TABELA 779 COSMÉTICOS E CUIDADOS PESSOAIS DA CARCHI NO MERCADO DE ARROZ, POR CATEGORIA, 2018-2032 (MIL USD)
TABELA 780 PRODUTOS DE CUIDADOS FACIAIS DA CARCHI NO MERCADO DE ARROZ, POR TIPO, 2018-2032 (MIL USD)
TABELA 781 PRODUTOS PARA CUIDADOS COM OS CABELOS DA CARCHI NO MERCADO DE ARROZ, POR TIPO, 2018-2032 (MIL USD)
TABELA 782 SUPLEMENTOS ALIMENTARES CARCHI NO MERCADO DE ARROZ, POR TIPO, 2018-2032 (MIL USD)
TABELA 783 SUPLEMENTOS ALIMENTARES DE CARCHI NO MERCADO DE ARROZ, POR FORMA DE PRODUTO, 2018-2032 (MIL USD)
TABELA 784 MERCADO DE ARROZ CARCHI, POR CANAL DE DISTRIBUIÇÃO, 2018-2032 (MIL USD)
TABELA 785 MERCADO DE ARROZ CARCHI, POR CANAL DE DISTRIBUIÇÃO, 2018-2032 (TONELADAS)
TABELA 786 MERCADO DE ARROZ CARCHI, POR CANAL DE DISTRIBUIÇÃO, 2018-2032 (USD/KG)
TABELA 787 CARCHI OFFLINE NO MERCADO DE ARROZ, POR TIPO, 2018-2032 (USD MIL)
TABELA 788 VENDAS NO VAREJO DE CARCHI NO MERCADO DE ARROZ, POR TIPO DE CANAL, 2018-2032 (MIL USD)
TABELA 789 CARCHI ONLINE NO MERCADO DE ARROZ, POR TIPO, 2018-2032 (USD MIL)
TABELA 790 MERCADO DE ARROZ DE CHIMBORAZO, POR TIPO, 2018-2032 (MIL USD)
TABELA 791 MERCADO DE ARROZ DE CHIMBORAZO, POR TIPO, 2018-2032 (TONELADAS)
TABELA 792 MERCADO DE ARROZ DE CHIMBORAZO, POR TIPO, 2018-2032 (USD/KG)
TABELA 793 MERCADO DE ARROZ DE CHIMBORAZO, POR COR DE ARROZ, 2018-2032 (MIL USD)
TABELA 794 MERCADO DE ARROZ DE CHIMBORAZO, POR COR DE ARROZ, 2018-2032 (TONELADAS)
TABELA 795 MERCADO DE ARROZ DE CHIMBORAZO, POR COR DE ARROZ, 2018-2032 (USD/KG)
TABELA 796 MERCADO DE ARROZ CHIMBORAZO, POR TAMANHO DO GRÃO/TAMANHO DO GRÃO, 2018-2032 (MIL USD)
TABELA 797 MERCADO DE ARROZ DE CHIMBORAZO, POR TAMANHO DO GRÃO/TAMANHO DO GRÃO, 2018-2032 (TONELADAS)
TABELA 798 MERCADO DE ARROZ CHIMBORAZO, POR TAMANHO DO GRÃO/TAMANHO DO GRÃO, 2018-2032 (USD/KG)
TABELA 799 MERCADO DE ARROZ DE CHIMBORAZO, POR NATUREZA, 2018-2032 (MIL USD)
TABELA 800 MERCADO DE ARROZ DE CHIMBORAZO, POR NATUREZA, 2018-2032 (TONELADAS)
TABELA 801 MERCADO DE ARROZ DE CHIMBORAZO, POR NATUREZA, 2018-2032 (USD/KG)
TABELA 802 MERCADO DE ARROZ DE CHIMBORAZO, POR TEOR DE AMIDO, 2018-2032 (MIL USD)
TABELA 803 MERCADO DE ARROZ DE CHIMBORAZO, POR TEOR DE AMIDO, 2018-2032 (TONELADAS)
TABELA 804 MERCADO DE ARROZ CHIMBORAZO, POR TEOR DE AMIDO, 2018-2032 (USD/KG)
TABELA 805 MERCADO DE ARROZ DE CHIMBORAZO, POR FORMULÁRIO DE PROCESSAMENTO, 2018-2032 (MIL USD)
TABELA 806 MERCADO DE ARROZ DE CHIMBORAZO, POR FORMULÁRIO DE PROCESSAMENTO, 2018-2032 (TONELADAS)
TABELA 807 MERCADO DE ARROZ DE CHIMBORAZO, POR FORMULÁRIO DE PROCESSAMENTO, 2018-2032 (USD/KG)
TABELA 808 MERCADO DE ARROZ DE CHIMBORAZO, POR GRAU DE MOAGEM, 2018-2032 (MIL USD)
TABELA 809 MERCADO DE ARROZ DE CHIMBORAZO, POR GRAU DE MOAGEM, 2018-2032 (TONELADAS)
TABELA 810 MERCADO DE ARROZ CHIMBORAZO, POR GRAU DE MOAGEM, 2018-2032 (USD/KG)
TABELA 811 MERCADO DE ARROZ DE CHIMBORAZO, POR POLIMENTO, 2018-2032 (MIL USD)
TABELA 812 MERCADO DE ARROZ DE CHIMBORAZO, POR POLIMENTO, 2018-2032 (TONELADAS)
TABELA 813 MERCADO DE ARROZ DE CHIMBORAZO, POR POLIMENTO, 2018-2032 (USD/KG)
TABELA 814 MERCADO DE ARROZ DE CHIMBORAZO, POR FORTIFICAÇÃO, 2018-2032 (MIL USD)
TABELA 815 MERCADO DE ARROZ DE CHIMBORAZO, POR FORTIFICAÇÃO, 2018-2032 (TONELADAS)
TABELA 816 MERCADO DE ARROZ DE CHIMBORAZO, POR FORTIFICAÇÃO, 2018-2032 (USD/KG)
TABELA 817 CHIMBORAZO FORTIFICADO NO MERCADO DE ARROZ, POR PROCESSO, 2018-2032 (MIL USD)
TABELA 818 MERCADO DE ARROZ DE CHIMBORAZO, POR AROMA, 2018-2032 (MIL USD)
TABELA 819 MERCADO DE ARROZ DE CHIMBORAZO, DA AROMA, 2018-2032 (TONELADAS)
TABELA 820 MERCADO DE ARROZ CHIMBORAZO, POR AROMA, 2018-2032 (USD/KG)
TABELA 821 ARROZ AROMÁTICO CHIMBORAZO NO MERCADO DE ARROZ, POR TIPO, 2018-2032 (MIL USD)
TABELA 822 MERCADO DE ARROZ DE CHIMBORAZO, POR DERIVADOS DE ARROZ, 2018-2032 (MIL USD)
TABELA 823 MERCADO DE ARROZ DE CHIMBORAZO, POR DERIVADOS DE ARROZ, 2018-2032 (TONELADAS)
TABELA 824 MERCADO DE ARROZ CHIMBORAZO, POR DERIVADOS DE ARROZ, 2018-2032 (USD/KG)
TABELA 825 MERCADO DE ARROZ DE CHIMBORAZO, POR USUÁRIO FINAL, 2018-2032 (MIL USD)
TABELA 826 MERCADO DE ARROZ DE CHIMBORAZO, POR USUÁRIO FINAL, 2018-2032 (TONELADAS)
TABELA 827 MERCADO DE ARROZ DE CHIMBORAZO, POR USUÁRIO FINAL, 2018-2032 (USD/KG)
TABELA 828 ALIMENTOS E BEBIDAS DE CHIMBORAZO NO MERCADO DE ARROZ, POR TIPO, 2018-2032 (MIL USD)
TABELA 829 ALIMENTOS CHIMBORAZO NO MERCADO DE ARROZ, POR TIPO, 2018-2032 (MIL USD)
TABELA 830 PADARIA CHIMBORAZO NO MERCADO DE ARROZ, POR TIPO, 2018-2032 (USD MIL)
TABELA 831 ALIMENTOS PROCESSADOS DE CHIMBORAZO NO MERCADO DE ARROZ, POR TIPO, 2018-2032 (MIL USD)
TABELA 832 CONFEITARIA CHIMBORAZO NO MERCADO DE ARROZ, POR TIPO, 2018-2032 (USD MIL)
TABELA 833 FÓRMULA INFANTIL CHIMBORAZO NO MERCADO DE ARROZ, POR TIPO, 2018-2032 (MIL USD)
TABELA 834 PRODUTOS LÁCTEOS DE CHIMBORAZO NO MERCADO DE ARROZ, POR TIPO, 2018-2032 (MIL USD)
TABELA 835 BEBIDAS CHIMBORAZO NO MERCADO DE ARROZ, POR TIPO, 2018-2032 (MIL USD)
TABELA 836 BEBIDAS SAUDÁVEIS CHIMBORAZO NO MERCADO DE ARROZ, POR TIPO, 2018-2032 (MIL USD)
TABELA 837 RAÇÃO CHIMBORAZO NO MERCADO DE ARROZ, POR CATEGORIA, 2018-2032 (MIL USD)
TABELA 838 AVES DE CHIMBORAZO NO MERCADO DE ARROZ, POR TIPO, 2018-2032 (MIL USD)
TABELA 839 RUMINANTES CHIMBORAZO NO MERCADO DE ARROZ, POR TIPO, 2018-2032 (USD MIL)
TABELA 840 SUÍNOS CHIMBORAZO NO MERCADO DE ARROZ, POR TIPO, 2018-2032 (MIL USD)
TABELA 841 CHIMBORAZO PET NO MERCADO DE ARROZ, POR TIPO, 2018-2032 (USD MIL)
TABELA 842 ANIMAIS AQUÁTICOS CHIMBORAZO NO MERCADO DE ARROZ, POR TIPO, 2018-2032 (MIL USD)
TABELA 843 CRUSTÁCEOS CHIMBORAZO NO MERCADO DE ARROZ, POR TIPO, 2018-2032 (MIL USD)
TABELA 844 PEIXE CHIMBORAZO NO MERCADO DE ARROZ, POR TIPO, 2018-2032 (MIL USD)
TABELA 845 MOLUSCOS CHIMBORAZO NO MERCADO DE ARROZ, POR TIPO, 2018-2032 (MIL USD)
TABELA 846 RAÇÃO CHIMBORAZO NO MERCADO DE ARROZ, POR FUNÇÃO DE SAÚDE, 2018-2032 (MIL USD)
TABELA 847 PRODUTOS FARMACÊUTICOS CHIMBORAZO NO MERCADO DE ARROZ, POR APLICAÇÃO, 2018-2032 (MIL USD)
TABELA 848 INFECÇÕES UROGENITAIS POR CHIMBORAZO NO MERCADO DE ARROZ, POR TIPO, 2018-2032 (MIL USD)
TABELA 849 PRODUTOS FARMACÊUTICOS CHIMBORAZO NO MERCADO DE ARROZ, POR FORMA DE PRODUTO, 2018-2032 (MIL USD)
TABELA 850 CHIMBORAZO COSMÉTICOS E CUIDADOS PESSOAIS NO MERCADO DE ARROZ, POR CATEGORIA, 2018-2032 (MIL USD)
TABELA 851 PRODUTOS DE CUIDADOS FACIAIS CHIMBORAZO NO MERCADO DE ARROZ, POR TIPO, 2018-2032 (MIL USD)
TABELA 852 PRODUTOS PARA CUIDADOS COM OS CABELOS CHIMBORAZO NO MERCADO DE ARROZ, POR TIPO, 2018-2032 (MIL USD)
TABELA 853 SUPLEMENTOS ALIMENTARES CHIMBORAZO NO MERCADO DE ARROZ, POR TIPO, 2018-2032 (MIL USD)
TABELA 854 SUPLEMENTOS DIETÉTICOS CHIMBORAZO NO MERCADO DE ARROZ, POR FORMA DE PRODUTO, 2018-2032 (MIL USD)
TABELA 855 MERCADO DE ARROZ DE CHIMBORAZO, POR CANAL DE DISTRIBUIÇÃO, 2018-2032 (MIL USD)
TABELA 856 MERCADO DE ARROZ DE CHIMBORAZO, POR CANAL DE DISTRIBUIÇÃO, 2018-2032 (TONELADAS)
TABELA 857 MERCADO DE ARROZ DE CHIMBORAZO, POR CANAL DE DISTRIBUIÇÃO, 2018-2032 (USD/KG)
TABELA 858 CHIMBORAZO OFFLINE NO MERCADO DE ARROZ, POR TIPO, 2018-2032 (USD MIL)
TABELA 859 VENDAS NO VAREJO DE CHIMBORAZO NO MERCADO DE ARROZ, POR TIPO DE CANAL, 2018-2032 (MIL USD)
TABELA 860 CHIMBORAZO ONLINE NO MERCADO DE ARROZ, POR TIPO, 2018-2032 (USD MIL)
TABELA 861 MERCADO DE ARROZ COTOPAXI, POR TIPO, 2018-2032 (USD MIL)
TABELA 862 MERCADO DE ARROZ COTOPAXI, POR TIPO, 2018-2032 (TONELADAS)
TABELA 863 MERCADO DE ARROZ COTOPAXI, POR TIPO, 2018-2032 (USD/KG)
TABELA 864 MERCADO DE ARROZ COTOPAXI, POR COR DE ARROZ, 2018-2032 (USD MIL)
TABELA 865 MERCADO DE ARROZ COTOPAXI, POR COR DE ARROZ, 2018-2032 (TONELADAS)
TABELA 866 MERCADO DE ARROZ COTOPAXI, POR COR DE ARROZ, 2018-2032 (USD/KG)
TABELA 867 MERCADO DE ARROZ COTOPAXI, POR TAMANHO DO GRÃO/TAMANHO DO GRÃO, 2018-2032 (MIL USD)
TABELA 868 MERCADO DE ARROZ COTOPAXI, POR TAMANHO DO GRÃO/TAMANHO DO GRÃO, 2018-2032 (TONELADAS)
TABELA 869 MERCADO DE ARROZ COTOPAXI, POR TAMANHO DO GRÃO/TAMANHO DO GRÃO, 2018-2032 (USD/KG)
TABELA 870 MERCADO DE ARROZ COTOPAXI, POR NATUREZA, 2018-2032 (USD MIL)
TABELA 871 MERCADO DE ARROZ COTOPAXI, POR NATUREZA, 2018-2032 (TONELADAS)
TABELA 872 MERCADO DE ARROZ COTOPAXI, POR NATUREZA, 2018-2032 (USD/KG)
TABELA 873 MERCADO DE ARROZ COTOPAXI, POR TEOR DE AMIDO, 2018-2032 (MIL USD)
TABELA 874 MERCADO DE ARROZ COTOPAXI, POR TEOR DE AMIDO, 2018-2032 (TONELADAS)
TABELA 875 MERCADO DE ARROZ COTOPAXI, POR TEOR DE AMIDO, 2018-2032 (USD/KG)
TABELA 876 MERCADO DE ARROZ COTOPAXI, POR FORMULÁRIO DE PROCESSAMENTO, 2018-2032 (USD MIL)
TABELA 877 MERCADO DE ARROZ COTOPAXI, POR FORMULÁRIO DE PROCESSAMENTO, 2018-2032 (TONELADAS)
TABELA 878 MERCADO DE ARROZ COTOPAXI, POR FORMULÁRIO DE PROCESSAMENTO, 2018-2032 (USD/KG)
TABELA 879 MERCADO DE ARROZ COTOPAXI, POR GRAU DE MOAGEM, 2018-2032 (USD MIL)
TABELA 880 MERCADO DE ARROZ COTOPAXI, POR GRAU DE MOAGEM, 2018-2032 (TONELADAS)
TABELA 881 MERCADO DE ARROZ COTOPAXI, POR GRAU DE MOAGEM, 2018-2032 (USD/KG)
TABELA 882 MERCADO DE ARROZ COTOPAXI, POR POLIMENTO, 2018-2032 (USD MIL)
TABELA 883 MERCADO DE ARROZ COTOPAXI, POR POLIMENTO, 2018-2032 (TONELADAS)
TABELA 884 MERCADO DE ARROZ COTOPAXI, POR POLIMENTO, 2018-2032 (USD/KG)
TABELA 885 MERCADO DE ARROZ COTOPAXI, POR FORTIFICAÇÃO, 2018-2032 (USD MIL)
TABELA 886 MERCADO DE ARROZ COTOPAXI, POR FORTIFICAÇÃO, 2018-2032 (TONELADAS)
TABELA 887 MERCADO DE ARROZ COTOPAXI, POR FORTIFICAÇÃO, 2018-2032 (USD/KG)
TABELA 888 COTOPAXI FORTIFICADO NO MERCADO DE ARROZ, POR PROCESSO, 2018-2032 (USD MIL)
TABELA 889 MERCADO DE ARROZ COTOPAXI, POR AROMA, 2018-2032 (USD MIL)
TABELA 890 MERCADO DE ARROZ COTOPAXI, DA AROMA, 2018-2032 (TONELADAS)
TABELA 891 MERCADO DE ARROZ COTOPAXI, POR AROMA, 2018-2032 (USD/KG)
TABELA 892 ARROZ AROMÁTICO COTOPAXI NO MERCADO DE ARROZ, POR TIPO, 2018-2032 (USD MIL)
TABELA 893 MERCADO DE ARROZ COTOPAXI, POR DERIVADOS DE ARROZ, 2018-2032 (USD MIL)
TABELA 894 MERCADO DE ARROZ COTOPAXI, POR DERIVADOS DE ARROZ, 2018-2032 (TONELADAS)
TABELA 895 MERCADO DE ARROZ COTOPAXI, POR DERIVADOS DE ARROZ, 2018-2032 (USD/KG)
TABELA 896 MERCADO DE ARROZ COTOPAXI, POR USUÁRIO FINAL, 2018-2032 (USD MIL)
TABELA 897 MERCADO DE ARROZ COTOPAXI, POR USUÁRIO FINAL, 2018-2032 (TONELADAS)
TABELA 898 MERCADO DE ARROZ COTOPAXI, POR USUÁRIO FINAL, 2018-2032 (USD/KG)
TABELA 899 COTOPAXI ALIMENTOS E BEBIDAS NO MERCADO DE ARROZ, POR TIPO, 2018-2032 (USD MIL)
TABELA 900 ALIMENTOS COTOPAXI NO MERCADO DE ARROZ, POR TIPO, 2018-2032 (USD MIL)
TABELA 901 PADARIA COTOPAXI NO MERCADO DE ARROZ, POR TIPO, 2018-2032 (USD MIL)
TABELA 902 ALIMENTOS PROCESSADOS COTOPAXI NO MERCADO DE ARROZ, POR TIPO, 2018-2032 (USD MIL)
TABELA 903 CONFEITARIA COTOPAXI NO MERCADO DE ARROZ, POR TIPO, 2018-2032 (USD MIL)
TABELA 904 FÓRMULA INFANTIL COTOPAXI NO MERCADO DE ARROZ, POR TIPO, 2018-2032 (MIL USD)
TABELA 905 PRODUTOS LÁCTEOS DA COTOPAXI NO MERCADO DE ARROZ, POR TIPO, 2018-2032 (USD MIL)
TABELA 906 BEBIDAS COTOPAXI NO MERCADO DE ARROZ, POR TIPO, 2018-2032 (USD MIL)
TABELA 907 BEBIDAS SAUDÁVEIS COTOPAXI NO MERCADO DE ARROZ, POR TIPO, 2018-2032 (USD MIL)
TABELA 908 RAÇÃO COTOPAXI NO MERCADO DE ARROZ, POR CATEGORIA, 2018-2032 (USD MIL)
TABELA 909 COTOPAXI AVES NO MERCADO DE ARROZ, POR TIPO, 2018-2032 (USD MIL)
TABELA 910 RUMINANTES COTOPAXI NO MERCADO DE ARROZ, POR TIPO, 2018-2032 (USD MIL)
TABELA 911 COTOPAXI SUÍNOS NO MERCADO DE ARROZ, POR TIPO, 2018-2032 (USD MIL)
TABELA 912 COTOPAXI PET NO MERCADO DE ARROZ, POR TIPO, 2018-2032 (USD MIL)
TABELA 913 COTOPAXI ANIMAIS AQUÁTICOS NO MERCADO DE ARROZ, POR TIPO, 2018-2032 (USD MIL)
TABELA 914 CRUSTÁCEOS COTOPAXI NO MERCADO DE ARROZ, POR TIPO, 2018-2032 (MIL USD)
TABELA 915 PEIXES COTOPAXI NO MERCADO DE ARROZ, POR TIPO, 2018-2032 (USD MIL)
TABELA 916 MOLUSCOS COTOPAXI NO MERCADO DE ARROZ, POR TIPO, 2018-2032 (USD MIL)
TABELA 917 RAÇÃO COTOPAXI NO MERCADO DE ARROZ, POR FUNÇÃO DE SAÚDE, 2018-2032 (MIL USD)
TABELA 918 PRODUTOS FARMACÊUTICOS COTOPAXI NO MERCADO DE ARROZ, POR APLICAÇÃO, 2018-2032 (MIL USD)
TABELA 919 INFECÇÕES UROGENITAIS POR COTOPAXI NO MERCADO DE ARROZ, POR TIPO, 2018-2032 (MIL USD)
TABELA 920 PRODUTOS FARMACÊUTICOS COTOPAXI NO MERCADO DE ARROZ, POR FORMA DE PRODUTO, 2018-2032 (MIL USD)
TABELA 921 COTOPAXI COSMÉTICOS E CUIDADOS PESSOAIS NO MERCADO DE ARROZ, POR CATEGORIA, 2018-2032 (MIL USD)
TABELA 922 PRODUTOS DE CUIDADOS FACIAIS DA COTOPAXI NO MERCADO DE ARROZ, POR TIPO, 2018-2032 (MIL USD)
TABELA 923 PRODUTOS PARA CUIDADOS COM OS CABELOS DA COTOPAXI NO MERCADO DE ARROZ, POR TIPO, 2018-2032 (MIL USD)
TABELA 924 SUPLEMENTOS ALIMENTARES COTOPAXI NO MERCADO DE ARROZ, POR TIPO, 2018-2032 (MIL USD)
TABELA 925 SUPLEMENTOS ALIMENTARES COTOPAXI NO MERCADO DE ARROZ, POR FORMA DE PRODUTO, 2018-2032 (MIL USD)
TABELA 926 MERCADO DE ARROZ COTOPAXI, POR CANAL DE DISTRIBUIÇÃO, 2018-2032 (USD MIL)
TABELA 927 MERCADO DE ARROZ COTOPAXI, POR CANAL DE DISTRIBUIÇÃO, 2018-2032 (TONELADAS)
TABELA 928 MERCADO DE ARROZ COTOPAXI, POR CANAL DE DISTRIBUIÇÃO, 2018-2032 (USD/KG)
TABELA 929 COTOPAXI OFFLINE NO MERCADO DE ARROZ, POR TIPO, 2018-2032 (USD MIL)
TABELA 930 VENDAS NO VAREJO DA COTOPAXI NO MERCADO DE ARROZ, POR TIPO DE CANAL, 2018-2032 (MIL USD)
TABELA 931 COTOPAXI ONLINE NO MERCADO DE ARROZ, POR TIPO, 2018-2032 (USD MIL)
TABELA 932 MERCADO DE ARROZ DE GALÁPAGOS, POR TIPO, 2018-2032 (MIL USD)
TABELA 933 MERCADO DE ARROZ DE GALÁPAGOS, POR TIPO, 2018-2032 (TONELADAS)
TABELA 934 MERCADO DE ARROZ DE GALÁPAGOS, POR TIPO, 2018-2032 (USD/KG)
TABELA 935 MERCADO DE ARROZ DE GALÁPAGOS, POR COR DE ARROZ, 2018-2032 (MIL USD)
TABELA 936 MERCADO DE ARROZ DE GALÁPAGOS, POR COR DE ARROZ, 2018-2032 (TONELADAS)
TABELA 937 MERCADO DE ARROZ DE GALÁPAGOS, POR COR DO ARROZ, 2018-2032 (USD/KG)
TABELA 938 MERCADO DE ARROZ DE GALÁPAGOS, POR TAMANHO DO GRÃO/TAMANHO DO GRÃO, 2018-2032 (MIL USD)
TABELA 939 MERCADO DE ARROZ DE GALÁPAGOS, POR TAMANHO DO GRÃO/TAMANHO DO GRÃO, 2018-2032 (TONELADAS)
TABELA 940 MERCADO DE ARROZ DE GALÁPAGOS, POR TAMANHO DO GRÃO/TAMANHO DO GRÃO, 2018-2032 (USD/KG)
TABELA 941 MERCADO DE ARROZ DE GALÁPAGOS, POR NATUREZA, 2018-2032 (MIL USD)
TABELA 942 MERCADO DE ARROZ DE GALÁPAGOS, POR NATUREZA, 2018-2032 (TONELADAS)
TABELA 943 MERCADO DE ARROZ DE GALÁPAGOS, POR NATUREZA, 2018-2032 (USD/KG)
TABELA 944 MERCADO DE ARROZ DE GALÁPAGOS, POR TEOR DE AMIDO, 2018-2032 (MIL USD)
TABELA 945 MERCADO DE ARROZ DE GALÁPAGOS, POR TEOR DE AMIDO, 2018-2032 (TONELADAS)
TABELA 946 MERCADO DE ARROZ DE GALÁPAGOS, POR TEOR DE AMIDO, 2018-2032 (USD/KG)
TABELA 947 MERCADO DE ARROZ DE GALÁPAGOS, POR FORMULÁRIO DE PROCESSAMENTO, 2018-2032 (MIL USD)
TABELA 948 MERCADO DE ARROZ DE GALÁPAGOS, POR FORMULÁRIO DE PROCESSAMENTO, 2018-2032 (TONELADAS)
TABELA 949 MERCADO DE ARROZ DE GALÁPAGOS, POR FORMULÁRIO DE PROCESSAMENTO, 2018-2032 (USD/KG)
TABELA 950 MERCADO DE ARROZ DE GALÁPAGOS, POR GRAU DE MOAGEM, 2018-2032 (MIL USD)
TABELA 951 MERCADO DE ARROZ DE GALÁPAGOS, POR GRAU DE MOAGEM, 2018-2032 (TONELADAS)
TABELA 952 MERCADO DE ARROZ DE GALÁPAGOS, POR GRAU DE MOAGEM, 2018-2032 (USD/KG)
TABELA 953 MERCADO DE ARROZ DE GALÁPAGOS, POR POLIMENTO, 2018-2032 (MIL USD)
TABELA 954 MERCADO DE ARROZ DE GALÁPAGOS, POR POLIMENTO, 2018-2032 (TONELADAS)
TABELA 955 MERCADO DE ARROZ DE GALÁPAGOS, POR POLIMENTO, 2018-2032 (USD/KG)
TABELA 956 MERCADO DE ARROZ DE GALÁPAGOS, POR FORTIFICAÇÃO, 2018-2032 (MIL USD)
TABELA 957 MERCADO DE ARROZ DE GALÁPAGOS, POR FORTIFICAÇÃO, 2018-2032 (TONELADAS)
TABELA 958 MERCADO DE ARROZ DE GALÁPAGOS, POR FORTIFICAÇÃO, 2018-2032 (USD/KG)
TABELA 959 GALÁPAGOS FORTIFICADOS NO MERCADO DE ARROZ, POR PROCESSO, 2018-2032 (USD MIL)
TABELA 960 MERCADO DE ARROZ DE GALÁPAGOS, POR AROMA, 2018-2032 (MIL USD)
TABELA 961 MERCADO DE ARROZ DE GALÁPAGOS, DA AROMA, 2018-2032 (TONELADAS)
TABELA 962 MERCADO DE ARROZ DE GALÁPAGOS, POR AROMA, 2018-2032 (USD/KG)
TABELA 963 ARROZ AROMÁTICO DE GALÁPAGOS NO MERCADO DE ARROZ, POR TIPO, 2018-2032 (MIL USD)
TABELA 964 MERCADO DE ARROZ DE GALÁPAGOS, POR DERIVADOS DE ARROZ, 2018-2032 (MIL USD)
TABELA 965 MERCADO DE ARROZ DE GALÁPAGOS, POR DERIVADOS DE ARROZ, 2018-2032 (TONELADAS)
TABELA 966 MERCADO DE ARROZ DE GALÁPAGOS, POR DERIVADOS DE ARROZ, 2018-2032 (USD/KG)
TABELA 967 MERCADO DE ARROZ DE GALÁPAGOS, POR USUÁRIO FINAL, 2018-2032 (MIL USD)
TABELA 968 MERCADO DE ARROZ DE GALÁPAGOS, POR USUÁRIO FINAL, 2018-2032 (TONELADAS)
TABELA 969 MERCADO DE ARROZ DE GALÁPAGOS, POR USUÁRIO FINAL, 2018-2032 (USD/KG)
TABELA 970 ALIMENTOS E BEBIDAS NO MERCADO DE ARROZ DE GALÁPAGOS, POR TIPO, 2018-2032 (MIL USD)
TABELA 971 ALIMENTOS DE GALÁPAGOS NO MERCADO DE ARROZ, POR TIPO, 2018-2032 (MIL USD)
TABELA 972 PADARIA DE GALÁPAGOS NO MERCADO DE ARROZ, POR TIPO, 2018-2032 (MIL USD)
TABELA 973 ALIMENTOS PROCESSADOS NO MERCADO DE ARROZ DE GALÁPAGOS, POR TIPO, 2018-2032 (MIL USD)
TABELA 974 CONFEITARIA DE GALÁPAGOS NO MERCADO DE ARROZ, POR TIPO, 2018-2032 (MIL USD)
TABELA 975 FÓRMULA INFANTIL DE GALÁPAGOS NO MERCADO DE ARROZ, POR TIPO, 2018-2032 (MIL USD)
TABELA 976 PRODUTOS LÁCTEOS DE GALÁPAGOS NO MERCADO DE ARROZ, POR TIPO, 2018-2032 (MIL USD)
TABELA 977 BEBIDAS DE GALÁPAGOS NO MERCADO DE ARROZ, POR TIPO, 2018-2032 (MIL USD)
TABELA 978 BEBIDAS SAUDÁVEIS DE GALÁPAGOS NO MERCADO DE ARROZ, POR TIPO, 2018-2032 (MIL USD)
TABELA 979 RAÇÃO DE GALÁPAGOS NO MERCADO DE ARROZ, POR CATEGORIA, 2018-2032 (MIL USD)
TABELA 980 AVES DE GALÁPAGOS NO MERCADO DE ARROZ, POR TIPO, 2018-2032 (MIL USD)
TABELA 981 RUMINANTES DE GALÁPAGOS NO MERCADO DE ARROZ, POR TIPO, 2018-2032 (MIL USD)
TABELA 982 SUÍNOS DE GALÁPAGOS NO MERCADO DE ARROZ, POR TIPO, 2018-2032 (MIL USD)
TABELA 983 PET DE GALÁPAGOS NO MERCADO DE ARROZ, POR TIPO, 2018-2032 (MIL USD)
TABELA 984 ANIMAIS AQUÁTICOS DE GALÁPAGOS NO MERCADO DE ARROZ, POR TIPO, 2018-2032 (MIL USD)
TABELA 985 CRUSTÁCEOS DE GALÁPAGOS NO MERCADO DE ARROZ, POR TIPO, 2018-2032 (MIL USD)
TABELA 986 PEIXE DE GALÁPAGOS NO MERCADO DE ARROZ, POR TIPO, 2018-2032 (MIL USD)
TABELA 987 MOLUSCOS DE GALÁPAGOS NO MERCADO DE ARROZ, POR TIPO, 2018-2032 (MIL USD)
TABELA 988 ALIMENTOS DE GALÁPAGOS NO MERCADO DE ARROZ, POR FUNÇÃO DE SAÚDE, 2018-2032 (MIL USD)
TABELA 989 PRODUTOS FARMACÊUTICOS DE GALÁPAGOS NO MERCADO DE ARROZ, POR APLICAÇÃO, 2018-2032 (MIL USD)
TABELA 990 INFECÇÕES UROGENITAIS NO MERCADO DE ARROZ DE GALÁPAGOS, POR TIPO, 2018-2032 (MIL USD)
TABELA 991 PRODUTOS FARMACÊUTICOS DE GALÁPAGOS NO MERCADO DE ARROZ, POR FORMULÁRIO DE PRODUTO, 2018-2032 (MIL USD)
TABELA 992 COSMÉTICOS E CUIDADOS PESSOAIS DE GALÁPAGOS NO MERCADO DE ARROZ, POR CATEGORIA, 2018-2032 (MIL USD)
TABELA 993 PRODUTOS PARA CUIDADOS FACIAIS DE GALÁPAGOS NO MERCADO DE ARROZ, POR TIPO, 2018-2032 (MIL USD)
TABELA 994 PRODUTOS PARA CUIDADOS COM OS CABELOS DE GALÁPAGOS NO MERCADO DE ARROZ, POR TIPO, 2018-2032 (MIL USD)
TABELA 995 SUPLEMENTOS ALIMENTARES NO MERCADO DE ARROZ DE GALÁPAGOS, POR TIPO, 2018-2032 (MIL USD)
TABELA 996 SUPLEMENTOS ALIMENTARES DE GALÁPAGOS NO MERCADO DE ARROZ, POR FORMULÁRIO DE PRODUTO, 2018-2032 (MIL USD)
TABELA 997 MERCADO DE ARROZ DE GALÁPAGOS, POR CANAL DE DISTRIBUIÇÃO, 2018-2032 (MIL USD)
TABELA 998 MERCADO DE ARROZ DE GALÁPAGOS, POR CANAL DE DISTRIBUIÇÃO, 2018-2032 (TONELADAS)
TABELA 999 MERCADO DE ARROZ DE GALÁPAGOS, POR CANAL DE DISTRIBUIÇÃO, 2018-2032 (USD/KG)
TABELA 1000 GALÁPAGOS OFFLINE NO MERCADO DE ARROZ, POR TIPO, 2018-2032 (USD MIL)
TABELA 1001 VENDAS NO VAREJO DE GALÁPAGOS NO MERCADO DE ARROZ, POR TIPO DE CANAL, 2018-2032 (MIL USD)
TABELA 1002 GALÁPAGOS ONLINE NO MERCADO DE ARROZ, POR TIPO, 2018-2032 (USD MIL)
TABELA 1003 MERCADO DE ARROZ IMBABURA, POR TIPO, 2018-2032 (MIL USD)
TABELA 1004 MERCADO DE ARROZ IMBABURA, POR TIPO, 2018-2032 (TONELADAS)
TABELA 1005 MERCADO DE ARROZ IMBABURA, POR TIPO, 2018-2032 (USD/KG)
TABELA 1006 MERCADO DE ARROZ IMBABURA, POR COR DO ARROZ, 2018-2032 (MIL USD)
TABELA 1007 MERCADO DE ARROZ DE IMBABURA, POR COR DE ARROZ, 2018-2032 (TONELADAS)
TABELA 1008 MERCADO DE ARROZ IMBABURA, POR COR DO ARROZ, 2018-2032 (USD/KG)
TABELA 1009 MERCADO DE ARROZ IMBABURA, POR TAMANHO DO GRÃO/TAMANHO DO GRÃO, 2018-2032 (MIL USD)
TABELA 1010 MERCADO DE ARROZ IMBABURA, POR TAMANHO DO GRÃO/TAMANHO DO GRÃO, 2018-2032 (TONELADAS)
TABELA 1011 MERCADO DE ARROZ IMBABURA, POR TAMANHO DO GRÃO/TAMANHO DO GRÃO, 2018-2032 (USD/KG)
TABELA 1012 MERCADO DE ARROZ IMBABURA, POR NATUREZA, 2018-2032 (MIL USD)
TABELA 1013 MERCADO DE ARROZ IMBABURA, POR NATUREZA, 2018-2032 (TONELADAS)
TABELA 1014 MERCADO DE ARROZ IMBABURA, POR NATUREZA, 2018-2032 (USD/KG)
TABELA 1015 MERCADO DE ARROZ IMBABURA, POR TEOR DE AMIDO, 2018-2032 (MIL USD)
TABELA 1016 MERCADO DE ARROZ IMBABURA, POR TEOR DE AMIDO, 2018-2032 (TONELADAS)
TABELA 1017 MERCADO DE ARROZ IMBABURA, POR TEOR DE AMIDO, 2018-2032 (USD/KG)
TABELA 1018 MERCADO DE ARROZ IMBABURA, POR FORMULÁRIO DE PROCESSAMENTO, 2018-2032 (MIL USD)
TABELA 1019 MERCADO DE ARROZ IMBABURA, POR FORMULÁRIO DE PROCESSAMENTO, 2018-2032 (TONELADAS)
TABELA 1020 MERCADO DE ARROZ IMBABURA, POR FORMULÁRIO DE PROCESSAMENTO, 2018-2032 (USD/KG)
TABELA 1021 MERCADO DE ARROZ IMBABURA, POR GRAU DE MOAGEM, 2018-2032 (MIL USD)
TABELA 1022 MERCADO DE ARROZ IMBABURA, POR GRAU DE MOAGEM, 2018-2032 (TONELADAS)
TABELA 1023 MERCADO DE ARROZ IMBABURA, POR GRAU DE MOAGEM, 2018-2032 (USD/KG)
TABELA 1024 MERCADO DE ARROZ DE IMBABURA, POR POLIMENTO, 2018-2032 (MIL USD)
TABELA 1025 MERCADO DE ARROZ DE IMBABURA, POR POLIMENTO, 2018-2032 (TONELADAS)
TABELA 1026 MERCADO DE ARROZ IMBABURA, POR POLIMENTO, 2018-2032 (USD/KG)
TABELA 1027 MERCADO DE ARROZ IMBABURA, POR FORTIFICAÇÃO, 2018-2032 (MIL USD)
TABELA 1028 MERCADO DE ARROZ DE IMBABURA, POR FORTIFICAÇÃO, 2018-2032 (TONELADAS)
TABELA 1029 MERCADO DE ARROZ IMBABURA, POR FORTIFICAÇÃO, 2018-2032 (USD/KG)
TABELA 1030 IMBABURA FORTIFICADA NO MERCADO DE ARROZ, POR PROCESSO, 2018-2032 (USD MIL)
TABELA 1031 MERCADO DE ARROZ IMBABURA, POR AROMA, 2018-2032 (MIL USD)
TABELA 1032 MERCADO DE ARROZ DE IMBABURA, DA AROMA, 2018-2032 (TONELADAS)
TABELA 1033 MERCADO DE ARROZ DE IMBABURA, POR AROMA, 2018-2032 (USD/KG)
TABELA 1034 ARROZ AROMÁTICO IMBABURA NO MERCADO DE ARROZ, POR TIPO, 2018-2032 (MIL USD)
TABELA 1035 MERCADO DE ARROZ IMBABURA, POR DERIVADOS DE ARROZ, 2018-2032 (MIL USD)
TABELA 1036 MERCADO DE ARROZ IMBABURA, POR DERIVADOS DE ARROZ, 2018-2032 (TONELADAS)
TABELA 1037 MERCADO DE ARROZ IMBABURA, POR DERIVADOS DE ARROZ, 2018-2032 (USD/KG)
TABELA 1038 MERCADO DE ARROZ IMBABURA, POR USUÁRIO FINAL, 2018-2032 (MIL USD)
TABELA 1039 MERCADO DE ARROZ IMBABURA, POR USUÁRIO FINAL, 2018-2032 (TONELADAS)
TABELA 1040 MERCADO DE ARROZ IMBABURA, POR USUÁRIO FINAL, 2018-2032 (USD/KG)
TABELA 1041 ALIMENTOS E BEBIDAS IMBABURA NO MERCADO DE ARROZ, POR TIPO, 2018-2032 (USD MIL)
TABELA 1042 ALIMENTOS IMBABURA NO MERCADO DE ARROZ, POR TIPO, 2018-2032 (MIL USD)
TABELA 1043 PADARIA IMBABURA NO MERCADO DE ARROZ, POR TIPO, 2018-2032 (USD MIL)
TABELA 1044 ALIMENTOS PROCESSADOS DE IMBABURA NO MERCADO DE ARROZ, POR TIPO, 2018-2032 (MIL USD)
TABELA 1045 CONFEITARIA IMBABURA NO MERCADO DE ARROZ, POR TIPO, 2018-2032 (USD MIL)
TABELA 1046 FÓRMULA INFANTIL IMBABURA NO MERCADO DE ARROZ, POR TIPO, 2018-2032 (MIL USD)
TABELA 1047 PRODUTOS LATICÍNIOS IMBABURA NO MERCADO DE ARROZ, POR TIPO, 2018-2032 (MIL USD)
TABELA 1048 BEBIDAS DE IMBABURA NO MERCADO DE ARROZ, POR TIPO, 2018-2032 (USD MIL)
TABELA 1049 BEBIDAS SAUDÁVEIS IMBABURA NO MERCADO DE ARROZ, POR TIPO, 2018-2032 (MIL USD)
TABELA 1050 ALIMENTAÇÃO DE IMBABURA NO MERCADO DE ARROZ, POR CATEGORIA, 2018-2032 (MIL USD)
TABELA 1051 AVES IMBABURA NO MERCADO DE ARROZ, POR TIPO, 2018-2032 (MIL USD)
TABELA 1052 RUMINANTES IMBABURA NO MERCADO DE ARROZ, POR TIPO, 2018-2032 (USD MIL)
TABELA 1053 SUÍNOS IMBABURA NO MERCADO DE ARROZ, POR TIPO, 2018-2032 (USD MIL)
TABELA 1054 IMBABURA PET NO MERCADO DE ARROZ, POR TIPO, 2018-2032 (USD MIL)
TABELA 1055 ANIMAIS AQUÁTICOS IMBABURA NO MERCADO DE ARROZ, POR TIPO, 2018-2032 (USD MIL)
TABELA 1056 CRUSTÁCEOS IMBABURA NO MERCADO DE ARROZ, POR TIPO, 2018-2032 (MIL USD)
TABELA 1057 PEIXE IMBABURA NO MERCADO DE ARROZ, POR TIPO, 2018-2032 (MIL USD)
TABELA 1058 MOLUSCOS IMBABURA NO MERCADO DE ARROZ, POR TIPO, 2018-2032 (USD MIL)
TABELA 1059 ALIMENTOS PARA IMBABURA NO MERCADO DE ARROZ, POR FUNÇÃO DE SAÚDE, 2018-2032 (MIL USD)
TABELA 1060 PRODUTOS FARMACÊUTICOS IMBABURA NO MERCADO DE ARROZ, POR APLICAÇÃO, 2018-2032 (MIL USD)
TABELA 1061 INFECÇÕES UROGENITAIS POR IMBABURA NO MERCADO DE ARROZ, POR TIPO, 2018-2032 (MIL USD)
TABELA 1062 PRODUTOS FARMACÊUTICOS IMBABURA NO MERCADO DE ARROZ, POR FORMULÁRIO DE PRODUTO, 2018-2032 (MIL USD)
TABELA 1063 COSMÉTICOS E CUIDADOS PESSOAIS IMBABURA NO MERCADO DE ARROZ, POR CATEGORIA, 2018-2032 (MIL USD)
TABELA 1064 PRODUTOS DE CUIDADOS FACIAIS IMBABURA NO MERCADO DE ARROZ, POR TIPO, 2018-2032 (MIL USD)
TABELA 1065 PRODUTOS PARA CUIDADOS COM OS CABELOS IMBABURA NO MERCADO DE ARROZ, POR TIPO, 2018-2032 (MIL USD)
TABELA 1066 SUPLEMENTOS ALIMENTARES DE IMBABURA NO MERCADO DE ARROZ, POR TIPO, 2018-2032 (MIL USD)
TABELA 1067 SUPLEMENTOS DIETÉTICOS DE IMBABURA NO MERCADO DE ARROZ, POR FORMULÁRIO DE PRODUTO, 2018-2032 (MIL USD)
TABELA 1068 MERCADO DE ARROZ IMBABURA, POR CANAL DE DISTRIBUIÇÃO, 2018-2032 (MIL USD)
TABELA 1069 MERCADO DE ARROZ DE IMBABURA, POR CANAL DE DISTRIBUIÇÃO, 2018-2032 (TONELADAS)
TABELA 1070 MERCADO DE ARROZ IMBABURA, POR CANAL DE DISTRIBUIÇÃO, 2018-2032 (USD/KG)
TABELA 1071 IMBABURA OFFLINE NO MERCADO DE ARROZ, POR TIPO, 2018-2032 (USD MIL)
TABELA 1072 VENDAS NO VAREJO DE IMBABURA NO MERCADO DE ARROZ, POR TIPO DE CANAL, 2018-2032 (MIL USD)
TABELA 1073 IMBABURA ONLINE NO MERCADO DE ARROZ, POR TIPO, 2018-2032 (USD MIL)
TABELA 1074 MERCADO DE ARROZ DE MORONA SANTIAGO, POR TIPO, 2018-2032 (MIL USD)
TABELA 1075 MERCADO DE ARROZ DE MORONA SANTIAGO, POR TIPO, 2018-2032 (TONELADAS)
TABELA 1076 MERCADO DE ARROZ DE MORONA SANTIAGO, POR TIPO, 2018-2032 (USD/KG)
TABELA 1077 MERCADO DE ARROZ MORONA SANTIAGO, POR COR DE ARROZ, 2018-2032 (MIL USD)
TABELA 1078 MERCADO DE ARROZ MORONA SANTIAGO, POR COR DE ARROZ, 2018-2032 (TONELADAS)
TABELA 1079 MERCADO DE ARROZ MORONA SANTIAGO, POR COR DO ARROZ, 2018-2032 (USD/KG)
TABELA 1080 MERCADO DE ARROZ MORONA SANTIAGO, POR TAMANHO DO GRÃO/TAMANHO DO GRÃO, 2018-2032 (MIL USD)
TABELA 1081 MERCADO DE ARROZ DE MORONA SANTIAGO, POR TAMANHO DO GRÃO/TAMANHO DO GRÃO, 2018-2032 (TONELADAS)
TABELA 1082 MERCADO DE ARROZ MORONA SANTIAGO, POR TAMANHO DO GRÃO/TAMANHO DO GRÃO, 2018-2032 (USD/KG)
TABELA 1083 MERCADO DE ARROZ DE MORONA SANTIAGO, POR NATUREZA, 2018-2032 (MIL USD)
TABELA 1084 MERCADO DE ARROZ DE MORONA SANTIAGO, POR NATUREZA, 2018-2032 (TONELADAS)
TABELA 1085 MERCADO DE ARROZ DE MORONA SANTIAGO, POR NATUREZA, 2018-2032 (USD/KG)
TABELA 1086 MERCADO DE ARROZ DE MORONA SANTIAGO, POR TEOR DE AMIDO, 2018-2032 (MIL USD)
TABELA 1087 MERCADO DE ARROZ MORONA SANTIAGO, POR TEOR DE AMIDO, 2018-2032 (TONELADAS)
TABELA 1088 MERCADO DE ARROZ MORONA SANTIAGO, POR TEOR DE AMIDO, 2018-2032 (USD/KG)
TABELA 1089 MERCADO DE ARROZ DE MORONA SANTIAGO, POR FORMULÁRIO DE PROCESSAMENTO, 2018-2032 (MIL USD)
TABELA 1090 MERCADO DE ARROZ MORONA SANTIAGO, POR FORMULÁRIO DE PROCESSAMENTO, 2018-2032 (TONELADAS)
TABELA 1091 MERCADO DE ARROZ MORONA SANTIAGO, POR FORMULÁRIO DE PROCESSAMENTO, 2018-2032 (USD/KG)
TABELA 1092 MERCADO DE ARROZ DE MORONA SANTIAGO, POR GRAU DE MOAGEM, 2018-2032 (MIL USD)
TABELA 1093 MERCADO DE ARROZ DE MORONA SANTIAGO, POR GRAU DE MOAGEM, 2018-2032 (TONELADAS)
TABELA 1094 MERCADO DE ARROZ DE MORONA SANTIAGO, POR GRAU DE MOAGEM, 2018-2032 (USD/KG)
TABELA 1095 MERCADO DE ARROZ MORONA SANTIAGO, POR POLIMENTO, 2018-2032 (MIL USD)
TABELA 1096 MERCADO DE ARROZ MORONA SANTIAGO, POR POLIMENTO, 2018-2032 (TONELADAS)
TABELA 1097 MERCADO DE ARROZ MORONA SANTIAGO, POR POLIMENTO, 2018-2032 (USD/KG)
TABELA 1098 MERCADO DE ARROZ DE MORONA SANTIAGO, POR FORTIFICAÇÃO, 2018-2032 (MIL USD)
TABELA 1099 MERCADO DE ARROZ MORONA SANTIAGO, POR FORTIFICAÇÃO, 2018-2032 (TONELADAS)
TABELA 1100 MERCADO DE ARROZ MORONA SANTIAGO, POR FORTIFICAÇÃO, 2018-2032 (USD/KG)
TABELA 1101 MORONA SANTIAGO FORTIFICADO NO MERCADO DE ARROZ, POR PROCESSO, 2018-2032 (USD MIL)
TABELA 1102 MERCADO DE ARROZ MORONA SANTIAGO, POR AROMA, 2018-2032 (MIL USD)
TABELA 1103 MERCADO DE ARROZ MORONA SANTIAGO, DA AROMA, 2018-2032 (TONELADAS)
TABELA 1104 MERCADO DE ARROZ MORONA SANTIAGO, DA AROMA, 2018-2032 (USD/KG)
TABELA 1105 ARROZ AROMÁTICO MORONA SANTIAGO NO MERCADO DE ARROZ, POR TIPO, 2018-2032 (MIL USD)
TABELA 1106 MERCADO DE ARROZ DE MORONA SANTIAGO, POR DERIVADOS DE ARROZ, 2018-2032 (MIL USD)
TABELA 1107 MERCADO DE ARROZ DE MORONA SANTIAGO, POR DERIVADOS DE ARROZ, 2018-2032 (TONELADAS)
TABELA 1108 MERCADO DE ARROZ DE MORONA SANTIAGO, POR DERIVADOS DE ARROZ, 2018-2032 (USD/KG)
TABELA 1109 MERCADO DE ARROZ DE MORONA SANTIAGO, POR USUÁRIO FINAL, 2018-2032 (MIL USD)
TABELA 1110 MERCADO DE ARROZ DE MORONA SANTIAGO, POR USUÁRIO FINAL, 2018-2032 (TONELADAS)
TABELA 1111 MERCADO DE ARROZ MORONA SANTIAGO, POR USUÁRIO FINAL, 2018-2032 (USD/KG)
TABELA 1112 ALIMENTOS E BEBIDAS DE MORONA SANTIAGO NO MERCADO DE ARROZ, POR TIPO, 2018-2032 (MIL USD)
TABELA 1113 ALIMENTOS DE MORONA SANTIAGO NO MERCADO DE ARROZ, POR TIPO, 2018-2032 (MIL USD)
TABELA 1114 PADARIA MORONA SANTIAGO NO MERCADO DE ARROZ, POR TIPO, 2018-2032 (USD MIL)
TABELA 1115 ALIMENTOS PROCESSADOS NO MERCADO DE ARROZ DE MORONA SANTIAGO, POR TIPO, 2018-2032 (MIL USD)
TABELA 1116 CONFEITARIA MORONA SANTIAGO NO MERCADO DE ARROZ, POR TIPO, 2018-2032 (USD MIL)
TABELA 1117 FÓRMULA INFANTIL MORONA SANTIAGO NO MERCADO DE ARROZ, POR TIPO, 2018-2032 (MIL USD)
TABELA 1118 PRODUTOS LÁCTEOS DE MORONA SANTIAGO NO MERCADO DE ARROZ, POR TIPO, 2018-2032 (MIL USD)
TABELA 1119 BEBIDAS MORONA SANTIAGO NO MERCADO DE ARROZ, POR TIPO, 2018-2032 (USD MIL)
TABELA 1120 BEBIDAS SAUDÁVEIS MORONA SANTIAGO NO MERCADO DE ARROZ, POR TIPO, 2018-2032 (MIL USD)
TABELA 1121 RAÇÃO MORONA SANTIAGO NO MERCADO DE ARROZ, POR CATEGORIA, 2018-2032 (MIL USD)
TABELA 1122: AVES DE MORONA SANTIAGO NO MERCADO DE ARROZ, POR TIPO, 2018-2032 (MIL USD)
TABELA 1123 RUMINANTES DE MORONA SANTIAGO NO MERCADO DE ARROZ, POR TIPO, 2018-2032 (MIL USD)
TABELA 1124 SUÍNOS MORONA SANTIAGO NO MERCADO DE ARROZ, POR TIPO, 2018-2032 (USD MIL)
TABELA 1125 MORONA SANTIAGO PET NO MERCADO DE ARROZ, POR TIPO, 2018-2032 (USD MIL)
TABELA 1126 MORONA SANTIAGO ANIMAIS AQUÁTICOS NO MERCADO DE ARROZ, POR TIPO, 2018-2032 (MIL USD)
TABELA 1127 CRUSTÁCEOS DE MORONA SANTIAGO NO MERCADO DE ARROZ, POR TIPO, 2018-2032 (MIL USD)
TABELA 1128 MERCADO DE PEIXE DE MORONA SANTIAGO NO ARROZ, POR TIPO, 2018-2032 (MIL USD)
TABELA 1129 MOLUSCOS MORONA SANTIAGO NO MERCADO DE ARROZ, POR TIPO, 2018-2032 (USD MIL)
TABELA 1130 MORONA SANTIAGO ALIMENTOS NO MERCADO DE ARROZ, POR FUNÇÃO DE SAÚDE, 2018-2032 (MIL USD)
TABELA 1131 PRODUTOS FARMACÊUTICOS MORONA SANTIAGO NO MERCADO DE ARROZ, POR APLICAÇÃO, 2018-2032 (MIL USD)
TABELA 1132 INFECÇÕES UROGENITAIS DE MORONA SANTIAGO NO MERCADO DE ARROZ, POR TIPO, 2018-2032 (MIL USD)
TABELA 1133 MORONA SANTIAGO PHARMACEUTICALS NO MERCADO DE ARROZ, POR FORMULÁRIO DE PRODUTO, 2018-2032 (MIL USD)
TABELA 1134 MORONA SANTIAGO COSMÉTICOS E CUIDADOS PESSOAIS NO MERCADO DE ARROZ, POR CATEGORIA, 2018-2032 (MIL USD)
TABELA 1135 PRODUTOS DE CUIDADOS FACIAIS MORONA SANTIAGO NO MERCADO DE ARROZ, POR TIPO, 2018-2032 (MIL USD)
TABELA 1136 PRODUTOS PARA CUIDADOS COM OS CABELOS MORONA SANTIAGO NO MERCADO DE ARROZ, POR TIPO, 2018-2032 (MIL USD)
TABELA 1137 SUPLEMENTOS ALIMENTARES MORONA SANTIAGO NO MERCADO DE ARROZ, POR TIPO, 2018-2032 (MIL USD)
TABELA 1138 SUPLEMENTOS ALIMENTARES MORONA SANTIAGO NO MERCADO DE ARROZ, POR FORMULÁRIO DE PRODUTO, 2018-2032 (MIL USD)
TABELA 1139 MERCADO DE ARROZ DE MORONA SANTIAGO, POR CANAL DE DISTRIBUIÇÃO, 2018-2032 (MIL USD)
TABELA 1140 MERCADO DE ARROZ MORONA SANTIAGO, POR CANAL DE DISTRIBUIÇÃO, 2018-2032 (TONELADAS)
TABELA 1141 MERCADO DE ARROZ DE MORONA SANTIAGO, POR CANAL DE DISTRIBUIÇÃO, 2018-2032 (USD/KG)
TABELA 1142 MORONA SANTIAGO OFFLINE NO MERCADO DE ARROZ, POR TIPO, 2018-2032 (USD MIL)
TABELA 1143 VENDAS NO VAREJO DE MORONA SANTIAGO NO MERCADO DE ARROZ, POR TIPO DE CANAL, 2018-2032 (MIL USD)
TABELA 1144 MORONA SANTIAGO ONLINE NO MERCADO DE ARROZ, POR TIPO, 2018-2032 (USD MIL)
TABELA 1145 MERCADO DE ARROZ DE NAPO, POR TIPO, 2018-2032 (MIL USD)
TABELA 1146 MERCADO DE ARROZ DE NAPO, POR TIPO, 2018-2032 (TONELADAS)
TABELA 1147 MERCADO DE ARROZ NAPO, POR TIPO, 2018-2032 (USD/KG)
TABELA 1148 MERCADO DE ARROZ NAPO, POR COR DE ARROZ, 2018-2032 (MIL USD)
TABELA 1149 MERCADO DE ARROZ DE NAPO, POR COR DE ARROZ, 2018-2032 (TONELADAS)
TABELA 1150 MERCADO DE ARROZ NAPO, POR COR DE ARROZ, 2018-2032 (USD/KG)
TABELA 1151 MERCADO DE ARROZ NAPO, POR TAMANHO DO GRÃO/TAMANHO DO GRÃO, 2018-2032 (MIL USD)
TABELA 1152 MERCADO DE ARROZ DE NAPO, POR TAMANHO DO GRÃO/TAMANHO DO GRÃO, 2018-2032 (TONELADAS)
TABELA 1153 MERCADO DE ARROZ NAPO, POR TAMANHO DO GRÃO/TAMANHO DO GRÃO, 2018-2032 (USD/KG)
TABELA 1154 MERCADO DE ARROZ DE NAPO, POR NATUREZA, 2018-2032 (MIL USD)
TABELA 1155 MERCADO DE ARROZ DE NAPO, POR NATUREZA, 2018-2032 (TONELADAS)
TABELA 1156 MERCADO DE ARROZ NAPO, POR NATUREZA, 2018-2032 (USD/KG)
TABELA 1157 MERCADO DE ARROZ NAPO, POR TEOR DE AMIDO, 2018-2032 (MIL USD)
TABELA 1158 MERCADO DE ARROZ DE NAPO, POR TEOR DE AMIDO, 2018-2032 (TONELADAS)
TABELA 1159 MERCADO DE ARROZ NAPO, POR TEOR DE AMIDO, 2018-2032 (USD/KG)
TABELA 1160 MERCADO DE ARROZ DE NAPO, POR FORMULÁRIO DE PROCESSAMENTO, 2018-2032 (MIL USD)
TABELA 1161 MERCADO DE ARROZ DE NAPO, POR FORMULÁRIO DE PROCESSAMENTO, 2018-2032 (TONELADAS)
TABELA 1162 MERCADO DE ARROZ NAPO, POR FORMULÁRIO DE PROCESSAMENTO, 2018-2032 (USD/KG)
TABELA 1163 MERCADO DE ARROZ NAPO, POR GRAU DE MOAGEM, 2018-2032 (MIL USD)
TABELA 1164 MERCADO DE ARROZ DE NAPO, POR GRAU DE MOAGEM, 2018-2032 (TONELADAS)
TABELA 1165 MERCADO DE ARROZ NAPO, POR GRAU DE MOAGEM, 2018-2032 (USD/KG)
TABELA 1166 MERCADO DE ARROZ DE NAPO, POR POLIMENTO, 2018-2032 (MIL USD)
TABELA 1167 MERCADO DE ARROZ DE NAPO, POR POLIMENTO, 2018-2032 (TONELADAS)
TABELA 1168 MERCADO DE ARROZ NAPO, POR POLIMENTO, 2018-2032 (USD/KG)
TABELA 1169 MERCADO DE ARROZ DE NAPO, POR FORTIFICAÇÃO, 2018-2032 (MIL USD)
TABELA 1170 MERCADO DE ARROZ DE NAPO, POR FORTIFICAÇÃO, 2018-2032 (TONELADAS)
TABELA 1171 MERCADO DE ARROZ DE NAPO, POR FORTIFICAÇÃO, 2018-2032 (USD/KG)
TABELA 1172 NAPO FORTIFICADO NO MERCADO DE ARROZ, POR PROCESSO, 2018-2032 (MIL USD)
TABELA 1173 MERCADO DE ARROZ NAPO, POR AROMA, 2018-2032 (MIL USD)
TABELA 1174 MERCADO DE ARROZ DE NAPO, POR AROMA, 2018-2032 (TONELADAS)
TABELA 1175 MERCADO DE ARROZ NAPO, POR AROMA, 2018-2032 (USD/KG)
TABELA 1176 ARROZ AROMÁTICO NAPO NO MERCADO DE ARROZ, POR TIPO, 2018-2032 (MIL USD)
TABELA 1177 MERCADO DE ARROZ DE NAPO, POR DERIVADOS DE ARROZ, 2018-2032 (MIL USD)
TABELA 1178 MERCADO DE ARROZ DE NAPO, POR DERIVADOS DE ARROZ, 2018-2032 (TONELADAS)
TABELA 1179 MERCADO DE ARROZ NAPO, POR DERIVADOS DE ARROZ, 2018-2032 (USD/KG)
TABELA 1180 MERCADO DE ARROZ NAPO, POR USUÁRIO FINAL, 2018-2032 (MIL USD)
TABELA 1181 MERCADO DE ARROZ DE NAPO, POR USUÁRIO FINAL, 2018-2032 (TONELADAS)
TABELA 1182 MERCADO DE ARROZ NAPO, POR USUÁRIO FINAL, 2018-2032 (USD/KG)
TABELA 1183 ALIMENTOS E BEBIDAS DE NAPO NO MERCADO DE ARROZ, POR TIPO, 2018-2032 (MIL USD)
TABELA 1184 ALIMENTOS NAPO NO MERCADO DE ARROZ, POR TIPO, 2018-2032 (MIL USD)
TABELA 1185 PADARIA NAPO NO MERCADO DE ARROZ, POR TIPO, 2018-2032 (MIL USD)
TABELA 1186 ALIMENTOS PROCESSADOS NO MERCADO DE ARROZ DA NAPO, POR TIPO, 2018-2032 (MIL USD)
TABELA 1187 DOCES NAPO NO MERCADO DE ARROZ, POR TIPO, 2018-2032 (MIL USD)
TABELA 1188 FÓRMULA INFANTIL NAPO NO MERCADO DE ARROZ, POR TIPO, 2018-2032 (MIL USD)
TABELA 1189 PRODUTOS LÁCTEOS NAPO NO MERCADO DE ARROZ, POR TIPO, 2018-2032 (MIL USD)
TABELA 1190 BEBIDAS NAPO NO MERCADO DE ARROZ, POR TIPO, 2018-2032 (MIL USD)
TABELA 1191 BEBIDAS SAUDÁVEIS NAPO NO MERCADO DE ARROZ, POR TIPO, 2018-2032 (MIL USD)
TABELA 1192 RAÇÃO NAPO NO MERCADO DE ARROZ, POR CATEGORIA, 2018-2032 (MIL USD)
TABELA 1193 AVES NAPO NO MERCADO DE ARROZ, POR TIPO, 2018-2032 (MIL USD)
TABELA 1194 RUMINANTES NAPO NO MERCADO DE ARROZ, POR TIPO, 2018-2032 (MIL USD)
TABELA 1195 SUÍNOS NAPO NO MERCADO DE ARROZ, POR TIPO, 2018-2032 (MIL USD)
TABELA 1196 NAPO PET NO MERCADO DE ARROZ, POR TIPO, 2018-2032 (MIL USD)
TABELA 1197 ANIMAIS AQUÁTICOS NAPO NO MERCADO DE ARROZ, POR TIPO, 2018-2032 (MIL USD)
TABELA 1198 CRUSTÁCEOS DE NAPO NO MERCADO DE ARROZ, POR TIPO, 2018-2032 (MIL USD)
TABELA 1199 PEIXE NAPO NO MERCADO DE ARROZ, POR TIPO, 2018-2032 (MIL USD)
TABELA 1200 MOLUSCOS NAPO NO MERCADO DE ARROZ, POR TIPO, 2018-2032 (MIL USD)
TABELA 1201 RAÇÃO NAPO NO MERCADO DE ARROZ, POR FUNÇÃO DE SAÚDE, 2018-2032 (MIL USD)
TABELA 1202 PRODUTOS FARMACÊUTICOS NAPO NO MERCADO DE ARROZ, POR APLICAÇÃO, 2018-2032 (MIL USD)
TABELA 1203 INFECÇÕES UROGENITAIS DE NAPO NO MERCADO DE ARROZ, POR TIPO, 2018-2032 (MIL USD)
TABELA 1204 PRODUTOS FARMACÊUTICOS NAPO NO MERCADO DE ARROZ, POR FORMULÁRIO DE PRODUTO, 2018-2032 (MIL USD)
TABELA 1205 NAPO COSMÉTICOS E CUIDADOS PESSOAIS NO MERCADO DE ARROZ, POR CATEGORIA, 2018-2032 (MIL USD)
TABELA 1206 PRODUTOS DE CUIDADOS FACIAIS NAPO NO MERCADO DE ARROZ, POR TIPO, 2018-2032 (MIL USD)
TABELA 1207 PRODUTOS PARA CUIDADOS COM OS CABELOS NAPO NO MERCADO DE ARROZ, POR TIPO, 2018-2032 (MIL USD)
TABELA 1208 SUPLEMENTOS ALIMENTARES NAPO NO MERCADO DE ARROZ, POR TIPO, 2018-2032 (MIL USD)
TABELA 1209 SUPLEMENTOS ALIMENTARES NAPO NO MERCADO DE ARROZ, POR FORMULÁRIO DE PRODUTO, 2018-2032 (MIL USD)
TABELA 1210 MERCADO DE ARROZ DE NAPO, POR CANAL DE DISTRIBUIÇÃO, 2018-2032 (MIL USD)
TABELA 1211 MERCADO DE ARROZ DE NAPO, POR CANAL DE DISTRIBUIÇÃO, 2018-2032 (TONELADAS)
TABELA 1212 MERCADO DE ARROZ NAPO, POR CANAL DE DISTRIBUIÇÃO, 2018-2032 (USD/KG)
TABELA 1213 NAPO OFFLINE NO MERCADO DE ARROZ, POR TIPO, 2018-2032 (USD MIL)
TABELA 1214 VENDAS NO VAREJO DA NAPO NO MERCADO DE ARROZ, POR TIPO DE CANAL, 2018-2032 (MIL USD)
TABELA 1215 NAPO ONLINE NO MERCADO DE ARROZ, POR TIPO, 2018-2032 (USD MIL)
TABELA 1216 MERCADO DE ARROZ DE ORELLANA, POR TIPO, 2018-2032 (MIL USD)
TABELA 1217 MERCADO DE ARROZ DE ORELLANA, POR TIPO, 2018-2032 (TONELADAS)
TABELA 1218 MERCADO DE ARROZ DE ORELLANA, POR TIPO, 2018-2032 (USD/KG)
TABELA 1219 MERCADO DE ARROZ DE ORELLANA, POR COR DE ARROZ, 2018-2032 (MIL USD)
TABELA 1220 MERCADO DE ARROZ DE ORELLANA, POR COR DE ARROZ, 2018-2032 (TONELADAS)
TABELA 1221 MERCADO DE ARROZ DE ORELLANA, POR COR DE ARROZ, 2018-2032 (USD/KG)
TABELA 1222 MERCADO DE ARROZ DE ORELLANA, POR TAMANHO DO GRÃO/TAMANHO DO GRÃO, 2018-2032 (MIL USD)
TABELA 1223 MERCADO DE ARROZ DE ORELLANA, POR TAMANHO DO GRÃO/TAMANHO DO GRÃO, 2018-2032 (TONELADAS)
TABELA 1224 MERCADO DE ARROZ DE ORELLANA, POR TAMANHO DO GRÃO/TAMANHO DO GRÃO, 2018-2032 (USD/KG)
TABELA 1225 MERCADO DE ARROZ DE ORELLANA, POR NATUREZA, 2018-2032 (MIL USD)
TABELA 1226 MERCADO DE ARROZ DE ORELLANA, POR NATUREZA, 2018-2032 (TONELADAS)
TABELA 1227 MERCADO DE ARROZ DE ORELLANA, POR NATUREZA, 2018-2032 (USD/KG)
TABELA 1228 MERCADO DE ARROZ DE ORELLANA, POR TEOR DE AMIDO, 2018-2032 (MIL USD)
TABELA 1229 MERCADO DE ARROZ DE ORELLANA, POR TEOR DE AMIDO, 2018-2032 (TONELADAS)
TABELA 1230 MERCADO DE ARROZ DE ORELLANA, POR TEOR DE AMIDO, 2018-2032 (USD/KG)
TABELA 1231 MERCADO DE ARROZ DE ORELLANA, POR FORMULÁRIO DE PROCESSAMENTO, 2018-2032 (MIL USD)
TABELA 1232 MERCADO DE ARROZ DE ORELLANA, POR FORMULÁRIO DE PROCESSAMENTO, 2018-2032 (TONELADAS)
TABELA 1233 MERCADO DE ARROZ DE ORELLANA, POR FORMULÁRIO DE PROCESSAMENTO, 2018-2032 (USD/KG)
TABELA 1234 MERCADO DE ARROZ DE ORELLANA, POR GRAU DE MOAGEM, 2018-2032 (MIL USD)
TABELA 1235 MERCADO DE ARROZ DE ORELLANA, POR GRAU DE MOAGEM, 2018-2032 (TONELADAS)
TABELA 1236 MERCADO DE ARROZ DE ORELLANA, POR GRAU DE MOAGEM, 2018-2032 (USD/KG)
TABELA 1237 MERCADO DE ARROZ DE ORELLANA, POR POLIMENTO, 2018-2032 (MIL USD)
TABELA 1238 MERCADO DE ARROZ DE ORELLANA, POR POLIMENTO, 2018-2032 (TONELADAS)
TABELA 1239 MERCADO DE ARROZ DE ORELLANA, POR POLIMENTO, 2018-2032 (USD/KG)
TABELA 1240 MERCADO DE ARROZ DE ORELLANA, POR FORTIFICAÇÃO, 2018-2032 (MIL USD)
TABELA 1241 MERCADO DE ARROZ DE ORELLANA, POR FORTIFICAÇÃO, 2018-2032 (TONELADAS)
TABELA 1242 MERCADO DE ARROZ DE ORELLANA, POR FORTIFICAÇÃO, 2018-2032 (USD/KG)
TABELA 1243 ORELLANA FORTIFICADA NO MERCADO DE ARROZ, POR PROCESSO, 2018-2032 (USD MIL)
TABELA 1244 MERCADO DE ARROZ DE ORELLANA, POR AROMA, 2018-2032 (MIL USD)
TABELA 1245 MERCADO DE ARROZ DE ORELLANA, DA AROMA, 2018-2032 (TONELADAS)
TABELA 1246 MERCADO DE ARROZ DE ORELLANA, POR AROMA, 2018-2032 (USD/KG)
TABELA 1247 ARROZ AROMÁTICO ORELLANA NO MERCADO DE ARROZ, POR TIPO, 2018-2032 (MIL USD)
TABELA 1248 MERCADO DE ARROZ DE ORELLANA, POR DERIVADOS DE ARROZ, 2018-2032 (MIL USD)
TABELA 1249 MERCADO DE ARROZ DE ORELLANA, POR DERIVADOS DE ARROZ, 2018-2032 (TONELADAS)
TABELA 1250 MERCADO DE ARROZ DE ORELLANA, POR DERIVADOS DE ARROZ, 2018-2032 (USD/KG)
TABELA 1251 MERCADO DE ARROZ DE ORELLANA, POR USUÁRIO FINAL, 2018-2032 (MIL USD)
TABELA 1252 MERCADO DE ARROZ DE ORELLANA, POR USUÁRIO FINAL, 2018-2032 (TONELADAS)
TABELA 1253 MERCADO DE ARROZ DE ORELLANA, POR USUÁRIO FINAL, 2018-2032 (USD/KG)
TABELA 1254 ALIMENTOS E BEBIDAS DE ORELLANA NO MERCADO DE ARROZ, POR TIPO, 2018-2032 (MIL USD)
TABELA 1255 ALIMENTOS DE ORELLANA NO MERCADO DE ARROZ, POR TIPO, 2018-2032 (MIL USD)
TABELA 1256 PADARIA ORELLANA NO MERCADO DE ARROZ, POR TIPO, 2018-2032 (MIL USD)
TABELA 1257 ALIMENTOS PROCESSADOS DE ORELLANA NO MERCADO DE ARROZ, POR TIPO, 2018-2032 (MIL USD)
TABELA 1258 CONFEITARIA ORELLANA NO MERCADO DE ARROZ, POR TIPO, 2018-2032 (USD MIL)
TABELA 1259 FÓRMULA INFANTIL ORELLANA NO MERCADO DE ARROZ, POR TIPO, 2018-2032 (MIL USD)
TABELA 1260 PRODUTOS LÁCTEOS DE ORELLANA NO MERCADO DE ARROZ, POR TIPO, 2018-2032 (MIL USD)
TABELA 1261 BEBIDAS ORELLANA NO MERCADO DE ARROZ, POR TIPO, 2018-2032 (MIL USD)
TABELA 1262 BEBIDAS SAUDÁVEIS ORELLANA NO MERCADO DE ARROZ, POR TIPO, 2018-2032 (MIL USD)
TABELA 1263 RAÇÃO ORELLANA NO MERCADO DE ARROZ, POR CATEGORIA, 2018-2032 (MIL USD)
TABELA 1264 AVES DE ORELLANA NO MERCADO DE ARROZ, POR TIPO, 2018-2032 (MIL USD)
TABELA 1265 RUMINANTES DE ORELLANA NO MERCADO DE ARROZ, POR TIPO, 2018-2032 (MIL USD)
TABELA 1266 SUÍNOS ORELLANA NO MERCADO DE ARROZ, POR TIPO, 2018-2032 (MIL USD)
TABELA 1267 ORELLANA PET NO MERCADO DE ARROZ, POR TIPO, 2018-2032 (USD MIL)
TABELA 1268 ANIMAIS AQUÁTICOS DE ORELLANA NO MERCADO DE ARROZ, POR TIPO, 2018-2032 (MIL USD)
TABELA 1269 CRUSTÁCEOS DE ORELLANA NO MERCADO DE ARROZ, POR TIPO, 2018-2032 (MIL USD)
TABELA 1270 PEIXE DE ORELLANA NO MERCADO DE ARROZ, POR TIPO, 2018-2032 (MIL USD)
TABELA 1271 MOLUSCOS DE ORELLANA NO MERCADO DE ARROZ, POR TIPO, 2018-2032 (MIL USD)
TABELA 1272 RAÇÃO ORELLANA NO MERCADO DE ARROZ, POR FUNÇÃO DE SAÚDE, 2018-2032 (MIL USD)
TABELA 1273 PRODUTOS FARMACÊUTICOS ORELLANA NO MERCADO DE ARROZ, POR APLICAÇÃO, 2018-2032 (MIL USD)
TABELA 1274 INFECÇÕES UROGENITAIS DE ORELLANA NO MERCADO DE ARROZ, POR TIPO, 2018-2032 (MIL USD)
TABELA 1275 ORELLANA PHARMACEUTICALS NO MERCADO DE ARROZ, POR FORMULÁRIO DE PRODUTO, 2018-2032 (MIL USD)
TABELA 1276 ORELLANA COSMÉTICOS E CUIDADOS PESSOAIS NO MERCADO DE ARROZ, POR CATEGORIA, 2018-2032 (MIL USD)
TABELA 1277 PRODUTOS DE CUIDADOS FACIAIS ORELLANA NO MERCADO DE ARROZ, POR TIPO, 2018-2032 (MIL USD)
TABELA 1278 PRODUTOS PARA CUIDADOS COM OS CABELOS DE ORELLANA NO MERCADO DE ARROZ, POR TIPO, 2018-2032 (MIL USD)
TABELA 1279 SUPLEMENTOS ALIMENTARES ORELLANA NO MERCADO DE ARROZ, POR TIPO, 2018-2032 (MIL USD)
TABELA 1280 SUPLEMENTOS ALIMENTARES ORELLANA NO MERCADO DE ARROZ, POR FORMA DE PRODUTO, 2018-2032 (MIL USD)
TABELA 1281 MERCADO DE ARROZ DE ORELLANA, POR CANAL DE DISTRIBUIÇÃO, 2018-2032 (MIL USD)
TABELA 1282 MERCADO DE ARROZ DE ORELLANA, POR CANAL DE DISTRIBUIÇÃO, 2018-2032 (TONELADAS)
TABELA 1283 MERCADO DE ARROZ DE ORELLANA, POR CANAL DE DISTRIBUIÇÃO, 2018-2032 (USD/KG)
TABELA 1284 ORELLANA OFFLINE NO MERCADO DE ARROZ, POR TIPO, 2018-2032 (USD MIL)
TABELA 1285 VENDAS NO VAREJO DE ORELLANA NO MERCADO DE ARROZ, POR TIPO DE CANAL, 2018-2032 (MIL USD)
TABELA 1286 ORELLANA ONLINE NO MERCADO DE ARROZ, POR TIPO, 2018-2032 (USD MIL)
TABELA 1287 MERCADO DE ARROZ PASTAZA, POR TIPO, 2018-2032 (MIL USD)
TABELA 1288 MERCADO DE ARROZ PASTAZA, POR TIPO, 2018-2032 (TONELADAS)
TABELA 1289 MERCADO DE ARROZ PASTAZA, POR TIPO, 2018-2032 (USD/KG)
TABELA 1290 MERCADO DE ARROZ PASTAZA, POR COR DE ARROZ, 2018-2032 (USD MIL)
TABELA 1291 MERCADO DE ARROZ PASTAZA, POR COR DE ARROZ, 2018-2032 (TONELADAS)
TABELA 1292 MERCADO DE ARROZ PASTAZA, POR COR DE ARROZ, 2018-2032 (USD/KG)
TABELA 1293 MERCADO DE ARROZ PASTAZA, POR TAMANHO DO GRÃO/TAMANHO DO GRÃO, 2018-2032 (MIL USD)
TABELA 1294 MERCADO DE ARROZ PASTAZA, POR TAMANHO DO GRÃO/TAMANHO DO GRÃO, 2018-2032 (TONELADAS)
TABELA 1295 MERCADO DE ARROZ PASTAZA, POR TAMANHO DO GRÃO/TAMANHO DO GRÃO, 2018-2032 (USD/KG)
TABELA 1296 MERCADO DE ARROZ PASTAZA, POR NATUREZA, 2018-2032 (MIL USD)
TABELA 1297 MERCADO DE ARROZ PASTAZA, POR NATUREZA, 2018-2032 (TONELADAS)
TABELA 1298 MERCADO DE ARROZ PASTAZA, POR NATUREZA, 2018-2032 (USD/KG)
TABELA 1299 MERCADO DE ARROZ PASTAZA, POR TEOR DE AMIDO, 2018-2032 (MIL USD)
TABELA 1300 MERCADO DE ARROZ PASTAZA, POR TEOR DE AMIDO, 2018-2032 (TONELADAS)
TABELA 1301 MERCADO DE ARROZ PASTAZA, POR TEOR DE AMIDO, 2018-2032 (USD/KG)
TABELA 1302 MERCADO DE ARROZ PASTAZA, POR FORMULÁRIO DE PROCESSAMENTO, 2018-2032 (MIL USD)
TABELA 1303 MERCADO DE ARROZ PASTAZA, POR FORMULÁRIO DE PROCESSAMENTO, 2018-2032 (TONELADAS)
TABELA 1304 MERCADO DE ARROZ PASTAZA, POR FORMULÁRIO DE PROCESSAMENTO, 2018-2032 (USD/KG)
TABELA 1305 MERCADO DE ARROZ PASTAZA, POR GRAU DE MOAGEM, 2018-2032 (MIL USD)
TABELA 1306 MERCADO DE ARROZ PASTAZA, POR GRAU DE MOAGEM, 2018-2032 (TONELADAS)
TABELA 1307 MERCADO DE ARROZ PASTAZA, POR GRAU DE MOAGEM, 2018-2032 (USD/KG)
TABELA 1308 MERCADO DE ARROZ PASTAZA, POR POLIMENTO, 2018-2032 (MIL USD)
TABELA 1309 MERCADO DE ARROZ PASTAZA, POR POLIMENTO, 2018-2032 (TONELADAS)
TABELA 1310 MERCADO DE ARROZ PASTAZA, POR POLIMENTO, 2018-2032 (USD/KG)
TABELA 1311 MERCADO DE ARROZ PASTAZA, POR FORTIFICAÇÃO, 2018-2032 (MIL USD)
TABELA 1312 MERCADO DE ARROZ PASTAZA, POR FORTIFICAÇÃO, 2018-2032 (TONELADAS)
TABELA 1313 MERCADO DE ARROZ PASTAZA, POR FORTIFICAÇÃO, 2018-2032 (USD/KG)
TABELA 1314 PASTAZA FORTIFICADA NO MERCADO DE ARROZ, POR PROCESSO, 2018-2032 (USD MIL)
TABELA 1315 MERCADO DE ARROZ PASTAZA, POR AROMA, 2018-2032 (USD MIL)
TABELA 1316 MERCADO DE ARROZ PASTAZA, DA AROMA, 2018-2032 (TONELADAS)
TABELA 1317 MERCADO DE ARROZ PASTAZA, POR AROMA, 2018-2032 (USD/KG)
TABELA 1318 ARROZ AROMÁTICO PASTAZA NO MERCADO DE ARROZ, POR TIPO, 2018-2032 (MIL USD)
TABELA 1319 MERCADO DE ARROZ PASTAZA, POR DERIVADOS DE ARROZ, 2018-2032 (MIL USD)
TABELA 1320 MERCADO DE ARROZ PASTAZA, POR DERIVADOS DE ARROZ, 2018-2032 (TONELADAS)
TABELA 1321 MERCADO DE ARROZ PASTAZA, POR DERIVADOS DE ARROZ, 2018-2032 (USD/KG)
TABELA 1322 MERCADO DE ARROZ PASTAZA, POR USUÁRIO FINAL, 2018-2032 (MIL USD)
TABELA 1323 MERCADO DE ARROZ PASTAZA, POR USUÁRIO FINAL, 2018-2032 (TONELADAS)
TABELA 1324 MERCADO DE ARROZ PASTAZA, POR USUÁRIO FINAL, 2018-2032 (USD/KG)
TABELA 1325 PASTAZA ALIMENTOS E BEBIDAS NO MERCADO DE ARROZ, POR TIPO, 2018-2032 (USD MIL)
TABELA 1326 ALIMENTOS PASTAZA NO MERCADO DE ARROZ, POR TIPO, 2018-2032 (USD MIL)
TABELA 1327 PADARIA PASTAZA NO MERCADO DE ARROZ, POR TIPO, 2018-2032 (USD MIL)
TABELA 1328 ALIMENTOS PROCESSADOS DE PASTAZA NO MERCADO DE ARROZ, POR TIPO, 2018-2032 (MIL USD)
TABELA 1329 CONFEITARIA PASTAZA NO MERCADO DE ARROZ, POR TIPO, 2018-2032 (USD MIL)
TABELA 1330 FÓRMULA INFANTIL PASTAZA NO MERCADO DE ARROZ, POR TIPO, 2018-2032 (MIL USD)
TABELA 1331 PRODUTOS LÁCTEOS PASTAZA NO MERCADO DE ARROZ, POR TIPO, 2018-2032 (MIL USD)
TABELA 1332 BEBIDAS PASTAZA NO MERCADO DE ARROZ, POR TIPO, 2018-2032 (USD MIL)
TABELA 1333 BEBIDAS SAUDÁVEIS PASTAZA NO MERCADO DE ARROZ, POR TIPO, 2018-2032 (MIL USD)
TABELA 1334 RAÇÃO PASTAZA NO MERCADO DE ARROZ, POR CATEGORIA, 2018-2032 (MIL USD)
TABELA 1335 PASTAZA DE AVES NO MERCADO DE ARROZ, POR TIPO, 2018-2032 (USD MIL)
TABELA 1336 RUMINANTES DE PASTAZA NO MERCADO DE ARROZ, POR TIPO, 2018-2032 (USD MIL)
TABELA 1337 PASTAZA SUÍNOS NO MERCADO DE ARROZ, POR TIPO, 2018-2032 (USD MIL)
TABELA 1338 PASTAZA PET NO MERCADO DE ARROZ, POR TIPO, 2018-2032 (USD MIL)
TABELA 1339 PASTAZA ANIMAIS AQUÁTICOS NO MERCADO DE ARROZ, POR TIPO, 2018-2032 (USD MIL)
TABELA 1340 CRUSTÁCEOS DE PASTAZA NO MERCADO DE ARROZ, POR TIPO, 2018-2032 (MIL USD)
TABELA 1341 PEIXE PASTAZA NO MERCADO DE ARROZ, POR TIPO, 2018-2032 (MIL USD)
TABELA 1342 MOLUSCOS PASTAZA NO MERCADO DE ARROZ, POR TIPO, 2018-2032 (USD MIL)
TABELA 1343 ALIMENTOS PARA PASTAZA NO MERCADO DE ARROZ, POR FUNÇÃO DE SAÚDE, 2018-2032 (MIL USD)
TABELA 1344 PASTAZA PHARMACEUTICALS NO MERCADO DE ARROZ, POR APLICAÇÃO, 2018-2032 (MIL USD)
TABELA 1345 INFECÇÕES UROGENITAIS POR PASTAZA NO MERCADO DE ARROZ, POR TIPO, 2018-2032 (MIL USD)
TABELA 1346 PASTAZA PHARMACEUTICALS NO MERCADO DE ARROZ, POR FORMULÁRIO DE PRODUTO, 2018-2032 (MIL USD)
TABELA 1347 PASTAZA COSMÉTICOS E CUIDADOS PESSOAIS NO MERCADO DE ARROZ, POR CATEGORIA, 2018-2032 (MIL USD)
TABELA 1348 PRODUTOS PARA CUIDADOS FACIAIS PASTAZA NO MERCADO DE ARROZ, POR TIPO, 2018-2032 (MIL USD)
TABELA 1349 PRODUTOS PARA CUIDADOS COM OS CABELOS PASTAZA NO MERCADO DE ARROZ, POR TIPO, 2018-2032 (MIL USD)
TABELA 1350 SUPLEMENTOS ALIMENTARES PASTAZA NO MERCADO DE ARROZ, POR TIPO, 2018-2032 (MIL USD)
TABELA 1351 SUPLEMENTOS ALIMENTARES PASTAZA NO MERCADO DE ARROZ, POR FORMULÁRIO DE PRODUTO, 2018-2032 (MIL USD)
TABELA 1352 MERCADO DE ARROZ PASTAZA, POR CANAL DE DISTRIBUIÇÃO, 2018-2032 (MIL USD)
TABELA 1353 MERCADO DE ARROZ PASTAZA, POR CANAL DE DISTRIBUIÇÃO, 2018-2032 (TONELADAS)
TABELA 1354 MERCADO DE ARROZ PASTAZA, POR CANAL DE DISTRIBUIÇÃO, 2018-2032 (USD/KG)
TABELA 1355 PASTAZA OFFLINE NO MERCADO DE ARROZ, POR TIPO, 2018-2032 (USD MIL)
TABELA 1356 VENDAS NO VAREJO DE PASTAZA NO MERCADO DE ARROZ, POR TIPO DE CANAL, 2018-2032 (MIL USD)
TABELA 1357 PASTAZA ONLINE NO MERCADO DE ARROZ, POR TIPO, 2018-2032 (USD MIL)
TABELA 1358 MERCADO DE ARROZ PICHINCHA, POR TIPO, 2018-2032 (MIL USD)
TABELA 1359 MERCADO DE ARROZ PICHINCHA, POR TIPO, 2018-2032 (TONELADAS)
TABELA 1360 MERCADO DE ARROZ PICHINCHA, POR TIPO, 2018-2032 (USD/KG)
TABELA 1361 MERCADO DE ARROZ PICHINCHA, POR COR DE ARROZ, 2018-2032 (USD MIL)
TABELA 1362 MERCADO DE ARROZ PICHINCHA, POR COR DE ARROZ, 2018-2032 (TONELADAS)
TABELA 1363 MERCADO DE ARROZ PICHINCHA, POR COR DO ARROZ, 2018-2032 (USD/KG)
TABELA 1364 MERCADO DE ARROZ PICHINCHA, POR TAMANHO DO GRÃO/TAMANHO DO GRÃO, 2018-2032 (MIL USD)
TABELA 1365 MERCADO DE ARROZ PICHINCHA, POR TAMANHO DO GRÃO/TAMANHO DO GRÃO, 2018-2032 (TONELADAS)
TABELA 1366 MERCADO DE ARROZ PICHINCHA, POR TAMANHO DO GRÃO/TAMANHO DO GRÃO, 2018-2032 (USD/KG)
TABELA 1367 MERCADO DE ARROZ PICHINCHA, POR NATUREZA, 2018-2032 (MIL USD)
TABELA 1368 MERCADO DE ARROZ PICHINCHA, POR NATUREZA, 2018-2032 (TONELADAS)
TABELA 1369 MERCADO DE ARROZ PICHINCHA, POR NATUREZA, 2018-2032 (USD/KG)
TABELA 1370 MERCADO DE ARROZ PICHINCHA, POR TEOR DE AMIDO, 2018-2032 (MIL USD)
TABELA 1371 MERCADO DE ARROZ PICHINCHA, POR TEOR DE AMIDO, 2018-2032 (TONELADAS)
TABELA 1372 MERCADO DE ARROZ PICHINCHA, POR TEOR DE AMIDO, 2018-2032 (USD/KG)
TABELA 1373 MERCADO DE ARROZ PICHINCHA, POR FORMULÁRIO DE PROCESSAMENTO, 2018-2032 (MIL USD)
TABELA 1374 MERCADO DE ARROZ PICHINCHA, POR FORMULÁRIO DE PROCESSAMENTO, 2018-2032 (TONELADAS)
TABELA 1375 MERCADO DE ARROZ PICHINCHA, POR FORMULÁRIO DE PROCESSAMENTO, 2018-2032 (USD/KG)
TABELA 1376 MERCADO DE ARROZ PICHINCHA, POR GRAU DE MOAGEM, 2018-2032 (MIL USD)
TABELA 1377 MERCADO DE ARROZ PICHINCHA, POR GRAU DE MOAGEM, 2018-2032 (TONELADAS)
TABELA 1378 MERCADO DE ARROZ PICHINCHA, POR GRAU DE MOAGEM, 2018-2032 (USD/KG)
TABELA 1379 MERCADO DE ARROZ PICHINCHA, POR POLIMENTO, 2018-2032 (USD MIL)
TABELA 1380 MERCADO DE ARROZ PICHINCHA, POR POLIMENTO, 2018-2032 (TONELADAS)
TABELA 1381 MERCADO DE ARROZ PICHINCHA, POR POLIMENTO, 2018-2032 (USD/KG)
TABELA 1382 MERCADO DE ARROZ PICHINCHA, POR FORTIFICAÇÃO, 2018-2032 (MIL USD)
TABELA 1383 MERCADO DE ARROZ PICHINCHA, POR FORTIFICAÇÃO, 2018-2032 (TONELADAS)
TABELA 1384 MERCADO DE ARROZ PICHINCHA, POR FORTIFICAÇÃO, 2018-2032 (USD/KG)
TABELA 1385 PICHINCHA FORTIFICADA NO MERCADO DE ARROZ, POR PROCESSO, 2018-2032 (USD MIL)
TABELA 1386 MERCADO DE ARROZ PICHINCHA, POR AROMA, 2018-2032 (USD MIL)
TABELA 1387 MERCADO DE ARROZ PICHINCHA, POR AROMA, 2018-2032 (TONELADAS)
TABELA 1388 MERCADO DE ARROZ PICHINCHA, POR AROMA, 2018-2032 (USD/KG)
TABELA 1389 ARROZ AROMÁTICO PICHINCHA NO MERCADO DE ARROZ, POR TIPO, 2018-2032 (USD MIL)
TABELA 1390 MERCADO DE ARROZ PICHINCHA, POR DERIVADOS DE ARROZ, 2018-2032 (USD MIL)
TABELA 1391 MERCADO DE ARROZ PICHINCHA, POR DERIVADOS DE ARROZ, 2018-2032 (TONELADAS)
TABELA 1392 MERCADO DE ARROZ PICHINCHA, POR DERIVADOS DE ARROZ, 2018-2032 (USD/KG)
TABELA 1393 MERCADO DE ARROZ PICHINCHA, POR USUÁRIO FINAL, 2018-2032 (MIL USD)
TABELA 1394 MERCADO DE ARROZ PICHINCHA, POR USUÁRIO FINAL, 2018-2032 (TONELADAS)
TABELA 1395 MERCADO DE ARROZ PICHINCHA, POR USUÁRIO FINAL, 2018-2032 (USD/KG)
TABELA 1396 ALIMENTOS E BEBIDAS PICHINCHA NO MERCADO DE ARROZ, POR TIPO, 2018-2032 (USD MIL)
TABELA 1397 ALIMENTOS PICHINCHA NO MERCADO DE ARROZ, POR TIPO, 2018-2032 (USD MIL)
TABELA 1398 PADARIA PICHINCHA NO MERCADO DE ARROZ, POR TIPO, 2018-2032 (USD MIL)
TABELA 1399 ALIMENTOS PROCESSADOS PICHINCHA NO MERCADO DE ARROZ, POR TIPO, 2018-2032 (USD MIL)
TABELA 1400 DOCES PICHINCHA NO MERCADO DE ARROZ, POR TIPO, 2018-2032 (USD MIL)
TABELA 1401 FÓRMULA INFANTIL DE PICHINCHA NO MERCADO DE ARROZ, POR TIPO, 2018-2032 (MIL USD)
TABELA 1402 PRODUTOS LATICÍNIOS PICHINCHA NO MERCADO DE ARROZ, POR TIPO, 2018-2032 (MIL USD)
TABELA 1403 BEBIDAS DE PICHINCHA NO MERCADO DE ARROZ, POR TIPO, 2018-2032 (USD MIL)
TABELA 1404 BEBIDAS SAUDÁVEIS PICHINCHA NO MERCADO DE ARROZ, POR TIPO, 2018-2032 (MIL USD)
TABELA 1405 RAÇÃO PARA PICHINCHA NO MERCADO DE ARROZ, POR CATEGORIA, 2018-2032 (MIL USD)
TABELA 1406 AVES PICHINCHA NO MERCADO DE ARROZ, POR TIPO, 2018-2032 (USD MIL)
TABELA 1407 RUMINANTES PICHINCHA NO MERCADO DE ARROZ, POR TIPO, 2018-2032 (USD MIL)
TABELA 1408 SUÍNOS PICHINCHA NO MERCADO DE ARROZ, POR TIPO, 2018-2032 (USD MIL)
TABELA 1409 PICHINCHA PET NO MERCADO DE ARROZ, POR TIPO, 2018-2032 (USD MIL)
TABELA 1410 ANIMAIS AQUÁTICOS PICHINCHA NO MERCADO DE ARROZ, POR TIPO, 2018-2032 (USD MIL)
TABELA 1411 CRUSTÁCEOS PICHINCHA NO MERCADO DE ARROZ, POR TIPO, 2018-2032 (MIL USD)
TABELA 1412 PEIXE PICHINCHA NO MERCADO DE ARROZ, POR TIPO, 2018-2032 (USD MIL)
TABELA 1413 MOLUSCOS PICHINCHA NO MERCADO DE ARROZ, POR TIPO, 2018-2032 (USD MIL)
TABELA 1414 ALIMENTOS PARA PICHINCHA NO MERCADO DE ARROZ, POR FUNÇÃO DE SAÚDE, 2018-2032 (MIL USD)
TABELA 1415 PRODUTOS FARMACÊUTICOS DE PICHINCHA NO MERCADO DE ARROZ, POR APLICAÇÃO, 2018-2032 (MIL USD)
TABELA 1416 INFECÇÕES UROGENITAIS POR PICHINCHA NO MERCADO DE ARROZ, POR TIPO, 2018-2032 (MIL USD)
TABELA 1417 PRODUTOS FARMACÊUTICOS DE PICHINCHA NO MERCADO DE ARROZ, POR FORMULÁRIO DE PRODUTO, 2018-2032 (MIL USD)
TABELA 1418 COSMÉTICOS E CUIDADOS PESSOAIS PICHINCHA NO MERCADO DE ARROZ, POR CATEGORIA, 2018-2032 (MIL USD)
TABELA 1419 PRODUTOS PARA CUIDADOS FACIAIS DE PICHINCHA NO MERCADO DE ARROZ, POR TIPO, 2018-2032 (MIL USD)
TABELA 1420 PRODUTOS PARA CUIDADOS COM OS CABELOS PICHINCHA NO MERCADO DE ARROZ, POR TIPO, 2018-2032 (MIL USD)
TABELA 1421 SUPLEMENTOS ALIMENTARES DE PICHINCHA NO MERCADO DE ARROZ, POR TIPO, 2018-2032 (MIL USD)
TABELA 1422 SUPLEMENTOS ALIMENTARES DE PICHINCHA NO MERCADO DE ARROZ, POR FORMULÁRIO DE PRODUTO, 2018-2032 (MIL USD)
TABELA 1423 MERCADO DE ARROZ PICHINCHA, POR CANAL DE DISTRIBUIÇÃO, 2018-2032 (MIL USD)
TABELA 1424 MERCADO DE ARROZ PICHINCHA, POR CANAL DE DISTRIBUIÇÃO, 2018-2032 (TONELADAS)
TABELA 1425 MERCADO DE ARROZ PICHINCHA, POR CANAL DE DISTRIBUIÇÃO, 2018-2032 (USD/KG)
TABELA 1426 PICHINCHA OFFLINE NO MERCADO DE ARROZ, POR TIPO, 2018-2032 (USD MIL)
TABELA 1427 VENDAS NO VAREJO DE PICHINCHA NO MERCADO DE ARROZ, POR TIPO DE CANAL, 2018-2032 (MIL USD)
TABELA 1428 PICHINCHA ONLINE NO MERCADO DE ARROZ, POR TIPO, 2018-2032 (USD MIL)
TABELA 1429 MERCADO DE ARROZ DE SANTA ELENA, POR TIPO, 2018-2032 (MIL USD)
TABELA 1430 MERCADO DE ARROZ DE SANTA ELENA, POR TIPO, 2018-2032 (TONELADAS)
TABELA 1431 MERCADO DE ARROZ DE SANTA ELENA, POR TIPO, 2018-2032 (USD/KG)
TABELA 1432 MERCADO DE ARROZ DE SANTA ELENA, POR COR DE ARROZ, 2018-2032 (MIL USD)
TABELA 1433 MERCADO DE ARROZ DE SANTA ELENA, POR COR DE ARROZ, 2018-2032 (TONELADAS)
TABELA 1434 MERCADO DE ARROZ DE SANTA ELENA, POR COR DE ARROZ, 2018-2032 (USD/KG)
TABELA 1435 MERCADO DE ARROZ DE SANTA ELENA, POR TAMANHO DO GRÃO/TAMANHO DO GRÃO, 2018-2032 (MIL USD)
TABELA 1436 MERCADO DE ARROZ DE SANTA ELENA, POR TAMANHO DO GRÃO/TAMANHO DO GRÃO, 2018-2032 (TONELADAS)
TABELA 1437 MERCADO DE ARROZ DE SANTA ELENA, POR TAMANHO DO GRÃO/TAMANHO DO GRÃO, 2018-2032 (USD/KG)
TABELA 1438 MERCADO DE ARROZ DE SANTA ELENA, POR NATUREZA, 2018-2032 (MIL USD)
TABELA 1439 MERCADO DE ARROZ DE SANTA ELENA, POR NATUREZA, 2018-2032 (TONELADAS)
TABELA 1440 MERCADO DE ARROZ DE SANTA ELENA, POR NATUREZA, 2018-2032 (USD/KG)
TABELA 1441 MERCADO DE ARROZ DE SANTA ELENA, POR TEOR DE AMIDO, 2018-2032 (MIL USD)
TABELA 1442 MERCADO DE ARROZ DE SANTA ELENA, POR TEOR DE AMIDO, 2018-2032 (TONELADAS)
TABELA 1443 MERCADO DE ARROZ DE SANTA ELENA, POR TEOR DE AMIDO, 2018-2032 (USD/KG)
TABELA 1444 MERCADO DE ARROZ DE SANTA ELENA, POR FORMULÁRIO DE PROCESSAMENTO, 2018-2032 (MIL USD)
TABELA 1445 MERCADO DE ARROZ DE SANTA ELENA, POR FORMULÁRIO DE PROCESSAMENTO, 2018-2032 (TONELADAS)
TABELA 1446 MERCADO DE ARROZ DE SANTA ELENA, POR FORMULÁRIO DE PROCESSAMENTO, 2018-2032 (USD/KG)
TABELA 1447 MERCADO DE ARROZ DE SANTA ELENA, POR GRAU DE MOAGEM, 2018-2032 (MIL USD)
TABELA 1448 MERCADO DE ARROZ DE SANTA ELENA, POR GRAU DE MOAGEM, 2018-2032 (TONELADAS)
TABELA 1449 MERCADO DE ARROZ DE SANTA ELENA, POR GRAU DE MOAGEM, 2018-2032 (USD/KG)
TABELA 1450 MERCADO DE ARROZ DE SANTA ELENA, POR POLIMENTO, 2018-2032 (MIL USD)
TABELA 1451 MERCADO DE ARROZ DE SANTA ELENA, POR POLIMENTO, 2018-2032 (TONELADAS)
TABELA 1452 MERCADO DE ARROZ DE SANTA ELENA, POR POLIMENTO, 2018-2032 (USD/KG)
TABELA 1453 MERCADO DE ARROZ DE SANTA ELENA, POR FORTIFICAÇÃO, 2018-2032 (MIL USD)
TABELA 1454 MERCADO DE ARROZ DE SANTA ELENA, POR FORTIFICAÇÃO, 2018-2032 (TONELADAS)
TABELA 1455 MERCADO DE ARROZ DE SANTA ELENA, POR FORTIFICAÇÃO, 2018-2032 (USD/KG)
TABELA 1456 SANTA ELENA FORTIFICADA NO MERCADO DE ARROZ, POR PROCESSO, 2018-2032 (USD MIL)
TABELA 1457 MERCADO DE ARROZ DE SANTA ELENA, POR AROMA, 2018-2032 (MIL USD)
TABELA 1458 MERCADO DE ARROZ DE SANTA ELENA, DA AROMA, 2018-2032 (TONELADAS)
TABELA 1459 MERCADO DE ARROZ DE SANTA ELENA, POR AROMA, 2018-2032 (USD/KG)
TABELA 1460 ARROZ AROMÁTICO SANTA ELENA NO MERCADO DE ARROZ, POR TIPO, 2018-2032 (MIL USD)
TABELA 1461 MERCADO DE ARROZ DE SANTA ELENA, POR DERIVADOS DE ARROZ, 2018-2032 (MIL USD)
TABELA 1462 MERCADO DE ARROZ DE SANTA ELENA, POR DERIVADOS DE ARROZ, 2018-2032 (TONELADAS)
TABELA 1463 MERCADO DE ARROZ DE SANTA ELENA, POR DERIVADOS DE ARROZ, 2018-2032 (USD/KG)
TABELA 1464 MERCADO DE ARROZ DE SANTA ELENA, POR USUÁRIO FINAL, 2018-2032 (MIL USD)
TABELA 1465 MERCADO DE ARROZ DE SANTA ELENA, POR USUÁRIO FINAL, 2018-2032 (TONELADAS)
TABELA 1466 MERCADO DE ARROZ DE SANTA ELENA, POR USUÁRIO FINAL, 2018-2032 (USD/KG)
TABELA 1467 ALIMENTOS E BEBIDAS NO MERCADO DE ARROZ DE SANTA ELENA, POR TIPO, 2018-2032 (MIL USD)
TABELA 1468 ALIMENTOS NO MERCADO DE ARROZ DE SANTA ELENA, POR TIPO, 2018-2032 (MIL USD)
TABELA 1469 PADARIA SANTA ELENA NO MERCADO DE ARROZ, POR TIPO, 2018-2032 (USD MIL)
TABELA 1470 ALIMENTOS PROCESSADOS NO MERCADO DE ARROZ DE SANTA ELENA, POR TIPO, 2018-2032 (MIL USD)
TABELA 1471 CONFEITARIA SANTA ELENA NO MERCADO DE ARROZ, POR TIPO, 2018-2032 (USD MIL)
TABELA 1472 FÓRMULA INFANTIL SANTA ELENA NO MERCADO DE ARROZ, POR TIPO, 2018-2032 (MIL USD)
TABELA 1473 PRODUTOS LATICÍNIOS DE SANTA ELENA NO MERCADO DE ARROZ, POR TIPO, 2018-2032 (MIL USD)
TABELA 1474 BEBIDAS DE SANTA ELENA NO MERCADO DE ARROZ, POR TIPO, 2018-2032 (USD MIL)
TABELA 1475 BEBIDAS SAUDÁVEIS DE SANTA ELENA NO MERCADO DE ARROZ, POR TIPO, 2018-2032 (MIL USD)
TABELA 1476 RAÇÃO SANTA ELENA NO MERCADO DE ARROZ, POR CATEGORIA, 2018-2032 (MIL USD)
TABELA 1477 AVES DE SANTA ELENA NO MERCADO DE ARROZ, POR TIPO, 2018-2032 (MIL USD)
TABELA 1478 RUMINANTES DE SANTA ELENA NO MERCADO DE ARROZ, POR TIPO, 2018-2032 (MIL USD)
TABELA 1479 SUÍNOS SANTA ELENA NO MERCADO DE ARROZ, POR TIPO, 2018-2032 (USD MIL)
TABELA 1480 SANTA ELENA PET NO MERCADO DE ARROZ, POR TIPO, 2018-2032 (USD MIL)
TABELA 1481 ANIMAIS AQUÁTICOS DE SANTA ELENA NO MERCADO DE ARROZ, POR TIPO, 2018-2032 (MIL USD)
TABELA 1482 CRUSTÁCEOS DE SANTA ELENA NO MERCADO DE ARROZ, POR TIPO, 2018-2032 (MIL USD)
TABELA 1483 PEIXE DE SANTA ELENA NO MERCADO DE ARROZ, POR TIPO, 2018-2032 (MIL USD)
TABELA 1484 MOLUSCOS DE SANTA ELENA NO MERCADO DE ARROZ, POR TIPO, 2018-2032 (MIL USD)
TABELA 1485 ALIMENTOS PARA SANTA ELENA NO MERCADO DE ARROZ, POR FUNÇÃO DE SAÚDE, 2018-2032 (MIL USD)
TABELA 1486 SANTA ELENA PHARMACEUTICALS NO MERCADO DE ARROZ, POR APLICAÇÃO, 2018-2032 (MIL USD)
TABELA 1487 INFECÇÕES UROGENITAIS EM SANTA ELENA NO MERCADO DE ARROZ, POR TIPO, 2018-2032 (MIL USD)
TABELA 1488 SANTA ELENA PHARMACEUTICALS NO MERCADO DE ARROZ, POR FORMULÁRIO DE PRODUTO, 2018-2032 (MIL USD)
TABELA 1489 SANTA ELENA COSMÉTICOS E CUIDADOS PESSOAIS NO MERCADO DE ARROZ, POR CATEGORIA, 2018-2032 (MIL USD)
TABELA 1490 PRODUTOS PARA CUIDADOS FACIAIS DE SANTA ELENA NO MERCADO DE ARROZ, POR TIPO, 2018-2032 (MIL USD)
TABELA 1491 PRODUTOS PARA CUIDADOS COM OS CABELOS DE SANTA ELENA NO MERCADO DE ARROZ, POR TIPO, 2018-2032 (MIL USD)
TABELA 1492 SUPLEMENTOS ALIMENTARES DE SANTA ELENA NO MERCADO DE ARROZ, POR TIPO, 2018-2032 (MIL USD)
TABELA 1493 SUPLEMENTOS ALIMENTARES DE SANTA ELENA NO MERCADO DE ARROZ, POR FORMULÁRIO DE PRODUTO, 2018-2032 (MIL USD)
TABELA 1494 MERCADO DE ARROZ DE SANTA ELENA, POR CANAL DE DISTRIBUIÇÃO, 2018-2032 (MIL USD)
TABELA 1495 MERCADO DE ARROZ DE SANTA ELENA, POR CANAL DE DISTRIBUIÇÃO, 2018-2032 (TONELADAS)
TABELA 1496 MERCADO DE ARROZ DE SANTA ELENA, POR CANAL DE DISTRIBUIÇÃO, 2018-2032 (USD/KG)
TABELA 1497 SANTA ELENA OFFLINE NO MERCADO DE ARROZ, POR TIPO, 2018-2032 (USD MIL)
TABELA 1498 VENDAS NO VAREJO DE SANTA ELENA NO MERCADO DE ARROZ, POR TIPO DE CANAL, 2018-2032 (MIL USD)
TABELA 1499 SANTA ELENA ONLINE NO MERCADO DE ARROZ, POR TIPO, 2018-2032 (USD MIL)
TABELA 1500 MERCADO DE ARROZ DE SANTO DOMINGO DE LOS TSÁCHILAS, POR TIPO, 2018-2032 (MIL USD)
TABELA 1501 MERCADO DE ARROZ SANTO DOMINGO DE LOS TSÁCHILAS, POR TIPO, 2018-2032 (TONELADAS)
TABELA 1502 MERCADO DE ARROZ DE SANTO DOMINGO DE LOS TSÁCHILAS, POR TIPO, 2018-2032 (USD/KG)
TABELA 1503 MERCADO DE ARROZ DE SANTO DOMINGO DE LOS TSÁCHILAS, POR COR DE ARROZ, 2018-2032 (USD MIL)
TABELA 1504 MERCADO DE ARROZ DE SANTO DOMINGO DE LOS TSÁCHILAS, POR COR DE ARROZ, 2018-2032 (TONELADAS)
TABELA 1505 MERCADO DE ARROZ DE SANTO DOMINGO DE LOS TSÁCHILAS, POR COR DE ARROZ, 2018-2032 (USD/KG)
TABELA 1506 MERCADO DE ARROZ DE SANTO DOMINGO DE LOS TSÁCHILAS, POR TAMANHO DO GRÃO/TAMANHO DO GRÃO, 2018-2032 (MIL USD)
TABELA 1507 MERCADO DE ARROZ DE SANTO DOMINGO DE LOS TSÁCHILAS, POR TAMANHO DO GRÃO/TAMANHO DO GRÃO, 2018-2032 (TONELADAS)
TABELA 1508 MERCADO DE ARROZ DE SANTO DOMINGO DE LOS TSÁCHILAS, POR TAMANHO DO GRÃO/TAMANHO DO GRÃO, 2018-2032 (USD/KG)
TABELA 1509 MERCADO DE ARROZ DE SANTO DOMINGO DE LOS TSÁCHILAS, POR NATUREZA, 2018-2032 (MIL USD)
TABELA 1510 MERCADO DE ARROZ DE SANTO DOMINGO DE LOS TSÁCHILAS, POR NATUREZA, 2018-2032 (TONELADAS)
TABELA 1511 MERCADO DE ARROZ DE SANTO DOMINGO DE LOS TSÁCHILAS, POR NATUREZA, 2018-2032 (USD/KG)
TABELA 1512 MERCADO DE ARROZ DE SANTO DOMINGO DE LOS TSÁCHILAS, POR TEOR DE AMIDO, 2018-2032 (MIL USD)
TABELA 1513 MERCADO DE ARROZ DE SANTO DOMINGO DE LOS TSÁCHILAS, POR TEOR DE AMIDO, 2018-2032 (TONELADAS)
TABELA 1514 MERCADO DE ARROZ DE SANTO DOMINGO DE LOS TSÁCHILAS, POR TEOR DE AMIDO, 2018-2032 (USD/KG)
TABELA 1515 MERCADO DE ARROZ DE SANTO DOMINGO DE LOS TSÁCHILAS, POR FORMULÁRIO DE PROCESSAMENTO, 2018-2032 (MIL USD)
TABELA 1516 MERCADO DE ARROZ DE SANTO DOMINGO DE LOS TSÁCHILAS, POR FORMULÁRIO DE PROCESSAMENTO, 2018-2032 (TONELADAS)
TABELA 1517 MERCADO DE ARROZ DE SANTO DOMINGO DE LOS TSÁCHILAS, POR FORMULÁRIO DE PROCESSAMENTO, 2018-2032 (USD/KG)
TABELA 1518 MERCADO DE ARROZ DE SANTO DOMINGO DE LOS TSÁCHILAS, POR GRAU DE MOAGEM, 2018-2032 (MIL USD)
TABELA 1519 MERCADO DE ARROZ DE SANTO DOMINGO DE LOS TSÁCHILAS, POR GRAU DE MOAGEM, 2018-2032 (TONELADAS)
TABELA 1520 MERCADO DE ARROZ DE SANTO DOMINGO DE LOS TSÁCHILAS, POR GRAU DE MOAGEM, 2018-2032 (USD/KG)
TABELA 1521 MERCADO DE ARROZ DE SANTO DOMINGO DE LOS TSÁCHILAS, POR POLIMENTO, 2018-2032 (USD MIL)
TABELA 1522 MERCADO DE ARROZ SANTO DOMINGO DE LOS TSÁCHILAS, POR POLIMENTO, 2018-2032 (TONELADAS)
TABELA 1523 MERCADO DE ARROZ DE SANTO DOMINGO DE LOS TSÁCHILAS, POR POLIMENTO, 2018-2032 (USD/KG)
TABELA 1524 MERCADO DE ARROZ DE SANTO DOMINGO DE LOS TSÁCHILAS, POR FORTIFICAÇÃO, 2018-2032 (MIL USD)
TABELA 1525 MERCADO DE ARROZ DE SANTO DOMINGO DE LOS TSÁCHILAS, POR FORTIFICAÇÃO, 2018-2032 (TONELADAS)
TABELA 1526 MERCADO DE ARROZ DE SANTO DOMINGO DE LOS TSÁCHILAS, POR FORTIFICAÇÃO, 2018-2032 (USD/KG)
TABELA 1527 SANTO DOMINGO DE LOS TSÁCHILAS FORTIFICADO NO MERCADO DE ARROZ, POR PROCESSO, 2018-2032 (USD MIL)
TABELA 1528 MERCADO DE ARROZ DE SANTO DOMINGO DE LOS TSÁCHILAS, POR AROMA, 2018-2032 (USD MIL)
TABELA 1529 MERCADO DE ARROZ SANTO DOMINGO DE LOS TSÁCHILAS, POR AROMA, 2018-2032 (TONELADAS)
TABELA 1530 MERCADO DE ARROZ DE SANTO DOMINGO DE LOS TSÁCHILAS, POR AROMA, 2018-2032 (USD/KG)
TABELA 1531 ARROZ AROMÁTICO DE SANTO DOMINGO DE LOS TSÁCHILAS NO MERCADO DE ARROZ, POR TIPO, 2018-2032 (USD MIL)
TABELA 1532 MERCADO DE ARROZ DE SANTO DOMINGO DE LOS TSÁCHILAS, POR DERIVADOS DE ARROZ, 2018-2032 (US$ MIL)
TABELA 1533 MERCADO DE ARROZ DE SANTO DOMINGO DE LOS TSÁCHILAS, POR DERIVADOS DE ARROZ, 2018-2032 (TONELADAS)
TABELA 1534 MERCADO DE ARROZ DE SANTO DOMINGO DE LOS TSÁCHILAS, POR DERIVADOS DE ARROZ, 2018-2032 (USD/KG)
TABELA 1535 MERCADO DE ARROZ DE SANTO DOMINGO DE LOS TSÁCHILAS, POR USUÁRIO FINAL, 2018-2032 (MIL USD)
TABELA 1536 MERCADO DE ARROZ DE SANTO DOMINGO DE LOS TSÁCHILAS, POR USUÁRIO FINAL, 2018-2032 (TONELADAS)
TABELA 1537 MERCADO DE ARROZ DE SANTO DOMINGO DE LOS TSÁCHILAS, POR USUÁRIO FINAL, 2018-2032 (USD/KG)
TABELA 1538 SANTO DOMINGO DE LOS TSÁCHILAS ALIMENTOS E BEBIDAS NO MERCADO DE ARROZ, POR TIPO, 2018-2032 (USD MIL)
TABELA 1539 ALIMENTOS NO MERCADO DE ARROZ DE SANTO DOMINGO DE LOS TSÁCHILAS, POR TIPO, 2018-2032 (MIL USD)
TABELA 1540 PADARIA SANTO DOMINGO DE LOS TSÁCHILAS NO MERCADO DE ARROZ, POR TIPO, 2018-2032 (USD MIL)
TABELA 1541 SANTO DOMINGO DE LOS TSÁCHILAS ALIMENTOS PROCESSADOS NO MERCADO DE ARROZ, POR TIPO, 2018-2032 (USD MIL)
TABELA 1542 CONFEITARIA SANTO DOMINGO DE LOS TSÁCHILAS NO MERCADO DE ARROZ, POR TIPO, 2018-2032 (USD MIL)
TABELA 1543 FÓRMULA INFANTIL DE SANTO DOMINGO DE LOS TSÁCHILAS NO MERCADO DE ARROZ, POR TIPO, 2018-2032 (MIL USD)
TABELA 1544 SANTO DOMINGO DE LOS TSÁCHILAS PRODUTOS LÁCTEOS NO MERCADO DE ARROZ, POR TIPO, 2018-2032 (USD MIL)
TABELA 1545 SANTO DOMINGO DE LOS TSÁCHILAS BEBIDAS NO MERCADO DE ARROZ, POR TIPO, 2018-2032 (USD MIL)
TABELA 1546 SANTO DOMINGO DE LOS TSÁCHILAS BEBIDAS SAUDÁVEIS NO MERCADO DE ARROZ, POR TIPO, 2018-2032 (USD MIL)
TABELA 1547 SANTO DOMINGO DE LOS TSÁCHILAS ALIMENTAÇÃO NO MERCADO DE ARROZ, POR CATEGORIA, 2018-2032 (USD MIL)
TABELA 1548 SANTO DOMINGO DE LOS TSÁCHILAS AVES NO MERCADO DE ARROZ, POR TIPO, 2018-2032 (USD MIL)
TABELA 1549 RUMINANTES DE SANTO DOMINGO DE LOS TSÁCHILAS NO MERCADO DE ARROZ, POR TIPO, 2018-2032 (USD MIL)
TABELA 1550 SANTO DOMINGO DE LOS TSÁCHILAS SUÍNOS NO MERCADO DE ARROZ, POR TIPO, 2018-2032 (USD MIL)
TABELA 1551 SANTO DOMINGO DE LOS TSÁCHILAS PET NO MERCADO DE ARROZ, POR TIPO, 2018-2032 (USD MIL)
TABELA 1552 SANTO DOMINGO DE LOS TSÁCHILAS ANIMAIS AQUÁTICOS NO MERCADO DE ARROZ, POR TIPO, 2018-2032 (USD MIL)
TABELA 1553 CRUSTÁCEOS DE SANTO DOMINGO DE LOS TSÁCHILAS NO MERCADO DE ARROZ, POR TIPO, 2018-2032 (MIL USD)
TABELA 1554 PEIXE DE SANTO DOMINGO DE LOS TSÁCHILAS NO MERCADO DE ARROZ, POR TIPO, 2018-2032 (USD MIL)
TABELA 1555 MOLUSCOS DE SANTO DOMINGO DE LOS TSÁCHILAS NO MERCADO DE ARROZ, POR TIPO, 2018-2032 (MIL USD)
TABELA 1556 SANTO DOMINGO DE LOS TSÁCHILAS ALIMENTOS NO MERCADO DE ARROZ, POR FUNÇÃO DE SAÚDE, 2018-2032 (MIL USD)
TABELA 1557 SANTO DOMINGO DE LOS TSÁCHILAS PRODUTOS FARMACÊUTICOS NO MERCADO DE ARROZ, POR APLICAÇÃO, 2018-2032 (USD MIL)
TABELA 1558 INFECÇÕES UROGENITAIS NO MERCADO DE ARROZ DE SANTO DOMINGO DE LOS TSÁCHILAS, POR TIPO, 2018-2032 (MIL USD)
TABELA 1559 SANTO DOMINGO DE LOS TSÁCHILAS PRODUTOS FARMACÊUTICOS NO MERCADO DE ARROZ, POR FORMA DE PRODUTO, 2018-2032 (MIL USD)
TABELA 1560 SANTO DOMINGO DE LOS TSÁCHILAS COSMÉTICOS E CUIDADOS PESSOAIS NO MERCADO DE ARROZ, POR CATEGORIA, 2018-2032 (USD MIL)
TABELA 1561 PRODUTOS PARA CUIDADOS FACIAIS DE SANTO DOMINGO DE LOS TSÁCHILAS NO MERCADO DE ARROZ, POR TIPO, 2018-2032 (MIL USD)
TABELA 1562 PRODUTOS PARA CUIDADOS COM OS CABELOS DE SANTO DOMINGO DE LOS TSÁCHILAS NO MERCADO DE ARROZ, POR TIPO, 2018-2032 (MIL USD)
TABELA 1563 SUPLEMENTOS ALIMENTARES NO MERCADO DE ARROZ DE SANTO DOMINGO DE LOS TSÁCHILAS, POR TIPO, 2018-2032 (MIL USD)
TABELA 1564 SUPLEMENTOS ALIMENTARES DE SANTO DOMINGO DE LOS TSÁCHILAS NO MERCADO DE ARROZ, POR FORMA DE PRODUTO, 2018-2032 (MIL USD)
TABELA 1565 MERCADO DE ARROZ DE SANTO DOMINGO DE LOS TSÁCHILAS, POR CANAL DE DISTRIBUIÇÃO, 2018-2032 (MIL USD)
TABELA 1566 MERCADO DE ARROZ DE SANTO DOMINGO DE LOS TSÁCHILAS, POR CANAL DE DISTRIBUIÇÃO, 2018-2032 (TONELADAS)
TABELA 1567 MERCADO DE ARROZ DE SANTO DOMINGO DE LOS TSÁCHILAS, POR CANAL DE DISTRIBUIÇÃO, 2018-2032 (USD/KG)
TABELA 1568 SANTO DOMINGO DE LOS TSÁCHILAS OFFLINE NO MERCADO DE ARROZ, POR TIPO, 2018-2032 (USD MIL)
TABELA 1569 SANTO DOMINGO DE LOS TSÁCHILAS VENDAS NO VAREJO NO MERCADO DE ARROZ, POR TIPO DE CANAL, 2018-2032 (USD MIL)
TABELA 1570 SANTO DOMINGO DE LOS TSÁCHILAS ONLINE NO MERCADO DE ARROZ, POR TIPO, 2018-2032 (USD MIL)
TABELA 1571 MERCADO DE ARROZ SUCUMBÍOS, POR TIPO, 2018-2032 (MIL USD)
TABELA 1572 MERCADO DE ARROZ SUCUMBÍOS, POR TIPO, 2018-2032 (TONELADAS)
TABELA 1573 MERCADO DE ARROZ SUCUMBÍOS, POR TIPO, 2018-2032 (USD/KG)
TABELA 1574 MERCADO DE ARROZ SUCUMBÍOS, POR COR DE ARROZ, 2018-2032 (USD MIL)
TABELA 1575 MERCADO DE ARROZ SUCUMBÍOS, POR COR DE ARROZ, 2018-2032 (TONELADAS)
TABELA 1576 MERCADO DE ARROZ SUCUMBÍOS, POR COR DE ARROZ, 2018-2032 (USD/KG)
TABELA 1577 MERCADO DE ARROZ SUCUMBÍOS, POR TAMANHO DO GRÃO/TAMANHO DO GRÃO, 2018-2032 (MIL USD)
TABELA 1578 MERCADO DE ARROZ SUCUMBÍOS, POR TAMANHO DO GRÃO/TAMANHO DO GRÃO, 2018-2032 (TONELADAS)
TABELA 1579 MERCADO DE ARROZ SUCUMBÍOS, POR TAMANHO DO GRÃO/TAMANHO DO GRÃO, 2018-2032 (USD/KG)
TABELA 1580 MERCADO DE ARROZ DE SUCUMBÍOS, POR NATUREZA, 2018-2032 (MIL USD)
TABELA 1581 MERCADO DE ARROZ DE SUCUMBÍOS, POR NATUREZA, 2018-2032 (TONELADAS)
TABELA 1582 MERCADO DE ARROZ SUCUMBÍOS, POR NATUREZA, 2018-2032 (USD/KG)
TABELA 1583 MERCADO DE ARROZ SUCUMBÍOS, POR TEOR DE AMIDO, 2018-2032 (MIL USD)
TABELA 1584 MERCADO DE ARROZ SUCUMBÍOS, POR TEOR DE AMIDO, 2018-2032 (TONELADAS)
TABELA 1585 MERCADO DE ARROZ SUCUMBÍOS, POR TEOR DE AMIDO, 2018-2032 (USD/KG)
TABELA 1586 MERCADO DE ARROZ DE SUCUMBÍOS, POR FORMULÁRIO DE PROCESSAMENTO, 2018-2032 (MIL USD)
TABELA 1587 MERCADO DE ARROZ SUCUMBÍOS, POR FORMULÁRIO DE PROCESSAMENTO, 2018-2032 (TONELADAS)
TABELA 1588 MERCADO DE ARROZ SUCUMBÍOS, POR FORMULÁRIO DE PROCESSAMENTO, 2018-2032 (USD/KG)
TABELA 1589 MERCADO DE ARROZ SUCUMBÍOS, POR GRAU DE MOAGEM, 2018-2032 (MIL USD)
TABELA 1590 MERCADO DE ARROZ SUCUMBÍOS, POR GRAU DE MOAGEM, 2018-2032 (TONELADAS)
TABELA 1591 MERCADO DE ARROZ SUCUMBÍOS, POR GRAU DE MOAGEM, 2018-2032 (USD/KG)
TABELA 1592 MERCADO DE ARROZ DE SUCUMBÍOS, POR POLIMENTO, 2018-2032 (USD MIL)
TABELA 1593 MERCADO DE ARROZ DE SUCUMBÍOS, POR POLIMENTO, 2018-2032 (TONELADAS)
TABELA 1594 MERCADO DE ARROZ SUCUMBÍOS, POR POLIMENTO, 2018-2032 (USD/KG)
TABELA 1595 MERCADO DE ARROZ DE SUCUMBÍOS, POR FORTIFICAÇÃO, 2018-2032 (MIL USD)
TABELA 1596 MERCADO DE ARROZ DE SUCUMBÍOS, POR FORTIFICAÇÃO, 2018-2032 (TONELADAS)
TABELA 1597 MERCADO DE ARROZ SUCUMBÍOS, POR FORTIFICAÇÃO, 2018-2032 (USD/KG)
TABELA 1598 SUCUMBÍOS FORTIFICADOS NO MERCADO DE ARROZ, POR PROCESSO, 2018-2032 (USD MIL)
TABELA 1599 MERCADO DE ARROZ DE SUCUMBÍOS, POR AROMA, 2018-2032 (USD MIL)
TABELA 1600 MERCADO DE ARROZ SUCUMBÍOS, DA AROMA, 2018-2032 (TONELADAS)
TABELA 1601 MERCADO DE ARROZ SUCUMBÍOS, POR AROMA, 2018-2032 (USD/KG)
TABELA 1602 ARROZ AROMÁTICO SUCUMBÍOS NO MERCADO DE ARROZ, POR TIPO, 2018-2032 (USD MIL)
TABELA 1603 MERCADO DE ARROZ SUCUMBÍOS, POR DERIVADOS DE ARROZ, 2018-2032 (MIL USD)
TABELA 1604 MERCADO DE ARROZ SUCUMBÍOS, POR DERIVADOS DE ARROZ, 2018-2032 (TONELADAS)
TABELA 1605 MERCADO DE ARROZ SUCUMBÍOS, POR DERIVADOS DE ARROZ, 2018-2032 (USD/KG)
TABELA 1606 MERCADO DE ARROZ DE SUCUMBÍOS, POR USUÁRIO FINAL, 2018-2032 (MIL USD)
TABELA 1607 MERCADO DE ARROZ DE SUCUMBÍOS, POR USUÁRIO FINAL, 2018-2032 (TONELADAS)
TABELA 1608 MERCADO DE ARROZ SUCUMBÍOS, POR USUÁRIO FINAL, 2018-2032 (USD/KG)
TABELA 1609 ALIMENTOS E BEBIDAS SUCUMBÍOS NO MERCADO DE ARROZ, POR TIPO, 2018-2032 (USD MIL)
TABELA 1610 ALIMENTOS SUCUMBÍOS NO MERCADO DE ARROZ, POR TIPO, 2018-2032 (USD MIL)
TABELA 1611 PADARIA SUCUMBÍOS NO MERCADO DE ARROZ, POR TIPO, 2018-2032 (USD MIL)
TABELA 1612 ALIMENTOS PROCESSADOS DE SUCUMBÍOS NO MERCADO DE ARROZ, POR TIPO, 2018-2032 (MIL USD)
TABELA 1613 CONFEITARIA DE SUCUMBÍOS NO MERCADO DE ARROZ, POR TIPO, 2018-2032 (USD MIL)
TABELA 1614 FÓRMULA INFANTIL DE SUCUMBÍOS NO MERCADO DE ARROZ, POR TIPO, 2018-2032 (MIL USD)
TABELA 1615 PRODUTOS LÁCTEOS DE SUCUMBÍOS NO MERCADO DE ARROZ, POR TIPO, 2018-2032 (USD MIL)
TABELA 1616 BEBIDAS DE SUCUMBÍOS NO MERCADO DE ARROZ, POR TIPO, 2018-2032 (USD MIL)
TABELA 1617 BEBIDAS SAUDÁVEIS DE SUCUMBÍOS NO MERCADO DE ARROZ, POR TIPO, 2018-2032 (USD MIL)
TABELA 1618 ALIMENTAÇÃO DE SUCUMBÍOS NO MERCADO DE ARROZ, POR CATEGORIA, 2018-2032 (USD MIL)
TABELA 1619 AVES SUCUMBÍOS NO MERCADO DE ARROZ, POR TIPO, 2018-2032 (USD MIL)
TABELA 1620 RUMINANTES SUCUMBÍOS NO MERCADO DE ARROZ, POR TIPO, 2018-2032 (USD MIL)
TABELA 1621 SUÍNOS SUCUMBÍOS NO MERCADO DE ARROZ, POR TIPO, 2018-2032 (USD MIL)
TABELA 1622 SUCUMBÍOS PET NO MERCADO DE ARROZ, POR TIPO, 2018-2032 (USD MIL)
TABELA 1623 ANIMAIS AQUÁTICOS SUCUMBÍOS NO MERCADO DE ARROZ, POR TIPO, 2018-2032 (USD MIL)
TABELA 1624 CRUSTÁCEOS SUCUMBÍOS NO MERCADO DE ARROZ, POR TIPO, 2018-2032 (USD MIL)
TABELA 1625 PEIXES SUCUMBÍOS NO MERCADO DE ARROZ, POR TIPO, 2018-2032 (USD MIL)
TABELA 1626 MOLUSCOS SUCUMBÍOS NO MERCADO DE ARROZ, POR TIPO, 2018-2032 (USD MIL)
TABELA 1627 ALIMENTAÇÃO DE SUCUMBÍOS NO MERCADO DE ARROZ, POR FUNÇÃO DE SAÚDE, 2018-2032 (MIL USD)
TABELA 1628 PRODUTOS FARMACÊUTICOS DE SUCUMBÍOS NO MERCADO DE ARROZ, POR APLICAÇÃO, 2018-2032 (MIL USD)
TABELA 1629 INFECÇÕES UROGENITAIS POR SUCUMBÍOS NO MERCADO DE ARROZ, POR TIPO, 2018-2032 (USD MIL)
TABELA 1630 PRODUTOS FARMACÊUTICOS DE SUCUMBÍOS NO MERCADO DE ARROZ, POR FORMA DE PRODUTO, 2018-2032 (MIL USD)
TABELA 1631 SUCUMBÍOS COSMÉTICOS E CUIDADOS PESSOAIS NO MERCADO DE ARROZ, POR CATEGORIA, 2018-2032 (USD MIL)
TABELA 1632 PRODUTOS PARA CUIDADOS FACIAIS DE SUCUMBÍOS NO MERCADO DE ARROZ, POR TIPO, 2018-2032 (MIL USD)
TABELA 1633 PRODUTOS PARA CUIDADOS COM OS CABELOS DE SUCUMBÍOS NO MERCADO DE ARROZ, POR TIPO, 2018-2032 (MIL USD)
TABELA 1634 SUPLEMENTOS ALIMENTARES DE SUCUMBÍOS NO MERCADO DE ARROZ, POR TIPO, 2018-2032 (MIL USD)
TABELA 1635 SUPLEMENTOS ALIMENTARES DE SUCUMBÍOS NO MERCADO DE ARROZ, POR FORMA DE PRODUTO, 2018-2032 (MIL USD)
TABELA 1636 MERCADO DE ARROZ DE SUCUMBÍOS, POR CANAL DE DISTRIBUIÇÃO, 2018-2032 (MIL USD)
TABELA 1637 MERCADO DE ARROZ DE SUCUMBÍOS, POR CANAL DE DISTRIBUIÇÃO, 2018-2032 (TONELADAS)
TABELA 1638 MERCADO DE ARROZ DE SUCUMBÍOS, POR CANAL DE DISTRIBUIÇÃO, 2018-2032 (USD/KG)
TABELA 1639 SUCUMBÍOS OFFLINE NO MERCADO DE ARROZ, POR TIPO, 2018-2032 (USD MIL)
TABELA 1640 VENDAS NO VAREJO DE SUCUMBÍOS NO MERCADO DE ARROZ, POR TIPO DE CANAL, 2018-2032 (MIL USD)
TABELA 1641 SUCUMBÍOS ONLINE NO MERCADO DE ARROZ, POR TIPO, 2018-2032 (USD MIL)
TABELA 1642 MERCADO DE ARROZ DE TUNGURAHUA, POR TIPO, 2018-2032 (MIL USD)
TABELA 1643 MERCADO DE ARROZ DE TUNGURAHUA, POR TIPO, 2018-2032 (TONELADAS)
TABELA 1644 MERCADO DE ARROZ DE TUNGURAHUA, POR TIPO, 2018-2032 (USD/KG)
TABELA 1645 MERCADO DE ARROZ DE TUNGURAHUA, POR COR DE ARROZ, 2018-2032 (MIL USD)
TABELA 1646 MERCADO DE ARROZ DE TUNGURAHUA, POR COR DE ARROZ, 2018-2032 (TONELADAS)
TABELA 1647 MERCADO DE ARROZ DE TUNGURAHUA, POR COR DO ARROZ, 2018-2032 (USD/KG)
TABELA 1648 MERCADO DE ARROZ DE TUNGURAHUA, POR TAMANHO DO GRÃO/TAMANHO DO GRÃO, 2018-2032 (MIL USD)
TABELA 1649 MERCADO DE ARROZ DE TUNGURAHUA, POR TAMANHO DO GRÃO/TAMANHO DO GRÃO, 2018-2032 (TONELADAS)
TABELA 1650 MERCADO DE ARROZ DE TUNGURAHUA, POR TAMANHO DO GRÃO/TAMANHO DO GRÃO, 2018-2032 (USD/KG)
TABELA 1651 MERCADO DE ARROZ DE TUNGURAHUA, POR NATUREZA, 2018-2032 (MIL USD)
TABELA 1652 MERCADO DE ARROZ DE TUNGURAHUA, POR NATUREZA, 2018-2032 (TONELADAS)
TABELA 1653 MERCADO DE ARROZ DE TUNGURAHUA, POR NATUREZA, 2018-2032 (USD/KG)
TABELA 1654 MERCADO DE ARROZ DE TUNGURAHUA, POR TEOR DE AMIDO, 2018-2032 (MIL USD)
TABELA 1655 MERCADO DE ARROZ DE TUNGURAHUA, POR TEOR DE AMIDO, 2018-2032 (TONELADAS)
TABELA 1656 MERCADO DE ARROZ DE TUNGURAHUA, POR TEOR DE AMIDO, 2018-2032 (USD/KG)
TABELA 1657 MERCADO DE ARROZ DE TUNGURAHUA, POR FORMULÁRIO DE PROCESSAMENTO, 2018-2032 (MIL USD)
TABELA 1658 MERCADO DE ARROZ DE TUNGURAHUA, POR FORMULÁRIO DE PROCESSAMENTO, 2018-2032 (TONELADAS)
TABELA 1659 MERCADO DE ARROZ DE TUNGURAHUA, POR FORMULÁRIO DE PROCESSAMENTO, 2018-2032 (USD/KG)
TABELA 1660 MERCADO DE ARROZ DE TUNGURAHUA, POR GRAU DE MOAGEM, 2018-2032 (MIL USD)
TABELA 1661 MERCADO DE ARROZ DE TUNGURAHUA, POR GRAU DE MOAGEM, 2018-2032 (TONELADAS)
TABELA 1662 MERCADO DE ARROZ DE TUNGURAHUA, POR GRAU DE MOAGEM, 2018-2032 (USD/KG)
TABELA 1663 MERCADO DE ARROZ DE TUNGURAHUA, POR POLIMENTO, 2018-2032 (MIL USD)
TABELA 1664 MERCADO DE ARROZ DE TUNGURAHUA, POR POLIMENTO, 2018-2032 (TONELADAS)
TABELA 1665 MERCADO DE ARROZ DE TUNGURAHUA, POR POLIMENTO, 2018-2032 (USD/KG)
TABELA 1666 MERCADO DE ARROZ DE TUNGURAHUA, POR FORTIFICAÇÃO, 2018-2032 (MIL USD)
TABELA 1667 MERCADO DE ARROZ DE TUNGURAHUA, POR FORTIFICAÇÃO, 2018-2032 (TONELADAS)
TABELA 1668 MERCADO DE ARROZ DE TUNGURAHUA, POR FORTIFICAÇÃO, 2018-2032 (USD/KG)
TABELA 1669 TUNGURAHUA FORTIFICADO NO MERCADO DE ARROZ, POR PROCESSO, 2018-2032 (MIL USD)
TABELA 1670 MERCADO DE ARROZ DE TUNGURAHUA, POR AROMA, 2018-2032 (MIL USD)
TABELA 1671 MERCADO DE ARROZ DE TUNGURAHUA, POR AROMA, 2018-2032 (TONELADAS)
TABELA 1672 MERCADO DE ARROZ DE TUNGURAHUA, POR AROMA, 2018-2032 (USD/KG)
TABELA 1673 ARROZ AROMÁTICO TUNGURAHUA NO MERCADO DE ARROZ, POR TIPO, 2018-2032 (MIL USD)
TABELA 1674 MERCADO DE ARROZ DE TUNGURAHUA, POR DERIVADOS DE ARROZ, 2018-2032 (MIL USD)
TABELA 1675 MERCADO DE ARROZ DE TUNGURAHUA, POR DERIVADOS DE ARROZ, 2018-2032 (TONELADAS)
TABELA 1676 MERCADO DE ARROZ DE TUNGURAHUA, POR DERIVADOS DE ARROZ, 2018-2032 (USD/KG)
TABELA 1677 MERCADO DE ARROZ DE TUNGURAHUA, POR USUÁRIO FINAL, 2018-2032 (MIL USD)
TABELA 1678 MERCADO DE ARROZ DE TUNGURAHUA, POR USUÁRIO FINAL, 2018-2032 (TONELADAS)
TABELA 1679 MERCADO DE ARROZ DE TUNGURAHUA, POR USUÁRIO FINAL, 2018-2032 (USD/KG)
TABELA 1680 ALIMENTOS E BEBIDAS NO MERCADO DE ARROZ DE TUNGURAHUA, POR TIPO, 2018-2032 (MIL USD)
TABELA 1681 ALIMENTOS DE TUNGURAHUA NO MERCADO DE ARROZ, POR TIPO, 2018-2032 (MIL USD)
TABELA 1682 PADARIA TUNGURAHUA NO MERCADO DE ARROZ, POR TIPO, 2018-2032 (MIL USD)
TABELA 1683 ALIMENTOS PROCESSADOS DE TUNGURAHUA NO MERCADO DE ARROZ, POR TIPO, 2018-2032 (MIL USD)
TABELA 1684 CONFEITARIA DE TUNGURAHUA NO MERCADO DE ARROZ, POR TIPO, 2018-2032 (MIL USD)
TABELA 1685 FÓRMULA INFANTIL TUNGURAHUA NO MERCADO DE ARROZ, POR TIPO, 2018-2032 (MIL USD)
TABELA 1686 PRODUTOS LATICÍNIOS DE TUNGURAHUA NO MERCADO DE ARROZ, POR TIPO, 2018-2032 (MIL USD)
TABELA 1687 BEBIDAS DE TUNGURAHUA NO MERCADO DE ARROZ, POR TIPO, 2018-2032 (MIL USD)
TABELA 1688 BEBIDAS SAUDÁVEIS DE TUNGURAHUA NO MERCADO DE ARROZ, POR TIPO, 2018-2032 (MIL USD)
TABELA 1689 ALIMENTAÇÃO PARA TUNGURAHUA NO MERCADO DE ARROZ, POR CATEGORIA, 2018-2032 (MIL USD)
TABELA 1690 AVES DE TUNGURAHUA NO MERCADO DE ARROZ, POR TIPO, 2018-2032 (MIL USD)
TABELA 1691 RUMINANTES DE TUNGURAHUA NO MERCADO DE ARROZ, POR TIPO, 2018-2032 (MIL USD)
TABELA 1692 SUÍNOS TUNGURAHUA NO MERCADO DE ARROZ, POR TIPO, 2018-2032 (MIL USD)
TABELA 1693 TUNGURAHUA PET NO MERCADO DE ARROZ, POR TIPO, 2018-2032 (MIL USD)
TABELA 1694 ANIMAIS AQUÁTICOS TUNGURAHUA NO MERCADO DE ARROZ, POR TIPO, 2018-2032 (MIL USD)
TABELA 1695 CRUSTÁCEOS TUNGURAHUA NO MERCADO DE ARROZ, POR TIPO, 2018-2032 (MIL USD)
TABELA 1696 PEIXE TUNGURAHUA NO MERCADO DE ARROZ, POR TIPO, 2018-2032 (MIL USD)
TABELA 1697 MOLUSCOS TUNGURAHUA NO MERCADO DE ARROZ, POR TIPO, 2018-2032 (MIL USD)
TABELA 1698 ALIMENTAÇÃO DE TUNGURAHUA NO MERCADO DE ARROZ, POR FUNÇÃO DE SAÚDE, 2018-2032 (MIL USD)
TABELA 1699 PRODUTOS FARMACÊUTICOS DE TUNGURAHUA NO MERCADO DE ARROZ, POR APLICAÇÃO, 2018-2032 (MIL USD)
TABELA 1700 INFECÇÕES UROGENITAIS POR TUNGURAHUA NO MERCADO DE ARROZ, POR TIPO, 2018-2032 (MIL USD)
TABELA 1701 PRODUTOS FARMACÊUTICOS DE TUNGURAHUA NO MERCADO DE ARROZ, POR FORMULÁRIO DE PRODUTO, 2018-2032 (MIL USD)
TABELA 1702 COSMÉTICOS E CUIDADOS PESSOAIS DE TUNGURAHUA NO MERCADO DE ARROZ, POR CATEGORIA, 2018-2032 (MIL USD)
TABELA 1703 PRODUTOS DE CUIDADOS FACIAIS DE TUNGURAHUA NO MERCADO DE ARROZ, POR TIPO, 2018-2032 (MIL USD)
TABELA 1704 PRODUTOS PARA CUIDADOS COM OS CABELOS DE TUNGURAHUA NO MERCADO DE ARROZ, POR TIPO, 2018-2032 (MIL USD)
TABELA 1705 SUPLEMENTOS DIETÉTICOS DE TUNGURAHUA NO MERCADO DE ARROZ, POR TIPO, 2018-2032 (MIL USD)
TABELA 1706 SUPLEMENTOS DIETÉTICOS DE TUNGURAHUA NO MERCADO DE ARROZ, POR FORMULÁRIO DE PRODUTO, 2018-2032 (MIL USD)
TABELA 1707 MERCADO DE ARROZ DE TUNGURAHUA, POR CANAL DE DISTRIBUIÇÃO, 2018-2032 (MIL USD)
TABELA 1708 MERCADO DE ARROZ DE TUNGURAHUA, POR CANAL DE DISTRIBUIÇÃO, 2018-2032 (TONELADAS)
TABELA 1709 MERCADO DE ARROZ DE TUNGURAHUA, POR CANAL DE DISTRIBUIÇÃO, 2018-2032 (USD/KG)
TABELA 1710 TUNGURAHUA OFFLINE NO MERCADO DE ARROZ, POR TIPO, 2018-2032 (USD MIL)
TABELA 1711 VENDAS NO VAREJO DE TUNGURAHUA NO MERCADO DE ARROZ, POR TIPO DE CANAL, 2018-2032 (MIL USD)
TABELA 1712 TUNGURAHUA ONLINE NO MERCADO DE ARROZ, POR TIPO, 2018-2032 (MIL USD)
TABELA 1713 MERCADO DE ARROZ DE ZAMORA-CHINCHIPE, POR TIPO, 2018-2032 (MIL USD)
TABELA 1714 MERCADO DE ARROZ DE ZAMORA-CHINCHIPE, POR TIPO, 2018-2032 (TONELADAS)
TABELA 1715 MERCADO DE ARROZ DE ZAMORA-CHINCHIPE, POR TIPO, 2018-2032 (USD/KG)
TABELA 1716 MERCADO DE ARROZ ZAMORA-CHINCHIPE, POR COR DE ARROZ, 2018-2032 (MIL USD)
TABELA 1717 MERCADO DE ARROZ ZAMORA-CHINCHIPE, POR COR DE ARROZ, 2018-2032 (TONELADAS)
TABELA 1718 MERCADO DE ARROZ ZAMORA-CHINCHIPE, POR COR DO ARROZ, 2018-2032 (USD/KG)
TABELA 1719 MERCADO DE ARROZ DE ZAMORA-CHINCHIPE, POR TAMANHO DO GRÃO/TAMANHO DO GRÃO, 2018-2032 (MIL USD)
TABELA 1720 MERCADO DE ARROZ DE ZAMORA-CHINCHIPE, POR TAMANHO DO GRÃO/TAMANHO DO GRÃO, 2018-2032 (TONELADAS)
TABELA 1721 MERCADO DE ARROZ DE ZAMORA-CHINCHIPE, POR TAMANHO DO GRÃO/TAMANHO DO GRÃO, 2018-2032 (USD/KG)
TABELA 1722 MERCADO DE ARROZ DE ZAMORA-CHINCHIPE, POR NATUREZA, 2018-2032 (MIL USD)
TABELA 1723 MERCADO DE ARROZ DE ZAMORA-CHINCHIPE, POR NATUREZA, 2018-2032 (TONELADAS)
TABELA 1724 MERCADO DE ARROZ DE ZAMORA-CHINCHIPE, POR NATUREZA, 2018-2032 (USD/KG)
TABELA 1725 MERCADO DE ARROZ DE ZAMORA-CHINCHIPE, POR TEOR DE AMIDO, 2018-2032 (MIL USD)
TABELA 1726 MERCADO DE ARROZ DE ZAMORA-CHINCHIPE, POR TEOR DE AMIDO, 2018-2032 (TONELADAS)
TABELA 1727 MERCADO DE ARROZ DE ZAMORA-CHINCHIPE, POR TEOR DE AMIDO, 2018-2032 (USD/KG)
TABELA 1728 MERCADO DE ARROZ DE ZAMORA-CHINCHIPE, POR FORMULÁRIO DE PROCESSAMENTO, 2018-2032 (MIL USD)
TABELA 1729 MERCADO DE ARROZ DE ZAMORA-CHINCHIPE, POR FORMULÁRIO DE PROCESSAMENTO, 2018-2032 (TONELADAS)
TABELA 1730 MERCADO DE ARROZ DE ZAMORA-CHINCHIPE, POR FORMULÁRIO DE PROCESSAMENTO, 2018-2032 (USD/KG)
TABELA 1731 MERCADO DE ARROZ DE ZAMORA-CHINCHIPE, POR GRAU DE MOAGEM, 2018-2032 (MIL USD)
TABELA 1732 MERCADO DE ARROZ DE ZAMORA-CHINCHIPE, POR GRAU DE MOAGEM, 2018-2032 (TONELADAS)
TABELA 1733 MERCADO DE ARROZ DE ZAMORA-CHINCHIPE, POR GRAU DE MOAGEM, 2018-2032 (USD/KG)
TABELA 1734 MERCADO DE ARROZ DE ZAMORA-CHINCHIPE, POR POLIMENTO, 2018-2032 (MIL USD)
TABELA 1735 MERCADO DE ARROZ ZAMORA-CHINCHIPE, POR POLIMENTO, 2018-2032 (TONELADAS)
TABELA 1736 MERCADO DE ARROZ DE ZAMORA-CHINCHIPE, POR POLIMENTO, 2018-2032 (USD/KG)
TABELA 1737 MERCADO DE ARROZ DE ZAMORA-CHINCHIPE, POR FORTIFICAÇÃO, 2018-2032 (MIL USD)
TABELA 1738 MERCADO DE ARROZ ZAMORA-CHINCHIPE, POR FORTIFICAÇÃO, 2018-2032 (TONELADAS)
TABELA 1739 MERCADO DE ARROZ DE ZAMORA-CHINCHIPE, POR FORTIFICAÇÃO, 2018-2032 (USD/KG)
TABELA 1740 ZAMORA-CHINCHIPE FORTIFICADO NO MERCADO DE ARROZ, POR PROCESSO, 2018-2032 (MIL USD)
TABELA 1741 MERCADO DE ARROZ ZAMORA-CHINCHIPE, POR AROMA, 2018-2032 (MIL USD)
TABELA 1742 MERCADO DE ARROZ ZAMORA-CHINCHIPE, DA AROMA, 2018-2032 (TONELADAS)
TABELA 1743 MERCADO DE ARROZ ZAMORA-CHINCHIPE, POR AROMA, 2018-2032 (USD/KG)
TABELA 1744 ARROZ AROMÁTICO ZAMORA-CHINCHIPE NO MERCADO DE ARROZ, POR TIPO, 2018-2032 (MIL USD)
TABELA 1745 MERCADO DE ARROZ ZAMORA-CHINCHIPE, POR DERIVADOS DE ARROZ, 2018-2032 (MIL USD)
TABELA 1746 MERCADO DE ARROZ ZAMORA-CHINCHIPE, POR DERIVADOS DE ARROZ, 2018-2032 (TONELADAS)
TABELA 1747 MERCADO DE ARROZ ZAMORA-CHINCHIPE, POR DERIVADOS DE ARROZ, 2018-2032 (USD/KG)
TABELA 1748 MERCADO DE ARROZ DE ZAMORA-CHINCHIPE, POR USUÁRIO FINAL, 2018-2032 (MIL USD)
TABELA 1749 MERCADO DE ARROZ DE ZAMORA-CHINCHIPE, POR USUÁRIO FINAL, 2018-2032 (TONELADAS)
TABELA 1750 MERCADO DE ARROZ DE ZAMORA-CHINCHIPE, POR USUÁRIO FINAL, 2018-2032 (USD/KG)
TABELA 1751 ALIMENTOS E BEBIDAS DE ZAMORA-CHINCHIPE NO MERCADO DE ARROZ, POR TIPO, 2018-2032 (MIL USD)
TABELA 1752 ALIMENTOS DE ZAMORA-CHINCHIPE NO MERCADO DE ARROZ, POR TIPO, 2018-2032 (MIL USD)
TABELA 1753 PADARIA ZAMORA-CHINCHIPE NO MERCADO DE ARROZ, POR TIPO, 2018-2032 (MIL USD)
TABELA 1754 ALIMENTOS PROCESSADOS NO MERCADO DE ARROZ DE ZAMORA-CHINCHIPE, POR TIPO, 2018-2032 (MIL USD)
TABELA 1755 DOCES ZAMORA-CHINCHIPE NO MERCADO DE ARROZ, POR TIPO, 2018-2032 (MIL USD)
TABELA 1756 FÓRMULA INFANTIL ZAMORA-CHINCHIPE NO MERCADO DE ARROZ, POR TIPO, 2018-2032 (MIL USD)
TABELA 1757 PRODUTOS LATICÍNIOS DE ZAMORA-CHINCHIPE NO MERCADO DE ARROZ, POR TIPO, 2018-2032 (MIL USD)
TABELA 1758 BEBIDAS DE ZAMORA-CHINCHIPE NO MERCADO DE ARROZ, POR TIPO, 2018-2032 (MIL USD)
TABELA 1759 BEBIDAS SAUDÁVEIS DE ZAMORA-CHINCHIPE NO MERCADO DE ARROZ, POR TIPO, 2018-2032 (MIL USD)
TABELA 1760 RAÇÃO ZAMORA-CHINCHIPE NO MERCADO DE ARROZ, POR CATEGORIA, 2018-2032 (MIL USD)
TABELA 1761 AVES DE ZAMORA-CHINCHIPE NO MERCADO DE ARROZ, POR TIPO, 2018-2032 (MIL USD)
TABELA 1762 RUMINANTES DE ZAMORA-CHINCHIPE NO MERCADO DE ARROZ, POR TIPO, 2018-2032 (MIL USD)
TABELA 1763 SUÍNOS ZAMORA-CHINCHIPE NO MERCADO DE ARROZ, POR TIPO, 2018-2032 (MIL USD)
TABELA 1764 ZAMORA-CHINCHIPE PET NO MERCADO DE ARROZ, POR TIPO, 2018-2032 (USD MIL)
TABELA 1765 ANIMAIS AQUÁTICOS DE ZAMORA-CHINCHIPE NO MERCADO DE ARROZ, POR TIPO, 2018-2032 (MIL USD)
TABELA 1766 CRUSTÁCEOS DE ZAMORA-CHINCHIPE NO MERCADO DE ARROZ, POR TIPO, 2018-2032 (MIL USD)
TABELA 1767 PEIXE DE ZAMORA-CHINCHIPE NO MERCADO DE ARROZ, POR TIPO, 2018-2032 (MIL USD)
TABELA 1768 MOLUSCOS ZAMORA-CHINCHIPE NO MERCADO DE ARROZ, POR TIPO, 2018-2032 (MIL USD)
TABELA 1769 RAÇÃO ZAMORA-CHINCHIPE NO MERCADO DE ARROZ, POR FUNÇÃO DE SAÚDE, 2018-2032 (MIL USD)
TABELA 1770 PRODUTOS FARMACÊUTICOS ZAMORA-CHINCHIPE NO MERCADO DE ARROZ, POR APLICAÇÃO, 2018-2032 (MIL USD)
TABELA 1771 INFECÇÕES UROGENITAIS DE ZAMORA-CHINCHIPE NO MERCADO DE ARROZ, POR TIPO, 2018-2032 (MIL USD)
TABELA 1772 PRODUTOS FARMACÊUTICOS ZAMORA-CHINCHIPE NO MERCADO DE ARROZ, POR FORMA DE PRODUTO, 2018-2032 (MIL USD)
TABELA 1773 ZAMORA-CHINCHIPE COSMÉTICOS E CUIDADOS PESSOAIS NO MERCADO DE ARROZ, POR CATEGORIA, 2018-2032 (MIL USD)
TABELA 1774 PRODUTOS DE CUIDADOS FACIAIS DE ZAMORA-CHINCHIPE NO MERCADO DE ARROZ, POR TIPO, 2018-2032 (MIL USD)
TABELA 1775 PRODUTOS PARA CUIDADOS COM OS CABELOS DE ZAMORA-CHINCHIPE NO MERCADO DE ARROZ, POR TIPO, 2018-2032 (MIL USD)
TABELA 1776 SUPLEMENTOS ALIMENTARES DE ZAMORA-CHINCHIPE NO MERCADO DE ARROZ, POR TIPO, 2018-2032 (MIL USD)
TABELA 1777 SUPLEMENTOS ALIMENTARES DE ZAMORA-CHINCHIPE NO MERCADO DE ARROZ, POR FORMA DE PRODUTO, 2018-2032 (MIL USD)
TABELA 1778 MERCADO DE ARROZ ZAMORA-CHINCHIPE, POR CANAL DE DISTRIBUIÇÃO, 2018-2032 (MIL USD)
TABELA 1779 MERCADO DE ARROZ ZAMORA-CHINCHIPE, POR CANAL DE DISTRIBUIÇÃO, 2018-2032 (TONELADAS)
TABELA 1780 MERCADO DE ARROZ DE ZAMORA-CHINCHIPE, POR CANAL DE DISTRIBUIÇÃO, 2018-2032 (USD/KG)
TABELA 1781 ZAMORA-CHINCHIPE OFFLINE NO MERCADO DE ARROZ, POR TIPO, 2018-2032 (USD MIL)
TABELA 1782 VENDAS NO VAREJO DE ZAMORA-CHINCHIPE NO MERCADO DE ARROZ, POR TIPO DE CANAL, 2018-2032 (MIL USD)
TABELA 1783 ZAMORA-CHINCHIPE ONLINE NO MERCADO DE ARROZ, POR TIPO, 2018-2032 (USD MIL)
Lista de Figura
FIGURA 1 MERCADO DE ARROZ DO EQUADOR
FIGURA 2 MERCADO DE ARROZ DO EQUADOR: TRIANGULAÇÃO DE DADOS
FIGURA 3 MERCADO DE ARROZ DO EQUADOR: ANÁLISE DROC
FIGURA 4 MERCADO DE ARROZ DO EQUADOR: ANÁLISE DE MERCADO GLOBAL VS. REGIONAL
FIGURA 5 MERCADO DE ARROZ DO EQUADOR: ANÁLISE DE PESQUISA DA EMPRESA
FIGURA 6 MERCADO DE ARROZ DO EQUADOR: MODELAGEM MULTIVARIADA
FIGURA 7 MERCADO DE ARROZ DO EQUADOR: ENTREVISTA DEMOGRÁFICA
FIGURA 8 MERCADO DE ARROZ DO EQUADOR: GRADE DE POSIÇÃO DE MERCADO DBMR
FIGURA 9 MERCADO DE ARROZ DO EQUADOR: ANÁLISE DA PARTICIPAÇÃO DOS FORNECEDORES
FIGURA 10 MERCADO DE ARROZ DO EQUADOR: SEGMENTAÇÃO
FIGURA 11 VINTE E OITO SEGMENTOS COMPÕEM O MERCADO DE ARROZ DO EQUADOR, POR TIPO
FIGURA 12 RESUMO EXECUTIVO
FIGURA 13 DECISÕES ESTRATÉGICAS
FIGURA 14 O AUMENTO DO CONSUMO DE ARROZ NO EQUADOR DEVE IMPULSIONAR O MERCADO DE ARROZ DO EQUADOR NO PERÍODO PREVISTO (2025-2032)
FIGURA 15 O ARROZ LARGO DEVE SER REPRESENTANTE DA MAIOR PARCIALIDADE DO MERCADO DE ARROZ DO EQUADOR EM 2025 E 2032
FIGURA 16 AS CINCO FORÇAS DE PORTER
FIGURA 17 MERCADO DE ARROZ DO EQUADOR, 2024-2032, PREÇO MÉDIO DE VENDA (USD/KG)
FIGURA 18 ANÁLISE DA CADEIA DE VALOR DO MERCADO DE ARROZ DO EQUADOR
FIGURA 19 MOTIVADORES, RESTRIÇÕES, OPORTUNIDADES E DESAFIOS DO MERCADO DE ARROZ DO EQUADOR
FIGURA 20 MERCADO DE ARROZ DO EQUADOR: POR TIPO, 2024
FIGURA 21 MERCADO DE ARROZ DO EQUADOR: POR COR DO ARROZ, 2024
FIGURA 22 MERCADO DE ARROZ DO EQUADOR: POR TAMANHO DO GRÃO/TAMANHO DO GRÃO, 2024
FIGURA 23 MERCADO DE ARROZ DO EQUADOR: POR NATUREZA, 2024
FIGURA 24 MERCADO DE ARROZ DO EQUADOR: POR TEOR DE AMIDO, 2024
FIGURA 25 MERCADO DE ARROZ DO EQUADOR, POR FORMULÁRIO DE PROCESSAMENTO, 2024
FIGURA 26 MERCADO DE ARROZ DO EQUADOR: POR GRAU DE MOAGEM, 2024
FIGURA 27 MERCADO DE ARROZ DO EQUADOR, POR POLIMENTO, 2024
FIGURA 28 MERCADO DE ARROZ DO EQUADOR, POR FORTIFICAÇÃO, 2024
FIGURA 29 MERCADO DE ARROZ DO EQUADOR, DA AROMA, 2024
FIGURA 30 MERCADO DE ARROZ DO EQUADOR: POR DERIVADOS DE ARROZ, 2024
FIGURA 31 MERCADO DE ARROZ DO EQUADOR: POR USUÁRIO FINAL, 2024
FIGURA 32 MERCADO DE ARROZ DO EQUADOR: POR CANAL DE DISTRIBUIÇÃO, 2024
FIGURA 33 MERCADO DE ARROZ DO EQUADOR: INSTANTÂNEO (2024)
FIGURA 34 MERCADO DE ARROZ DO EQUADOR: PARTICIPAÇÃO DA EMPRESA 2024 (%)
Metodologia de Investigação
A recolha de dados e a análise do ano base são feitas através de módulos de recolha de dados com amostras grandes. A etapa inclui a obtenção de informações de mercado ou dados relacionados através de diversas fontes e estratégias. Inclui examinar e planear antecipadamente todos os dados adquiridos no passado. Da mesma forma, envolve o exame de inconsistências de informação observadas em diferentes fontes de informação. Os dados de mercado são analisados e estimados utilizando modelos estatísticos e coerentes de mercado. Além disso, a análise da quota de mercado e a análise das principais tendências são os principais fatores de sucesso no relatório de mercado. Para saber mais, solicite uma chamada de analista ou abra a sua consulta.
A principal metodologia de investigação utilizada pela equipa de investigação do DBMR é a triangulação de dados que envolve a mineração de dados, a análise do impacto das variáveis de dados no mercado e a validação primária (especialista do setor). Os modelos de dados incluem grelha de posicionamento de fornecedores, análise da linha de tempo do mercado, visão geral e guia de mercado, grelha de posicionamento da empresa, análise de patentes, análise de preços, análise da quota de mercado da empresa, normas de medição, análise global versus regional e de participação dos fornecedores. Para saber mais sobre a metodologia de investigação, faça uma consulta para falar com os nossos especialistas do setor.
Personalização disponível
A Data Bridge Market Research é líder em investigação formativa avançada. Orgulhamo-nos de servir os nossos clientes novos e existentes com dados e análises que correspondem e atendem aos seus objetivos. O relatório pode ser personalizado para incluir análise de tendências de preços de marcas-alvo, compreensão do mercado para países adicionais (solicite a lista de países), dados de resultados de ensaios clínicos, revisão de literatura, mercado remodelado e análise de base de produtos . A análise de mercado dos concorrentes-alvo pode ser analisada desde análises baseadas em tecnologia até estratégias de carteira de mercado. Podemos adicionar quantos concorrentes necessitar de dados no formato e estilo de dados que procura. A nossa equipa de analistas também pode fornecer dados em tabelas dinâmicas de ficheiros Excel em bruto (livro de factos) ou pode ajudá-lo a criar apresentações a partir dos conjuntos de dados disponíveis no relatório.

