Europe Antibody Drug Conjugates Market
Tamanho do mercado em biliões de dólares
CAGR :
% 
 USD
2.90 Billion
USD
9.73 Billion
2024
2032
USD
2.90 Billion
USD
9.73 Billion
2024
2032
| 2025 –2032 | |
| USD 2.90 Billion | |
| USD 9.73 Billion | |
| % | |
|
Segmentação do mercado de conjugados de anticorpos e fármacos (ADC) na Europa, por produto (Enhertu, Kadcyla, Trodelvy, Polivy, Adcetris, Padcev, Besponsa, Elahere, Zylonta, Mylotarg, Tivdak e outros), componente de antígeno (receptor HER2, Trop-2, CD79B, CD30, Nectin 4, CD22, CD19, CD33, fatores teciduais e outros), componente de anticorpo (ADCs de terceira geração, ADCs de segunda geração, ADCs de quarta geração e ADCs de primeira geração), componente de ligantes (ligantes cliváveis e ligantes não cliváveis), cargas úteis citotóxicas ou componente de ogivas (agentes que danificam o DNA e agentes que interrompem os microtúbulos), tecnologia de ligantes (ligantes peptídicos, ligantes tioéter, ligantes hidrazona e ligantes dissulfeto), tecnologia de conjugação (específica do local Conjugação e Conjugação Química), Indicação (Câncer de Mama, Câncer de Sangue (Leucemia, Linfoma), Câncer de Pulmão, Câncer Ginecológico, Câncer Gastrointestinal, Câncer Geniturinário e Outros), Usuário Final (Hospitais, Centros de Especialidades, Clínicas, Centros Ambulatoriais, Assistência Médica Domiciliar e Outros), Canal de Distribuição (Licitações Diretas, Vendas no Varejo e Outros) - Tendências do Setor e Previsão até 2032
Tamanho do mercado de conjugados de anticorpos e fármacos (ADC) na Europa
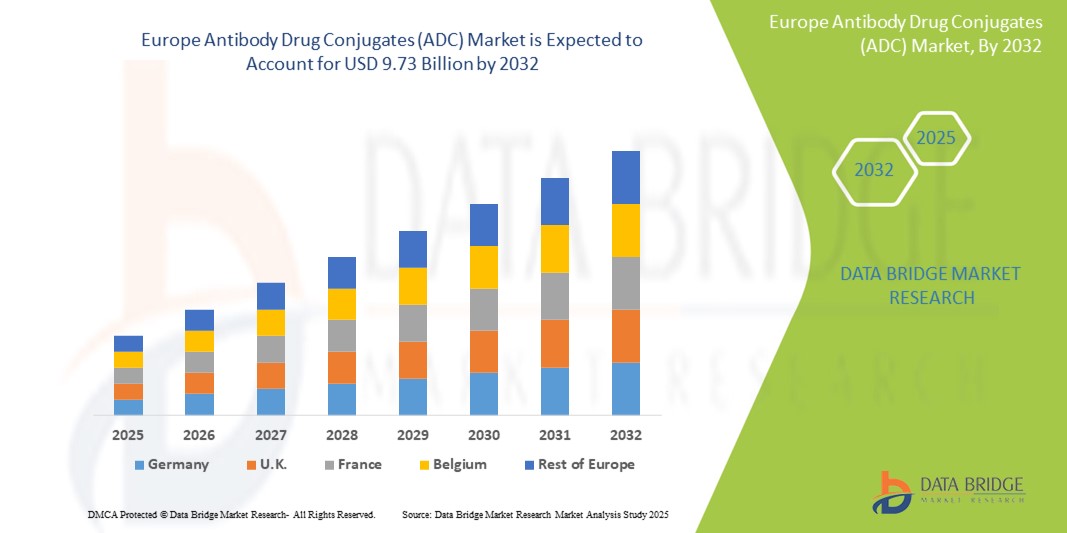
- O tamanho do mercado de conjugados de anticorpos e medicamentos (ADC) da Europa foi avaliado em US$ 2,90 bilhões em 2024 e deve atingir US$ 9,73 bilhões até 2032 , com um CAGR de 16,30% durante o período previsto.
- O crescimento do mercado é amplamente impulsionado pela crescente prevalência do câncer e pela crescente demanda por terapias direcionadas que combinam anticorpos monoclonais com medicamentos citotóxicos, oferecendo maior eficácia com efeitos colaterais reduzidos.
- Além disso, os crescentes investimentos em P&D biofarmacêutico, juntamente com a expansão de pipelines clínicos e o apoio regulatório para tratamentos oncológicos avançados, estão acelerando o desenvolvimento e a adoção de ADCs em toda a Europa. Esses fatores convergentes estão posicionando os ADCs como um pilar fundamental da terapia oncológica de próxima geração, impulsionando significativamente o crescimento do mercado na região.
Análise do mercado de conjugados de anticorpos e fármacos (ADC) na Europa
- Os conjugados de anticorpos e fármacos (ADCs), que combinam a capacidade de direcionamento dos anticorpos monoclonais com a potência de eliminação do câncer dos fármacos citotóxicos, estão se tornando componentes essenciais do tratamento oncológico de precisão na Europa devido ao seu mecanismo direcionado, toxicidade sistêmica minimizada e crescente adoção em terapias hematológicas e de tumores sólidos.
- A crescente procura por ADCs é impulsionada principalmente pelo aumento da incidência de cancro nos países europeus, pela mudança para a medicina personalizada e pela crescente consciencialização e aceitação de novas terapias biológicas entre os prestadores de cuidados de saúde.
- A Alemanha dominou o mercado de conjugados de anticorpos e medicamentos (ADC) com a maior participação na receita de 30,4% em 2024, atribuída à sua forte indústria farmacêutica, altos gastos com saúde e participação ativa em ensaios clínicos, com empresas biofarmacêuticas líderes e instituições de pesquisa acelerando o desenvolvimento e a comercialização de ADC.
- Espera-se que a França seja o país com crescimento mais rápido no mercado de conjugados de anticorpos e medicamentos (ADC) durante o período previsto, devido à expansão dos programas de pesquisa oncológica, às políticas de reembolso favoráveis e ao maior acesso dos pacientes a terapias inovadoras contra o câncer.
- O segmento de câncer de mama liderou o mercado de conjugados de anticorpos e drogas (ADC) com uma participação de mercado de 39,5% em 2024, impulsionado pela alta prevalência da doença e pelo sucesso de ADCs aprovados, como o trastuzumabe deruxtecano, no tratamento de subtipos HER2-positivo e HER2-baixo.
Escopo do Relatório e Segmentação do Mercado de Conjugados de Anticorpos e Medicamentos (ADC) na Europa
|
Atributos |
Principais insights do mercado de conjugados de anticorpos e fármacos (ADC) na Europa |
|
Segmentos abrangidos |
|
|
Países abrangidos |
Europa
|
|
Principais participantes do mercado |
|
|
Oportunidades de mercado |
|
|
Conjuntos de informações de dados de valor agregado |
Além dos insights sobre cenários de mercado, como valor de mercado, taxa de crescimento, segmentação, cobertura geográfica e principais participantes, os relatórios de mercado selecionados pela Data Bridge Market Research também incluem análises aprofundadas de especialistas, análises de preços, análises de participação de marca, pesquisas com consumidores, análises demográficas, análises da cadeia de suprimentos, análises da cadeia de valor, visão geral de matérias-primas/consumíveis, critérios de seleção de fornecedores, análise PESTLE, análise de Porter e estrutura regulatória. |
Tendências do mercado de conjugados de anticorpos e fármacos (ADC) na Europa
“ADCs de próxima geração impulsionando a oncologia de precisão”
- Uma tendência importante e crescente no mercado europeu de ADCs é o surgimento de ADCs de última geração que apresentam novos ligantes, mecanismos aprimorados de entrega de carga útil e especificidade tumoral aprimorada, aumentando significativamente seu índice terapêutico e eficácia clínica no tratamento do câncer.
- Por exemplo, o Enhertu (trastuzumabe deruxtecano) da AstraZeneca, desenvolvido em parceria com a Daiichi Sankyo, demonstrou resultados superiores em cânceres de mama HER2-positivos e HER2-baixos, marcando uma mudança de paradigma na utilidade dos ADCs. Da mesma forma, o Elahere, da ImmunoGen, ganhou força em centros de oncologia europeus por atuar no receptor de folato α no câncer de ovário.
- Os avanços na tecnologia de ADC agora permitem ligantes mais estáveis que liberam citotoxinas apenas em células cancerígenas alvo, reduzindo os efeitos não alvo e a toxicidade. Além disso, novos ADCs estão sendo desenvolvidos para cânceres anteriormente difíceis de tratar, como o câncer de mama triplo-negativo e certas neoplasias hematológicas.
- A crescente disponibilidade de diagnósticos complementares e biomarcadores oferece suporte adicional à estratificação de pacientes e ao uso otimizado de ADC, criando regimes de tratamento de câncer mais personalizados e eficazes.
- Esta tendência rumo à precisão, eficácia e segurança está redefinindo o desenvolvimento de ADCs em toda a Europa. Grandes empresas farmacêuticas, como Roche, GSK e ADC Therapeutics, estão investindo fortemente no aprimoramento de tecnologias de ligantes e na ampliação de seus pipelines de ADCs, com o objetivo de expandir as indicações e aprimorar a resposta geral ao tratamento.
- À medida que os especialistas em oncologia favorecem cada vez mais terapias direcionadas e toleráveis, a demanda por ADCs de última geração está aumentando nos sistemas de saúde europeus, impulsionando o crescimento do mercado e remodelando o futuro do tratamento do câncer.
Dinâmica do mercado de conjugados de anticorpos e fármacos (ADC) na Europa
Motorista
“Aumento da carga de câncer aliado a avanços na terapia direcionada”
- A crescente incidência de câncer em países europeus, juntamente com o papel crescente das terapias direcionadas em oncologia, é um fator-chave que acelera a demanda por ADCs
- Por exemplo, em 2024, a Agência Europeia de Medicamentos (EMA) aprovou vários ADCs para novas indicações, refletindo o compromisso da região em acelerar o acesso a medicamentos biológicos inovadores. Países como Alemanha, Reino Unido e França estão liderando o movimento com redes robustas de ensaios clínicos e programas de P&D em oncologia.
- Os ADCs fornecem a precisão de anticorpos monoclonais combinados com citotoxinas potentes, permitindo que os oncologistas ataquem as células tumorais enquanto poupam o tecido saudável, oferecendo um perfil de segurança favorável e melhores resultados para os pacientes.
- Os planos nacionais de oncologia na Europa apoiam cada vez mais a integração de terapias de precisão, como os ADCs, em protocolos oncológicos padrão. A busca por tratamentos específicos para cada paciente e a coleta de evidências em tempo real estão fomentando ainda mais a adoção dos ADCs.
- Além disso, o crescente número de esforços colaborativos entre a academia e as empresas farmacêuticas está impulsionando a pesquisa clínica e os programas de acesso antecipado, aumentando a aceitação do mercado de novos produtos ADC.
Restrição/Desafio
“Complexidade de fabricação e altos custos de desenvolvimento”
- Um dos principais desafios que limita a adoção mais ampla do ADC na Europa é o processo de fabricação complexo e caro, que requer infraestrutura avançada, instalações especializadas e controles de qualidade rigorosos para conjugação e purificação.
- Por exemplo, a produção de ligantes estáveis e técnicas de conjugação específicas de sítios exige pessoal altamente qualificado e bioprocessamento intensivo em capital, o que pode restringir a escalabilidade da produção e limitar a disponibilidade.
- Os obstáculos regulatórios também representam restrições significativas, uma vez que os ADCs devem cumprir diretrizes rigorosas que abrangem produtos biológicos, citotóxicos e combinados, o que muitas vezes leva a prazos de desenvolvimento e processos de aprovação mais longos.
- Além disso, o alto custo das terapias de ADC pode sobrecarregar os orçamentos de saúde, especialmente em países com estruturas de reembolso limitadas ou controles de preços rigorosos. Enquanto países da Europa Ocidental, como Alemanha e Holanda, oferecem forte apoio ao reembolso, outros enfrentam dificuldades para garantir financiamento para produtos biológicos oncológicos premium.
- A superação destes obstáculos exigirá uma maior harmonização regulamentar, avanços na produção com melhor custo-eficácia e uma inclusão mais ampla dos ADC na cobertura dos cuidados de saúde públicos em todos os mercados europeus.
Escopo do mercado de conjugados de anticorpos e fármacos (ADC) na Europa
O mercado é segmentado com base no produto, componente de antígeno, componente de anticorpo, componente de ligação, cargas citotóxicas, tecnologia de ligação, tecnologia de conjugação, indicação, usuário final e canal de distribuição.
- Por produto
Com base no produto, o mercado europeu de conjugados de anticorpo-droga (ADC) é segmentado em Enhertu, Kadcyla, Trodelvy, Polivy, Adcetris, Padcev, Besponsa, Elahere, Zylonta, Mylotarg, Tivdak e outros. O segmento Enhertu dominou o mercado, com a maior participação na receita em 2024, impulsionado por sua eficácia comprovada no tratamento do câncer de mama HER2-positivo e HER2-baixo. Sua rápida adoção clínica nos principais centros oncológicos europeus é apoiada por aprovações favoráveis da EMA e desempenho em situações reais.
Prevê-se que o segmento Elahere apresente a maior taxa de crescimento entre 2025 e 2032, impulsionado por seu uso inovador no tratamento do câncer de ovário com receptor de folato α-positivo. Seu mecanismo de ação diferenciado e o uso clínico em expansão em países como França e Itália contribuem para sua rápida tração no mercado.
- Por componente de antígeno
Com base no componente antigênico, o mercado europeu de conjugados de anticorpo e fármaco (ADC) é segmentado em Receptor HER2, Trop-2, CD79B, CD30, Nectina 4, CD22, CD19, CD33, Fatores Teciduais e outros. O segmento de Receptor HER2 dominou o mercado, com a maior participação na receita em 2024, devido ao sucesso de ADCs direcionados ao HER2, como Enhertu e Kadcyla, particularmente na Alemanha e no Reino Unido, onde o câncer de mama HER2-positivo continua sendo uma indicação importante.
Espera-se que o segmento Trop-2 testemunhe a maior taxa de crescimento entre 2025 e 2032, impulsionado pelo uso clínico crescente do Trodelvy em cânceres de mama e bexiga metastáticos, com crescente cobertura de aprovação em países europeus.
- Por componente de anticorpo
Com base no componente anticorpo, o mercado europeu de conjugados de anticorpo e fármaco (ADC) é segmentado em ADCs de primeira geração, ADCs de segunda geração, ADCs de terceira geração e ADCs de quarta geração. O segmento de ADCs de segunda geração deteve a maior participação de mercado na receita em 2024, apoiado pela confiabilidade clínica e pelo sucesso comercial de produtos como Kadcyla e Adcetris. Esses ADCs oferecem um perfil equilibrado de eficácia e segurança.
Espera-se que o segmento de ADCs de Quarta Geração cresça na CAGR mais rápida de 2025 a 2032, apoiado pelo desenvolvimento inovador em conjugação específica do local e mecanismos otimizados de liberação de carga útil, oferecendo direcionamento aprimorado e toxicidade reduzida.
- Por componente vinculador
Com base no componente de ligação, o mercado europeu de conjugados de anticorpos e fármacos (ADC) é segmentado em ligação cliváveis e ligação não cliváveis. O segmento de ligação cliváveis dominou o mercado com a maior participação na receita de mercado em 2024, devido à sua capacidade de liberação seletiva de carga útil dentro de microambientes tumorais, aumentando o efeito terapêutico e minimizando a toxicidade fora do alvo.
O segmento de ligantes não cliváveis deverá crescer na taxa mais rápida, especialmente em malignidades hematológicas, onde o processamento e a estabilidade intracelular são essenciais para a ativação do medicamento e a consistência da resposta.
- Por cargas citotóxicas
Com base em cargas úteis citotóxicas ou ogivas, o mercado europeu de conjugados de anticorpo e fármaco (ADC) é segmentado em Agentes Danificadores de DNA e Agentes Disruptores de Microtúbulos. O segmento de Agentes Disruptores de Microtúbulos deteve a maior participação de mercado em 2024, amplamente utilizado em ADCs aprovados, como Kadcyla e Adcetris, oferecendo atividade antitumoral comprovada em tumores hematológicos e sólidos.
Espera-se que o segmento de agentes que danificam o DNA testemunhe o crescimento mais rápido entre 2025 e 2032, devido à crescente adoção de ADCs como o Enhertu, que utiliza esses agentes potentes para tratar tipos de câncer agressivos e resistentes.
- Por Linker Technology
Com base na tecnologia de ligantes, o mercado europeu de conjugados de anticorpos e fármacos (ADC) é segmentado em ligantes peptídicos, ligantes tioéter, ligantes hidrazona e ligantes dissulfeto. O segmento de Ligantes Peptídicos dominou o mercado, com a maior participação na receita em 2024, sendo favorecido por sua clivagem enzimática e capacidade de liberar seletivamente citotoxinas dentro das células cancerígenas, melhorando a especificidade do tratamento.
O segmento de ligantes dissulfeto deverá crescer na taxa mais rápida durante o período previsto, impulsionado pela inovação em sistemas de administração sensíveis a redox e maior inclusão em novos pipelines clínicos de ADC direcionados a tumores sólidos.
- Por Tecnologia de Conjugação
Com base na tecnologia de conjugação, o mercado europeu de conjugados anticorpo-fármaco (ADC) é segmentado em conjugação sítio-específica e conjugação química. O segmento de Conjugação Química deteve a maior participação de mercado em 2024, devido ao seu amplo uso em ADCs de primeira geração e aos protocolos de fabricação estabelecidos.
Espera-se que o segmento de Conjugação Específica do Sítio registre a maior taxa de crescimento entre 2025 e 2032, apoiado pela crescente demanda por ADCs homogêneos com farmacocinética consistente e efeitos secundários reduzidos.
- Por Indicação
Com base na indicação, o mercado europeu de conjugados de anticorpos e fármacos (ADC) é segmentado em câncer de mama, câncer de sangue (leucemia, linfoma), câncer de pulmão, câncer ginecológico, câncer gastrointestinal, câncer geniturinário e outros. O segmento de câncer de mama dominou o mercado, com a maior participação na receita de mercado, de 39,5% em 2024, impulsionado pela alta carga da doença na Europa e pela ampla adoção de ADCs direcionados ao HER2.
Espera-se que o segmento de câncer ginecológico testemunhe a maior taxa de crescimento entre 2025 e 2032, impulsionado pela expansão das aprovações do Elahere e pelo maior foco no tratamento do câncer de ovário na França, Espanha e Itália.
- Por usuário final
Com base no usuário final, o mercado europeu de conjugados de anticorpos e medicamentos (ADC) é segmentado em hospitais, centros especializados, clínicas, centros ambulatoriais, assistência médica domiciliar e outros. O segmento de Hospitais deteve a maior participação de mercado em 2024, apoiado por infraestrutura avançada para diagnóstico e tratamento de câncer, aquisição centralizada de medicamentos e equipes multidisciplinares de atendimento.
Espera-se que o segmento de Centros Especializados cresça na CAGR mais rápida de 2025 a 2032, impulsionado pela crescente preferência por cuidados oncológicos especializados e pela administração simplificada de terapias complexas, como ADCs.
- Por canal de distribuição
Com base no canal de distribuição, o mercado europeu de conjugados de anticorpos e medicamentos (ADC) é segmentado em leilões diretos, vendas no varejo e outros. O segmento de leilões diretos dominou o mercado, com a maior participação na receita em 2024, principalmente em países com sistemas públicos de saúde, como Alemanha e Reino Unido, onde a aquisição centralizada garante o acesso a produtos biológicos de alto custo.
Espera-se que o segmento de vendas no varejo testemunhe a maior taxa de crescimento entre 2025 e 2032, apoiado pelo maior acesso a terapias ADC ambulatoriais e pela expansão de farmácias oncológicas em centros urbanos da Europa.
Análise regional do mercado europeu de conjugados de anticorpos e fármacos (ADC)
- A Alemanha dominou o mercado de conjugados de anticorpos e medicamentos (ADC) com a maior participação na receita de 30,4% em 2024, atribuída à sua forte indústria farmacêutica, altos gastos com saúde e participação ativa em ensaios clínicos, com empresas biofarmacêuticas líderes e instituições de pesquisa acelerando o desenvolvimento e a comercialização de ADC.
- Médicos e pesquisadores na Alemanha priorizam a medicina de precisão, com ADCs cada vez mais integrados aos protocolos de tratamento do câncer de mama, sangue e ginecológico, apoiados por estruturas de reembolso favoráveis e acesso a ferramentas avançadas de diagnóstico.
- Essa liderança de mercado é ainda mais fortalecida pela participação ativa da Alemanha em ensaios clínicos, colaborações entre empresas de biotecnologia e instituições acadêmicas e eficiência regulatória, posicionando o país na vanguarda da inovação e comercialização de ADC em toda a Europa.
Visão geral do mercado de conjugados de anticorpos e fármacos (ADC) da Alemanha
O mercado alemão de conjugados de anticorpos e medicamentos (ADC) conquistou a maior fatia de receita na Europa em 2024, graças ao seu avançado sistema de saúde, sólida infraestrutura oncológica e papel ativo na pesquisa clínica. Com uma alta taxa de adoção de terapias de última geração contra o câncer e a presença de importantes empresas farmacêuticas, a Alemanha lidera a região tanto em inovação quanto em acesso a tratamentos. Parcerias estratégicas entre empresas de biotecnologia e instituições acadêmicas estão impulsionando ainda mais a expansão do pipeline.
Visão geral do mercado de conjugados de anticorpos e fármacos (ADC) na França
O mercado francês de conjugados de anticorpos (ADC) deverá crescer a um CAGR notável durante o período previsto, apoiado por uma rede robusta de tratamento do câncer e iniciativas governamentais em pesquisa em ciências da vida. A crescente adoção de ADCs para câncer ginecológico e de mama, aliada a fortes mecanismos de reembolso e programas de acesso antecipado ao mercado, está contribuindo para o crescimento. O compromisso da França com a oncologia de precisão está incentivando o desenvolvimento clínico e aprovações aceleradas.
Visão geral do mercado de conjugados de anticorpos e medicamentos (ADC) do Reino Unido
Espera-se que o mercado de conjugados de anticorpos (ADC) do Reino Unido se expanda de forma constante, impulsionado pela crescente demanda por terapias inovadoras contra o câncer e pela priorização de produtos biológicos direcionados no Serviço Nacional de Saúde (NHS). A alta prevalência de câncer, especialmente de mama e hematológicos, está impulsionando a adoção de ADCs aprovados pela EMA. Além disso, o vibrante setor biofarmacêutico do Reino Unido e a participação em ensaios clínicos multinacionais estão ajudando a fortalecer sua posição no mercado de ADCs.
Visão geral do mercado de conjugados de anticorpos e medicamentos (ADC) na Itália
O mercado italiano de conjugados de anticorpos e medicamentos (ADC) está testemunhando um interesse crescente, impulsionado pelo aumento de casos de câncer e pelo foco nacional na melhoria das vias de tratamento oncológico. A disponibilidade de medicamentos oncológicos de ponta em centros de tratamento hospitalares, aliada à crescente conscientização entre oncologistas sobre os benefícios dos ADC, está impulsionando a adoção. A Itália também está investindo em ensaios clínicos e alinhamento regulatório para apoiar tratamentos oncológicos inovadores.
Participação no mercado de conjugados de anticorpos e fármacos (ADC) na Europa
A indústria europeia de conjugados de anticorpos e medicamentos (ADC) é liderada principalmente por empresas bem estabelecidas, incluindo:
- AstraZeneca (Reino Unido)
- F. Hoffmann-La Roche Ltd. (Suíça)
- BioNTech SE (Alemanha)
- ADC Therapeutics SA (Suíça)
- GSK plc (Reino Unido)
- Mablink Bioscience SAS (França)
- Synaffix BV (Holanda)
- Seagen Inc. (EUA)
- Daiichi Sankyo Company, Limited (Japão)
- Pfizer Inc. (EUA)
- Gilead Sciences, Inc. (EUA)
- AbbVie Inc. (EUA)
- Amgen Inc. (EUA)
- ImmunoGen, Inc. (EUA)
- Takeda Pharmaceutical Company Limited (Japão)
- Laboratórios Pierre Fabre (França)
- Philogen SpA (Itália)
- Sobi (Suécia)
- Sartorius AG (Alemanha)
- Bayer AG (Alemanha)
Quais são os desenvolvimentos recentes no mercado global europeu de conjugados de anticorpos e fármacos (ADC)?
- Em maio de 2024, a AstraZeneca e a Daiichi Sankyo anunciaram a expansão de sua área de atuação em ensaios clínicos europeus para o Enhertu (trastuzumabe deruxtecano), visando pacientes com câncer de mama HER2-baixo e câncer de pulmão de células não pequenas. Este desenvolvimento reforça o compromisso das empresas com o avanço da pesquisa de ADC em países-chave da UE, incluindo Alemanha, França e Espanha, ao mesmo tempo em que amplia o acesso dos pacientes a terapias direcionadas de próxima geração na região.
- Em abril de 2024, a ADC Therapeutics SA, com sede na Suíça, firmou parceria com instituições italianas de pesquisa sobre câncer para iniciar os ensaios de Fase II de seu novo ADC direcionado ao CD25 para linfoma de Hodgkin recidivado. A colaboração reflete uma ênfase crescente em ensaios oncológicos específicos para cada região e reforça o papel das redes clínicas europeias na aceleração da inovação em ADC.
- Em março de 2024, a Agência Europeia de Medicamentos (EMA) concedeu status de avaliação acelerada ao Elahere (mirvetuximabe soravtansina), da ImmunoGen, para o tratamento do câncer de ovário resistente à platina. Este marco destaca o crescente apoio da EMA a terapias inovadoras de ADC e espera-se que acelere a revisão regulatória e a disponibilidade em todos os estados-membros da UE.
- Em fevereiro de 2024, o Instituto Nacional de Excelência em Saúde e Cuidados (NICE) do Reino Unido emitiu uma recomendação preliminar positiva para Polivy (polatuzumabe vedotina) em terapias combinadas para linfoma difuso de grandes células B (LDGCB). A medida sinaliza forte apoio nacional à integração de ADCs em regimes de tratamento padrão e à expansão do acesso dos pacientes a medicamentos biológicos avançados.
- Em janeiro de 2024, a BioNTech SE, com sede na Alemanha, anunciou sua entrada no mercado de ADC por meio da aquisição estratégica de uma empresa de biotecnologia europeia especializada em tecnologias de conjugação específicas para cada local. A aquisição visa fortalecer o pipeline de oncologia da BioNTech e destaca o crescente interesse entre os líderes biofarmacêuticos europeus em plataformas de ADC como uma área de foco fundamental para o tratamento direcionado do câncer.
SKU-
Obtenha acesso online ao relatório sobre a primeira nuvem de inteligência de mercado do mundo

- Painel interativo de análise de dados
- Painel de análise da empresa para oportunidades de elevado potencial de crescimento
- Acesso de analista de pesquisa para personalização e customização. consultas
- Análise da concorrência com painel interativo
- Últimas notícias, atualizações e atualizações Análise de tendências
- Aproveite o poder da análise de benchmark para um rastreio abrangente da concorrência
Índice
1 INTRODUÇÃO
1.1 OBJETIVOS DO ESTUDO
1.2 DEFINIÇÃO DE MERCADO
1.3 VISÃO GERAL DO MERCADO EUROPEU DE CONJUGADOS DE ANTICORPOS E MEDICAMENTOS (ADC)
1.4 MOEDA E PREÇOS
1.5 LIMITAÇÕES
1.6 MERCADOS COBERTOS
2 SEGMENTAÇÃO DE MERCADO
2.1 MERCADOS COBERTOS
2.2 ÂMBITO GEOGRÁFICO
2,3 ANOS CONSIDERADOS PARA O ESTUDO
2.4 MODELO DE VALIDAÇÃO DE DADOS TRIPÉ DBMR
2.5 ENTREVISTAS PRINCIPAIS COM PRINCIPAIS LÍDERES DE OPINIÃO
2.6 MODELAGEM MULTIVARIADA
2.7 GRADE DE COBERTURA DE APLICAÇÃO DE MERCADO
2.8 CURVA DE VIDA DO PRODUTO
2.9 GRADE DE POSIÇÃO DE MERCADO DBMR
2.1 ANÁLISE DA PARTICIPAÇÃO DO FORNECEDOR
2.11 FONTES SECUNDÁRIAS
2.12 PREMISSAS
3 RESUMO EXECUTIVO
4 INSIGHTS PREMIUM
4.1 ANÁLISE PESTAL
4.2 AS CINCO FORÇAS DE PORTER
4.3 ANÁLISE PESTEL
5 ANÁLISE DA ESTRUTURA DE CUSTOS DA FABRICAÇÃO DE ANTICORPOS-CONJUGADOS MEDICAMENTOS (ADC)
5.1 ANTICORPOS
5.1.1 VISÃO GERAL DA PRODUÇÃO DE ANTICORPOS
5.1.1.1 Interno vs. Terceirizado:
5.1.2 FATORES DE PREÇO DE ANTICORPOS
5.2 LIGADORES
5.2.1 FUNÇÃO E TIPOS DE LIGADORES
5.2.1.1 Impacto de custo por tipo de vinculador:
5.3 AGENTES CITOTÓXICOS
5.3.1 CONSIDERAÇÕES DE CUSTOS:
5.3.2 TAMPÕES E SOLVENTES
5.4 DETALHAMENTO DE CUSTOS POR ESTÁGIO DE FABRICAÇÃO
5.4.1 CUSTOS DE PRÉ-PRODUÇÃO
5.4.2 PROCESSO DE CONJUGAÇÃO
5.4.3 PURIFICAÇÃO E FILTRAÇÃO
5.4.4 CONTROLE DE QUALIDADE
5.5 PROJEÇÕES DE CUSTOS E TENDÊNCIAS DE PREÇOS (2024–2030)
5.5.1 FLUTUAÇÕES DE CUSTOS PROJETADAS
5.5.2 IMPACTO DE CUSTO DA ESCALABILIDADE
5.6 TENDÊNCIAS DE PREÇOS DE FORNECEDORES E GEOGRÁFICOS
5.6.1 VARIAÇÕES DE CUSTOS GEOGRÁFICOS
5.6.2 ANÁLISE DE FORNECEDORES
5.6.3 CONCLUSÃO
6 MERCADO EUROPEU DE CONJUGADOS DE ANTICORPOS E MEDICAMENTOS (ADC): REGULAMENTAÇÕES
7 VISÃO GERAL DO MERCADO
7.1 MOTORISTAS
7.1.1 AUMENTO DA PREVALÊNCIA DO CÂNCER
7.1.2 AVANÇOS NA TECNOLOGIA DE CONJUGADOS DE ANTICORPOS E DROGAS (ADC)
7.1.3 AUMENTO DA DEMANDA POR TERAPIAS DIRECIONADAS
7.1.4 AVANÇOS NA PESQUISA EM PROTEÔMICA E GENÔMICA
7.2 RESTRIÇÕES
7.2.1 ALTO CUSTO DE DESENVOLVIMENTO E COMPLEXIDADES DE FABRICAÇÃO
7.2.2 QUESTÕES DE SEGURANÇA E TOXICIDADE DE CONJUGADOS DE ANTICORPOS E MEDICAMENTOS
7.3 OPORTUNIDADES
7.3.1 CRESCIMENTO DE UM PROCESSO ONCOLÓGICO PARA CONJUGADOS DE ANTICORPOS E DROGAS (ADCS)
7.3.2 AUMENTO DO INVESTIMENTO EM PESQUISA SOBRE O CÂNCER
7.3.3 AUMENTO DA COLABORAÇÃO COM INSTITUIÇÕES DE PESQUISA PARA CONJUGADOS DE ANTICORPOS E MEDICAMENTOS
7.4 DESAFIOS
7.4.1 FALHAS EM ENSAIOS CLÍNICOS PARA O DESENVOLVIMENTO DE CONJUGADOS DE ANTICORPOS E MEDICAMENTOS
7.4.2 ENSAIOS CLÍNICOS DE LONGA DURAÇÃO E FASES DE DESENVOLVIMENTO
8 MERCADO EUROPEU DE CONJUGADOS DE ANTICORPOS E MEDICAMENTOS (ADC), POR PRODUTO
8.1 VISÃO GERAL
8.2 ENHERTU
8.3 KADCYLA
8.4 TRODELVY
8.5 POLÍTICA
8.6 ADCETRIS
8.7 PADCEV
8.8 BESPONSA
8.9 ELAHERE
8.1 ZYLONTA
8.11 MYLOTARG
8.12 TIVDAK
8.13 OUTROS
9 MERCADO EUROPEU DE CONJUGADOS DE ANTICORPOS E MEDICAMENTOS (ADC), POR COMPONENTE ANTÍGENO
9.1 VISÃO GERAL
9.2 RECEPTOR HER2
9.3 TROP-2
9.4 CD79B
9,5 CD30
9.6 NECTINA 4
9.7 CD22
9.8 CD19
9,9 CD33
9.1 FATORES TECIDUAIS
9.11 OUTROS
10 MERCADOS DE CONJUGADOS DE MEDICAMENTOS COM ANTICORPOS (ADC) NA EUROPA, POR COMPONENTE DE ANTICORPO
10.1 VISÃO GERAL
10.2 ADCS DE TERCEIRA GERAÇÃO
10.3 ADCS DE SEGUNDA GERAÇÃO
10.4 ADCS DE QUARTA GERAÇÃO
10.5 ADCS DE PRIMEIRA GERAÇÃO
11 MERCADO EUROPEU DE CONJUGADOS DE ANTICORPOS E MEDICAMENTOS (ADC), POR COMPONENTE DE LIGAÇÃO
11.1 VISÃO GERAL
11.2 LIGADORES CLIÁVEIS
11.2.1 À BASE DE PEPTÍDEOS
11.2.2 SENSÍVEL AO ÁCIDO OU LÁBIL AO ÁCIDO
11.2.3 DISSULFIDO SENSÍVEL À GLUTATIONA
11.3 LIGADORES NÃO CLIÁVEIS
12 MERCADO EUROPEU DE CONJUGADOS DE ANTICORPOS E MEDICAMENTOS (ADC), POR CARGAS ÚTEIS CITOTÓXICAS OU COMPONENTES DE OGIVAS
12.1 VISÃO GERAL
12.2 AGENTES DANIFICADORES DO DNA
12.2.1 CAMPTOTECINA
12.2.2 CALIQUEMICINA
12.2.3 PIRROLOBENZODIAZEPINAS
12.3 AGENTES DESRUPTORES DE MICROTÚBULOS
12.3.1 AURISTATINA
12.3.2 MAITANSINOIDES
13 MERCADO EUROPEU DE CONJUGADOS DE ANTICORPOS E MEDICAMENTOS (ADC), POR TECNOLOGIA DE LIGAÇÃO
13.1 VISÃO GERAL
13.2 LIGADORES DE PEPTÍDEOS
13.3 LIGANTES TIOÉTER
13.4 LIGANTES DE HIDRAZONA
13.5 LIGANTES DISSULFETO
14 MERCADO EUROPEU DE CONJUGADOS DE ANTICORPOS E MEDICAMENTOS (ADC), POR TECNOLOGIA DE CONJUGAÇÃO
14.1 VISÃO GERAL
14.2 CONJUGAÇÃO ESPECÍFICA DO LOCAL
14.3 CONJUGAÇÃO QUÍMICA
15 MERCADO EUROPEU DE CONJUGADOS DE ANTICORPOS E MEDICAMENTOS (ADC), POR INDICAÇÃO
15.1 VISÃO GERAL
15.2 CÂNCER DE MAMA
15.3 CÂNCER DE SANGUE (LEUCEMIA, LINFOMA)
15.4 CÂNCER DE PULMÃO
15.5 CÂNCER GINECOLÓGICO
15.6 CÂNCER GASTROINTESTINAL
15.7 CÂNCER GENITOURINÁRIO
15.8 OUTROS
16 MERCADO EUROPEU DE CONJUGADOS DE ANTICORPOS E MEDICAMENTOS (ADC), POR USUÁRIO FINAL
16.1 VISÃO GERAL
16.2 HOSPITAIS
16.3 CENTRO DE ESPECIALIDADES
16.4 CLÍNICAS
16.5 CENTROS AMBULATORIAIS
16.6 CUIDADOS DE SAÚDE DOMICILIARES
16.7 OUTROS
17 MERCADO EUROPEU DE CONJUGADOS DE ANTICORPOS E MEDICAMENTOS (ADC), POR CANAL DE DISTRIBUIÇÃO
17.1 VISÃO GERAL
17.2 LICITAÇÕES DIRETAS
17.3 VENDAS NO VAREJO
17.3.1 FARMÁCIA HOSPITALAR
17.3.2 FARMÁCIA DE VAREJO
17.3.3 FARMÁCIA ONLINE
17.4 OUTROS
18 MERCADO EUROPEU DE CONJUGADOS DE ANTICORPOS E MEDICAMENTOS (ADC), POR REGIÃO
18.1 EUROPA
18.1.1 ALEMANHA
18.1.2 Reino Unido
18.1.3 FRANÇA
18.1.4 ITÁLIA
18.1.5 ESPANHA
18.1.6 RÚSSIA
18.1.7 BÉLGICA
18.1.8 HOLANDA
18.1.9 SUÍÇA
18.1.10 ÁUSTRIA
18.1.11 IRLANDA
18.1.12 POLÔNIA
18.1.13 NORUEGA
18.1.14 HUNGRIA
18.1.15 LITUÂNIA
18.1.16 RESTO DA EUROPA
19 CONJUGADOS DE ANTICORPOS PARA MEDICAMENTOS (ADC) DA EUROPA: CENÁRIO DA EMPRESA
19.1 ANÁLISE DE AÇÕES DA EMPRESA: EUROPA
20 ANÁLISE SWOT
21 PERFIS DE EMPRESAS
21.1 DAIICHI SANKYO, INC.
21.1.1 RESUMO DA EMPRESA
21.1.2 ANÁLISE DE RECEITA
21.1.3 PORTFÓLIO DE PRODUTOS
21.1.4 DESENVOLVIMENTO RECENTE
21.2 F. HOFFMANN-LA ROCHE LTD
21.2.1 RESUMO DA EMPRESA
21.2.2 ANÁLISE DE RECEITA
21.2.3 PORTFÓLIO DE PRODUTOS
21.2.4 DESENVOLVIMENTO RECENTE
21.3 GILEAD SCIENCES, INC.
21.3.1 RESUMO DA EMPRESA
21.3.2 RECEITA
21.3.3 PORTFÓLIO DE PRODUTOS
21.3.4 DESENVOLVIMENTO RECENTE
21.4 ASTELLAS PHARMA INC.
21.4.1 RESUMO DA EMPRESA
21.4.2 ANÁLISE DE RECEITA
21.4.3 PORTFÓLIO DE PRODUTOS
21.4.4 DESENVOLVIMENTO RECENTE
21.5 COMPANHIA FARMACÊUTICA TAKEDA LIMITADA
21.5.1 RESUMO DA EMPRESA
21.5.2 ANÁLISE DE RECEITA
21.5.3 PORTFÓLIO DE PRODUTOS
21.5.4 DESENVOLVIMENTO RECENTE
21.6 ABBVIE INC.
21.6.1 RESUMO DA EMPRESA
21.6.2 RECEITA
21.6.3 PORTFÓLIO DE PRODUTOS
21.6.4 DESENVOLVIMENTO RECENTE
21.7 ADC TERAPÊUTICA SA
21.7.1 6.1 RESUMO DA EMPRESA
21.7.2 ANÁLISE DE RECEITA
21.7.3 PORTFÓLIO DE PRODUTOS
21.7.4 DESENVOLVIMENTO RECENTE
21.8 AMGEN, INC.
21.8.1 RESUMO DA EMPRESA
21.8.2 ANÁLISE DE RECEITA
21.8.3 PORTFÓLIO DE PRODUTOS
21.8.4 DESENVOLVIMENTO RECENTE
21.9 ASTRAZENECA
21.9.1 RESUMO DA EMPRESA
21.9.2 ANÁLISE DE RECEITA
21.9.3 PORTFÓLIO DE PRODUTOS
21.9.4 DESENVOLVIMENTO RECENTE
21.1 BAYER
21.10.1 RESUMO DA EMPRESA
21.10.2 ANÁLISE DE RECEITA
21.10.3 PORTFÓLIO DE PRODUTOS
21.10.4 DESENVOLVIMENTO RECENTE
21.11 BYONDIS
21.11.1 RESUMO DA EMPRESA
21.11.2 PORTFÓLIO DE PRODUTOS
21.11.3 DESENVOLVIMENTO RECENTE
21.12 EISAI INC
21.12.1 RESUMO DA EMPRESA
21.12.2 ANÁLISE DE RECEITA
21.12.3 PORTFÓLIO DE PRODUTOS
21.12.4 DESENVOLVIMENTO RECENTE
21.13 GSK PLC
21.13.1 RESUMO DA EMPRESA
21.13.2 ANÁLISE DE RECEITA
21.13.3 PORTFÓLIO DE PRODUTOS
21.13.4 DESENVOLVIMENTO RECENTE
21.14 JOHNSON & JOHNSON SERVICES, INC.
21.14.1 RESUMO DA EMPRESA
21.14.2 ANÁLISE DE RECEITA
21.14.3 PORTFÓLIO DE PRODUTOS
21.14.4 DESENVOLVIMENTO RECENTE
21.15 OXFORD BIOTÉRMICOS
21.15.1 RESUMO DA EMPRESA
21.15.2 PORTFÓLIO DE PRODUTOS
21.15.3 DESENVOLVIMENTO RECENTE
21.16 PFIZER INC.
21.16.1 RESUMO DA EMPRESA
21.16.2 ANÁLISE DE RECEITA
21.16.3 PORTFÓLIO DE PRODUTOS
21.16.4 ATUALIZAÇÕES RECENTES
21.17 REMEGEN
21.17.1 RESUMO DA EMPRESA
21.17.2 PORTFÓLIO DE PRODUTOS
21.17.3 DESENVOLVIMENTOS RECENTES
21.18 SANOFI
21.18.1 RESUMO DA EMPRESA
21.18.2 ANÁLISE DE RECEITA
21.18.3 PORTFÓLIO DE PRODUTOS
21.18.4 DESENVOLVIMENTO RECENTE
21.19 SUTRO BIOPHARMA, INC.
21.19.1 RESUMO DA EMPRESA
21.19.2 ANÁLISE DE RECEITA
21.19.3 PORTFÓLIO DE PRODUTOS
21.19.4 ATUALIZAÇÕES RECENTES
22 QUESTIONÁRIO
23 RELATÓRIOS RELACIONADOS
Lista de Tabela
TABELA 1 PROJEÇÃO DE ALTERAÇÃO DE PREÇOS (2024–2030)
TABELA 2 MERCADO EUROPEU DE CONJUGADOS DE ANTICORPOS E MEDICAMENTOS (ADC), POR PRODUTO, 2022-2031 (MILHÕES DE DÓLARES)
TABELA 3 MERCADO EUROPEU DE CONJUGADOS DE ANTICORPOS E MEDICAMENTOS (ADC), POR PRODUTO, 2022-2031 (VOLUME EM UNIDADES)
TABELA 4: ENHERTU DA EUROPA NO MERCADO DE ANTICORPOS CONJUGADOS (ADC), POR REGIÃO, 2022-2031 (US$ MILHÕES)
TABELA 5 MERCADO EUROPEU DE KADCYLA EM CONJUGADOS DE ANTICORPOS E MEDICAMENTOS (ADC), POR REGIÃO, 2022-2031 (US$ MILHÕES)
TABELA 6 TRODELVY NA EUROPA NO MERCADO DE CONJUGADOS DE ANTICORPOS PARA MEDICAMENTOS (ADC), POR REGIÃO, 2022-2031 (US$ MILHÕES)
TABELA 7 POLÍTICA EUROPEIA NO MERCADO DE CONJUGADOS DE ANTICORPOS E MEDICAMENTOS (ADC), POR REGIÃO, 2022-2031 (US$ MILHÕES)
TABELA 8 ADCETRIS NO MERCADO DE ANTICORPOS CONJUGADOS (ADC) NA EUROPA, POR REGIÃO, 2022-2031 (MILHÕES DE DÓLARES)
TABELA 9 PADCEV DA EUROPA NO MERCADO DE CONJUGADOS DE ANTICORPOS E MEDICAMENTOS (ADC), POR REGIÃO, 2022-2031 (US$ MILHÕES)
TABELA 10 BESPONSA NA EUROPA NO MERCADO DE CONJUGADOS DE ANTICORPOS E MEDICAMENTOS (ADC), POR REGIÃO, 2022-2031 (US$ MILHÕES)
TABELA 11 EUROPA ELAHERE NO MERCADO DE CONJUGADOS DE ANTICORPOS E MEDICAMENTOS (ADC), POR REGIÃO, 2022-2031 (US$ MILHÕES)
TABELA 12 MERCADO EUROPEU DE ZYLONTA EM CONJUGADOS DE ANTICORPOS E MEDICAMENTOS (ADC), POR REGIÃO, 2022-2031 (US$ MILHÕES)
TABELA 13 MERCADO EUROPEU DE MYLOTARG EM CONJUGADOS DE ANTICORPOS E MEDICAMENTOS (ADC), POR REGIÃO, 2022-2031 (US$ MILHÕES)
TABELA 14 MERCADO DE TIVDAK NO MERCADO DE CONJUGADOS DE ANTICORPOS E MEDICAMENTOS (ADC) NA EUROPA, POR REGIÃO, 2022-2031 (MILHÕES DE DÓLARES)
TABELA 15 OUTROS INGREDIENTES NO MERCADO DE CONJUGADOS DE ANTICORPOS E MEDICAMENTOS (ADC) DA EUROPA, POR REGIÃO, 2022-2031 (MILHÕES DE DÓLARES)
TABELA 16 MERCADO EUROPEU DE CONJUGADOS DE ANTICORPOS E MEDICAMENTOS (ADC), POR COMPONENTE DO ANTÍGENO, 2022-2031 (MILHÕES DE DÓLARES)
TABELA 17 MERCADO EUROPEU DE RECEPTORES HER2 EM CONJUGADOS DE ANTICORPOS PARA MEDICAMENTOS (ADC), POR REGIÃO, 2022-2031 (MILHÕES DE DÓLARES)
TABELA 18 MERCADO EUROPEU DE ANTICORPOS CONJUGADOS (ADC) PARA TROP-2, POR REGIÃO, 2022-2031 (MILHÕES DE DÓLARES)
TABELA 19 MERCADO EUROPEU DE CD79B EM CONJUGADOS DE ANTICORPOS E MEDICAMENTOS (ADC), POR REGIÃO, 2022-2031 (MILHÕES DE DÓLARES)
TABELA 20 MERCADO EUROPEU DE CD30 EM CONJUGADOS DE ANTICORPOS E MEDICAMENTOS (ADC), POR REGIÃO, 2022-2031 (US$ MILHÕES)
TABELA 21 MERCADO EUROPEU DE NECTINA 4 EM CONJUGADOS DE ANTICORPOS E MEDICAMENTOS (ADC), POR REGIÃO, 2022-2031 (US$ MILHÕES)
TABELA 22 MERCADO EUROPEU DE CD22 EM CONJUGADOS DE ANTICORPOS E MEDICAMENTOS (ADC), POR REGIÃO, 2022-2031 (MILHÕES DE DÓLARES)
TABELA 23 MERCADO EUROPEU DE CD19 NO MERCADO DE ANTICORPOS E MEDICAMENTOS CONJUGADOS (ADC), POR REGIÃO, 2022-2031 (MILHÕES DE DÓLARES)
TABELA 24 MERCADO EUROPEU DE CD33 EM CONJUGADOS DE ANTICORPOS E MEDICAMENTOS (ADC), POR REGIÃO, 2022-2031 (MILHÕES DE DÓLARES)
TABELA 25 FATORES TECIDUAIS DA EUROPA NO MERCADO DE CONJUGADOS DE ANTICORPOS E MEDICAMENTOS (ADC), POR REGIÃO, 2022-2031 (US$ MILHÕES)
TABELA 26 OUTROS INGREDIENTES NO MERCADO DE CONJUGADOS DE ANTICORPOS E MEDICAMENTOS (ADC) DA EUROPA, POR REGIÃO, 2022-2031 (MILHÕES DE DÓLARES)
TABELA 27 MERCADO EUROPEU DE CONJUGADOS DE ANTICORPOS PARA MEDICAMENTOS (ADC), POR COMPONENTE DE ANTICORPOS, 2022-2031 (MILHÕES DE DÓLARES AMERICANOS)
TABELA 28 ADCS DE TERCEIRA GERAÇÃO NA EUROPA NO MERCADO DE CONJUGADOS DE ANTICORPOS E MEDICAMENTOS (ADC), POR REGIÃO, 2022-2031 (MILHÕES DE DÓLARES)
TABELA 29 ADCS DE SEGUNDA GERAÇÃO NA EUROPA NO MERCADO DE ANTICORPOS CONJUGADOS (ADC), POR REGIÃO, 2022-2031 (US$ MILHÕES)
TABELA 30 ADCS DE QUARTA GERAÇÃO NA EUROPA NO MERCADO DE ANTICORPOS CONJUGADOS (ADC) PARA MEDICAMENTOS, POR REGIÃO, 2022-2031 (US$ MILHÕES)
TABELA 31 ADCS DE PRIMEIRA GERAÇÃO NA EUROPA NO MERCADO OFTALMOLOGICO, POR REGIÃO, 2022-2031 (US$ MILHÕES)
TABELA 32 MERCADO EUROPEU DE CONJUGADOS DE ANTICORPOS E MEDICAMENTOS (ADC), POR COMPONENTE DE LIGADORES, 2022-2031 (MILHÕES DE USD)
TABELA 33 LIGADORES CLIÁVEIS NO MERCADO DE CONJUGADOS DE ANTICORPOS E MEDICAMENTOS (ADC) DA EUROPA, POR REGIÃO, 2022-2031 (MILHÕES DE DÓLARES AMERICANOS)
TABELA 34 LIGADORES CLIÁVEIS NO MERCADO DE CONJUGADOS DE ANTICORPOS E MEDICAMENTOS (ADC) DA EUROPA, POR COMPONENTE, 2022-2031 (MILHÕES DE DÓLARES AMERICANOS)
TABELA 35 LIGANTES NÃO CLIÁVEIS NO MERCADO DE CONJUGADOS DE ANTICORPOS E MEDICAMENTOS (ADC) DA EUROPA, POR REGIÃO, 2022-2031 (MILHÕES DE DÓLARES AMERICANOS)
TABELA 36 MERCADO EUROPEU DE CONJUGADOS DE ANTICORPOS E MEDICAMENTOS (ADC), POR CARGAS OU OGIVAS CITOTÓXICAS, 2022-2031 (MILHÕES DE DÓLARES)
TABELA 37 AGENTES DANIFICADORES DE DNA NO MERCADO DE ANTICORPOS E MEDICAMENTOS (ADC) DA EUROPA, POR REGIÃO, 2022-2031 (MILHÕES DE DÓLARES)
TABELA 38 AGENTES DANIFICADORES DE DNA NO MERCADO DE ANTICORPOS E ANTICORPOS (ADC), POR COMPONENTE, 2022-2031 (MILHÕES DE DÓLARES)
TABELA 39 AGENTES DESRUPTORES DE MICROTÚBULOS NO MERCADO DE ANTICORPOS E ANTICORPOS (ADC), POR REGIÃO, 2022-2031 (MILHÕES DE DÓLARES)
TABELA 40 AGENTES DESRUPTORES DE MICROTÚBULOS NO MERCADO DE ANTICORPOS E ANTICORPOS (ADC), POR COMPONENTE, 2022-2031 (MILHÕES DE DÓLARES)
TABELA 41 MERCADO EUROPEU DE CONJUGADOS DE ANTICORPOS E MEDICAMENTOS (ADC), POR TECNOLOGIA DE LIGAÇÃO, 2022-2031 (MILHÕES DE DÓLARES)
TABELA 42 MERCADO EUROPEU DE LIGADORES PEPTÍDEOS EM CONJUGADOS DE ANTICORPOS E MEDICAMENTOS (ADC), POR REGIÃO, 2022-2031 (US$ MILHÕES)
TABELA 43 MERCADO EUROPEU DE LIGADORES TIOÉTER EM CONJUGADOS DE ANTICORPOS E MEDICAMENTOS (ADC), POR REGIÃO, 2022-2031 (MILHÕES DE DÓLARES)
TABELA 44 LIGADORES DE HIDRAZONA NO MERCADO DE CONJUGADOS DE ANTICORPOS E MEDICAMENTOS (ADC) DA EUROPA, POR REGIÃO, 2022-2031 (MILHÕES DE DÓLARES AMERICANOS)
TABELA 45 MERCADO EUROPEU DE LIGANTES DISSULFETOS EM CONJUGADOS DE ANTICORPOS E MEDICAMENTOS (ADC), POR REGIÃO, 2022-2031 (MILHÕES DE DÓLARES)
TABELA 46 MERCADO EUROPEU DE CONJUGADOS DE ANTICORPOS E MEDICAMENTOS (ADC), POR TECNOLOGIA DE CONJUGAÇÃO, 2022-2031 (MILHÕES DE DÓLARES)
TABELA 47 CONJUGAÇÃO ESPECÍFICA DE LOCAL NA EUROPA NO MERCADO DE CONJUGADOS DE ANTICORPOS E MEDICAMENTOS (ADC), POR REGIÃO, 2022-2031 (MILHÕES DE DÓLARES AMERICANOS)
TABELA 48 CONJUGAÇÃO QUÍMICA NO MERCADO DE CONJUGADOS DE ANTICORPOS E MEDICAMENTOS (ADC) DA EUROPA, POR REGIÃO, 2022-2031 (MILHÕES DE DÓLARES)
TABELA 49 MERCADO EUROPEU DE CONJUGADOS DE ANTICORPOS PARA MEDICAMENTOS (ADC), POR INDICAÇÃO, 2022-2031 (MILHÕES DE DÓLARES)
TABELA 50 CÂNCER DE MAMA NA EUROPA NO MERCADO DE ANTICORPOS CONJUGADOS (ADC), POR REGIÃO, 2022-2031 (MILHÕES DE DÓLARES)
TABELA 51 CÂNCER DE SANGUE (LEUCEMIA, LINFOMA) NA EUROPA NO MERCADO DE ANTICORPOS CONJUGADOS (ADC), POR REGIÃO, 2022-2031 (MILHÕES DE DÓLARES)
TABELA 52 CÂNCER DE PULMÃO NO MERCADO DE ANTICORPOS CONJUGADOS (ADC) NA EUROPA, POR REGIÃO, 2022-2031 (MILHÕES DE DÓLARES)
TABELA 53 CÂNCER GINECOLÓGICO NA EUROPA NO MERCADO DE CONJUGADOS DE ANTICORPOS E MEDICAMENTOS (ADC), POR REGIÃO, 2022-2031 (MILHÕES DE DÓLARES)
TABELA 54 CÂNCER GASTROINTESTINAL NO MERCADO DE ANTICORPOS CONJUGADOS (ADC) NA EUROPA, POR REGIÃO, 2022-2031 (MILHÕES DE DÓLARES AMERICANOS)
TABELA 55 CÂNCER GENITOURINÁRIO NA EUROPA NO MERCADO DE ANTICORPOS CONJUGADOS (ADC), POR REGIÃO, 2022-2031 (US$ MILHÕES)
TABELA 56 OUTROS MERCADOS DE OFTALMOLOGIA NA EUROPA, POR REGIÃO, 2022-2031 (US$ MILHÕES)
TABELA 57 MERCADO EUROPEU DE CONJUGADOS DE ANTICORPOS PARA MEDICAMENTOS (ADC), POR USUÁRIO FINAL, 2022-2031 (MILHÕES DE USD)
TABELA 58 HOSPITAIS DA EUROPA NO MERCADO DE ANTICORPOS CONJUGADOS (ADC) POR REGIÃO, 2022-2031 (US$ MILHÕES)
TABELA 59 CENTROS ESPECIALIZADOS DA EUROPA NO MERCADO DE CONJUGADOS DE ANTICORPOS E MEDICAMENTOS (ADC), POR REGIÃO, 2022-2031 (US$ MILHÕES)
TABELA 60 CLÍNICAS EUROPEIAS NO MERCADO DE CONJUGADOS DE ANTICORPOS E MEDICAMENTOS (ADC), POR REGIÃO, 2022-2031 (US$ MILHÕES)
TABELA 61 CENTROS AMBULATORIAIS DA EUROPA NO MERCADO DE CONJUGADOS DE ANTICORPOS E MEDICAMENTOS (ADC), POR REGIÃO, 2022-2031 (MILHÕES DE DÓLARES)
TABELA 62 CUIDADOS DE SAÚDE DOMICILIAR NA EUROPA NO MERCADO DE CONJUGADOS DE ANTICORPOS E MEDICAMENTOS (ADC), POR REGIÃO, 2022-2031 (MILHÕES DE DÓLARES)
TABELA 63 OUTROS INGREDIENTES NO MERCADO DE CONJUGADOS DE ANTICORPOS E MEDICAMENTOS (ADC) DA EUROPA, POR REGIÃO, 2022-2031 (MILHÕES DE DÓLARES)
TABELA 64 MERCADO EUROPEU DE CONJUGADOS DE ANTICORPOS E MEDICAMENTOS (ADC), POR CANAL DE DISTRIBUIÇÃO, 2022-2031 (MILHÕES DE DÓLARES)
TABELA 65 LICITAÇÕES DIRETAS NA EUROPA NO MERCADO DE CONJUGADOS DE ANTICORPOS E MEDICAMENTOS (ADC), POR REGIÃO, 2022-2031 (MILHÕES DE USD)
TABELA 66 VENDAS NO VAREJO NA EUROPA NO MERCADO DE CONJUGADOS DE ANTICORPOS PARA MEDICAMENTOS (ADC), POR REGIÃO, 2022-2031 (US$ MILHÕES)
TABELA 67 VENDAS NO VAREJO NA EUROPA NO MERCADO DE CONJUGADOS DE ANTICORPOS PARA MEDICAMENTOS (ADC), POR CANAL DE DISTRIBUIÇÃO, 2022-2031 (US$ MILHÕES)
TABELA 68 OUTROS INGREDIENTES NO MERCADO DE CONJUGADOS DE ANTICORPOS E MEDICAMENTOS (ADC) DA EUROPA, POR REGIÃO, 2022-2031 (MILHÕES DE DÓLARES)
TABELA 69 MERCADO EUROPEU DE CONJUGADOS DE ANTICORPOS PARA MEDICAMENTOS (ADC), POR PAÍS, 2022-2031 (MILHÕES DE DÓLARES)
TABELA 70 MERCADO EUROPEU DE CONJUGADOS DE ANTICORPOS PARA MEDICAMENTOS (ADC), POR PAÍS, 2022-2031 (MILHÕES DE DÓLARES)
TABELA 71 MERCADO EUROPEU DE CONJUGADOS DE ANTICORPOS E MEDICAMENTOS (ADC), POR PRODUTO, 2022-2031 (MILHÕES DE DÓLARES)
TABELA 72 MERCADO EUROPEU DE CONJUGADOS DE ANTICORPOS E MEDICAMENTOS (ADC), POR PRODUTO, 2022-2031 (VOLUME EM UNIDADES)
TABELA 73 MERCADO EUROPEU DE CONJUGADOS DE ANTICORPOS E MEDICAMENTOS (ADC), POR PRODUTO, 2022-2031 (ASP)
TABELA 74 MERCADO EUROPEU DE CONJUGADOS DE ANTICORPOS E MEDICAMENTOS (ADC), POR COMPONENTE DO ANTÍGENO, 2022-2031 (MILHÕES DE DÓLARES)
TABELA 75 MERCADO EUROPEU DE CONJUGADOS DE ANTICORPOS PARA MEDICAMENTOS (ADC), POR COMPONENTE DE ANTICORPOS, 2022-2031 (MILHÕES DE DÓLARES AMERICANOS)
TABELA 76 MERCADO EUROPEU DE CONJUGADOS DE ANTICORPOS E MEDICAMENTOS (ADC), POR COMPONENTE DE LIGADORES, 2022-2031 (MILHÕES DE USD)
TABELA 77 LIGADORES CLIÁVEIS NA EUROPA NO MERCADO DE CONJUGADOS DE ANTICORPOS E MEDICAMENTOS (ADC), POR COMPONENTE, 2022-2031 (US$ MILHÕES)
TABELA 78 MERCADO EUROPEU DE CONJUGADOS DE ANTICORPOS E MEDICAMENTOS (ADC), POR CARGAS OU OGIVAS CITOTÓXICAS, 2022-2031 (MILHÕES DE DÓLARES)
TABELA 79 AGENTES DANIFICADORES DE DNA NO MERCADO DE ANTICORPOS E ANTICORPOS (ADC), POR COMPONENTE, 2022-2031 (MILHÕES DE DÓLARES)
TABELA 80 AGENTES DESRUPTORES DE MICROTÚBULOS NO MERCADO DE ANTICORPOS E ANTICORPOS (ADC), POR COMPONENTE, 2022-2031 (MILHÕES DE DÓLARES)
TABELA 81 MERCADO EUROPEU DE CONJUGADOS DE ANTICORPOS E MEDICAMENTOS (ADC), POR TECNOLOGIA DE LIGAÇÃO, 2022-2031 (MILHÕES DE DÓLARES)
TABELA 82 MERCADO EUROPEU DE CONJUGADOS DE ANTICORPOS E MEDICAMENTOS (ADC), POR TECNOLOGIA DE CONJUGAÇÃO, 2022-2031 (MILHÕES DE DÓLARES)
TABELA 83 MERCADO EUROPEU DE CONJUGADOS DE ANTICORPOS PARA MEDICAMENTOS (ADC), POR INDICAÇÃO, 2022-2031 (MILHÕES DE DÓLARES)
TABELA 84 MERCADO EUROPEU DE CONJUGADOS DE ANTICORPOS PARA MEDICAMENTOS (ADC), POR USUÁRIO FINAL, 2022-2031 (MILHÕES DE USD)
TABELA 85 MERCADO EUROPEU DE CONJUGADOS DE ANTICORPOS PARA MEDICAMENTOS (ADC), POR CANAL DE DISTRIBUIÇÃO, 2022-2031 (MILHÕES DE DÓLARES)
TABELA 86 VENDAS NO VAREJO NA EUROPA NO MERCADO DE CONJUGADOS DE ANTICORPOS PARA MEDICAMENTOS (ADC), POR CANAL DE DISTRIBUIÇÃO, 2022-2031 (US$ MILHÕES)
TABELA 87 MERCADO DE CONJUGADOS DE ANTICORPOS PARA MEDICAMENTOS (ADC) DA ALEMANHA, POR PRODUTO, 2022-2031 (MILHÕES DE DÓLARES AMERICANOS)
TABELA 88 MERCADO DE CONJUGADOS DE ANTICORPOS E MEDICAMENTOS (ADC) DA ALEMANHA, POR PRODUTO, 2022-2031 (VOLUME EM UNIDADES)
TABELA 89 MERCADO DE CONJUGADOS DE ANTICORPOS E MEDICAMENTOS (ADC) DA ALEMANHA, POR PRODUTO, 2022-2031 (ASP)
TABELA 90 MERCADO DE CONJUGADOS DE ANTICORPOS E MEDICAMENTOS (ADC) DA ALEMANHA, POR COMPONENTE DO ANTÍGENO, 2022-2031 (MILHÕES DE DÓLARES AMERICANOS)
TABELA 91 MERCADO DE CONJUGADOS DE ANTICORPOS PARA MEDICAMENTOS (ADC) NA ALEMANHA, POR COMPONENTE DE ANTICORPOS, 2022-2031 (MILHÕES DE DÓLARES AMERICANOS)
TABELA 92 MERCADO DE CONJUGADOS DE ANTICORPOS E MEDICAMENTOS (ADC) DA ALEMANHA, POR COMPONENTE DE LIGADORES, 2022-2031 (MILHÕES DE DÓLARES AMERICANOS)
TABELA 93 LIGADORES CLIÁVEIS DA ALEMANHA NO MERCADO DE CONJUGADOS DE ANTICORPOS E MEDICAMENTOS (ADC), POR COMPONENTE, 2022-2031 (US$ MILHÕES)
TABELA 94 MERCADO DE CONJUGADOS DE ANTICORPOS E MEDICAMENTOS (ADC) DA ALEMANHA, POR CARGAS OU OGIVAS CITOTÓXICAS, 2022-2031 (MILHÕES DE DÓLARES)
TABELA 95 AGENTES DANIFICADORES DE DNA NO MERCADO DE CONJUGADOS DE ANTICORPOS E MEDICAMENTOS (ADC) DA ALEMANHA, POR COMPONENTE, 2022-2031 (MILHÕES DE DÓLARES)
TABELA 96 AGENTES DESRUPTORES DE MICROTÚBULOS NO MERCADO DE ANTICORPOS E ANTICORPOS (ADC), POR COMPONENTE, 2022-2031 (US$ MILHÕES)
TABELA 97 MERCADO DE CONJUGADOS DE ANTICORPOS E MEDICAMENTOS (ADC) DA ALEMANHA, POR TECNOLOGIA DE LIGAÇÃO, 2022-2031 (US$ MILHÕES)
TABELA 98 MERCADO DE CONJUGADOS DE ANTICORPOS E MEDICAMENTOS (ADC) DA ALEMANHA, POR TECNOLOGIA DE CONJUGAÇÃO, 2022-2031 (MILHÕES DE DÓLARES)
TABELA 99 MERCADO DE CONJUGADOS DE ANTICORPOS PARA MEDICAMENTOS (ADC) NA ALEMANHA, POR INDICAÇÃO, 2022-2031 (MILHÕES DE DÓLARES AMERICANOS)
TABELA 100 MERCADO DE CONJUGADOS DE ANTICORPOS PARA MEDICAMENTOS (ADC) DA ALEMANHA, POR USUÁRIO FINAL, 2022-2031 (MILHÕES DE DÓLARES)
TABELA 101 MERCADO DE CONJUGADOS DE ANTICORPOS PARA MEDICAMENTOS (ADC) DA ALEMANHA, POR CANAL DE DISTRIBUIÇÃO, 2022-2031 (MILHÕES DE DÓLARES)
TABELA 102 VENDAS NO VAREJO NA ALEMANHA NO MERCADO DE CONJUGADOS DE ANTICORPOS PARA MEDICAMENTOS (ADC), POR CANAL DE DISTRIBUIÇÃO, 2022-2031 (US$ MILHÕES)
TABELA 103 MERCADO DE CONJUGADOS DE ANTICORPOS E MEDICAMENTOS (ADC) NO REINO UNIDO, POR PRODUTO, 2022-2031 (MILHÕES DE DÓLARES)
TABELA 104 MERCADO DE CONJUGADOS DE ANTICORPOS E MEDICAMENTOS (ADC) DO REINO UNIDO, POR PRODUTO, 2022-2031 (VOLUME EM UNIDADES)
TABELA 105 MERCADO DE CONJUGADOS DE ANTICORPOS E MEDICAMENTOS (ADC) NO REINO UNIDO, POR PRODUTO, 2022-2031 (ASP)
TABELA 106 MERCADO DE CONJUGADOS DE ANTICORPOS E MEDICAMENTOS (ADC) NO REINO UNIDO, POR COMPONENTE DO ANTÍGENO, 2022-2031 (MILHÕES DE DÓLARES)
TABELA 107 MERCADO DE CONJUGADOS DE ANTICORPOS PARA MEDICAMENTOS (ADC) NO REINO UNIDO, POR COMPONENTE DE ANTICORPOS, 2022-2031 (MILHÕES DE DÓLARES AMERICANOS)
TABELA 108 MERCADO DE CONJUGADOS DE ANTICORPOS E MEDICAMENTOS (ADC) NO REINO UNIDO, POR COMPONENTE DE LIGADORES, 2022-2031 (MILHÕES DE DÓLARES AMERICANOS)
TABELA 109 LIGADORES CLIÁVEIS NO MERCADO DE CONJUGADOS DE ANTICORPOS E MEDICAMENTOS (ADC) DO REINO UNIDO, POR COMPONENTE, 2022-2031 (MILHÕES DE DÓLARES AMERICANOS)
TABELA 110 MERCADO DE ANTICORPOS CONJUGADOS (ADC) PARA MEDICAMENTOS NO REINO UNIDO, POR CARGAS OU OGIVAS CITOTÓXICAS, 2022-2031 (MILHÕES DE DÓLARES)
TABELA 111 AGENTES DANIFICADORES DE DNA NO MERCADO DE ANTICORPOS E MEDICAMENTOS (ADC) DO REINO UNIDO, POR COMPONENTE, 2022-2031 (MILHÕES DE DÓLARES)
TABELA 112 AGENTES DESRUPTORES DE MICROTÚBULOS NO MERCADO DE ANTICORPOS E MEDICAMENTOS (ADC), POR COMPONENTE, 2022-2031 (MILHÕES DE DÓLARES)
TABELA 113 MERCADO DE CONJUGADOS DE ANTICORPOS E MEDICAMENTOS (ADC) NO REINO UNIDO, POR TECNOLOGIA DE LIGAÇÃO, 2022-2031 (MILHÕES DE DÓLARES)
TABELA 114 MERCADO DE CONJUGADOS DE ANTICORPOS E MEDICAMENTOS (ADC) NO REINO UNIDO, POR TECNOLOGIA DE CONJUGAÇÃO, 2022-2031 (MILHÕES DE DÓLARES)
TABELA 115 MERCADO DE ANTICORPOS CONJUGADOS (ADC) NO REINO UNIDO, POR INDICAÇÃO, 2022-2031 (MILHÕES DE DÓLARES)
TABELA 116 MERCADO DE CONJUGADOS DE ANTICORPOS PARA MEDICAMENTOS (ADC) NO REINO UNIDO, POR USUÁRIO FINAL, 2022-2031 (MILHÕES DE DÓLARES)
TABELA 117 MERCADO DE ANTICORPOS CONJUGADOS (ADC) NO REINO UNIDO, POR CANAL DE DISTRIBUIÇÃO, 2022-2031 (MILHÕES DE DÓLARES)
TABELA 118 VENDAS NO VAREJO NO REINO UNIDO NO MERCADO DE CONJUGADOS DE ANTICORPOS PARA MEDICAMENTOS (ADC), POR CANAL DE DISTRIBUIÇÃO, 2022-2031 (US$ MILHÕES)
TABELA 119 MERCADO DE CONJUGADOS DE ANTICORPOS E MEDICAMENTOS (ADC) DA FRANÇA, POR PRODUTO, 2022-2031 (MILHÕES DE DÓLARES)
TABELA 120 MERCADO DE CONJUGADOS DE ANTICORPOS E MEDICAMENTOS (ADC) DA FRANÇA, POR PRODUTO, 2022-2031 (VOLUME EM UNIDADES)
TABELA 121 MERCADO DE CONJUGADOS DE ANTICORPOS E MEDICAMENTOS (ADC) DA FRANÇA, POR PRODUTO, 2022-2031 (ASP)
TABELA 122 MERCADO DE CONJUGADOS DE ANTICORPOS E MEDICAMENTOS (ADC) NA FRANÇA, POR COMPONENTE DO ANTÍGENO, 2022-2031 (MILHÕES DE DÓLARES)
TABELA 123 MERCADO DE CONJUGADOS DE ANTICORPOS PARA MEDICAMENTOS (ADC) NA FRANÇA, POR COMPONENTE DE ANTICORPOS, 2022-2031 (MILHÕES DE DÓLARES AMERICANOS)
TABELA 124 MERCADO DE CONJUGADOS DE ANTICORPOS E MEDICAMENTOS (ADC) NA FRANÇA, POR COMPONENTE DE LIGADORES, 2022-2031 (MILHÕES DE DÓLARES)
TABELA 125 FRANÇA LIGADORES CLIÁVEIS NO MERCADO DE CONJUGADOS DE ANTICORPOS E MEDICAMENTOS (ADC), POR COMPONENTE, 2022-2031 (US$ MILHÕES)
TABELA 126 MERCADO DE CONJUGADOS DE ANTICORPOS E MEDICAMENTOS (ADC) NA FRANÇA, POR CARGAS OU OGIVAS CITOTÓXICAS, 2022-2031 (MILHÕES DE DÓLARES)
TABELA 127 FRANÇA AGENTES DANIFICADORES DE DNA NO MERCADO DE ANTICORPOS E ANTICORPOS (ADC), POR COMPONENTE, 2022-2031 (US$ MILHÕES)
TABELA 128 FRANÇA AGENTES DESRUPTORES DE MICROTÚBULOS NO MERCADO DE ANTICORPOS E ANTICORPOS (ADC), POR COMPONENTE, 2022-2031 (US$ MILHÕES)
TABELA 129 MERCADO DE CONJUGADOS DE ANTICORPOS E MEDICAMENTOS (ADC) NA FRANÇA, POR TECNOLOGIA DE LIGAÇÃO, 2022-2031 (MILHÕES DE DÓLARES)
TABELA 130 MERCADO DE CONJUGADOS DE ANTICORPOS E MEDICAMENTOS (ADC) NA FRANÇA, POR TECNOLOGIA DE CONJUGAÇÃO, 2022-2031 (US$ MILHÕES)
TABELA 131 MERCADO DE CONJUGADOS DE ANTICORPOS PARA MEDICAMENTOS (ADC) NA FRANÇA, POR INDICAÇÃO, 2022-2031 (MILHÕES DE DÓLARES)
TABELA 132 MERCADO DE CONJUGADOS DE ANTICORPOS PARA MEDICAMENTOS (ADC) NA FRANÇA, POR USUÁRIO FINAL, 2022-2031 (MILHÕES DE DÓLARES)
TABELA 133 MERCADO DE CONJUGADOS DE ANTICORPOS PARA MEDICAMENTOS (ADC) NA FRANÇA, POR CANAL DE DISTRIBUIÇÃO, 2022-2031 (MILHÕES DE DÓLARES)
TABELA 134 VENDAS NO VAREJO NA FRANÇA NO MERCADO DE CONJUGADOS DE ANTICORPOS PARA MEDICAMENTOS (ADC), POR CANAL DE DISTRIBUIÇÃO, 2022-2031 (US$ MILHÕES)
TABELA 135 MERCADO DE CONJUGADOS DE ANTICORPOS E MEDICAMENTOS (ADC) DA ITÁLIA, POR PRODUTO, 2022-2031 (MILHÕES DE DÓLARES)
TABELA 136 MERCADO DE CONJUGADOS DE ANTICORPOS E MEDICAMENTOS (ADC) DA ITÁLIA, POR PRODUTO, 2022-2031 (VOLUME EM UNIDADES)
TABELA 137 MERCADO DE CONJUGADOS DE ANTICORPOS E MEDICAMENTOS (ADC) DA ITÁLIA, POR PRODUTO, 2022-2031 (ASP)
TABELA 138 MERCADO DE CONJUGADOS DE ANTICORPOS E MEDICAMENTOS (ADC) DA ITÁLIA, POR COMPONENTE DO ANTÍGENO, 2022-2031 (MILHÕES DE DÓLARES)
TABELA 139 MERCADO DE CONJUGADOS DE ANTICORPOS PARA MEDICAMENTOS (ADC) NA ITÁLIA, POR COMPONENTE DE ANTICORPOS, 2022-2031 (MILHÕES DE DÓLARES AMERICANOS)
TABELA 140 MERCADO DE CONJUGADOS DE ANTICORPOS E MEDICAMENTOS (ADC) NA ITÁLIA, POR COMPONENTE DE LIGADORES, 2022-2031 (MILHÕES DE DÓLARES AMERICANOS)
TABELA 141 LIGADORES CLIÁVEIS NO MERCADO DE CONJUGADOS DE ANTICORPOS E MEDICAMENTOS (ADC) DA ITÁLIA, POR COMPONENTE, 2022-2031 (MILHÕES DE DÓLARES AMERICANOS)
TABELA 142 MERCADO DE CONJUGADOS DE ANTICORPOS E MEDICAMENTOS (ADC) NA ITÁLIA, POR CARGAS OU OGIVAS CITOTÓXICAS, 2022-2031 (MILHÕES DE DÓLARES)
TABELA 143 AGENTES DANIFICADORES DE DNA NO MERCADO DE CONJUGADOS DE ANTICORPOS E MEDICAMENTOS (ADC) DA ITÁLIA, POR COMPONENTE, 2022-2031 (MILHÕES DE DÓLARES)
TABELA 144 AGENTES DESRUPTORES DE MICROTÚBULOS NO MERCADO DE CONJUGADOS DE ANTICORPOS E MEDICAMENTOS (ADC) DA ITÁLIA, POR COMPONENTE, 2022-2031 (MILHÕES DE DÓLARES)
TABELA 145 MERCADO DE CONJUGADOS DE ANTICORPOS E MEDICAMENTOS (ADC) NA ITÁLIA, POR TECNOLOGIA DE LIGAÇÃO, 2022-2031 (US$ MILHÕES)
TABELA 146 MERCADO DE CONJUGADOS DE ANTICORPOS E MEDICAMENTOS (ADC) DA ITÁLIA, POR TECNOLOGIA DE CONJUGAÇÃO, 2022-2031 (US$ MILHÕES)
TABELA 147 MERCADO DE CONJUGADOS DE ANTICORPOS PARA MEDICAMENTOS (ADC) NA ITÁLIA, POR INDICAÇÃO, 2022-2031 (MILHÕES DE DÓLARES AMERICANOS)
TABELA 148 MERCADO DE CONJUGADOS DE ANTICORPOS PARA MEDICAMENTOS (ADC) NA ITÁLIA, POR USUÁRIO FINAL, 2022-2031 (MILHÕES DE DÓLARES)
TABELA 149 MERCADO DE CONJUGADOS DE ANTICORPOS PARA MEDICAMENTOS (ADC) NA ITÁLIA, POR CANAL DE DISTRIBUIÇÃO, 2022-2031 (US$ MILHÕES)
TABELA 150 VENDAS NO VAREJO NA ITÁLIA NO MERCADO DE CONJUGADOS DE ANTICORPOS PARA MEDICAMENTOS (ADC), POR CANAL DE DISTRIBUIÇÃO, 2022-2031 (US$ MILHÕES)
TABELA 151 MERCADO ESPANHA DE CONJUGADOS DE ANTICORPOS E MEDICAMENTOS (ADC), POR PRODUTO, 2022-2031 (US$ MILHÕES)
TABELA 152 MERCADO ESPANHA DE CONJUGADOS DE ANTICORPOS E MEDICAMENTOS (ADC), POR PRODUTO, 2022-2031 (VOLUME EM UNIDADES)
TABELA 153 MERCADO ESPANHA DE CONJUGADOS DE ANTICORPOS E MEDICAMENTOS (ADC), POR PRODUTO, 2022-2031 (ASP)
TABELA 154 MERCADO ESPANHA DE CONJUGADOS DE ANTICORPOS E MEDICAMENTOS (ADC), POR COMPONENTE DE ANTÍGENO, 2022-2031 (US$ MILHÕES)
TABELA 155 MERCADO ESPANHA DE CONJUGADOS DE ANTICORPOS PARA MEDICAMENTOS (ADC), POR COMPONENTE DE ANTICORPOS, 2022-2031 (US$ MILHÕES)
TABELA 156 MERCADO ESPANHA DE CONJUGADOS DE ANTICORPOS E MEDICAMENTOS (ADC), POR COMPONENTE DE LIGADORES, 2022-2031 (US$ MILHÕES)
TABELA 157 ESPANHA: LIGADORES CLIÁVEIS NO MERCADO DE CONJUGADOS DE ANTICORPOS E MEDICAMENTOS (ADC), POR COMPONENTE, 2022-2031 (US$ MILHÕES)
TABELA 158 MERCADO ESPANHA DE CONJUGADOS DE ANTICORPOS E MEDICAMENTOS (ADC), POR CARGAS OU OGIVAS CITOTÓXICAS, 2022-2031 (US$ MILHÕES)
TABELA 159 AGENTES DANIFICADORES DE DNA NO MERCADO DE ANTICORPOS E ANTICORPOS (ADC), POR COMPONENTE, 2022-2031 (US$ MILHÕES)
TABELA 160 AGENTES DESRUPTORES DE MICROTÚBULOS NO MERCADO DE ANTICORPOS E ANTICORPOS (ADC), POR COMPONENTE, 2022-2031 (US$ MILHÕES)
TABELA 161 MERCADO ESPANHA DE CONJUGADOS DE ANTICORPOS E MEDICAMENTOS (ADC), POR TECNOLOGIA DE LIGAÇÃO, 2022-2031 (US$ MILHÕES)
TABELA 162 MERCADO ESPANHA DE CONJUGADOS DE ANTICORPOS E MEDICAMENTOS (ADC), POR TECNOLOGIA DE CONJUGAÇÃO, 2022-2031 (US$ MILHÕES)
TABELA 163 MERCADO ESPANHA DE CONJUGADOS DE ANTICORPOS PARA MEDICAMENTOS (ADC), POR INDICAÇÃO, 2022-2031 (US$ MILHÕES)
TABELA 164 MERCADO ESPANHA DE CONJUGADOS DE ANTICORPOS PARA MEDICAMENTOS (ADC), POR USUÁRIO FINAL, 2022-2031 (US$ MILHÕES)
TABELA 165 MERCADO ESPANHA DE CONJUGADOS DE ANTICORPOS PARA MEDICAMENTOS (ADC), POR CANAL DE DISTRIBUIÇÃO, 2022-2031 (US$ MILHÕES)
TABELA 166 VENDAS NO VAREJO NA ESPANHA NO MERCADO DE CONJUGADOS DE ANTICORPOS PARA MEDICAMENTOS (ADC), POR CANAL DE DISTRIBUIÇÃO, 2022-2031 (US$ MILHÕES)
TABELA 167 MERCADO DE CONJUGADOS DE ANTICORPOS E MEDICAMENTOS (ADC) DA RÚSSIA, POR PRODUTO, 2022-2031 (MILHÕES DE DÓLARES)
TABELA 168 MERCADO DE CONJUGADOS DE ANTICORPOS E MEDICAMENTOS (ADC) DA RÚSSIA, POR PRODUTO, 2022-2031 (VOLUME EM UNIDADES)
TABELA 169 MERCADO DE CONJUGADOS DE ANTICORPOS E MEDICAMENTOS (ADC) DA RÚSSIA, POR PRODUTO, 2022-2031 (ASP)
TABELA 170 MERCADO DE CONJUGADOS DE ANTICORPOS E MEDICAMENTOS (ADC) DA RÚSSIA, POR COMPONENTE DO ANTÍGENO, 2022-2031 (MILHÕES DE DÓLARES)
TABELA 171 MERCADO DE CONJUGADOS DE ANTICORPOS PARA MEDICAMENTOS (ADC) DA RÚSSIA, POR COMPONENTE DE ANTICORPOS, 2022-2031 (MILHÕES DE DÓLARES AMERICANOS)
TABELA 172 MERCADO DE CONJUGADOS DE ANTICORPOS E MEDICAMENTOS (ADC) DA RÚSSIA, POR COMPONENTE DE LIGADORES, 2022-2031 (MILHÕES DE DÓLARES AMERICANOS)
TABELA 173 LIGADORES CLIÁVEIS DA RÚSSIA NO MERCADO DE CONJUGADOS DE ANTICORPOS E MEDICAMENTOS (ADC), POR COMPONENTE, 2022-2031 (US$ MILHÕES)
TABELA 174 MERCADO DE CONJUGADOS DE ANTICORPOS E MEDICAMENTOS (ADC) DA RÚSSIA, POR CARGAS OU OGIVAS CITOTÓXICAS, 2022-2031 (MILHÕES DE DÓLARES)
TABELA 175 AGENTES DANIFICADORES DE DNA NO MERCADO DE ANTICORPOS E MEDICAMENTOS (ADC) DA RÚSSIA, POR COMPONENTE, 2022-2031 (US$ MILHÕES)
TABELA 176 AGENTES DESRUPTORES DE MICROTÚBULOS NO MERCADO DE ANTICORPOS E ANTICORPOS (ADC), POR COMPONENTE, 2022-2031 (MILHÕES DE DÓLARES)
TABELA 177 MERCADO DE CONJUGADOS DE ANTICORPOS E MEDICAMENTOS (ADC) DA RÚSSIA, POR TECNOLOGIA DE LIGAÇÃO, 2022-2031 (US$ MILHÕES)
TABELA 178 MERCADO DE CONJUGADOS DE ANTICORPOS E MEDICAMENTOS (ADC) DA RÚSSIA, POR TECNOLOGIA DE CONJUGAÇÃO, 2022-2031 (US$ MILHÕES)
TABELA 179 MERCADO DE CONJUGADOS DE ANTICORPOS PARA MEDICAMENTOS (ADC) DA RÚSSIA, POR INDICAÇÃO, 2022-2031 (MILHÕES DE DÓLARES)
TABELA 180 MERCADO DE CONJUGADOS DE ANTICORPOS PARA MEDICAMENTOS (ADC) NA RÚSSIA, POR USUÁRIO FINAL, 2022-2031 (US$ MILHÕES)
TABELA 181 MERCADO DE CONJUGADOS DE ANTICORPOS PARA MEDICAMENTOS (ADC) DA RÚSSIA, POR CANAL DE DISTRIBUIÇÃO, 2022-2031 (US$ MILHÕES)
TABELA 182 VENDAS NO VAREJO DA RÚSSIA NO MERCADO DE CONJUGADOS DE ANTICORPOS PARA MEDICAMENTOS (ADC), POR CANAL DE DISTRIBUIÇÃO, 2022-2031 (US$ MILHÕES)
TABELA 183 MERCADO BÉLGICO DE CONJUGADOS DE ANTICORPOS E MEDICAMENTOS (ADC), POR PRODUTO, 2022-2031 (US$ MILHÕES)
TABELA 184 MERCADO BÉLGICO DE CONJUGADOS DE ANTICORPOS E MEDICAMENTOS (ADC), POR PRODUTO, 2022-2031 (VOLUME EM UNIDADES)
TABELA 185 MERCADO BÉLGICO DE CONJUGADOS DE ANTICORPOS E MEDICAMENTOS (ADC), POR PRODUTO, 2022-2031 (ASP)
TABELA 186 MERCADO BÉLGICO DE CONJUGADOS DE ANTICORPOS E MEDICAMENTOS (ADC), POR COMPONENTE DE ANTÍGENO, 2022-2031 (US$ MILHÕES)
TABELA 187 MERCADO BÉLGICO DE CONJUGADOS DE ANTICORPOS PARA MEDICAMENTOS (ADC), POR COMPONENTE DE ANTICORPOS, 2022-2031 (US$ MILHÕES)
TABELA 188 MERCADO BÉLGICO DE CONJUGADOS DE ANTICORPOS E MEDICAMENTOS (ADC), POR COMPONENTE DE LIGADORES, 2022-2031 (US$ MILHÕES)
TABELA 189 BÉLGICA: LIGADORES CLIÁVEIS NO MERCADO DE CONJUGADOS DE ANTICORPOS E MEDICAMENTOS (ADC), POR COMPONENTE, 2022-2031 (US$ MILHÕES)
TABELA 190 MERCADO BÉLGICO DE CONJUGADOS DE ANTICORPOS E MEDICAMENTOS (ADC), POR CARGAS OU OGIVAS CITOTÓXICAS, 2022-2031 (US$ MILHÕES)
TABELA 191 AGENTES DANIFICADORES DE DNA NO MERCADO DE CONJUGADOS DE ANTICORPOS E MEDICAMENTOS (ADC) DA BÉLGICA, POR COMPONENTE, 2022-2031 (MILHÕES DE DÓLARES)
TABELA 192 BÉLGICA AGENTES DESRUPTORES DE MICROTÚBULOS NO MERCADO DE ANTICORPOS E ANTICORPOS (ADC), POR COMPONENTE, 2022-2031 (US$ MILHÕES)
TABELA 193 MERCADO BÉLGICO DE CONJUGADOS DE ANTICORPOS E MEDICAMENTOS (ADC), POR TECNOLOGIA DE LIGAÇÃO, 2022-2031 (US$ MILHÕES)
TABELA 194 MERCADO BÉLGICO DE CONJUGADOS DE ANTICORPOS E MEDICAMENTOS (ADC), POR TECNOLOGIA DE CONJUGAÇÃO, 2022-2031 (US$ MILHÕES)
TABELA 195 MERCADO BÉLGICO DE CONJUGADOS DE ANTICORPOS E MEDICAMENTOS (ADC), POR INDICAÇÃO, 2022-2031 (MILHÕES DE DÓLARES)
TABELA 196 MERCADO BÉLGICO DE CONJUGADOS DE ANTICORPOS E MEDICAMENTOS (ADC), POR USUÁRIO FINAL, 2022-2031 (US$ MILHÕES)
TABELA 197 MERCADO BÉLGICO DE CONJUGADOS DE ANTICORPOS PARA MEDICAMENTOS (ADC), POR CANAL DE DISTRIBUIÇÃO, 2022-2031 (US$ MILHÕES)
TABELA 198 VENDAS NO VAREJO DA BÉLGICA NO MERCADO DE CONJUGADOS DE ANTICORPOS PARA MEDICAMENTOS (ADC), POR CANAL DE DISTRIBUIÇÃO, 2022-2031 (US$ MILHÕES)
TABELA 199 MERCADO HOLANDÊS DE CONJUGADOS DE ANTICORPOS E MEDICAMENTOS (ADC), POR PRODUTO, 2022-2031 (MILHÕES DE DÓLARES AMERICANOS)
TABELA 200 MERCADO HOLANDÊS DE CONJUGADOS DE ANTICORPOS E MEDICAMENTOS (ADC), POR PRODUTO, 2022-2031 (VOLUME EM UNIDADES)
TABELA 201 MERCADO HOLANDÊS DE CONJUGADOS DE ANTICORPOS E MEDICAMENTOS (ADC), POR PRODUTO, 2022-2031 (ASP)
TABELA 202 MERCADO HOLANDÊS DE CONJUGADOS DE ANTICORPOS E MEDICAMENTOS (ADC), POR COMPONENTE DE ANTÍGENO, 2022-2031 (MILHÕES DE DÓLARES AMERICANOS)
TABELA 203 MERCADO HOLANDÊS DE CONJUGADOS DE ANTICORPOS PARA MEDICAMENTOS (ADC), POR COMPONENTE DE ANTICORPOS, 2022-2031 (US$ MILHÕES)
TABELA 204 MERCADO HOLANDÊS DE CONJUGADOS DE ANTICORPOS E MEDICAMENTOS (ADC), POR COMPONENTE DE LIGADORES, 2022-2031 (US$ MILHÕES)
TABELA 205 LIGADORES CLIÁVEIS HOLANDESES NO MERCADO DE CONJUGADOS DE ANTICORPOS E MEDICAMENTOS (ADC), POR COMPONENTE, 2022-2031 (MILHÕES DE DÓLARES AMERICANOS)
TABELA 206 MERCADO HOLANDÊS DE CONJUGADOS DE ANTICORPOS E MEDICAMENTOS (ADC), POR CARGAS OU OGIVAS CITOTÓXICAS, 2022-2031 (MILHÕES DE DÓLARES)
TABELA 207 AGENTES DANIFICADORES DE DNA NO MERCADO DE ANTICORPOS E MEDICAMENTOS (ADC) DA HOLANDA, POR COMPONENTE, 2022-2031 (MILHÕES DE DÓLARES)
TABELA 208 AGENTES DESRUPTORES DE MICROTÚBULOS NO MERCADO HOLANDÊS DE CONJUGADOS DE ANTICORPOS E MEDICAMENTOS (ADC), POR COMPONENTE, 2022-2031 (MILHÕES DE DÓLARES)
TABELA 209 MERCADO HOLANDÊS DE CONJUGADOS DE ANTICORPOS E MEDICAMENTOS (ADC), POR TECNOLOGIA DE LIGAÇÃO, 2022-2031 (US$ MILHÕES)
TABELA 210 MERCADO HOLANDÊS DE CONJUGADOS DE ANTICORPOS E MEDICAMENTOS (ADC), POR TECNOLOGIA DE CONJUGAÇÃO, 2022-2031 (US$ MILHÕES)
TABELA 211 MERCADO HOLANDÊS DE CONJUGADOS DE ANTICORPOS PARA MEDICAMENTOS (ADC), POR INDICAÇÃO, 2022-2031 (MILHÕES DE DÓLARES AMERICANOS)
TABELA 212 MERCADO HOLANDÊS DE CONJUGADOS DE ANTICORPOS PARA MEDICAMENTOS (ADC), POR USUÁRIO FINAL, 2022-2031 (MILHÕES DE DÓLARES)
TABELA 213 MERCADO HOLANDÊS DE CONJUGADOS DE ANTICORPOS PARA MEDICAMENTOS (ADC), POR CANAL DE DISTRIBUIÇÃO, 2022-2031 (US$ MILHÕES)
TABELA 214 VENDAS NO VAREJO NA HOLANDA NO MERCADO DE CONJUGADOS DE ANTICORPOS PARA MEDICAMENTOS (ADC), POR CANAL DE DISTRIBUIÇÃO, 2022-2031 (US$ MILHÕES)
TABELA 215 MERCADO DE CONJUGADOS DE ANTICORPOS E MEDICAMENTOS (ADC) DA SUÍÇA, POR PRODUTO, 2022-2031 (MILHÕES DE DÓLARES)
TABELA 216 MERCADO DE CONJUGADOS DE ANTICORPOS E MEDICAMENTOS (ADC) DA SUÍÇA, POR PRODUTO, 2022-2031 (VOLUME EM UNIDADES)
TABELA 217 MERCADO DE CONJUGADOS DE ANTICORPOS E MEDICAMENTOS (ADC) DA SUÍÇA, POR PRODUTO, 2022-2031 (ASP)
TABELA 218 MERCADO DE CONJUGADOS DE ANTICORPOS E MEDICAMENTOS (ADC) NA SUÍÇA, POR COMPONENTE DO ANTÍGENO, 2022-2031 (US$ MILHÕES)
TABELA 219 MERCADO DE CONJUGADOS DE ANTICORPOS PARA MEDICAMENTOS (ADC) NA SUÍÇA, POR COMPONENTE DE ANTICORPOS, 2022-2031 (MILHÕES DE DÓLARES AMERICANOS)
TABELA 220 MERCADO DE CONJUGADOS DE ANTICORPOS E MEDICAMENTOS (ADC) DA SUÍÇA, POR COMPONENTE DE LIGADORES, 2022-2031 (MILHÕES DE DÓLARES AMERICANOS)
TABELA 221 LIGADORES CLIÁVEIS DA SUÍÇA NO MERCADO DE CONJUGADOS DE ANTICORPOS E MEDICAMENTOS (ADC), POR COMPONENTE, 2022-2031 (MILHÕES DE DÓLARES)
TABELA 222 MERCADO DE CONJUGADOS DE ANTICORPOS E MEDICAMENTOS (ADC) DA SUÍÇA, POR CARGAS OU OGIVAS CITOTÓXICAS, 2022-2031 (MILHÕES DE DÓLARES)
TABELA 223 AGENTES DANIFICADORES DE DNA NO MERCADO DE CONJUGADOS DE ANTICORPOS E MEDICAMENTOS (ADC) DA SUÍÇA, POR COMPONENTE, 2022-2031 (US$ MILHÕES)
TABELA 224 AGENTES DESRUPTORES DE MICROTÚBULOS NA SUÍÇA NO MERCADO DE CONJUGADOS DE ANTICORPOS E MEDICAMENTOS (ADC), POR COMPONENTE, 2022-2031 (US$ MILHÕES)
TABELA 225 MERCADO DE CONJUGADOS DE ANTICORPOS E MEDICAMENTOS (ADC) DA SUÍÇA, POR TECNOLOGIA DE LIGAÇÃO, 2022-2031 (US$ MILHÕES)
TABELA 226 MERCADO DE CONJUGADOS DE ANTICORPOS E MEDICAMENTOS (ADC) DA SUÍÇA, POR TECNOLOGIA DE CONJUGAÇÃO, 2022-2031 (US$ MILHÕES)
TABELA 227 MERCADO DE CONJUGADOS DE ANTICORPOS PARA MEDICAMENTOS (ADC) DA SUÍÇA, POR INDICAÇÃO, 2022-2031 (MILHÕES DE DÓLARES AMERICANOS)
TABELA 228 MERCADO DE CONJUGADOS DE ANTICORPOS PARA MEDICAMENTOS (ADC) NA SUÍÇA, POR USUÁRIO FINAL, 2022-2031 (US$ MILHÕES)
TABELA 229 MERCADO DE CONJUGADOS DE ANTICORPOS PARA MEDICAMENTOS (ADC) DA SUÍÇA, POR CANAL DE DISTRIBUIÇÃO, 2022-2031 (US$ MILHÕES)
TABELA 230 VENDAS NO VAREJO DA SUÍÇA NO MERCADO DE CONJUGADOS DE ANTICORPOS PARA MEDICAMENTOS (ADC), POR CANAL DE DISTRIBUIÇÃO, 2022-2031 (US$ MILHÕES)
TABELA 231 MERCADO DE CONJUGADOS DE ANTICORPOS E MEDICAMENTOS (ADC) DA ÁUSTRIA, POR PRODUTO, 2022-2031 (MILHÕES DE DÓLARES AMERICANOS)
TABELA 232 MERCADO DE CONJUGADOS DE ANTICORPOS E MEDICAMENTOS (ADC) DA ÁUSTRIA, POR PRODUTO, 2022-2031 (VOLUME EM UNIDADES)
TABELA 233 MERCADO DE CONJUGADOS DE ANTICORPOS E MEDICAMENTOS (ADC) DA ÁUSTRIA, POR PRODUTO, 2022-2031 (ASP)
TABELA 234 MERCADO DE CONJUGADOS DE ANTICORPOS E MEDICAMENTOS (ADC) NA ÁUSTRIA, POR COMPONENTE DO ANTÍGENO, 2022-2031 (US$ MILHÕES)
TABELA 235 MERCADO DE CONJUGADOS DE ANTICORPOS E MEDICAMENTOS (ADC) NA ÁUSTRIA, POR COMPONENTE DE ANTICORPOS, 2022-2031 (US$ MILHÕES)
TABELA 236 MERCADO DE CONJUGADOS DE ANTICORPOS E MEDICAMENTOS (ADC) DA ÁUSTRIA, POR COMPONENTE DE LIGADORES, 2022-2031 (US$ MILHÕES)
TABELA 237 ÁUSTRIA: LIGADORES CLIÁVEIS NO MERCADO DE CONJUGADOS DE ANTICORPOS E MEDICAMENTOS (ADC), POR COMPONENTE, 2022-2031 (US$ MILHÕES)
TABELA 238 MERCADO DE CONJUGADOS DE ANTICORPOS E MEDICAMENTOS (ADC) DA ÁUSTRIA, POR CARGAS OU OGIVAS CITOTÓXICAS, 2022-2031 (US$ MILHÕES)
TABELA 239 AGENTES DANIFICADORES DE DNA NO MERCADO DE ANTICORPOS E MEDICAMENTOS (ADC) DA ÁUSTRIA, POR COMPONENTE, 2022-2031 (US$ MILHÕES)
TABELA 240 AGENTES DESRUPTORES DE MICROTÚBULOS NA ÁUSTRIA NO MERCADO DE ANTICORPOS E ANTICORPOS (ADC), POR COMPONENTE, 2022-2031 (US$ MILHÕES)
TABELA 241 MERCADO DE CONJUGADOS DE ANTICORPOS E MEDICAMENTOS (ADC) DA ÁUSTRIA, POR TECNOLOGIA DE LIGAÇÃO, 2022-2031 (US$ MILHÕES)
TABELA 242 MERCADO DE CONJUGADOS DE ANTICORPOS E MEDICAMENTOS (ADC) NA ÁUSTRIA, POR TECNOLOGIA DE CONJUGAÇÃO, 2022-2031 (US$ MILHÕES)
TABELA 243 MERCADO DE CONJUGADOS DE ANTICORPOS E MEDICAMENTOS (ADC) NA ÁUSTRIA, POR INDICAÇÃO, 2022-2031 (MILHÕES DE DÓLARES AMERICANOS)
TABELA 244 MERCADO DE CONJUGADOS DE ANTICORPOS E MEDICAMENTOS (ADC) NA ÁUSTRIA, POR USUÁRIO FINAL, 2022-2031 (US$ MILHÕES)
TABELA 245 MERCADO DE CONJUGADOS DE ANTICORPOS E MEDICAMENTOS (ADC) NA ÁUSTRIA, POR CANAL DE DISTRIBUIÇÃO, 2022-2031 (US$ MILHÕES)
TABELA 246 VENDAS NO VAREJO NA ÁUSTRIA NO MERCADO DE CONJUGADOS DE ANTICORPOS PARA MEDICAMENTOS (ADC), POR CANAL DE DISTRIBUIÇÃO, 2022-2031 (US$ MILHÕES)
TABELA 247 MERCADO DE CONJUGADOS DE ANTICORPOS E MEDICAMENTOS (ADC) DA IRLANDA, POR PRODUTO, 2022-2031 (MILHÕES DE DÓLARES AMERICANOS)
TABELA 248 MERCADO DE CONJUGADOS DE ANTICORPOS E MEDICAMENTOS (ADC) DA IRLANDA, POR PRODUTO, 2022-2031 (VOLUME EM UNIDADES)
TABELA 249 MERCADO DE CONJUGADOS DE ANTICORPOS E MEDICAMENTOS (ADC) DA IRLANDA, POR PRODUTO, 2022-2031 (ASP)
TABELA 250 MERCADO DE CONJUGADOS DE ANTICORPOS E MEDICAMENTOS (ADC) DA IRLANDA, POR COMPONENTE DO ANTÍGENO, 2022-2031 (MILHÕES DE DÓLARES AMERICANOS)
TABELA 251 MERCADO DE CONJUGADOS DE ANTICORPOS PARA MEDICAMENTOS (ADC) DA IRLANDA, POR COMPONENTE DE ANTICORPOS, 2022-2031 (MILHÕES DE DÓLARES AMERICANOS)
TABELA 252 MERCADO DE CONJUGADOS DE ANTICORPOS PARA MEDICAMENTOS (ADC) DA IRLANDA, POR COMPONENTE DE LIGADORES, 2022-2031 (MILHÕES DE DÓLARES AMERICANOS)
TABELA 253 LIGADORES CLIÁVEIS DA IRLANDA NO MERCADO DE CONJUGADOS DE ANTICORPOS E MEDICAMENTOS (ADC), POR COMPONENTE, 2022-2031 (MILHÕES DE DÓLARES AMERICANOS)
TABELA 254 MERCADO DE CONJUGADOS DE ANTICORPOS E MEDICAMENTOS (ADC) DA IRLANDA, POR CARGAS OU OGIVAS CITOTÓXICAS, 2022-2031 (MILHÕES DE DÓLARES)
TABELA 255 AGENTES DANIFICADORES DE DNA NO MERCADO DE CONJUGADOS DE ANTICORPOS E MEDICAMENTOS (ADC) DA IRLANDA, POR COMPONENTE, 2022-2031 (MILHÕES DE DÓLARES)
TABELA 256 AGENTES DESRUPTORES DE MICROTÚBULOS NO MERCADO DE ANTICORPOS E ANTICORPOS (ADC), POR COMPONENTE, 2022-2031 (MILHÕES DE DÓLARES)
TABELA 257 MERCADO DE CONJUGADOS DE ANTICORPOS E MEDICAMENTOS (ADC) DA IRLANDA, POR TECNOLOGIA DE LIGAÇÃO, 2022-2031 (MILHÕES DE DÓLARES AMERICANOS)
TABELA 258 MERCADO DE CONJUGADOS DE ANTICORPOS E MEDICAMENTOS (ADC) DA IRLANDA, POR TECNOLOGIA DE CONJUGAÇÃO, 2022-2031 (US$ MILHÕES)
TABELA 259 MERCADO DE CONJUGADOS DE ANTICORPOS PARA MEDICAMENTOS (ADC) DA IRLANDA, POR INDICAÇÃO, 2022-2031 (MILHÕES DE DÓLARES AMERICANOS)
TABELA 260 MERCADO DE CONJUGADOS DE ANTICORPOS PARA MEDICAMENTOS (ADC) DA IRLANDA, POR USUÁRIO FINAL, 2022-2031 (MILHÕES DE DÓLARES)
TABELA 261 MERCADO DE CONJUGADOS DE ANTICORPOS PARA MEDICAMENTOS (ADC) DA IRLANDA, POR CANAL DE DISTRIBUIÇÃO, 2022-2031 (MILHÕES DE DÓLARES)
TABELA 262 VENDAS NO VAREJO DA IRLANDA NO MERCADO DE CONJUGADOS DE ANTICORPOS PARA MEDICAMENTOS (ADC), POR CANAL DE DISTRIBUIÇÃO, 2022-2031 (US$ MILHÕES)
TABELA 263 MERCADO DE CONJUGADOS DE ANTICORPOS E MEDICAMENTOS (ADC) DA POLÔNIA, POR PRODUTO, 2022-2031 (MILHÕES DE DÓLARES)
TABELA 264 MERCADO DE CONJUGADOS DE ANTICORPOS E MEDICAMENTOS (ADC) DA POLÔNIA, POR PRODUTO, 2022-2031 (VOLUME EM UNIDADES)
TABELA 265 MERCADO DE CONJUGADOS DE ANTICORPOS E MEDICAMENTOS (ADC) DA POLÔNIA, POR PRODUTO, 2022-2031 (ASP)
TABELA 266 MERCADO DE CONJUGADOS DE ANTICORPOS E MEDICAMENTOS (ADC) DA POLÔNIA, POR COMPONENTE DO ANTÍGENO, 2022-2031 (MILHÕES DE DÓLARES AMERICANOS)
TABELA 267 MERCADO DE CONJUGADOS DE ANTICORPOS (ADC) NA POLÔNIA, POR COMPONENTE DE ANTICORPOS, 2022-2031 (US$ MILHÕES)
TABELA 268 MERCADO DE CONJUGADOS DE ANTICORPOS E MEDICAMENTOS (ADC) DA POLÔNIA, POR COMPONENTE DE LIGADORES, 2022-2031 (US$ MILHÕES)
TABELA 269 LIGADORES CLIÁVEIS DA POLÔNIA NO MERCADO DE CONJUGADOS DE ANTICORPOS E MEDICAMENTOS (ADC), POR COMPONENTE, 2022-2031 (US$ MILHÕES)
TABELA 270 MERCADO DE CONJUGADOS DE ANTICORPOS E MEDICAMENTOS (ADC) DA POLÔNIA, POR CARGAS OU OGIVAS CITOTÓXICAS, 2022-2031 (MILHÕES DE DÓLARES)
TABELA 271 AGENTES DANIFICADORES DE DNA NO MERCADO DE CONJUGADOS DE ANTICORPOS E MEDICAMENTOS (ADC) DA POLÔNIA, POR COMPONENTE, 2022-2031 (MILHÕES DE DÓLARES)
TABELA 272 AGENTES DESRUPTORES DE MICROTÚBULOS NO MERCADO DE CONJUGADOS DE ANTICORPOS E MEDICAMENTOS (ADC) DA POLÔNIA, POR COMPONENTE, 2022-2031 (US$ MILHÕES)
TABELA 273 MERCADO DE CONJUGADOS DE ANTICORPOS E MEDICAMENTOS (ADC) DA POLÔNIA, POR TECNOLOGIA DE LIGAÇÃO, 2022-2031 (MILHÕES DE DÓLARES AMERICANOS)
TABELA 274 MERCADO DE CONJUGADOS DE ANTICORPOS E MEDICAMENTOS (ADC) DA POLÔNIA, POR TECNOLOGIA DE CONJUGAÇÃO, 2022-2031 (US$ MILHÕES)
TABELA 275 MERCADO DE CONJUGADOS DE ANTICORPOS E MEDICAMENTOS (ADC) DA POLÔNIA, POR INDICAÇÃO, 2022-2031 (MILHÕES DE DÓLARES)
TABELA 276 MERCADO DE CONJUGADOS DE ANTICORPOS E MEDICAMENTOS (ADC) DA POLÔNIA, POR USUÁRIO FINAL, 2022-2031 (MILHÕES DE DÓLARES)
TABELA 277 MERCADO DE CONJUGADOS DE ANTICORPOS PARA MEDICAMENTOS (ADC) DA POLÔNIA, POR CANAL DE DISTRIBUIÇÃO, 2022-2031 (MILHÕES DE DÓLARES)
TABELA 278 VENDAS NO VAREJO DA POLÔNIA NO MERCADO DE CONJUGADOS DE ANTICORPOS PARA MEDICAMENTOS (ADC), POR CANAL DE DISTRIBUIÇÃO, 2022-2031 (US$ MILHÕES)
TABELA 279 MERCADO DE CONJUGADOS DE ANTICORPOS E MEDICAMENTOS (ADC) DA NORUEGA, POR PRODUTO, 2022-2031 (MILHÕES DE DÓLARES AMERICANOS)
TABELA 280 MERCADO DE CONJUGADOS DE ANTICORPOS E MEDICAMENTOS (ADC) DA NORUEGA, POR PRODUTO, 2022-2031 (VOLUME EM UNIDADES)
TABELA 281 MERCADO DE CONJUGADOS DE ANTICORPOS E MEDICAMENTOS (ADC) DA NORUEGA, POR PRODUTO, 2022-2031 (ASP)
TABELA 282 MERCADO DE CONJUGADOS DE ANTICORPOS E MEDICAMENTOS (ADC) DA NORUEGA, POR COMPONENTE DO ANTÍGENO, 2022-2031 (MILHÕES DE DÓLARES AMERICANOS)
TABELA 283 MERCADO DE CONJUGADOS DE ANTICORPOS PARA MEDICAMENTOS (ADC) DA NORUEGA, POR COMPONENTE DE ANTICORPOS, 2022-2031 (MILHÕES DE DÓLARES AMERICANOS)
TABELA 284 MERCADO DE CONJUGADOS DE ANTICORPOS E MEDICAMENTOS (ADC) DA NORUEGA, POR COMPONENTE DE LIGADORES, 2022-2031 (MILHÕES DE DÓLARES AMERICANOS)
TABELA 285 LIGADORES CLIÁVEIS DA NORUEGA NO MERCADO DE CONJUGADOS DE ANTICORPOS E MEDICAMENTOS (ADC), POR COMPONENTE, 2022-2031 (MILHÕES DE DÓLARES AMERICANOS)
TABELA 286 MERCADO DE ANTICORPOS CONJUGADOS (ADC) DA NORUEGA, POR CARGAS OU OGIVAS CITOTÓXICAS, 2022-2031 (MILHÕES DE DÓLARES)
TABELA 287 AGENTES DANIFICADORES DE DNA NO MERCADO DE ANTICORPOS E MEDICAMENTOS (ADC) DA NORUEGA, POR COMPONENTE, 2022-2031 (MILHÕES DE DÓLARES AMERICANOS)
TABELA 288 AGENTES DESRUPTORES DE MICROTÚBULOS NO MERCADO DE ANTICORPOS E ANTICORPOS (ADC), POR COMPONENTE, 2022-2031 (MILHÕES DE DÓLARES)
TABELA 289 MERCADO DE CONJUGADOS DE ANTICORPOS E MEDICAMENTOS (ADC) DA NORUEGA, POR TECNOLOGIA DE LIGAÇÃO, 2022-2031 (MILHÕES DE DÓLARES AMERICANOS)
TABELA 290 MERCADO DE CONJUGADOS DE ANTICORPOS E MEDICAMENTOS (ADC) DA NORUEGA, POR TECNOLOGIA DE CONJUGAÇÃO, 2022-2031 (US$ MILHÕES)
TABELA 291 MERCADO DE CONJUGADOS DE ANTICORPOS PARA MEDICAMENTOS (ADC) DA NORUEGA, POR INDICAÇÃO, 2022-2031 (MILHÕES DE DÓLARES AMERICANOS)
TABELA 292 MERCADO DE CONJUGADOS DE ANTICORPOS PARA MEDICAMENTOS (ADC) DA NORUEGA, POR USUÁRIO FINAL, 2022-2031 (MILHÕES DE DÓLARES)
TABELA 293 MERCADO DE CONJUGADOS DE ANTICORPOS PARA MEDICAMENTOS (ADC) DA NORUEGA, POR CANAL DE DISTRIBUIÇÃO, 2022-2031 (US$ MILHÕES)
TABELA 294 VENDAS NO VAREJO DA NORUEGA NO MERCADO DE CONJUGADOS DE ANTICORPOS PARA MEDICAMENTOS (ADC), POR CANAL DE DISTRIBUIÇÃO, 2022-2031 (US$ MILHÕES)
TABELA 295 MERCADO DE CONJUGADOS DE ANTICORPOS E MEDICAMENTOS (ADC) DA HUNGRIA, POR PRODUTO, 2022-2031 (MILHÕES DE DÓLARES AMERICANOS)
TABELA 296 MERCADO DE CONJUGADOS DE ANTICORPOS E MEDICAMENTOS (ADC) DA HUNGRIA, POR PRODUTO, 2022-2031 (VOLUME EM UNIDADES)
TABELA 297 MERCADO DE CONJUGADOS DE ANTICORPOS E MEDICAMENTOS (ADC) DA HUNGRIA, POR PRODUTO, 2022-2031 (ASP)
TABELA 298 MERCADO DE CONJUGADOS DE ANTICORPOS E MEDICAMENTOS (ADC) DA HUNGRIA, POR COMPONENTE DO ANTÍGENO, 2022-2031 (MILHÕES DE DÓLARES)
TABELA 299 MERCADO DE CONJUGADOS DE ANTICORPOS PARA MEDICAMENTOS (ADC) DA HUNGRIA, POR COMPONENTE DE ANTICORPOS, 2022-2031 (MILHÕES DE DÓLARES AMERICANOS)
TABELA 300 MERCADO DE CONJUGADOS DE ANTICORPOS E MEDICAMENTOS (ADC) DA HUNGRIA, POR COMPONENTE DE LIGADORES, 2022-2031 (MILHÕES DE DÓLARES AMERICANOS)
TABELA 301 HUNGRIA LIGADORES CLIÁVEIS NO MERCADO DE CONJUGADOS DE ANTICORPOS E MEDICAMENTOS (ADC), POR COMPONENTE, 2022-2031 (US$ MILHÕES)
TABELA 302 MERCADO DE ANTICORPOS CONJUGADOS (ADC) DA HUNGRIA, POR CARGAS OU OGIVAS CITOTÓXICAS, 2022-2031 (MILHÕES DE DÓLARES)
TABELA 303 AGENTES DANIFICADORES DE DNA NO MERCADO DE ANTICORPOS E MEDICAMENTOS (ADC) DA HUNGRIA, POR COMPONENTE, 2022-2031 (MILHÕES DE DÓLARES)
TABELA 304 HUNGRIA AGENTES DESRUPTORES DE MICROTÚBULOS NO MERCADO DE ANTICORPOS E ANTICORPOS (ADC), POR COMPONENTE, 2022-2031 (US$ MILHÕES)
TABELA 305 MERCADO DE CONJUGADOS DE ANTICORPOS E MEDICAMENTOS (ADC) DA HUNGRIA, POR TECNOLOGIA DE LIGAÇÃO, 2022-2031 (MILHÕES DE DÓLARES)
TABELA 306 MERCADO DE CONJUGADOS DE ANTICORPOS E MEDICAMENTOS (ADC) DA HUNGRIA, POR TECNOLOGIA DE CONJUGAÇÃO, 2022-2031 (MILHÕES DE DÓLARES)
TABELA 307 MERCADO DE CONJUGADOS DE ANTICORPOS E MEDICAMENTOS (ADC) DA HUNGRIA, POR INDICAÇÃO, 2022-2031 (MILHÕES DE DÓLARES AMERICANOS)
TABELA 308 MERCADO DE CONJUGADOS DE ANTICORPOS PARA MEDICAMENTOS (ADC) DA HUNGRIA, POR USUÁRIO FINAL, 2022-2031 (MILHÕES DE DÓLARES)
TABELA 309 MERCADO DE CONJUGADOS DE ANTICORPOS PARA MEDICAMENTOS (ADC) DA HUNGRIA, POR CANAL DE DISTRIBUIÇÃO, 2022-2031 (MILHÕES DE DÓLARES)
TABELA 310 VENDAS NO VAREJO DA HUNGRIA NO MERCADO DE CONJUGADOS DE ANTICORPOS PARA MEDICAMENTOS (ADC), POR CANAL DE DISTRIBUIÇÃO, 2022-2031 (US$ MILHÕES)
TABELA 311 MERCADO DE CONJUGADOS DE ANTICORPOS E MEDICAMENTOS (ADC) DA LITUÂNIA, POR PRODUTO, 2022-2031 (MILHÕES DE DÓLARES AMERICANOS)
TABELA 312 MERCADO DE CONJUGADOS DE ANTICORPOS E MEDICAMENTOS (ADC) DA LITUÂNIA, POR PRODUTO, 2022-2031 (VOLUME EM UNIDADES)
TABELA 313 MERCADO DE CONJUGADOS DE ANTICORPOS E MEDICAMENTOS (ADC) DA LITUÂNIA, POR PRODUTO, 2022-2031 (ASP)
TABELA 314 MERCADO DE CONJUGADOS DE ANTICORPOS E MEDICAMENTOS (ADC) DA LITUÂNIA, POR COMPONENTE DO ANTÍGENO, 2022-2031 (US$ MILHÕES)
TABELA 315 MERCADO DE CONJUGADOS DE ANTICORPOS E MEDICAMENTOS (ADC) DA LITUÂNIA, POR COMPONENTE DE ANTICORPOS, 2022-2031 (US$ MILHÕES)
TABELA 316 MERCADO DE CONJUGADOS DE ANTICORPOS E MEDICAMENTOS (ADC) DA LITUÂNIA, POR COMPONENTE DE LIGADORES, 2022-2031 (US$ MILHÕES)
TABELA 317 LIGADORES CLIÁVEIS NO MERCADO DE CONJUGADOS DE ANTICORPOS E MEDICAMENTOS (ADC) DA LITUÂNIA, POR COMPONENTE, 2022-2031 (MILHÕES DE DÓLARES AMERICANOS)
TABELA 318 MERCADO DE CONJUGADOS DE ANTICORPOS E MEDICAMENTOS (ADC) DA LITUÂNIA, POR CARGAS OU OGIVAS CITOTÓXICAS, 2022-2031 (MILHÕES DE DÓLARES)
TABELA 319 AGENTES DANIFICADORES DE DNA NO MERCADO DE CONJUGADOS DE ANTICORPOS E MEDICAMENTOS (ADC) DA LITUÂNIA, POR COMPONENTE, 2022-2031 (MILHÕES DE DÓLARES AMERICANOS)
TABELA 320 AGENTES DESRUPTORES DE MICROTÚBULOS NO MERCADO DE ANTICORPOS E ANTICORPOS (ADC), POR COMPONENTE, 2022-2031 (MILHÕES DE DÓLARES)
TABELA 321 MERCADO DE CONJUGADOS DE ANTICORPOS E MEDICAMENTOS (ADC) DA LITUÂNIA, POR TECNOLOGIA DE LIGAÇÃO, 2022-2031 (US$ MILHÕES)
TABELA 322 MERCADO DE CONJUGADOS DE ANTICORPOS E MEDICAMENTOS (ADC) DA LITUÂNIA, POR TECNOLOGIA DE CONJUGAÇÃO, 2022-2031 (US$ MILHÕES)
TABELA 323 MERCADO DE CONJUGADOS DE ANTICORPOS PARA MEDICAMENTOS (ADC) DA LITUÂNIA, POR INDICAÇÃO, 2022-2031 (MILHÕES DE DÓLARES AMERICANOS)
TABELA 324 MERCADO DE CONJUGADOS DE ANTICORPOS PARA MEDICAMENTOS (ADC) DA LITUÂNIA, POR USUÁRIO FINAL, 2022-2031 (MILHÕES DE DÓLARES)
TABELA 325 MERCADO DE CONJUGADOS DE ANTICORPOS PARA MEDICAMENTOS (ADC) DA LITUÂNIA, POR CANAL DE DISTRIBUIÇÃO, 2022-2031 (US$ MILHÕES)
TABELA 326 VENDAS NO VAREJO DA LITUÂNIA NO MERCADO DE CONJUGADOS DE ANTICORPOS PARA MEDICAMENTOS (ADC), POR CANAL DE DISTRIBUIÇÃO, 2022-2031 (US$ MILHÕES)
TABELA 327 MERCADO DE CONJUGADOS DE ANTICORPOS PARA MEDICAMENTOS (ADC) NO RESTO DA EUROPA, POR PRODUTO, 2022-2031 (MILHÕES DE DÓLARES AMERICANOS)
TABELA 328 MERCADO DE CONJUGADOS DE ANTICORPOS PARA MEDICAMENTOS (ADC) NO RESTO DA EUROPA, POR PRODUTO, 2022-2031 (VOLUME EM UNIDADES)
TABELA 329 MERCADO DE CONJUGADOS DE ANTICORPOS PARA MEDICAMENTOS (ADC) NO RESTO DA EUROPA, POR PRODUTO, 2022-2031 (ASP)
TABELA 330 MERCADO DE CONJUGADOS DE ANTICORPOS E MEDICAMENTOS (ADC) NO RESTO DA EUROPA, POR COMPONENTE DO ANTÍGENO, 2022-2031 (MILHÕES DE DÓLARES AMERICANOS)
TABELA 331 MERCADO DE CONJUGADOS DE ANTICORPOS PARA MEDICAMENTOS (ADC) NO RESTO DA EUROPA, POR COMPONENTE DE ANTICORPOS, 2022-2031 (MILHÕES DE DÓLARES AMERICANOS)
TABELA 332 MERCADO DE CONJUGADOS DE ANTICORPOS PARA MEDICAMENTOS (ADC) NO RESTO DA EUROPA, POR COMPONENTE DE LIGADORES, 2022-2031 (MILHÕES DE DÓLARES AMERICANOS)
TABELA 333 LIGANTES CLIÁVEIS NO MERCADO DE CONJUGADOS DE ANTICORPOS E MEDICAMENTOS (ADC) DO RESTO DA EUROPA, POR COMPONENTE, 2022-2031 (MILHÕES DE DÓLARES AMERICANOS)
TABELA 334 MERCADO DE CONJUGADOS DE ANTICORPOS PARA MEDICAMENTOS (ADC) NO RESTO DA EUROPA, POR CARGAS OU OGIVAS CITOTÓXICAS, 2022-2031 (MILHÕES DE DÓLARES AMERICANOS)
TABELA 335 AGENTES DANIFICADORES DE DNA NO MERCADO DE CONJUGADOS DE ANTICORPOS E MEDICAMENTOS (ADC) DO RESTO DA EUROPA, POR COMPONENTE, 2022-2031 (MILHÕES DE DÓLARES AMERICANOS)
TABELA 336 AGENTES DESRUPTORES DE MICROTÚBULOS NO MERCADO DE CONJUGADOS DE ANTICORPOS E MEDICAMENTOS (ADC) NO RESTO DA EUROPA, POR COMPONENTE, 2022-2031 (MILHÕES DE DÓLARES AMERICANOS)
TABELA 337 MERCADO DE CONJUGADOS DE ANTICORPOS E MEDICAMENTOS (ADC) NO RESTO DA EUROPA, POR TECNOLOGIA DE LIGAÇÃO, 2022-2031 (MILHÕES DE DÓLARES AMERICANOS)
TABELA 338 MERCADO DE CONJUGADOS DE ANTICORPOS PARA MEDICAMENTOS (ADC) NO RESTO DA EUROPA, POR TECNOLOGIA DE CONJUGAÇÃO, 2022-2031 (MILHÕES DE DÓLARES AMERICANOS)
TABELA 339 MERCADO DE CONJUGADOS DE ANTICORPOS PARA MEDICAMENTOS (ADC) NO RESTO DA EUROPA, POR INDICAÇÃO, 2022-2031 (MILHÕES DE DÓLARES AMERICANOS)
TABELA 340 MERCADO DE CONJUGADOS DE ANTICORPOS PARA MEDICAMENTOS (ADC) NO RESTO DA EUROPA, POR USUÁRIO FINAL, 2022-2031 (MILHÕES DE USD)
TABELA 341 MERCADO DE CONJUGADOS DE ANTICORPOS PARA MEDICAMENTOS (ADC) NO RESTO DA EUROPA, POR CANAL DE DISTRIBUIÇÃO, 2022-2031 (MILHÕES DE DÓLARES AMERICANOS)
TABELA 342 VENDAS NO VAREJO NO RESTO DA EUROPA NO MERCADO DE CONJUGADOS DE ANTICORPOS PARA MEDICAMENTOS (ADC), POR CANAL DE DISTRIBUIÇÃO, 2022-2031 (US$ MILHÕES)
Lista de Figura
FIGURA 1 MERCADO EUROPEU DE CONJUGADOS DE ANTICORPOS E MEDICAMENTOS (ADC): SEGMENTAÇÃO
FIGURA 2 MERCADO EUROPEU DE CONJUGADOS DE ANTICORPOS E MEDICAMENTOS (ADC): TRIANGULAÇÃO DE DADOS
FIGURA 3 MERCADO EUROPEU DE CONJUGADOS DE ANTICORPOS E MEDICAMENTOS (ADC): ANÁLISE DROC
FIGURA 4 MERCADO EUROPEU DE CONJUGADOS DE MEDICAMENTOS COM ANTICORPOS (ADC): ANÁLISE DE MERCADO EUROPEU VS. REGIONAL
FIGURA 5 MERCADO EUROPEU DE CONJUGADOS DE MEDICAMENTOS COM ANTICORPOS (ADC): ANÁLISE DE PESQUISA DA EMPRESA
FIGURA 6 MERCADO EUROPEU DE CONJUGADOS DE ANTICORPOS E MEDICAMENTOS (ADC): DEMOGRAFIA DAS ENTREVISTAS
FIGURA 7 MERCADO EUROPEU DE CONJUGADOS DE ANTICORPOS E MEDICAMENTOS (ADC): GRADE DE COBERTURA DE APLICAÇÃO DE MERCADO
FIGURA 8 MERCADO EUROPEU DE CONJUGADOS DE ANTICORPOS E MEDICAMENTOS (ADC): GRADE DE POSIÇÃO DE MERCADO DE DBMR
FIGURA 9 MERCADO EUROPEU DE CONJUGADOS DE MEDICAMENTOS COM ANTICORPOS (ADC): ANÁLISE DA PARTICIPAÇÃO DE FORNECEDORES
FIGURA 10 MERCADO EUROPEU DE CONJUGADOS DE ANTICORPOS E MEDICAMENTOS (ADC): SEGMENTAÇÃO
FIGURA 11 RESUMO EXECUTIVO
FIGURA 12 DECISÕES ESTRATÉGICAS
FIGURA 13 O AUMENTO DA INCIDÊNCIA DE CÂNCER ESTÁ IMPULSIONANDO O CRESCIMENTO DO MERCADO EUROPEU DE CONJUGADOS DE ANTICORPOS PARA MEDICAMENTOS (ADC) DE 2024 A 2031
FIGURA 14 O SEGMENTO DE PRODUTOS DEVE SER REPRESENTADO PELA MAIOR PARCIALIDADE DO MERCADO EUROPEU DE CONJUGADOS DE ANTICORPOS PARA MEDICAMENTOS (ADC) EM 2024 E 2031
FIGURA 15 DROC
FIGURA 16 MERCADO EUROPEU DE CONJUGADOS DE ANTICORPOS E MEDICAMENTOS (ADC): POR PRODUTO, 2023
FIGURA 17 MERCADO EUROPEU DE CONJUGADOS DE ANTICORPOS PARA MEDICAMENTOS (ADC): POR PRODUTO, 2024-2031 (MILHÕES DE DÓLARES)
FIGURA 18 MERCADO EUROPEU DE CONJUGADOS DE ANTICORPOS E MEDICAMENTOS (ADC): POR PRODUTO, CAGR (2024-2031)
FIGURA 19 MERCADO EUROPEU DE CONJUGADOS DE ANTICORPOS E MEDICAMENTOS (ADC): POR PRODUTO, CURVA DE SALVAÇÃO
FIGURA 20 MERCADO EUROPEU DE CONJUGADOS DE ANTICORPOS E MEDICAMENTOS (ADC): POR COMPONENTE DO ANTÍGENO, 2023
FIGURA 21 MERCADO EUROPEU DE CONJUGADOS DE ANTICORPOS PARA MEDICAMENTOS (ADC): POR COMPONENTE DO ANTÍGENO, 2024-2031 (MILHÕES DE DÓLARES)
FIGURA 22 MERCADO EUROPEU DE CONJUGADOS DE ANTICORPOS E MEDICAMENTOS (ADC): POR COMPONENTE DO ANTÍGENO, CAGR (2024-2031)
FIGURA 23 MERCADO EUROPEU DE CONJUGADOS DE ANTICORPOS E MEDICAMENTOS (ADC): POR COMPONENTE DO ANTÍGENO, CURVA DE LINHA DE SALVAÇÃO
FIGURA 24 MERCADO EUROPEU DE CONJUGADOS DE ANTICORPOS PARA MEDICAMENTOS (ADC): POR COMPONENTE DE ANTICORPOS, 2023
FIGURA 25 MERCADO EUROPEU DE CONJUGADOS DE ANTICORPOS PARA MEDICAMENTOS (ADC): POR COMPONENTE DE ANTICORPOS, 2024-2031 (MILHÕES DE DÓLARES)
FIGURA 26 MERCADO EUROPEU DE CONJUGADOS DE ANTICORPOS PARA MEDICAMENTOS (ADC): POR COMPONENTE DE ANTICORPOS, CAGR (2024-2031)
FIGURA 27 MERCADO EUROPEU DE CONJUGADOS DE ANTICORPOS E MEDICAMENTOS (ADC): POR COMPONENTE DE ANTICORPOS, CURVA DE LINHA DE SALVAÇÃO
FIGURA 28 MERCADO EUROPEU DE CONJUGADOS DE ANTICORPOS PARA MEDICAMENTOS (ADC): POR COMPONENTE DE LIGADORES, 2023
FIGURA 29 MERCADO EUROPEU DE CONJUGADOS DE ANTICORPOS PARA MEDICAMENTOS (ADC): POR COMPONENTE DE LIGADORES, 2024-2031 (MILHÕES DE DÓLARES)
FIGURA 30 MERCADO EUROPEU DE CONJUGADOS DE ANTICORPOS E MEDICAMENTOS (ADC): POR COMPONENTE DE LIGADORES, CAGR (2024-2031)
FIGURA 31 MERCADO EUROPEU DE CONJUGADOS DE ANTICORPOS E MEDICAMENTOS (ADC): POR COMPONENTE DE LIGAÇÃO, CURVA DE LINHA DE SALVAÇÃO
FIGURA 32 MERCADO EUROPEU DE CONJUGADOS DE ANTICORPOS PARA MEDICAMENTOS (ADC): POR CARGAS ÚTEIS OU COMPONENTES DE OGIVAS CITOTÓXICAS, 2023
FIGURA 33 MERCADO EUROPEU DE CONJUGADOS DE ANTICORPOS PARA MEDICAMENTOS (ADC): POR CARGAS ÚTEIS OU COMPONENTES DE OGIVAS CITOTÓXICAS, 2024-2031 (MILHÕES DE DÓLARES)
FIGURA 34 MERCADO EUROPEU DE CONJUGADOS DE ANTICORPOS E MEDICAMENTOS (ADC): POR CARGAS OU OGIVAS CITOTÓXICAS, CAGR (2024-2031)
FIGURA 35 MERCADO EUROPEU DE CONJUGADOS DE ANTICORPOS E DROGAS (ADC): POR CARGAS ÚTEIS CITOTÓXICAS OU COMPONENTES DE OGIVAS, CURVA DE LINHA DE SALVAÇÃO
FIGURA 36 MERCADO EUROPEU DE CONJUGADOS DE ANTICORPOS E MEDICAMENTOS (ADC): POR TECNOLOGIA DE LIGAÇÃO, 2023
FIGURA 37 MERCADO EUROPEU DE CONJUGADOS DE ANTICORPOS E MEDICAMENTOS (ADC): POR TECNOLOGIA DE LIGAÇÃO, 2024-2031 (MILHÕES DE DÓLARES)
FIGURA 38 MERCADO EUROPEU DE CONJUGADOS DE ANTICORPOS E MEDICAMENTOS (ADC): POR TECNOLOGIA DE LIGAÇÃO, CAGR (2024-2031)
FIGURA 39 MERCADO EUROPEU DE CONJUGADOS DE ANTICORPOS E MEDICAMENTOS (ADC): POR TECNOLOGIA DE LIGAÇÃO, CURVA DE LINHA DE SALVAÇÃO
FIGURA 40 MERCADO EUROPEU DE CONJUGADOS DE ANTICORPOS E MEDICAMENTOS (ADC): POR TECNOLOGIA DE CONJUGAÇÃO, 2023
FIGURA 41 MERCADO EUROPEU DE CONJUGADOS DE ANTICORPOS PARA MEDICAMENTOS (ADC): POR TECNOLOGIA DE CONJUGAÇÃO, 2024-2031 (MILHÕES DE DÓLARES)
FIGURA 42 MERCADO EUROPEU DE CONJUGADOS DE ANTICORPOS E MEDICAMENTOS (ADC): POR TECNOLOGIA DE CONJUGAÇÃO, CAGR (2024-2031)
FIGURA 43 MERCADO EUROPEU DE CONJUGADOS DE ANTICORPOS E MEDICAMENTOS (ADC): POR TECNOLOGIA DE CONJUGAÇÃO, CURVA DA LINHA DE SALVAÇÃO
FIGURA 44 MERCADO EUROPEU DE CONJUGADOS DE ANTICORPOS PARA MEDICAMENTOS (ADC): POR INDICAÇÃO, 2023
FIGURA 45 MERCADO EUROPEU DE CONJUGADOS DE ANTICORPOS PARA MEDICAMENTOS (ADC): POR INDICAÇÃO, 2024-2031 (MILHÕES DE DÓLARES)
FIGURA 46 MERCADO EUROPEU DE CONJUGADOS DE ANTICORPOS PARA MEDICAMENTOS (ADC): POR INDICAÇÃO, CAGR (2024-2031)
FIGURA 47 MERCADO EUROPEU DE CONJUGADOS DE ANTICORPOS E MEDICAMENTOS (ADC): POR INDICAÇÃO, CURVA DA LINHA DE SALVAÇÃO
FIGURA 48 MERCADO EUROPEU DE CONJUGADOS DE ANTICORPOS PARA MEDICAMENTOS (ADC): POR USUÁRIO FINAL, 2023
FIGURA 49 MERCADO EUROPEU DE CONJUGADOS DE ANTICORPOS PARA MEDICAMENTOS (ADC): POR USUÁRIO FINAL, 2024-2031 (MILHÕES DE USD)
FIGURA 50 MERCADO EUROPEU DE CONJUGADOS DE ANTICORPOS E MEDICAMENTOS (ADC): POR USUÁRIO FINAL, CAGR (2024-2031)
FIGURA 51 MERCADO EUROPEU DE CONJUGADOS DE ANTICORPOS E MEDICAMENTOS (ADC): POR USUÁRIO FINAL, CURVA DE SALVAÇÃO
FIGURA 52 MERCADO EUROPEU DE CONJUGADOS DE ANTICORPOS PARA MEDICAMENTOS (ADC): POR CANAL DE DISTRIBUIÇÃO, 2023
FIGURA 53 MERCADO EUROPEU DE CONJUGADOS DE ANTICORPOS PARA MEDICAMENTOS (ADC): POR CANAL DE DISTRIBUIÇÃO, 2024-2031 (MILHÕES DE DÓLARES)
FIGURA 54 MERCADO EUROPEU DE CONJUGADOS DE ANTICORPOS E MEDICAMENTOS (ADC): POR CANAL DE DISTRIBUIÇÃO, CAGR (2024-2031)
FIGURA 55 MERCADO EUROPEU DE CONJUGADOS DE ANTICORPOS E MEDICAMENTOS (ADC): POR CANAL DE DISTRIBUIÇÃO, CURVA DE LINHA DE SALVAÇÃO
FIGURA 56 MERCADO EUROPEU DE CONJUGADOS DE ANTICORPOS E MEDICAMENTOS (ADC): RESUMO (2023)
FIGURA 57 CONJUGADOS DE ANTICORPOS PARA MEDICAMENTOS (ADC) NA EUROPA: PARTICIPAÇÃO DA EMPRESA EM 2023 (%)
Metodologia de Investigação
A recolha de dados e a análise do ano base são feitas através de módulos de recolha de dados com amostras grandes. A etapa inclui a obtenção de informações de mercado ou dados relacionados através de diversas fontes e estratégias. Inclui examinar e planear antecipadamente todos os dados adquiridos no passado. Da mesma forma, envolve o exame de inconsistências de informação observadas em diferentes fontes de informação. Os dados de mercado são analisados e estimados utilizando modelos estatísticos e coerentes de mercado. Além disso, a análise da quota de mercado e a análise das principais tendências são os principais fatores de sucesso no relatório de mercado. Para saber mais, solicite uma chamada de analista ou abra a sua consulta.
A principal metodologia de investigação utilizada pela equipa de investigação do DBMR é a triangulação de dados que envolve a mineração de dados, a análise do impacto das variáveis de dados no mercado e a validação primária (especialista do setor). Os modelos de dados incluem grelha de posicionamento de fornecedores, análise da linha de tempo do mercado, visão geral e guia de mercado, grelha de posicionamento da empresa, análise de patentes, análise de preços, análise da quota de mercado da empresa, normas de medição, análise global versus regional e de participação dos fornecedores. Para saber mais sobre a metodologia de investigação, faça uma consulta para falar com os nossos especialistas do setor.
Personalização disponível
A Data Bridge Market Research é líder em investigação formativa avançada. Orgulhamo-nos de servir os nossos clientes novos e existentes com dados e análises que correspondem e atendem aos seus objetivos. O relatório pode ser personalizado para incluir análise de tendências de preços de marcas-alvo, compreensão do mercado para países adicionais (solicite a lista de países), dados de resultados de ensaios clínicos, revisão de literatura, mercado remodelado e análise de base de produtos . A análise de mercado dos concorrentes-alvo pode ser analisada desde análises baseadas em tecnologia até estratégias de carteira de mercado. Podemos adicionar quantos concorrentes necessitar de dados no formato e estilo de dados que procura. A nossa equipa de analistas também pode fornecer dados em tabelas dinâmicas de ficheiros Excel em bruto (livro de factos) ou pode ajudá-lo a criar apresentações a partir dos conjuntos de dados disponíveis no relatório.

