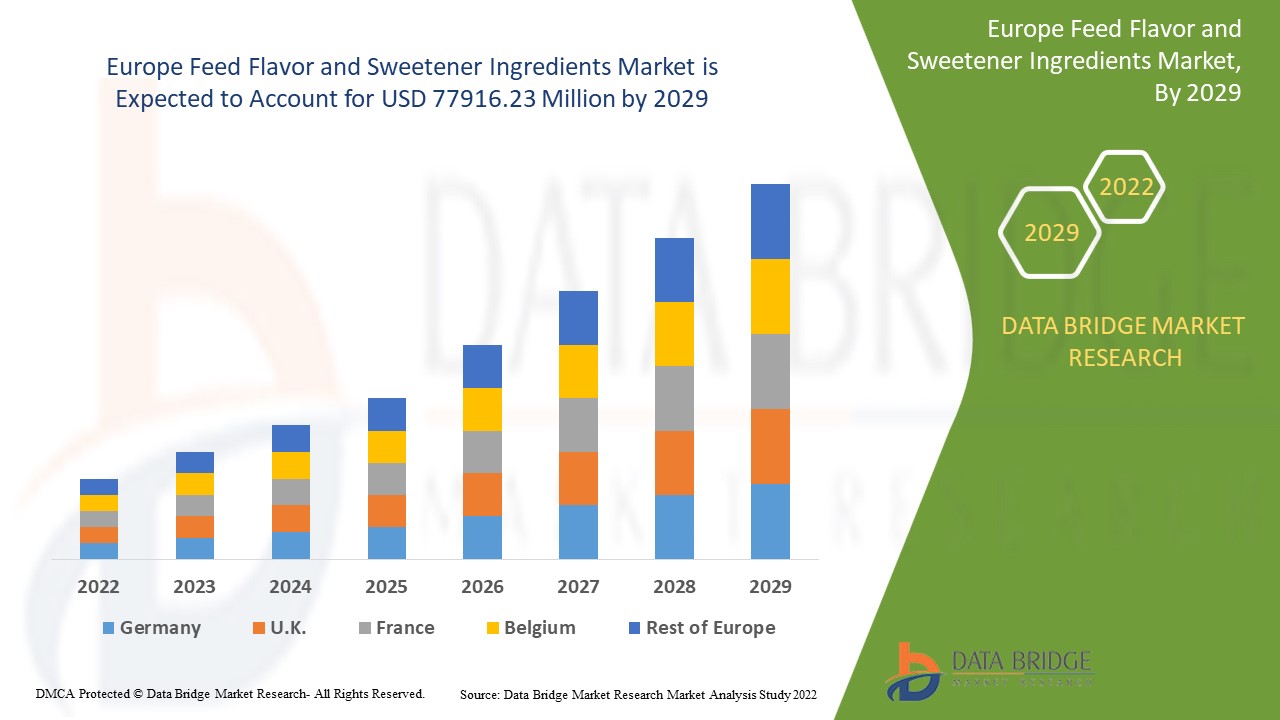
Europe Feed Flavor and Sweetener Ingredients Market, By Type (Feed Flavors, Feed Sweeteners), (Natural and Conventional), Form (Powder, Liquid), Animal (Ruminants, Swine, Poultry, Pets) – Industry Trends and Forecast to 2029
Market Analysis and Size
Feed flavor and sweetener ingredients are being highly focused among livestock owners with the rise in the relevance of feed palatability. Feed flavor and sweeteners are being used to enhance feed palatability and promote feed intake. Various reports suggest that animals make the use of smell and sight to detect subtle differences in feeds and select accordingly.
Europe Feed Flavor and Sweetener Ingredients Market was valued at USD 48897.42 million in 2021 and is expected to reach USD 77916.23 million by 2029, registering a CAGR of 5.10% during the forecast period of 2022-2029. Ruminants account for the largest animal segment in the respective market owing to the high usage of these ingredients to improve their feed intake. In addition to the market insights such as market value, growth rate, market segments, geographical coverage, market players, and market scenario, the market report curated by the Data Bridge Market Research team also includes in-depth expert analysis, import/export analysis, pricing analysis, production consumption analysis, patent analysis and consumer behaviour.
Market Definition
Feed flavor and sweetener ingredients refer to the type of substances that are incorporated within the animal feed to the taste and sweetness. These are added to the animal feed for mainly two purposes: enhancing the taste and smell and enhancing the feed intake in animals.
Report Scope and Market Segmentation
|
Report Metric |
Details |
|
Forecast Period |
2022 to 2029 |
|
Base Year |
2021 |
|
Historic Years |
2020 (Customizable to 2019 - 2014) |
|
Quantitative Units |
Revenue in USD Billion, Volumes in Units, Pricing in USD |
|
Segments Covered |
Type (Feed Flavors, Feed Sweeteners), (Natural and Conventional), Form (Powder, Liquid), Animal (Ruminants, Swine, Poultry, Pets) |
|
Countries Covered |
Germany, Sweden, Poland, Denmark, Italy, U.K., France, Spain, Netherland, Belgium, Switzerland, Turkey, Russia, Rest of Europe in Europe |
|
Market Players Covered |
pancosma (Switzerland), Palital Feed Additives B.V. (Netherlands), Lucta (Spain), PHODE (France), Innov Ad NV/SA (Belgium), Kemin Industries, Inc. (US), Phytobiotics Futterzusatzstoffe GmbH (Germany), Kaesler Nutrition (Germany), INROADS INTERNATIONAL (UK), Adisseo (China), FeedStimulants (Netherlands), DDC Biotech Corp. (India), Alltech (US), Orbitec International S.L. (Spain), and Layn Corp. (China), among others |
|
Market Opportunities |
|
Europe Feed Flavor and Sweetener Ingredients Market Dynamics
This section deals with understanding the market drivers, advantages, opportunities, restraints and challenges. All of this is discussed in detail as below:
Drivers
- High Consumption of Animal Products
The increase in the consumption of animal products across the region acts as one of the major factors driving the growth of feed flavor and sweetener ingredients market. The rise in demand for high quality animal product superior-quality meat products such as meat among growing population has a positive impact on the market.
- Incidences of Disease Outbreaks
The rise in the incidences of disease outbreaks in livestock along with strong impact of animals on environment accelerate the market growth. The growth in consciousness regarding the health of animals among population and high usage of feed flavor and sweetener ingredients to decline nutritional deficiencies drives the market.
- Stringent Specifications
The need to meet quality and import requirements in the region further influence the market. Exports to the European Union are largely high-quality products servicing. According to the Australian Competition and Consumer Commission (ACCC). Thus, cattle producers specialize in preparing animals for the European market.
Additionally, change in lifestyle, increase in the disposable income and rise in awareness regarding the benefits of the feed flavors positively affect the feed flavor and sweetener ingredients market.
Opportunities
Furthermore, implementation of standardized and commercial husbandry practices in order to enhance the quality of notes extend profitable opportunities to the market players in the forecast period of 2022 to 2029. Also, collaborations with the raw material suppliers will further expand the market.
Restraints/Challenges
On the other hand, fluctuating price of raw materials are expected to obstruct the market growth. Lack of awareness is projected to challenge the feed flavor and sweetener ingredients market in the forecast period of 2022-2029.
This feed flavor and sweetener ingredients market report provides details of new recent developments, trade regulations, import-export analysis, production analysis, value chain optimization, market share, impact of domestic and localized market players, analyses opportunities in terms of emerging revenue pockets, changes in market regulations, strategic market growth analysis, market size, category market growths, application niches and dominance, product approvals, product launches, geographic expansions, technological innovations in the market. To gain more info on feed flavor and sweetener ingredients market contact Data Bridge Market Research for an Analyst Brief, our team will help you take an informed market decision to achieve market growth.
COVID-19 Impact on Europe Feed Flavor and Sweetener Ingredients Market
COVID-19 had a negative impact on several industries. However, feed flavor and sweetener ingredients market witnessed a significant growth during this period. During the lockdown imposed by the government to restrict the spread of the coronavirus disease, most livestock owners took keen interest in adopting feed additives due to the rise in consciousness towards disease outbreaks. Manufacturers are focusing on developing feed additives to enhance feed intake, productivity and quality of the end products in the post-COVID scenario.
Europe Feed Flavor and Sweetener Ingredients Market Scope and Market Size
The feed flavor and sweetener ingredients market is segmented on the basis of type, source type, form and animal. The growth amongst these segments will help you analyze meager growth segments in the industries and provide the users with a valuable market overview and market insights to help them make strategic decisions for identifying core market applications.
Type
- Feed Flavors
- Feed Sweeteners
Source Type
- Natural
- Conventional
Form
- Powder
- Liquid
Animal
- Ruminants
- Swine
- Poultry
- Pets
Europe Feed Flavor and Sweetener Ingredients Market Regional Analysis/Insights
The feed flavor and sweetener ingredients market is analysed and market size insights and trends are provided by country, type, source type, form and animal as referenced above.
The countries covered in the feed flavor and sweetener ingredients market report are Germany, Sweden, Poland, Denmark, Italy, U.K., France, Spain, Netherland, Belgium, Switzerland, Turkey, Russia, Rest of Europe in Europe.
In Europe feed flavor and sweetener ingredients market, the France have dominated the market as in Europe the awareness regarding animal health and their feed intake have been strengthened by the contributed efforts from feed control laboratories (CLs), national reference laboratories (NRLs), and EU animal health associations. Germany and U.K. are also expected to dominate the market and grow with a substantial growth rate. These countries are known as a popular hub for feed production. Increasing demand for feed flavors has also pushed feed additives and feed ingredients manufacturers are willing to expand their business in the natural and conventional segment.
The country section of the report also provides individual market impacting factors and changes in regulation in the market domestically that impacts the current and future trends of the market. Data points like down-stream and upstream value chain analysis, technical trends and porter's five forces analysis, case studies are some of the pointers used to forecast the market scenario for individual countries. Also, the presence and availability of global brands and their challenges faced due to large or scarce competition from local and domestic brands, impact of domestic tariffs and trade routes are considered while providing forecast analysis of the country data.
Competitive Landscape and Europe Feed Flavor and Sweetener Ingredients Market Share Analysis
The feed flavor and sweetener ingredients market competitive landscape provides details by competitor. Details included are company overview, company financials, revenue generated, market potential, investment in research and development, new market initiatives, global presence, production sites and facilities, production capacities, company strengths and weaknesses, product launch, product width and breadth, application dominance. The above data points provided are only related to the companies' focus related to feed flavor and sweetener ingredients market.
Some of the major players operating in the feed flavor and sweetener ingredients market are
- pancosma (Switzerland)
- Palital Feed Additives B.V. (Netherlands)
- Lucta (Spain)
- PHODE (France)
- Innov Ad NV/SA (Belgium)
- Kemin Industries, Inc. (US)
- Phytobiotics Futterzusatzstoffe GmbH (Germany)
- Kaesler Nutrition (Germany)
- INROADS INTERNATIONAL (UK)
- Adisseo (China)
- FeedStimulants (Netherlands)
- DDC Biotech Corp. (India)
- Alltech (US)
- Orbitec International S.L. (Spain)
- Layn Corp. (China)
SKU-
Obtenha acesso online ao relatório sobre a primeira nuvem de inteligência de mercado do mundo

- Painel interativo de análise de dados
- Painel de análise da empresa para oportunidades de elevado potencial de crescimento
- Acesso de analista de pesquisa para personalização e customização. consultas
- Análise da concorrência com painel interativo
- Últimas notícias, atualizações e atualizações Análise de tendências
- Aproveite o poder da análise de benchmark para um rastreio abrangente da concorrência
Índice
1 INTRODUÇÃO
1.1 OBJETIVOS DO ESTUDO
1.2 DEFINIÇÃO DE MERCADO
1.3 VISÃO GERAL DO MERCADO EUROPEU DE AROMATIZANTES E ADOÇANTES PARA RAÇÕES
1.4 LIMITAÇÕES
1,5 MERCADOS COBERTOS
2 SEGMENTAÇÃO DE MERCADO
2.1 MERCADOS COBERTOS
2.2 ÂMBITO GEOGRÁFICO
2,3 ANOS CONSIDERADOS PARA O ESTUDO
2.4 MOEDA E PREÇOS
2.5 MODELO DE VALIDAÇÃO DE DADOS TRIPÉ DBMR
2.6 MODELAGEM MULTIVARIADA
2.7 CURVA DA LINHA DE VIDA DO TIPO DE FONTE
2.8 ENTREVISTAS PRINCIPAIS COM PRINCIPAIS LÍDERES DE OPINIÃO
2.9 GRADE DE POSIÇÃO DE MERCADO DBMR
2.1 ANÁLISE DA PARTICIPAÇÃO DO FORNECEDOR
2.11 FONTES SECUNDÁRIAS
2.12 PREMISSAS
3 RESUMO EXECUTIVO
4 INSIGHTS PREMIUM
5 MERCADO EUROPEU DE AROMATIZANTES E ADOÇANTES PARA RAÇÕES: QUADRO REGULAMENTAR
6 VISÃO GERAL DO MERCADO
6.1 MOTORISTAS
6.1.1 ELEVADA SENSAÇÃO OLFATÓRIA E PALADAR EM ANIMAIS
6.1.2 AUMENTO DA CONSCIENTIZAÇÃO SOBRE UMA MELHOR INGESTÃO DE ALIMENTOS PELOS ANIMAIS
6.1.3 ALTA DEMANDA DE PRODUTOS PARA RAÇÃO SABORIZADA
6.1.4 DISPONIBILIDADE DE UMA AMPLA VARIEDADE DE TIPOS DE SABORES PARA RAÇÕES
6.1.5 AUMENTO DA AVÍCOLA
6.2 RESTRIÇÕES
6.2.1 FALTA DE CONSCIENTIZAÇÃO NOS PAÍSES EMERGENTES EM RELAÇÃO AO CONTEÚDO DA RAÇÃO ANIMAL
6.2.2 VARIAÇÃO NA PREFERÊNCIA DE SABORES DE RAÇÃO PELOS ANIMAIS
6.2.3 FALTA DE CONSCIÊNCIA SOBRE INGREDIENTES QUE AUMENTAM A PALATABILIDADE
6.3 OPORTUNIDADES
6.3.1 EXPANSÃO DE NEGÓCIOS PARA CRESCIMENTO FUTURO
6.3.2 AVANÇO CRESCENTE NAS TECNOLOGIAS DE CONSERVAÇÃO DE SABORES
6.3.3 IMPLEMENTAÇÃO DE PRÁTICAS DE MANEJO PADRÃO E COMERCIAL
6.4 DESAFIOS
6.4.1 FLUTUAÇÃO CONTÍNUA DOS PREÇOS DA MATÉRIA-PRIMA
6.4.2 ALTA PRESENÇA DE SUBSTITUTOS
6.4.3 EFEITOS COLATERAIS ASSOCIADOS AOS AROMAS CONVENCIONAIS PARA RAÇÕES
7 IMPACTO DA COVID-19 NO MERCADO DE AROMATIZANTES E ADOÇANTES PARA RAÇÕES
7.1 INICIATIVAS
7.2 CONCLUSÃO
8 MERCADO EUROPEU DE INGREDIENTES AROMATIZANTES E ADOÇANTES PARA RAÇÕES, POR TIPO DE ORIGEM
8.1 VISÃO GERAL
8.2 NATURAL
8.3 CONVENCIONAL
9 MERCADO EUROPEU DE INGREDIENTES AROMATIZANTES E ADOÇANTES PARA RAÇÕES, POR FORMA
9.1 VISÃO GERAL
9.2 LÍQUIDO
9.3 PÓ
10 MERCADO EUROPEU DE INGREDIENTES DE SABOR E ADOÇANTES PARA RAÇÕES, POR ANIMAL
10.1 VISÃO GERAL
10.2 RUMINANTES
10.2.1 BEZERROS
10.2.2 GADO LEITEIRO
10.2.3 GADO DE CORTE
10.2.4 OUTROS
10.3 SUÍNOS
10.3.1 PARTIDA
10.3.2 1.3.2 PRODUTOR
10.3.3 SOW
10.4 AVES
10.4.1 FRANGOS DE FRANGOS
10.4.2 CAMADAS
10.4.3 OUTROS
10,5 PET
10.5.1 GATOS
10.5.2 CÃES
10.5.3 OUTROS
10.6 VISÃO GERAL
11 MERCADO EUROPEU DE AROMATIZANTES E ADOÇANTES PARA RAÇÕES POR PAÍS
11.1 EUROPA
11.1.1 FRANÇA
11.1.2 ALEMANHA
11.1.3 ESPANHA
11.1.4 ITÁLIA
11.1.5 Reino Unido
11.1.6 POLÔNIA
11.1.7 HOLANDA
11.1.8 RÚSSIA
11.1.9 TURQUIA
11.1.10 BÉLGICA
11.1.11 DINAMARCA
11.1.12 SUÍÇA
11.1.13 SUÉCIA
11.1.14 RESTO DA EUROPA
12 MERCADO EUROPEU DE AROMAS E ADOÇANTES PARA RAÇÕES, CENÁRIO DA EMPRESA
12.1 ANÁLISE DE AÇÕES DA EMPRESA: EUROPA
13 ANÁLISE SWOT
14 PERFIS DE EMPRESAS
14.1 LUCTA.
14.1.1 RESUMO DA EMPRESA
14.1.2 ANÁLISE DAS AÇÕES DA EMPRESA
14.1.3 PORTFÓLIO DE PRODUTOS
14.1.4 DESENVOLVIMENTOS RECENTES
14.2 PANCOSMA (UMA SUBSIDIÁRIA DA ADM)
14.2.1 RESUMO DA EMPRESA
14.2.2 ANÁLISE DE RECEITA
14.2.3 ANÁLISE DAS AÇÕES DA EMPRESA
14.2.4 PORTFÓLIO DE PRODUTOS
14.2.5 DESENVOLVIMENTOS RECENTES
14.3 ADISSEO
14.3.1 RESUMO DA EMPRESA
14.3.2 ANÁLISE DE RECEITA
14.3.3 ANÁLISE DE AÇÕES DA EMPRESA
14.3.4 PORTFÓLIO DE PRODUTOS
14.3.5 DESENVOLVIMENTOS RECENTES
14.4 KAESLER NUTRIÇÃO
14.4.1 RESUMO DA EMPRESA
14.4.2 PORTFÓLIO DE PRODUTOS
14.4.3 DESENVOLVIMENTOS RECENTES
14.5 DDC BIOTECH CORP.
14.5.1 RESUMO DA EMPRESA
14.5.2 PORTFÓLIO DE PRODUTOS
14.5.3 DESENVOLVIMENTOS RECENTES
14.6 LAYN CORP.
14.6.1 RESUMO DA EMPRESA
14.6.2 PORTFÓLIO DE PRODUTOS
14.6.3 DESENVOLVIMENTOS RECENTES
14.7 PALITAL ADITIVOS PARA RAÇÕES BV
14.7.1 RESUMO DA EMPRESA
14.7.2 PORTFÓLIO DE PRODUTOS
14.7.3 DESENVOLVIMENTO RECENTE
14.8 ALLTECH
14.8.1 RESUMO DA EMPRESA
14.8.2 PORTFÓLIO DE PRODUTOS
14.8.3 DESENVOLVIMENTOS RECENTES
14,9 PHODE
14.9.1 RESUMO DA EMPRESA
14.9.2 PORTFÓLIO DE PRODUTOS
14.9.3 DESENVOLVIMENTO RECENTE
14.1 KEMIN INDUSTRIES, INC.
14.10.1 RESUMO DA EMPRESA
14.10.2 PORTFÓLIO DE PRODUTOS
14.10.3 DESENVOLVIMENTOS RECENTES
14.11 ESTIMULANTES ALIMENTARES
14.11.1 RESUMO DA EMPRESA
14.11.2 PORTFÓLIO DE PRODUTOS
14.11.3 DESENVOLVIMENTO RECENTE
14.12 FITOBIÓTICOS FUTTERZUSATZSTOFFE GMBH
14.12.1 RESUMO DA EMPRESA
14.12.2 PORTFÓLIO DE PRODUTOS
14.12.3 DESENVOLVIMENTO RECENTE
14.13 INROADS INTERNACIONAL
14.13.1 RESUMO DA EMPRESA
14.13.2 PORTFÓLIO DE PRODUTOS
14.13.3 DESENVOLVIMENTO RECENTE
14.14 INNOV AD NV/SA
14.14.1 RESUMO DA EMPRESA
14.14.2 PORTFÓLIO DE PRODUTOS
14.14.3 DESENVOLVIMENTO RECENTE
14.15 ORBITEC INTERNATIONAL SL
14.15.1 RESUMO DA EMPRESA
14.15.2 1.5.2 PORTFÓLIO DE PRODUTOS
14.15.3 DESENVOLVIMENTO RECENTE
15 QUESTIONÁRIO
16 RELATÓRIOS RELACIONADOS
Lista de Tabela
LISTA DE TABELAS
TABELA 1 MERCADO EUROPEU DE AROMATIZANTES E ADOÇANTES PARA RAÇÕES: QUADRO REGULAMENTAR 33
TABELA 2 MERCADO EUROPEU DE AROMAS PARA RAÇÕES E INGREDIENTES ADOÇANTES, POR TIPO DE FONTE, 2018-2027 (MIL USD) 51
TABELA 3 MERCADO EUROPEU DE AROMAS PARA RAÇÕES E INGREDIENTES ADOÇANTES, POR FORMA, 2018-2027 (MIL USD) 54
TABELA 4 MERCADO EUROPEU DE AROMAS E INGREDIENTES ADOÇANTES PARA RAÇÕES, POR ANIMAL, 2018-2027 (MIL USD) 57
TABELA 5 RUMINANTES DA EUROPA NO MERCADO DE AROMAS PARA RAÇÕES E INGREDIENTES ADOÇANTES, POR ANIMAL 2018-2027 (MIL USD) 58
TABELA 6 MERCADO EUROPEU DE AROMAS PARA RAÇÕES SUÍNAS E INGREDIENTES ADOÇANTES, POR ANIMAL 2018-2027 (MIL USD) 59
TABELA 7 MERCADO DE INGREDIENTES DE AROMATIZANTES E ADOÇANTES PARA RAÇÕES AVÍCOLAS DA EUROPA, POR ANIMAL, 2018-2027 (MIL USD) 60
TABELA 8 MERCADO EUROPEU DE AROMAS PARA RAÇÕES E INGREDIENTES ADOÇANTES PARA PET, POR ANIMAL 2018-2027 (MIL USD) 61
TABELA 9 MERCADO EUROPEU DE AROMATIZANTES E ADOÇANTES PARA RAÇÕES, POR PAÍS, 2018-2027 (MIL USD) 66
TABELA 10 MERCADO EUROPEU DE AROMATIZANTES E ADOÇANTES PARA RAÇÕES, POR NATUREZA, 2018-2027 (MIL USD) 66
TABELA 11 MERCADO EUROPEU DE AROMATIZANTES E ADOÇANTES PARA RAÇÕES, POR FORMA, 2018-2027 (MIL USD) 66
TABELA 12 MERCADO EUROPEU DE AROMATIZANTES E ADOÇANTES PARA RAÇÕES, POR ANIMAL, 2018-2027 (MIL USD) 67
TABELA 13 RUMINANTES DA EUROPA NO MERCADO DE AROMATIZANTES E ADOÇANTES PARA RAÇÕES, POR ANIMAL, 2018-2027 (MIL USD) 67
TABELA 14 MERCADO DE AROMATIZANTES E ADOÇANTES PARA RAÇÕES SUÍNAS NA EUROPA, POR ANIMAL, 2018-2027 (MIL USD) 67
TABELA 15 MERCADO DE INGREDIENTES DE AROMATIZANTES E ADOÇANTES PARA RAÇÕES DE AVES NA EUROPA, POR ANIMAL, 2018-2027 (MIL USD) 67
TABELA 16 MERCADO DE INGREDIENTES PARA AROMAS E ADOÇANTES PARA RAÇÕES PET NA EUROPA, POR ANIMAL, 2018-2027 (MIL USD) 68
TABELA 17 MERCADO DE AROMATIZANTES E ADOÇANTES PARA RAÇÕES NA FRANÇA, POR NATUREZA, 2018-2027 (MIL USD) 69
TABELA 18 MERCADO DE AROMATIZANTES E ADOÇANTES PARA RAÇÕES NA FRANÇA, POR FORMA, 2018-2027 (MIL USD) 69
TABELA 19 MERCADO DE AROMATIZANTES E ADOÇANTES PARA RAÇÕES NA FRANÇA, POR ANIMAL, 2018-2027 (MIL USD) 69
TABELA 20 RUMINANTES DA FRANÇA NO MERCADO DE AROMATIZANTES E ADOÇANTES PARA RAÇÕES, POR ANIMAL, 2018-2027 (MIL USD) 70
TABELA 21 MERCADO DE AROMATIZANTES E ADOÇANTES PARA RAÇÕES SUÍNAS DA FRANÇA, POR ANIMAL, 2018-2027 (MIL USD) 70
TABELA 22 FRANÇA AVES EM MERCADO DE AROMATIZANTES E ADOÇANTES PARA RAÇÃO, POR ANIMAL, 2018-2027 (USD MIL) 70
TABELA 23 FRANÇA PETS NO MERCADO DE AROMAS E ADOÇANTES PARA RAÇÕES, POR ANIMAL, 2018-2027 (MIL USD) 70
TABELA 24 MERCADO DE AROMATIZANTES E ADOÇANTES PARA RAÇÕES NA ALEMANHA, POR NATUREZA, 2018-2027 (MIL USD) 71
TABELA 25 MERCADO DE AROMATIZANTES E ADOÇANTES PARA RAÇÕES NA ALEMANHA, POR FORMA, 2018-2027 (MIL USD) 71
TABELA 26 MERCADO DE AROMATIZANTES E ADOÇANTES PARA RAÇÕES NA ALEMANHA, POR ANIMAL, 2018-2027 (MIL USD) 71
TABELA 27 RUMINANTES DA ALEMANHA NO MERCADO DE AROMATIZANTES E ADOÇANTES PARA RAÇÕES, POR ANIMAL, 2018-2027 (MIL USD) 72
TABELA 28 ALEMANHA SUÍNA NO MERCADO DE AROMATIZANTES E ADOÇANTES PARA RAÇÕES, POR ANIMAL, 2018-2027 (MIL USD) 72
TABELA 29 MERCADO DE AROMATIZANTES E ADOÇANTES PARA RAÇÕES DE AVES DA ALEMANHA, POR ANIMAL, 2018-2027 (MIL USD) 72
TABELA 30 ALEMANHA PETS NO MERCADO DE AROMAS E ADOÇANTES PARA RAÇÕES, POR ANIMAL, 2018-2027 (MIL USD) 72
TABELA 31 MERCADO ESPANHA DE AROMATIZANTES E ADOÇANTES PARA RAÇÕES, POR NATUREZA, 2018-2027 (MIL USD) 73
TABELA 32 MERCADO ESPANHA DE AROMATIZANTES E ADOÇANTES PARA RAÇÕES, POR FORMA, 2018-2027 (MIL USD) 73
TABELA 33 MERCADO ESPANHA DE AROMATIZANTES E ADOÇANTES PARA RAÇÕES, POR ANIMAL, 2018-2027 (MIL USD) 73
TABELA 34 RUMINANTES DA ESPANHA NO MERCADO DE AROMATIZANTES E ADOÇANTES PARA RAÇÕES, POR ANIMAL, 2018-2027 (MIL USD) 74
TABELA 35 ESPANHA SUÍNOS NO MERCADO DE AROMATIZANTES E ADOÇANTES PARA RAÇÕES, POR ANIMAL, 2018-2027 (MIL USD) 74
TABELA 36 MERCADO DE INGREDIENTES DE AROMATIZANTES E ADOÇANTES PARA RAÇÕES DE AVES NA ESPANHA, POR ANIMAL, 2018-2027 (MIL USD) 74
TABELA 37 ESPANHA PETS NO MERCADO DE AROMAS E ADOÇANTES PARA RAÇÕES, POR ANIMAL, 2018-2027 (MIL USD) 74
TABELA 38 MERCADO DE AROMATIZANTES E ADOÇANTES PARA RAÇÕES NA ITÁLIA, POR NATUREZA, 2018-2027 (MIL USD) 75
TABELA 39 MERCADO DE AROMATIZANTES E ADOÇANTES PARA RAÇÕES NA ITÁLIA, POR FORMA, 2018-2027 (MIL USD) 75
TABELA 40 MERCADO DE AROMATIZANTES E ADOÇANTES PARA RAÇÕES NA ITÁLIA, POR ANIMAL, 2018-2027 (MIL USD) 75
TABELA 41 RUMINANTES NO MERCADO DE AROMATIZANTES E ADOÇANTES PARA RAÇÕES NA ITÁLIA, POR ANIMAL, 2018-2027 (MIL USD) 76
TABELA 42 ITÁLIA SUÍNOS NO MERCADO DE AROMATIZANTES E ADOÇANTES PARA RAÇÕES, POR ANIMAL, 2018-2027 (MIL USD) 76
TABELA 43 MERCADO DE INGREDIENTES DE AROMATIZANTES E ADOÇANTES PARA RAÇÕES DE AVES NA ITÁLIA, POR ANIMAL, 2018-2027 (MIL USD) 76
TABELA 44 ITÁLIA PETS NO MERCADO DE AROMAS E ADOÇANTES PARA RAÇÕES, POR ANIMAL, 2018-2027 (MIL USD) 76
TABELA 45 MERCADO DE AROMATIZANTES E ADOÇANTES PARA RAÇÕES NO REINO UNIDO, POR NATUREZA, 2018-2027 (MIL USD) 77
TABELA 46 MERCADO DE AROMATIZANTES E ADOÇANTES PARA RAÇÕES NO REINO UNIDO, POR FORMA, 2018-2027 (MIL USD) 77
TABELA 47 MERCADO DE INGREDIENTES DE AROMATIZANTES E ADOÇANTES PARA RAÇÕES NO REINO UNIDO, POR ANIMAL, 2018-2027 (MIL USD) 77
TABELA 48 RUMINANTES NO MERCADO DE AROMATIZANTES E ADOÇANTES PARA RAÇÕES NO REINO UNIDO, POR ANIMAL, 2018-2027 (MIL USD) 78
TABELA 49 MERCADO DE AROMATIZANTES E ADOÇANTES PARA RAÇÕES SUÍNAS NO REINO UNIDO, POR ANIMAL, 2018-2027 (MIL USD) 78
TABELA 50 MERCADO DE AROMATIZANTES E ADOÇANTES PARA RAÇÕES DE AVES NO REINO UNIDO, POR ANIMAL, 2018-2027 (MIL USD) 78
TABELA 51 - MERCADO DE INGREDIENTES DE AROMAS E ADOÇANTES PARA RAÇÕES DE ANIMAIS DE ESTIMAÇÃO NO REINO UNIDO, POR ANIMAL, 2018-2027 (MIL USD) 78
TABELA 52 MERCADO DE AROMATIZANTES E ADOÇANTES PARA RAÇÕES NA POLÔNIA, POR NATUREZA, 2018-2027 (MIL USD) 79
TABELA 53 MERCADO DE AROMATIZANTES E ADOÇANTES PARA RAÇÕES NA POLÔNIA, POR FORMA, 2018-2027 (MIL USD) 79
TABELA 54 MERCADO DE AROMATIZANTES E ADOÇANTES PARA RAÇÕES NA POLÔNIA, POR ANIMAL, 2018-2027 (MIL USD) 79
TABELA 55 RUMINANTES DA POLÔNIA NO MERCADO DE AROMATIZANTES E ADOÇANTES PARA RAÇÕES, POR ANIMAL, 2018-2027 (MIL USD) 80
TABELA 56 POLÔNIA SUÍNA NO MERCADO DE AROMAS E ADOÇANTES PARA RAÇÕES, POR ANIMAL, 2018-2027 (MIL USD) 80
TABELA 57 MERCADO DE AROMATIZANTES E ADOÇANTES PARA RAÇÕES DE AVES DA POLÔNIA, POR ANIMAL, 2018-2027 (MIL USD) 80
TABELA 58 POLÔNIA PETS NO MERCADO DE AROMAS E ADOÇANTES PARA RAÇÕES, POR ANIMAL, 2018-2027 (MIL USD) 80
TABELA 59 MERCADO HOLANDÊS DE AROMATIZANTES E ADOÇANTES PARA RAÇÕES, POR NATUREZA, 2018-2027 (MIL USD) 81
TABELA 60 MERCADO HOLANDÊS DE AROMATIZANTES E ADOÇANTES PARA RAÇÕES, POR FORMA, 2018-2027 (MIL USD) 81
TABELA 61 MERCADO HOLANDÊS DE AROMATIZANTES E ADOÇANTES PARA RAÇÕES, POR ANIMAL, 2018-2027 (MIL USD) 81
TABELA 62 RUMINANTES HOLANDESES NO MERCADO DE AROMATIZANTES E ADOÇANTES PARA RAÇÕES, POR ANIMAL, 2018-2027 (MIL USD) 82
TABELA 63 MERCADO DE AROMATIZANTES E ADOÇANTES PARA RAÇÕES SUÍNAS HOLANDESAS, POR ANIMAL, 2018-2027 (MIL USD) 82
TABELA 64 MERCADO HOLANDÊS DE AROMATIZANTES E ADOÇANTES PARA RAÇÕES DE AVES, POR ANIMAL, 2018-2027 (MIL USD) 82
TABELA 65 - MERCADO HOLANDÊS DE INGREDIENTES DE AROMAS E ADOÇANTES PARA RAÇÕES DE ANIMAIS DE ESTIMAÇÃO, POR ANIMAL, 2018-2027 (MIL USD) 82
TABELA 66 MERCADO DE INGREDIENTES AROMATIZANTES E ADOÇANTES PARA RAÇÕES NA RÚSSIA, POR NATUREZA, 2018-2027 (MIL USD) 83
TABELA 67 MERCADO DE INGREDIENTES DE AROMATIZANTES E ADOÇANTES PARA RAÇÕES NA RÚSSIA, POR FORMA, 2018-2027 (MIL USD) 83
TABELA 68 MERCADO DE INGREDIENTES DE AROMATIZANTES E ADOÇANTES PARA RAÇÕES NA RÚSSIA, POR ANIMAL, 2018-2027 (MIL USD) 83
TABELA 69 RUMINANTES DA RÚSSIA NO MERCADO DE AROMATIZANTES E ADOÇANTES PARA RAÇÕES, POR ANIMAL, 2018-2027 (MIL USD) 84
TABELA 70 RÚSSIA SUÍNA NO MERCADO DE AROMATIZANTES E ADOÇANTES PARA RAÇÃO, POR ANIMAL, 2018-2027 (MIL USD) 84
TABELA 71 MERCADO DE INGREDIENTES DE AROMATIZANTES E ADOÇANTES PARA RAÇÕES AVÍCOLAS DA RÚSSIA, POR ANIMAL, 2018-2027 (MIL USD) 84
TABELA 72 - MERCADO DE INGREDIENTES PARA AROMAS E ADOÇANTES PARA RAÇÕES DE ANIMAIS DE ESTIMAÇÃO DA RÚSSIA, POR ANIMAL, 2018-2027 (MIL USD) 84
TABELA 73 MERCADO DE AROMATIZANTES E ADOÇANTES PARA RAÇÃO DE PERU, POR NATUREZA, 2018-2027 (MIL USD) 85
TABELA 74 MERCADO DE AROMATIZANTES E ADOÇANTES PARA RAÇÃO DE PERU, POR FORMA, 2018-2027 (MIL USD) 85
TABELA 75 MERCADO DE AROMATIZANTES E ADOÇANTES PARA RAÇÃO DE PERU, POR ANIMAL, 2018-2027 (MIL USD) 85
TABELA 76 RUMINANTES DE PERU NO MERCADO DE AROMATIZANTES E ADOÇANTES PARA RAÇÕES, POR ANIMAL, 2018-2027 (MIL USD) 86
TABELA 77 MERCADO DE AROMATIZANTES E ADOÇANTES PARA RAÇÕES SUÍNAS, POR ANIMAL, 2018-2027 (MIL USD) 86
TABELA 78 MERCADO DE INGREDIENTES DE AROMATIZANTES E ADOÇANTES PARA RAÇÃO DE AVES DE PERU, POR ANIMAL, 2018-2027 (MIL USD) 86
TABELA 79 PERU PETS NO MERCADO DE AROMAS E ADOÇANTES PARA RAÇÕES, POR ANIMAL, 2018-2027 (MIL USD) 86
TABELA 80 MERCADO BÉLGICO DE AROMATIZANTES E ADOÇANTES PARA RAÇÕES, POR NATUREZA, 2018-2027 (MIL USD) 87
TABELA 81 MERCADO BÉLGICO DE AROMATIZANTES E ADOÇANTES PARA RAÇÕES, POR FORMA, 2018-2027 (MIL USD) 87
TABELA 82 MERCADO BÉLGICO DE AROMATIZANTES E ADOÇANTES PARA RAÇÕES, POR ANIMAL, 2018-2027 (MIL USD) 87
TABELA 83 RUMINANTES BÉLGICO NO MERCADO DE AROMATIZANTES E ADOÇANTES PARA RAÇÕES, POR ANIMAL, 2018-2027 (MIL USD) 88
TABELA 84 MERCADO DE AROMATIZANTES E ADOÇANTES PARA RAÇÕES SUÍNAS DA BÉLGICA, POR ANIMAL, 2018-2027 (MIL USD) 88
TABELA 85 MERCADO DE AROMATIZANTES E ADOÇANTES PARA RAÇÕES DE AVES DA BÉLGICA, POR ANIMAL, 2018-2027 (MIL USD) 88
TABELA 86 BÉLGICA PETS NO MERCADO DE AROMAS E ADOÇANTES PARA RAÇÕES, POR ANIMAL, 2018-2027 (MIL USD) 88
TABELA 87 MERCADO DE AROMATIZANTES E ADOÇANTES PARA RAÇÕES NA DINAMARCA, POR NATUREZA, 2018-2027 (MIL USD) 89
TABELA 88 MERCADO DE AROMATIZANTES E ADOÇANTES PARA RAÇÕES NA DINAMARCA, POR FORMA, 2018-2027 (MIL USD) 89
TABELA 89 MERCADO DE AROMATIZANTES E ADOÇANTES PARA RAÇÕES NA DINAMARCA, POR ANIMAL, 2018-2027 (MIL USD) 89
TABELA 90 RUMINANTES DA DINAMARCA NO MERCADO DE AROMATIZANTES E ADOÇANTES PARA RAÇÕES, POR ANIMAL, 2018-2027 (MIL USD) 90
TABELA 91 MERCADO DE AROMATIZANTES E ADOÇANTES PARA RAÇÕES SUÍNAS DA DINAMARCA, POR ANIMAL, 2018-2027 (MIL USD) 90
TABELA 92 MERCADO DE AROMATIZANTES E ADOÇANTES PARA RAÇÕES DE AVES DA DINAMARCA, POR ANIMAL, 2018-2027 (MIL USD) 90
TABELA 93 - MERCADO DE INGREDIENTES PARA AROMAS E ADOÇANTES PARA RAÇÕES, POR ANIMAL, 2018-2027 (MIL USD) 90
TABELA 94 MERCADO DE AROMATIZANTES E ADOÇANTES PARA RAÇÕES NA SUÍÇA, POR NATUREZA, 2018-2027 (MIL USD) 91
TABELA 95 MERCADO DE AROMATIZANTES E ADOÇANTES PARA RAÇÕES NA SUÍÇA, POR FORMA, 2018-2027 (MIL USD) 91
TABELA 96 MERCADO DE AROMATIZANTES E ADOÇANTES PARA RAÇÕES NA SUÍÇA, POR ANIMAL, 2018-2027 (MIL USD) 91
TABELA 97 RUMINANTES DA SUÍÇA NO MERCADO DE AROMATIZANTES E ADOÇANTES PARA RAÇÕES, POR ANIMAL, 2018-2027 (MIL USD) 92
TABELA 98 MERCADO DE AROMATIZANTES E ADOÇANTES PARA RAÇÕES SUÍNAS, POR ANIMAL, 2018-2027 (MIL USD) 92
TABELA 99 MERCADO DE AROMATIZANTES E ADOÇANTES PARA RAÇÕES DE AVES DA SUÍÇA, POR ANIMAL, 2018-2027 (MIL USD) 92
TABELA 100 PETS DA SUÍÇA NO MERCADO DE AROMAS E ADOÇANTES PARA RAÇÕES, POR ANIMAL, 2018-2027 (MIL USD) 92
TABELA 101 MERCADO DE AROMATIZANTES E ADOÇANTES PARA RAÇÕES NA SUÉCIA, POR NATUREZA, 2018-2027 (MIL USD) 93
TABELA 102 MERCADO DE AROMATIZANTES E ADOÇANTES PARA RAÇÕES NA SUÉCIA, POR FORMA, 2018-2027 (MIL USD) 93
TABELA 103 MERCADO DE AROMATIZANTES E ADOÇANTES PARA RAÇÕES NA SUÉCIA, POR ANIMAL, 2018-2027 (MIL USD) 93
TABELA 104 RUMINANTES DA SUÉCIA NO MERCADO DE AROMATIZANTES E ADOÇANTES PARA RAÇÕES, POR ANIMAL, 2018-2027 (MIL USD) 94
TABELA 105 MERCADO DE AROMATIZANTES E ADOÇANTES PARA RAÇÕES SUÍNAS, POR ANIMAL, 2018-2027 (MIL USD) 94
TABELA 106 MERCADO DE AROMATIZANTES E ADOÇANTES PARA RAÇÕES DE AVES DA SUÉCIA, POR ANIMAL, 2018-2027 (MIL USD) 94
TABELA 107 MERCADO DE INGREDIENTES DE AROMAS E ADOÇANTES PARA RAÇÕES, POR ANIMAL, 2018-2027 (MIL USD) 94
TABELA 108 MERCADO DE AROMATIZANTES E ADOÇANTES PARA RAÇÕES NA SUÉCIA, POR NATUREZA, 2018-2027 (MIL USD) 95
Lista de Figura
LISTA DE FIGURAS
FIGURA 1 MERCADO EUROPEU DE AROMATIZANTES E ADOÇANTES PARA RAÇÕES: SEGMENTAÇÃO 19
FIGURA 2 MERCADO EUROPEU DE AROMATIZANTES E ADOÇANTES PARA RAÇÕES: TRIANGULAÇÃO DE DADOS 21
FIGURA 3 MERCADO EUROPEU DE AROMATIZANTES E ADOÇANTES PARA RAÇÕES: ANÁLISE DROC 22
FIGURA 4 MERCADO EUROPEU DE AROMATIZANTES E ADOÇANTES PARA RAÇÕES: ANÁLISE DE MERCADO EUROPEU VS MERCADO REGIONAL 23
FIGURA 5 MERCADO EUROPEU DE AROMATIZANTES E ADOÇANTES PARA RAÇÕES: ANÁLISE DE PESQUISA DA EMPRESA 23
FIGURA 6 MERCADO EUROPEU DE AROMATIZANTES E ADOÇANTES PARA RAÇÕES: ENTREVISTA DEMOGRAFIA 25
FIGURA 7 MERCADO EUROPEU DE AROMATIZANTES E ADOÇANTES PARA RAÇÕES: POSIÇÃO DE MERCADO DBMR GRADE 26
FIGURA 8 MERCADO EUROPEU DE AROMATIZANTES E ADOÇANTES PARA RAÇÕES: ANÁLISE DA PARTICIPAÇÃO DE FORNECEDORES 27
FIGURA 9 MERCADO EUROPEU DE AROMATIZANTES E ADOÇANTES PARA RAÇÕES: SEGMENTAÇÃO 30
FIGURA 10 ELEVADA SENSAÇÃO OLFATÓRIA E GUSTATIVA EM ANIMAIS E A CRESCENTE CONSCIENTIZAÇÃO EM RELAÇÃO A UMA MELHOR INGESTÃO DE RAÇÃO PELOS ANIMAIS ESTÃO IMPULSIONANDO O MERCADO EUROPEU DE AROMATIZANTES E ADOÇANTES PARA RAÇÕES NO PERÍODO PREVISTO DE 2020 A 2027 31
FIGURA 11 O SEGMENTO DE PÓ DEVE SER REPRESENTANTE DA MAIOR PARCIALIDADE DO MERCADO EUROPEU DE AROMATIZANTES E ADOÇANTES PARA RAÇÕES EM 2020 E 2027 31
FIGURA 12 MOTIVADORES, RESTRIÇÕES, OPORTUNIDADES E DESAFIOS DO MERCADO EUROPEU DE AROMATIZANTES E ADOÇANTES PARA RAÇÕES 35
FIGURA 13 ESTOQUE TOTAL DE BOVINOS EM ABRIL DE 2019-2020 (1000 POR CABEÇA) UNIÃO EUROPEIA 46
FIGURA 14 PRODUÇÃO SUÍNA EM ABRIL DE 2019-2020 (1000 POR CABEÇA) UNIÃO EUROPEIA 47
FIGURA 15 PRODUÇÃO DE CARNE BOVINA EM ABRIL DE 2019-2020 (1000 POR CABEÇA) UNIÃO EUROPEIA, MÉXICO, CHINA 47
FIGURA 16 MERCADO EUROPEU DE AROMATIZANTES E ADOÇANTES PARA RAÇÕES, POR TIPO DE FONTE 50
FIGURA 17 INGREDIENTES DE AROMATIZANTES E ADOÇANTES PARA RAÇÕES NA EUROPA, PELA FORM 53
FIGURA 18 MERCADO EUROPEU DE AROMATIZANTES E ADOÇANTES PARA RAÇÕES, POR ANIMAL 56
FIGURA 19 MERCADO EUROPEU DE AROMATIZANTES E ADOÇANTES PARA RAÇÕES: RESUMO (2019) 63
FIGURA 20 MERCADO EUROPEU DE AROMATIZANTES E ADOÇANTES PARA RAÇÕES: POR PAÍS (2019) 64
FIGURA 21 MERCADO EUROPEU DE AROMATIZANTES E ADOÇANTES PARA RAÇÕES: POR PAÍS (2020 e 2027) 64
FIGURA 22 MERCADO EUROPEU DE AROMATIZANTES E ADOÇANTES PARA RAÇÕES: POR PAÍS (2019 e 2027) 65
FIGURA 23 MERCADO EUROPEU DE AROMATIZANTES E ADOÇANTES PARA RAÇÕES: POR TIPO DE PRODUTO (2020-2027) 65
FIGURA 24 MERCADO EUROPEU DE AROMAS E ADOÇANTES PARA RAÇÕES: PARTICIPAÇÃO DA EMPRESA EM 2019 (%) 96
Metodologia de Investigação
A recolha de dados e a análise do ano base são feitas através de módulos de recolha de dados com amostras grandes. A etapa inclui a obtenção de informações de mercado ou dados relacionados através de diversas fontes e estratégias. Inclui examinar e planear antecipadamente todos os dados adquiridos no passado. Da mesma forma, envolve o exame de inconsistências de informação observadas em diferentes fontes de informação. Os dados de mercado são analisados e estimados utilizando modelos estatísticos e coerentes de mercado. Além disso, a análise da quota de mercado e a análise das principais tendências são os principais fatores de sucesso no relatório de mercado. Para saber mais, solicite uma chamada de analista ou abra a sua consulta.
A principal metodologia de investigação utilizada pela equipa de investigação do DBMR é a triangulação de dados que envolve a mineração de dados, a análise do impacto das variáveis de dados no mercado e a validação primária (especialista do setor). Os modelos de dados incluem grelha de posicionamento de fornecedores, análise da linha de tempo do mercado, visão geral e guia de mercado, grelha de posicionamento da empresa, análise de patentes, análise de preços, análise da quota de mercado da empresa, normas de medição, análise global versus regional e de participação dos fornecedores. Para saber mais sobre a metodologia de investigação, faça uma consulta para falar com os nossos especialistas do setor.
Personalização disponível
A Data Bridge Market Research é líder em investigação formativa avançada. Orgulhamo-nos de servir os nossos clientes novos e existentes com dados e análises que correspondem e atendem aos seus objetivos. O relatório pode ser personalizado para incluir análise de tendências de preços de marcas-alvo, compreensão do mercado para países adicionais (solicite a lista de países), dados de resultados de ensaios clínicos, revisão de literatura, mercado remodelado e análise de base de produtos . A análise de mercado dos concorrentes-alvo pode ser analisada desde análises baseadas em tecnologia até estratégias de carteira de mercado. Podemos adicionar quantos concorrentes necessitar de dados no formato e estilo de dados que procura. A nossa equipa de analistas também pode fornecer dados em tabelas dinâmicas de ficheiros Excel em bruto (livro de factos) ou pode ajudá-lo a criar apresentações a partir dos conjuntos de dados disponíveis no relatório.

