
Market Analysis and Size
Feed flavor and sweetener ingredients are being highly focused among livestock owners with the rise in the relevance of feed palatability. Feed flavor and sweeteners are being used to enhance feed palatability and promote feed intake. Various reports suggest that animals make the use of smell and sight to detect subtle differences in feeds and select accordingly.
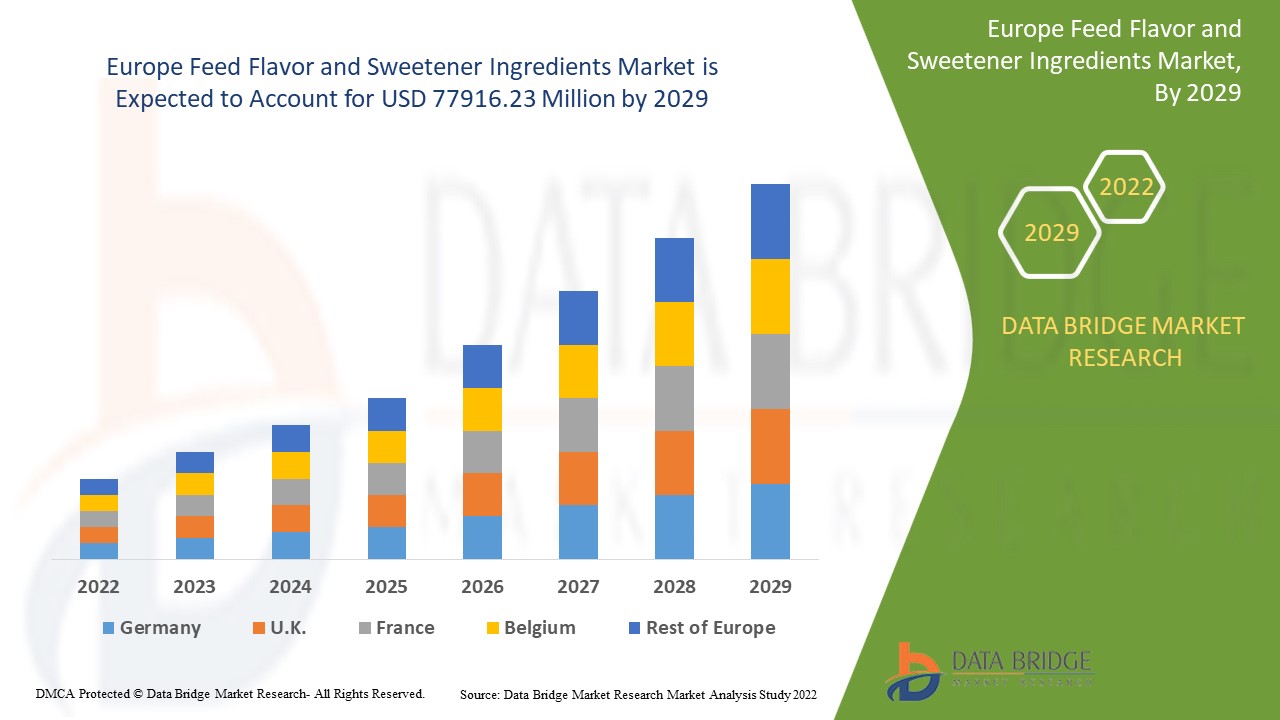
Europe Feed Flavor and Sweetener Ingredients Market was valued at USD 48897.42 million in 2021 and is expected to reach USD 77916.23 million by 2029, registering a CAGR of 5.10% during the forecast period of 2022-2029. Ruminants account for the largest animal segment in the respective market owing to the high usage of these ingredients to improve their feed intake. In addition to the market insights such as market value, growth rate, market segments, geographical coverage, market players, and market scenario, the market report curated by the Data Bridge Market Research team also includes in-depth expert analysis, import/export analysis, pricing analysis, production consumption analysis, patent analysis and consumer behaviour.
Market Definition
Feed flavor and sweetener ingredients refer to the type of substances that are incorporated within the animal feed to the taste and sweetness. These are added to the animal feed for mainly two purposes: enhancing the taste and smell and enhancing the feed intake in animals.
Report Scope and Market Segmentation
|
Report Metric |
Details |
|
Forecast Period |
2022 to 2029 |
|
Base Year |
2021 |
|
Historic Years |
2020 (Customizable to 2019 - 2014) |
|
Quantitative Units |
Revenue in USD Billion, Volumes in Units, Pricing in USD |
|
Segments Covered |
Type (Feed Flavors, Feed Sweeteners), (Natural and Conventional), Form (Powder, Liquid), Animal (Ruminants, Swine, Poultry, Pets) |
|
Countries Covered |
Germany, Sweden, Poland, Denmark, Italy, U.K., France, Spain, Netherland, Belgium, Switzerland, Turkey, Russia, Rest of Europe in Europe |
|
Market Players Covered |
pancosma (Switzerland), Palital Feed Additives B.V. (Netherlands), Lucta (Spain), PHODE (France), Innov Ad NV/SA (Belgium), Kemin Industries, Inc. (US), Phytobiotics Futterzusatzstoffe GmbH (Germany), Kaesler Nutrition (Germany), INROADS INTERNATIONAL (UK), Adisseo (China), FeedStimulants (Netherlands), DDC Biotech Corp. (India), Alltech (US), Orbitec International S.L. (Spain), and Layn Corp. (China), among others |
|
Market Opportunities |
|
Europe Feed Flavor and Sweetener Ingredients Market Dynamics
This section deals with understanding the market drivers, advantages, opportunities, restraints and challenges. All of this is discussed in detail as below:
Drivers
- High Consumption of Animal Products
The increase in the consumption of animal products across the region acts as one of the major factors driving the growth of feed flavor and sweetener ingredients market. The rise in demand for high quality animal product superior-quality meat products such as meat among growing population has a positive impact on the market.
- Incidences of Disease Outbreaks
The rise in the incidences of disease outbreaks in livestock along with strong impact of animals on environment accelerate the market growth. The growth in consciousness regarding the health of animals among population and high usage of feed flavor and sweetener ingredients to decline nutritional deficiencies drives the market.
- Stringent Specifications
The need to meet quality and import requirements in the region further influence the market. Exports to the European Union are largely high-quality products servicing. According to the Australian Competition and Consumer Commission (ACCC). Thus, cattle producers specialize in preparing animals for the European market.
Additionally, change in lifestyle, increase in the disposable income and rise in awareness regarding the benefits of the feed flavors positively affect the feed flavor and sweetener ingredients market.
Opportunities
Furthermore, implementation of standardized and commercial husbandry practices in order to enhance the quality of notes extend profitable opportunities to the market players in the forecast period of 2022 to 2029. Also, collaborations with the raw material suppliers will further expand the market.
Restraints/Challenges
On the other hand, fluctuating price of raw materials are expected to obstruct the market growth. Lack of awareness is projected to challenge the feed flavor and sweetener ingredients market in the forecast period of 2022-2029.
This feed flavor and sweetener ingredients market report provides details of new recent developments, trade regulations, import-export analysis, production analysis, value chain optimization, market share, impact of domestic and localized market players, analyses opportunities in terms of emerging revenue pockets, changes in market regulations, strategic market growth analysis, market size, category market growths, application niches and dominance, product approvals, product launches, geographic expansions, technological innovations in the market. To gain more info on feed flavor and sweetener ingredients market contact Data Bridge Market Research for an Analyst Brief, our team will help you take an informed market decision to achieve market growth.
COVID-19 Impact on Europe Feed Flavor and Sweetener Ingredients Market
COVID-19 had a negative impact on several industries. However, feed flavor and sweetener ingredients market witnessed a significant growth during this period. During the lockdown imposed by the government to restrict the spread of the coronavirus disease, most livestock owners took keen interest in adopting feed additives due to the rise in consciousness towards disease outbreaks. Manufacturers are focusing on developing feed additives to enhance feed intake, productivity and quality of the end products in the post-COVID scenario.
Europe Feed Flavor and Sweetener Ingredients Market Scope and Market Size
The feed flavor and sweetener ingredients market is segmented on the basis of type, source type, form and animal. The growth amongst these segments will help you analyze meager growth segments in the industries and provide the users with a valuable market overview and market insights to help them make strategic decisions for identifying core market applications.
Type
- Feed Flavors
- Feed Sweeteners
Source Type
- Natural
- Conventional
Form
- Powder
- Liquid
Animal
- Ruminants
- Swine
- Poultry
- Pets
Europe Feed Flavor and Sweetener Ingredients Market Regional Analysis/Insights
The feed flavor and sweetener ingredients market is analysed and market size insights and trends are provided by country, type, source type, form and animal as referenced above.
The countries covered in the feed flavor and sweetener ingredients market report are Germany, Sweden, Poland, Denmark, Italy, U.K., France, Spain, Netherland, Belgium, Switzerland, Turkey, Russia, Rest of Europe in Europe.
In Europe feed flavor and sweetener ingredients market, the France have dominated the market as in Europe the awareness regarding animal health and their feed intake have been strengthened by the contributed efforts from feed control laboratories (CLs), national reference laboratories (NRLs), and EU animal health associations. Germany and U.K. are also expected to dominate the market and grow with a substantial growth rate. These countries are known as a popular hub for feed production. Increasing demand for feed flavors has also pushed feed additives and feed ingredients manufacturers are willing to expand their business in the natural and conventional segment.
The country section of the report also provides individual market impacting factors and changes in regulation in the market domestically that impacts the current and future trends of the market. Data points like down-stream and upstream value chain analysis, technical trends and porter's five forces analysis, case studies are some of the pointers used to forecast the market scenario for individual countries. Also, the presence and availability of global brands and their challenges faced due to large or scarce competition from local and domestic brands, impact of domestic tariffs and trade routes are considered while providing forecast analysis of the country data.
Competitive Landscape and Europe Feed Flavor and Sweetener Ingredients Market Share Analysis
The feed flavor and sweetener ingredients market competitive landscape provides details by competitor. Details included are company overview, company financials, revenue generated, market potential, investment in research and development, new market initiatives, global presence, production sites and facilities, production capacities, company strengths and weaknesses, product launch, product width and breadth, application dominance. The above data points provided are only related to the companies' focus related to feed flavor and sweetener ingredients market.
Some of the major players operating in the feed flavor and sweetener ingredients market are
- pancosma (Switzerland)
- Palital Feed Additives B.V. (Netherlands)
- Lucta (Spain)
- PHODE (France)
- Innov Ad NV/SA (Belgium)
- Kemin Industries, Inc. (US)
- Phytobiotics Futterzusatzstoffe GmbH (Germany)
- Kaesler Nutrition (Germany)
- INROADS INTERNATIONAL (UK)
- Adisseo (China)
- FeedStimulants (Netherlands)
- DDC Biotech Corp. (India)
- Alltech (US)
- Orbitec International S.L. (Spain)
- Layn Corp. (China)
SKU-

- Interactive Data Analysis Dashboard
- Company Analysis Dashboard for high growth potential opportunities
- Research Analyst Access for customization & queries
- Competitor Analysis with Interactive dashboard
- Latest News, Updates & Trend analysis
- Harness the Power of Benchmark Analysis for Comprehensive Competitor Tracking
Table of Content
1 INTRODUCTION
1.1 OBJECTIVES OF THE STUDY
1.2 MARKET DEFINITION
1.3 OVERVIEW OF EUROPE FEED FLAVOR AND SWEETENER INGREDIENTS MARKET
1.4 LIMITATIONS
1.5 MARKETS COVERED
2 MARKET SEGMENTATION
2.1 MARKETS COVERED
2.2 GEOGRAPHICAL SCOPE
2.3 YEARS CONSIDERED FOR THE STUDY
2.4 CURRENCY AND PRICING
2.5 DBMR TRIPOD DATA VALIDATION MODEL
2.6 MULTIVARIATE MODELLING
2.7 SOURCE TYPE LIFELINE CURVE
2.8 PRIMARY INTERVIEWS WITH KEY OPINION LEADERS
2.9 DBMR MARKET POSITION GRID
2.1 VENDOR SHARE ANALYSIS
2.11 SECONDARY SOURCES
2.12 ASSUMPTIONS
3 EXECUTIVE SUMMARY
4 PREMIUM INSIGHTS
5 EUROPE FEED FLAVOR AND SWEETENER INGREDIENTS MARKET: REGULATORY FRAMEWORK
6 MARKET OVERVIEW
6.1 DRIVERS
6.1.1 HIGH OLFACTORY AND TASTE SENSATION IN ANIMALS
6.1.2 RISING AWARENESS REGARDING BETTER FEED INTAKE OF ANIMALS
6.1.3 HIGH DEMAND OF FLAVORED FEED PRODUCTS
6.1.4 AVAILABILITY OF WIDE RANGE OF TYPES OF FEED FLAVORS
6.1.5 INCREASED POULTRY FARMING
6.2 RESTRAINTS
6.2.1 LACK OF AWARENESS IN EMERGING COUNTRIES REGARDING FEED CONTENT
6.2.2 VARIATION IN PREFERENCE OF FEED FLAVORS BY ANIMALS
6.2.3 LACK OF AWARENESS ABOUT PALATABILITY BOOSTING INGREDIENTS
6.3 OPPORTUNITIES
6.3.1 BUSINESS EXPANSION FOR FUTURE GROWTH
6.3.2 GROWING ADVANCEMENT IN FLAVOR PRESERVATION TECHNOLOGIES
6.3.3 IMPLEMENTATION OF STANDARDIZED AND COMMERCIAL HUSBANDRY PRACTICES
6.4 CHALLENGES
6.4.1 CONTINUOUS FLUCTUATION IN PRICES OF RAW MATERIAL
6.4.2 HIGH PRESENCE OF SUBSTITUTES
6.4.3 SIDE EFFECTS ASSOCIATED WITH CONVENTIONAL FEED FLAVORS
7 COVID-19 IMPACT ON FEED FLAVOR AND SWEETENER INGREDIENTS MARKET
7.1 INITIATIVES
7.2 CONCLUSION
8 EUROPE FEED FLAVOR AND SWEETENER INGREDIENTS MARKET, BY SOURCE TYPE
8.1 OVERVIEW
8.2 NATURAL
8.3 CONVENTIONAL
9 EUROPE FEED FLAVOR AND SWEETENER INGREDIENTS MARKET, BY FORM
9.1 OVERVIEW
9.2 LIQUID
9.3 POWDER
10 EUROPE FEED FLAVOR AND SWEETENER INGREDIENTS MARKET, BY ANIMAL
10.1 OVERVIEW
10.2 RUMINANTS
10.2.1 CALVES
10.2.2 DAIRY CATTLE
10.2.3 BEEF CATTLE
10.2.4 OTHER
10.3 SWINE
10.3.1 STARTER
10.3.2 1.3.2 GROWER
10.3.3 SOW
10.4 POULTRY
10.4.1 BROILERS
10.4.2 LAYERS
10.4.3 OTHERS
10.5 PET
10.5.1 CATS
10.5.2 DOGS
10.5.3 OTHER
10.6 OVERVIEW
11 EUROPE FEED FLAVOR AND SWEETENER INGREDIENTS MARKET BY COUNTRY
11.1 EUROPE
11.1.1 FRANCE
11.1.2 GERMANY
11.1.3 SPAIN
11.1.4 ITALY
11.1.5 U.K.
11.1.6 POLAND
11.1.7 NETHERLANDS
11.1.8 RUSSIA
11.1.9 TURKEY
11.1.10 BELGIUM
11.1.11 DENMARK
11.1.12 SWITZERLAND
11.1.13 SWEDEN
11.1.14 REST OF EUROPE
12 EUROPE FEED FLAVORS AND SWEETENERS MARKET, COMPANY LANDSCAPE
12.1 COMPANY SHARE ANALYSIS: EUROPE
13 SWOT ANALYSIS
14 COMPANY PROFILES
14.1 LUCTA.
14.1.1 COMPANY SNAPSHOT
14.1.2 COMPANY SHARE ANALYSIS
14.1.3 PRODUCT PORTFOLIO
14.1.4 RECENT DEVELOPMENTS
14.2 PANCOSMA (A SUBSIDIARY OF ADM)
14.2.1 COMPANY SNAPSHOT
14.2.2 REVENUE ANALYSIS
14.2.3 COMPANY SHARE ANALYSIS
14.2.4 PRODUCT PORTFOLIO
14.2.5 RECENT DEVELOPMENTS
14.3 ADISSEO
14.3.1 COMPANY SNAPSHOT
14.3.2 REVENUE ANALYSIS
14.3.3 COMPANY SHARE ANALYSIS
14.3.4 PRODUCT PORTFOLIO
14.3.5 RECENT DEVELOPMENTS
14.4 KAESLER NUTRITION
14.4.1 COMPANY SNAPSHOT
14.4.2 PRODUCT PORTFOLIO
14.4.3 RECENT DEVELOPMENTS
14.5 DDC BIOTECH CORP.
14.5.1 COMPANY SNAPSHOT
14.5.2 PRODUCT PORTFOLIO
14.5.3 RECENT DEVELOPMENTS
14.6 LAYN CORP.
14.6.1 COMPANY SNAPSHOT
14.6.2 PRODUCT PORTFOLIO
14.6.3 RECENT DEVELOPMENTS
14.7 PALITAL FEED ADDITIVES B.V.
14.7.1 COMPANY SNAPSHOT
14.7.2 PRODUCT PORTFOLIO
14.7.3 RECENT DEVELOPMENT
14.8 ALLTECH
14.8.1 COMPANY SNAPSHOT
14.8.2 PRODUCT PORTFOLIO
14.8.3 RECENT DEVELOPMENTS
14.9 PHODE
14.9.1 COMPANY SNAPSHOT
14.9.2 PRODUCT PORTFOLIO
14.9.3 RECENT DEVELOPMENT
14.1 KEMIN INDUSTRIES, INC.
14.10.1 COMPANY SNAPSHOT
14.10.2 PRODUCT PORTFOLIO
14.10.3 RECENT DEVELOPMENTS
14.11 FEEDSTIMULANTS
14.11.1 COMPANY SNAPSHOT
14.11.2 PRODUCT PORTFOLIO
14.11.3 RECENT DEVELOPMENT
14.12 PHYTOBIOTICS FUTTERZUSATZSTOFFE GMBH
14.12.1 COMPANY SNAPSHOT
14.12.2 PRODUCT PORTFOLIO
14.12.3 RECENT DEVELOPMENT
14.13 INROADS INTERNATIONAL
14.13.1 COMPANY SNAPSHOT
14.13.2 PRODUCT PORTFOLIO
14.13.3 RECENT DEVELOPMENT
14.14 INNOV AD NV/SA
14.14.1 COMPANY SNAPSHOT
14.14.2 PRODUCT PORTFOLIO
14.14.3 RECENT DEVELOPMENT
14.15 ORBITEC INTERNATIONAL S.L.
14.15.1 COMPANY SNAPSHOT
14.15.2 1.5.2 PRODUCT PORTFOLIO
14.15.3 RECENT DEVELOPMENT
15 QUESTIONNAIRE
16 RELATED REPORTS
List of Table
LIST OF TABLES
TABLE 1 EUROPE FEED FLAVOR AND SWEETENER INGREDIENTS MARKET: REGULATORY FRAMEWORK 33
TABLE 2 EUROPE FEED FLAVORS AND SWEETENER INGREDIENTS MARKET,BY SOURCE TYPE, 2018-2027 (USD THOUSAND) 51
TABLE 3 EUROPE FEED FLAVORS AND SWEETENER INGREDIENTS MARKET,BY FORM, 2018-2027 (USD THOUSAND) 54
TABLE 4 EUROPE FEED FLAVORS AND SWEETENER INGREDIENTS MARKET,BY ANIMAL, 2018-2027 (USD THOUSAND) 57
TABLE 5 EUROPE RUMINANTS IN FEED FLAVORS AND SWEETENER INGREDIENTS MARKET, BY ANIMAL 2018-2027 (USD THOUSAND) 58
TABLE 6 EUROPE SWINE IN FEED FLAVORS AND SWEETENER INGREDIENTS MARKET, BY ANIMAL 2018-2027 (USD THOUSAND) 59
TABLE 7 EUROPE POULTRY IN FEED FLAVORS AND SWEETENERS INGREDIENTS MARKET, BY ANIMAL, 2018-2027 (USD THOUSAND) 60
TABLE 8 EUROPE PET IN FEED FLAVORS AND SWEETENER INGREDIENTS MARKET, BY ANIMAL 2018-2027 (USD THOUSAND) 61
TABLE 9 EUROPE FEED FLAVORS AND SWEETENERS INGREDIENTS MARKET,BY COUNTRY, 2018-2027 (USD THOUSAND) 66
TABLE 10 EUROPE FEED FLAVORS AND SWEETENERS INGREDIENTS MARKET, BY NATURE, 2018-2027 (USD THOUSAND) 66
TABLE 11 EUROPE FEED FLAVORS AND SWEETENERS INGREDIENTS MARKET, BY FORM, 2018-2027 (USD THOUSAND) 66
TABLE 12 EUROPE FEED FLAVORS AND SWEETENERS INGREDIENTS MARKET, BY ANIMAL, 2018-2027 (USD THOUSAND) 67
TABLE 13 EUROPE RUMINANTS IN FEED FLAVORS AND SWEETENERS INGREDIENTS MARKET, BY ANIMAL, 2018-2027 (USD THOUSAND) 67
TABLE 14 EUROPE SWINE IN FEED FLAVORS AND SWEETENERS INGREDIENTS MARKET, BY ANIMAL, 2018-2027 (USD THOUSAND) 67
TABLE 15 EUROPE POULTRY IN FEED FLAVORS AND SWEETENERS INGREDIENTS MARKET, BY ANIMAL, 2018-2027 (USD THOUSAND) 67
TABLE 16 EUROPE PETS IN FEED FLAVORS AND SWEETENERS INGREDIENTS MARKET, BY ANIMAL, 2018-2027 (USD THOUSAND) 68
TABLE 17 FRANCE FEED FLAVORS AND SWEETENERS INGREDIENTS MARKET, BY NATURE, 2018-2027 (USD THOUSAND) 69
TABLE 18 FRANCE FEED FLAVORS AND SWEETENERS INGREDIENTS MARKET, BY FORM, 2018-2027 (USD THOUSAND) 69
TABLE 19 FRANCE FEED FLAVORS AND SWEETENERS INGREDIENTS MARKET, BY ANIMAL, 2018-2027 (USD THOUSAND) 69
TABLE 20 FRANCE RUMINANTS IN FEED FLAVORS AND SWEETENERS INGREDIENTS MARKET, BY ANIMAL, 2018-2027 (USD THOUSAND) 70
TABLE 21 FRANCE SWINE IN FEED FLAVORS AND SWEETENERS INGREDIENTS MARKET, BY ANIMAL, 2018-2027 (USD THOUSAND) 70
TABLE 22 FRANCE POULTRY IN FEED FLAVORS AND SWEETENERS INGREDIENTS MARKET, BY ANIMAL, 2018-2027 (USD THOUSAND) 70
TABLE 23 FRANCE PETS IN FEED FLAVORS AND SWEETENERS INGREDIENTS MARKET, BY ANIMAL, 2018-2027 (USD THOUSAND) 70
TABLE 24 GERMANY FEED FLAVORS AND SWEETENERS INGREDIENTS MARKET, BY NATURE, 2018-2027 (USD THOUSAND) 71
TABLE 25 GERMANY FEED FLAVORS AND SWEETENERS INGREDIENTS MARKET, BY FORM, 2018-2027 (USD THOUSAND) 71
TABLE 26 GERMANY FEED FLAVORS AND SWEETENERS INGREDIENTS MARKET, BY ANIMAL, 2018-2027 (USD THOUSAND) 71
TABLE 27 GERMANY RUMINANTS IN FEED FLAVORS AND SWEETENERS INGREDIENTS MARKET, BY ANIMAL, 2018-2027 (USD THOUSAND) 72
TABLE 28 GERMANY SWINE IN FEED FLAVORS AND SWEETENERS INGREDIENTS MARKET, BY ANIMAL, 2018-2027 (USD THOUSAND) 72
TABLE 29 GERMANY POULTRY IN FEED FLAVORS AND SWEETENERS INGREDIENTS MARKET, BY ANIMAL, 2018-2027 (USD THOUSAND) 72
TABLE 30 GERMANY PETS IN FEED FLAVORS AND SWEETENERS INGREDIENTS MARKET, BY ANIMAL, 2018-2027 (USD THOUSAND) 72
TABLE 31 SPAIN FEED FLAVORS AND SWEETENERS INGREDIENTS MARKET, BY NATURE, 2018-2027 (USD THOUSAND) 73
TABLE 32 SPAIN FEED FLAVORS AND SWEETENERS INGREDIENTS MARKET, BY FORM, 2018-2027 (USD THOUSAND) 73
TABLE 33 SPAIN FEED FLAVORS AND SWEETENERS INGREDIENTS MARKET, BY ANIMAL, 2018-2027 (USD THOUSAND) 73
TABLE 34 SPAIN RUMINANTS IN FEED FLAVORS AND SWEETENERS INGREDIENTS MARKET, BY ANIMAL, 2018-2027 (USD THOUSAND) 74
TABLE 35 SPAIN SWINE IN FEED FLAVORS AND SWEETENERS INGREDIENTS MARKET, BY ANIMAL, 2018-2027 (USD THOUSAND) 74
TABLE 36 SPAIN POULTRY IN FEED FLAVORS AND SWEETENERS INGREDIENTS MARKET, BY ANIMAL, 2018-2027 (USD THOUSAND) 74
TABLE 37 SPAIN PETS IN FEED FLAVORS AND SWEETENERS INGREDIENTS MARKET, BY ANIMAL, 2018-2027 (USD THOUSAND) 74
TABLE 38 ITALY FEED FLAVORS AND SWEETENERS INGREDIENTS MARKET, BY NATURE, 2018-2027 (USD THOUSAND) 75
TABLE 39 ITALY FEED FLAVORS AND SWEETENERS INGREDIENTS MARKET, BY FORM, 2018-2027 (USD THOUSAND) 75
TABLE 40 ITALY FEED FLAVORS AND SWEETENERS INGREDIENTS MARKET, BY ANIMAL, 2018-2027 (USD THOUSAND) 75
TABLE 41 ITALY RUMINANTS IN FEED FLAVORS AND SWEETENERS INGREDIENTS MARKET, BY ANIMAL, 2018-2027 (USD THOUSAND) 76
TABLE 42 ITALY SWINE IN FEED FLAVORS AND SWEETENERS INGREDIENTS MARKET, BY ANIMAL, 2018-2027 (USD THOUSAND) 76
TABLE 43 ITALY POULTRY IN FEED FLAVORS AND SWEETENERS INGREDIENTS MARKET, BY ANIMAL, 2018-2027 (USD THOUSAND) 76
TABLE 44 ITALY PETS IN FEED FLAVORS AND SWEETENERS INGREDIENTS MARKET, BY ANIMAL, 2018-2027 (USD THOUSAND) 76
TABLE 45 U.K. FEED FLAVORS AND SWEETENERS INGREDIENTS MARKET, BY NATURE, 2018-2027 (USD THOUSAND) 77
TABLE 46 U.K. FEED FLAVORS AND SWEETENERS INGREDIENTS MARKET, BY FORM, 2018-2027 (USD THOUSAND) 77
TABLE 47 U.K. FEED FLAVORS AND SWEETENERS INGREDIENTS MARKET, BY ANIMAL, 2018-2027 (USD THOUSAND) 77
TABLE 48 U.K. RUMINANTS IN FEED FLAVORS AND SWEETENERS INGREDIENTS MARKET, BY ANIMAL, 2018-2027 (USD THOUSAND) 78
TABLE 49 U.K. SWINE IN FEED FLAVORS AND SWEETENERS INGREDIENTS MARKET, BY ANIMAL, 2018-2027 (USD THOUSAND) 78
TABLE 50 U.K. POULTRY IN FEED FLAVORS AND SWEETENERS INGREDIENTS MARKET, BY ANIMAL, 2018-2027 (USD THOUSAND) 78
TABLE 51 U.K. PETS IN FEED FLAVORS AND SWEETENERS INGREDIENTS MARKET, BY ANIMAL, 2018-2027 (USD THOUSAND) 78
TABLE 52 POLAND FEED FLAVORS AND SWEETENERS INGREDIENTS MARKET, BY NATURE, 2018-2027 (USD THOUSAND) 79
TABLE 53 POLAND FEED FLAVORS AND SWEETENERS INGREDIENTS MARKET, BY FORM, 2018-2027 (USD THOUSAND) 79
TABLE 54 POLAND FEED FLAVORS AND SWEETENERS INGREDIENTS MARKET, BY ANIMAL, 2018-2027 (USD THOUSAND) 79
TABLE 55 POLAND RUMINANTS IN FEED FLAVORS AND SWEETENERS INGREDIENTS MARKET, BY ANIMAL, 2018-2027 (USD THOUSAND) 80
TABLE 56 POLAND SWINE IN FEED FLAVORS AND SWEETENERS INGREDIENTS MARKET, BY ANIMAL, 2018-2027 (USD THOUSAND) 80
TABLE 57 POLAND POULTRY IN FEED FLAVORS AND SWEETENERS INGREDIENTS MARKET, BY ANIMAL, 2018-2027 (USD THOUSAND) 80
TABLE 58 POLAND PETS IN FEED FLAVORS AND SWEETENERS INGREDIENTS MARKET, BY ANIMAL, 2018-2027 (USD THOUSAND) 80
TABLE 59 NETHERLANDS FEED FLAVORS AND SWEETENERS INGREDIENTS MARKET, BY NATURE, 2018-2027 (USD THOUSAND) 81
TABLE 60 NETHERLANDS FEED FLAVORS AND SWEETENERS INGREDIENTS MARKET, BY FORM, 2018-2027 (USD THOUSAND) 81
TABLE 61 NETHERLANDS FEED FLAVORS AND SWEETENERS INGREDIENTS MARKET, BY ANIMAL, 2018-2027 (USD THOUSAND) 81
TABLE 62 NETHERLANDS RUMINANTS IN FEED FLAVORS AND SWEETENERS INGREDIENTS MARKET, BY ANIMAL, 2018-2027 (USD THOUSAND) 82
TABLE 63 NETHERLANDS SWINE IN FEED FLAVORS AND SWEETENERS INGREDIENTS MARKET, BY ANIMAL, 2018-2027 (USD THOUSAND) 82
TABLE 64 NETHERLANDS POULTRY IN FEED FLAVORS AND SWEETENERS INGREDIENTS MARKET, BY ANIMAL, 2018-2027 (USD THOUSAND) 82
TABLE 65 NETHERLANDS PETS IN FEED FLAVORS AND SWEETENERS INGREDIENTS MARKET, BY ANIMAL, 2018-2027 (USD THOUSAND) 82
TABLE 66 RUSSIA FEED FLAVORS AND SWEETENERS INGREDIENTS MARKET, BY NATURE, 2018-2027 (USD THOUSAND) 83
TABLE 67 RUSSIA FEED FLAVORS AND SWEETENERS INGREDIENTS MARKET, BY FORM, 2018-2027 (USD THOUSAND) 83
TABLE 68 RUSSIA FEED FLAVORS AND SWEETENERS INGREDIENTS MARKET, BY ANIMAL, 2018-2027 (USD THOUSAND) 83
TABLE 69 RUSSIA RUMINANTS IN FEED FLAVORS AND SWEETENERS INGREDIENTS MARKET, BY ANIMAL, 2018-2027 (USD THOUSAND) 84
TABLE 70 RUSSIA SWINE IN FEED FLAVORS AND SWEETENERS INGREDIENTS MARKET, BY ANIMAL, 2018-2027 (USD THOUSAND) 84
TABLE 71 RUSSIA POULTRY IN FEED FLAVORS AND SWEETENERS INGREDIENTS MARKET, BY ANIMAL, 2018-2027 (USD THOUSAND) 84
TABLE 72 RUSSIA PETS IN FEED FLAVORS AND SWEETENERS INGREDIENTS MARKET, BY ANIMAL, 2018-2027 (USD THOUSAND) 84
TABLE 73 TURKEY FEED FLAVORS AND SWEETENERS INGREDIENTS MARKET, BY NATURE, 2018-2027 (USD THOUSAND) 85
TABLE 74 TURKEY FEED FLAVORS AND SWEETENERS INGREDIENTS MARKET, BY FORM, 2018-2027 (USD THOUSAND) 85
TABLE 75 TURKEY FEED FLAVORS AND SWEETENERS INGREDIENTS MARKET, BY ANIMAL, 2018-2027 (USD THOUSAND) 85
TABLE 76 TURKEY RUMINANTS IN FEED FLAVORS AND SWEETENERS INGREDIENTS MARKET, BY ANIMAL, 2018-2027 (USD THOUSAND) 86
TABLE 77 TURKEY SWINE IN FEED FLAVORS AND SWEETENERS INGREDIENTS MARKET, BY ANIMAL, 2018-2027 (USD THOUSAND) 86
TABLE 78 TURKEY POULTRY IN FEED FLAVORS AND SWEETENERS INGREDIENTS MARKET, BY ANIMAL, 2018-2027 (USD THOUSAND) 86
TABLE 79 TURKEY PETS IN FEED FLAVORS AND SWEETENERS INGREDIENTS MARKET, BY ANIMAL, 2018-2027 (USD THOUSAND) 86
TABLE 80 BELGIUM FEED FLAVORS AND SWEETENERS INGREDIENTS MARKET, BY NATURE, 2018-2027 (USD THOUSAND) 87
TABLE 81 BELGIUM FEED FLAVORS AND SWEETENERS INGREDIENTS MARKET, BY FORM, 2018-2027 (USD THOUSAND) 87
TABLE 82 BELGIUM FEED FLAVORS AND SWEETENERS INGREDIENTS MARKET, BY ANIMAL, 2018-2027 (USD THOUSAND) 87
TABLE 83 BELGIUM RUMINANTS IN FEED FLAVORS AND SWEETENERS INGREDIENTS MARKET, BY ANIMAL, 2018-2027 (USD THOUSAND) 88
TABLE 84 BELGIUM SWINE IN FEED FLAVORS AND SWEETENERS INGREDIENTS MARKET, BY ANIMAL, 2018-2027 (USD THOUSAND) 88
TABLE 85 BELGIUM POULTRY IN FEED FLAVORS AND SWEETENERS INGREDIENTS MARKET, BY ANIMAL, 2018-2027 (USD THOUSAND) 88
TABLE 86 BELGIUM PETS IN FEED FLAVORS AND SWEETENERS INGREDIENTS MARKET, BY ANIMAL, 2018-2027 (USD THOUSAND) 88
TABLE 87 DENMARK FEED FLAVORS AND SWEETENERS INGREDIENTS MARKET, BY NATURE, 2018-2027 (USD THOUSAND) 89
TABLE 88 DENMARK FEED FLAVORS AND SWEETENERS INGREDIENTS MARKET, BY FORM, 2018-2027 (USD THOUSAND) 89
TABLE 89 DENMARK FEED FLAVORS AND SWEETENERS INGREDIENTS MARKET, BY ANIMAL, 2018-2027 (USD THOUSAND) 89
TABLE 90 DENMARK RUMINANTS IN FEED FLAVORS AND SWEETENERS INGREDIENTS MARKET, BY ANIMAL, 2018-2027 (USD THOUSAND) 90
TABLE 91 DENMARK SWINE IN FEED FLAVORS AND SWEETENERS INGREDIENTS MARKET, BY ANIMAL, 2018-2027 (USD THOUSAND) 90
TABLE 92 DENMARK POULTRY IN FEED FLAVORS AND SWEETENERS INGREDIENTS MARKET, BY ANIMAL, 2018-2027 (USD THOUSAND) 90
TABLE 93 DENMARK PETS IN FEED FLAVORS AND SWEETENERS INGREDIENTS MARKET, BY ANIMAL, 2018-2027 (USD THOUSAND) 90
TABLE 94 SWITZERLAND FEED FLAVORS AND SWEETENERS INGREDIENTS MARKET, BY NATURE, 2018-2027 (USD THOUSAND) 91
TABLE 95 SWITZERLAND FEED FLAVORS AND SWEETENERS INGREDIENTS MARKET, BY FORM, 2018-2027 (USD THOUSAND) 91
TABLE 96 SWITZERLAND FEED FLAVORS AND SWEETENERS INGREDIENTS MARKET, BY ANIMAL, 2018-2027 (USD THOUSAND) 91
TABLE 97 SWITZERLAND RUMINANTS IN FEED FLAVORS AND SWEETENERS INGREDIENTS MARKET, BY ANIMAL, 2018-2027 (USD THOUSAND) 92
TABLE 98 SWITZERLAND SWINE IN FEED FLAVORS AND SWEETENERS INGREDIENTS MARKET, BY ANIMAL, 2018-2027 (USD THOUSAND) 92
TABLE 99 SWITZERLAND POULTRY IN FEED FLAVORS AND SWEETENERS INGREDIENTS MARKET, BY ANIMAL, 2018-2027 (USD THOUSAND) 92
TABLE 100 SWITZERLAND PETS IN FEED FLAVORS AND SWEETENERS INGREDIENTS MARKET, BY ANIMAL, 2018-2027 (USD THOUSAND) 92
TABLE 101 SWEDEN FEED FLAVORS AND SWEETENERS INGREDIENTS MARKET, BY NATURE, 2018-2027 (USD THOUSAND) 93
TABLE 102 SWEDEN FEED FLAVORS AND SWEETENERS INGREDIENTS MARKET, BY FORM, 2018-2027 (USD THOUSAND) 93
TABLE 103 SWEDEN FEED FLAVORS AND SWEETENERS INGREDIENTS MARKET, BY ANIMAL, 2018-2027 (USD THOUSAND) 93
TABLE 104 SWEDEN RUMINANTS IN FEED FLAVORS AND SWEETENERS INGREDIENTS MARKET, BY ANIMAL, 2018-2027 (USD THOUSAND) 94
TABLE 105 SWEDEN SWINE IN FEED FLAVORS AND SWEETENERS INGREDIENTS MARKET, BY ANIMAL, 2018-2027 (USD THOUSAND) 94
TABLE 106 SWEDEN POULTRY IN FEED FLAVORS AND SWEETENERS INGREDIENTS MARKET, BY ANIMAL, 2018-2027 (USD THOUSAND) 94
TABLE 107 SWEDEN PETS IN FEED FLAVORS AND SWEETENERS INGREDIENTS MARKET, BY ANIMAL, 2018-2027 (USD THOUSAND) 94
TABLE 108 SWEDEN FEED FLAVORS AND SWEETENERS INGREDIENTS MARKET, BY NATURE, 2018-2027 (USD THOUSAND) 95
List of Figure
LIST OF FIGURES
FIGURE 1 EUROPE FEED FLAVOR AND SWEETENER INGREDIENTS MARKET: SEGMENTATION 19
FIGURE 2 EUROPE FEED FLAVOR AND SWEETENER INGREDIENTS MARKET: DATA TRIANGULATION 21
FIGURE 3 EUROPE FEED FLAVOR AND SWEETENER INGREDIENTS MARKET: DROC ANALYSIS 22
FIGURE 4 EUROPE FEED FLAVOR AND SWEETENER INGREDIENTS MARKET: EUROPE VS REGIONAL MARKET ANALYSIS 23
FIGURE 5 EUROPE FEED FLAVOR AND SWEETENER INGREDIENTS MARKET: COMPANY RESEARCH ANALYSIS 23
FIGURE 6 EUROPE FEED FLAVOR AND SWEETENER INGREDIENTS MARKET: INTERVIEW DEMOGRAPHICS 25
FIGURE 7 EUROPE FEED FLAVOR AND SWEETENER INGREDIENTS MARKET: DBMR MARKET POSITION GRID 26
FIGURE 8 EUROPE FEED FLAVOR AND SWEETENER INGREDIENTS MARKET: VENDOR SHARE ANALYSIS 27
FIGURE 9 EUROPE FEED FLAVOR AND SWEETENER INGREDIENTS MARKET: SEGMENTATION 30
FIGURE 10 HIGH OLFACTORY AND TASTE SENSATION IN ANIMALS AND RISING AWARENESS REGARDING BETTER FEED INTAKE OF ANIMALS ARE DRIVING THE EUROPE FEED FLAVOR AND SWEETENER INGREDIENTS MARKET IN THE FORECAST PERIOD OF 2020 TO 2027 31
FIGURE 11 POWDER SEGMENT IS EXPECTED TO ACCOUNT FOR THE LARGEST SHARE OF THE EUROPE FEED FLAVOR AND SWEETENER INGREDIENTS MARKET IN 2020 & 2027 31
FIGURE 12 DRIVERS, RESTRAINTS, OPPORTUNITIES AND CHALLENGES OF EUROPE FEED FLAVOR AND SWEETENER INGREDIENTS MARKET 35
FIGURE 13 TOTAL STACK OF CATTLE IN APRIL, 2019-2020 (1000 PER HEAD) EUROPEAN UNION 46
FIGURE 14 SWINE PRODUCTION IN APRIL, 2019-2020 (1000 PER HEAD) EUROPEAN UNION 47
FIGURE 15 BEEF PRODUCTION IN APRIL, 2019-2020 (1000 PER HEAD) EUROPEAN UNION, MEXICO, CHINA 47
FIGURE 16 EUROPE FEED FLAVORS AND SWEETENERS INGREDIENTS MARKET,BY SOURCE TYPE 50
FIGURE 17 EUROPE FEED FLAVOR AND SWEETENER INGREDIENTS MAKRET, BY FORM 53
FIGURE 18 EUROPE FEED FLAVOR AND SWEETENER INGREDIENTS MARKET, BY ANIMAL 56
FIGURE 19 EUROPE FEED FLAVORS AND SWEETENERS INGREDIENTS MARKET: SNAPSHOT (2019) 63
FIGURE 20 EUROPE FEED FLAVORS AND SWEETENERS INGREDIENTS MARKET: BY COUNTRY(2019) 64
FIGURE 21 EUROPE FEED FLAVORS AND SWEETENERS INGREDIENTS MARKET: BY COUNTRY(2020& 2027) 64
FIGURE 22 EUROPE FEED FLAVORS AND SWEETENERS INGREDIENTS MARKET: BY COUNTRY (2019& 2027) 65
FIGURE 23 EUROPE FEED FLAVORS AND SWEETENERS INGREDIENTS MARKET: BY PRODUCT TYPE (2020-2027) 65
FIGURE 24 EUROPE FEED FLAVORS AND SWEETNERS MARKET: COMPANY SHARE 2019 (%) 96
Data collection and base year analysis are done using data collection modules with large sample sizes. The stage includes obtaining market information or related data through various sources and strategies. It includes examining and planning all the data acquired from the past in advance. It likewise envelops the examination of information inconsistencies seen across different information sources. The market data is analysed and estimated using market statistical and coherent models. Also, market share analysis and key trend analysis are the major success factors in the market report. To know more, please request an analyst call or drop down your inquiry.
The key research methodology used by DBMR research team is data triangulation which involves data mining, analysis of the impact of data variables on the market and primary (industry expert) validation. Data models include Vendor Positioning Grid, Market Time Line Analysis, Market Overview and Guide, Company Positioning Grid, Patent Analysis, Pricing Analysis, Company Market Share Analysis, Standards of Measurement, Global versus Regional and Vendor Share Analysis. To know more about the research methodology, drop in an inquiry to speak to our industry experts.
Data Bridge Market Research is a leader in advanced formative research. We take pride in servicing our existing and new customers with data and analysis that match and suits their goal. The report can be customized to include price trend analysis of target brands understanding the market for additional countries (ask for the list of countries), clinical trial results data, literature review, refurbished market and product base analysis. Market analysis of target competitors can be analyzed from technology-based analysis to market portfolio strategies. We can add as many competitors that you require data about in the format and data style you are looking for. Our team of analysts can also provide you data in crude raw excel files pivot tables (Fact book) or can assist you in creating presentations from the data sets available in the report.


