Europe Industrial IoT Market, By Technology (Sensors, Industrial Robotics, Cameras, Distributed Control System, GPS/GNSS, Networking Technology, RFID, Interface Board, Condition Monitoring, Yield Monitoring, Smart Meters, Smart Beacon, Flow & Application Control Device, Guidance & Steering, and Electronic Shelf Label), Application (SCADA, MES, PLM, Distribution Management System, Transit Management System, Outage Management System, Visualization Software, Remote Patient Monitoring, Retail Management Software, Farm Management System And Others), Connectivity (Wired, Wireless And Hybrid), End Use (Manufacturing, Transportation & Logistics, Energy, Oil & Gas, Metal & Mining, Healthcare, Retail, Agriculture, and Others) Industry Trends and Forecast to 2029
Europe Industrial IoT Market Analysis and Size
Increased use of the industrial IoT market due to the adoption of Artificial Intelligence (AI) and Machine Learning (ML) in the end user industry is also driving the market's growth. The higher probability of device theft and data breaches is expected to restrain the industrial IoT market. Growing internet penetration and digitalization across the globe are an opportunity for the industrial IoT market. High installation costs and difficulties in integrating IoT devices challenge the Europe industrial IoT market.
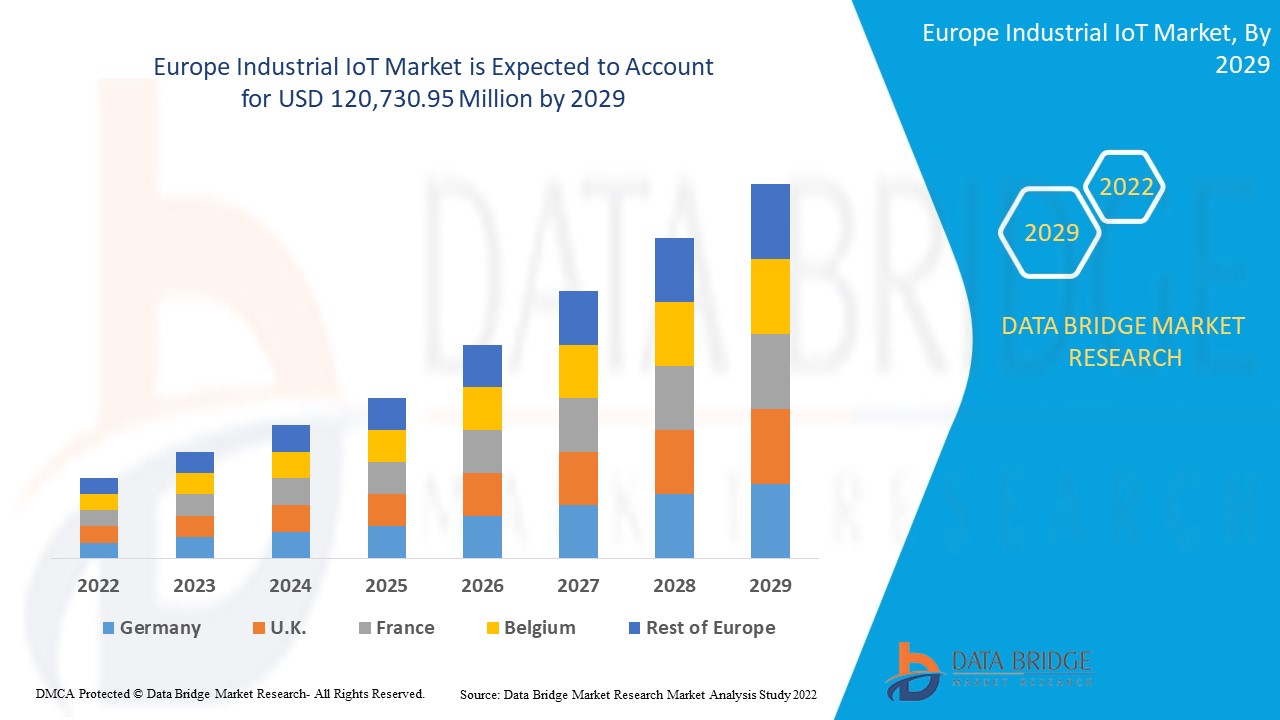
Data Bridge Market Research analyses that the Europe industrial IoT market is expected to reach USD 120,730.95 million by 2029, at a CAGR of 9.6% during the forecast period. "Sensors" accounts for the most prominent technology segment as this type of technology is in demand and is the best option to extract information from industrial components. The industrial IoT market report also comprehensively covers pricing, patent, and technological advancements.
|
Report Metric |
Details |
|
Forecast Period |
2022 to 2029 |
|
Base Year |
2021 |
|
Historic Years |
2020 (Customizable to 2019-2014) |
|
Quantitative Units |
Revenue in USD Million, Volumes in Units, Pricing in USD |
|
Segments Covered |
By Technology (Sensors, Industrial Robotics, Cameras, Distributed Control System, GPS/GNSS, Networking Technology, RFID, Interface Board, Condition Monitoring, Yield Monitoring, Smart Meters, Smart Beacon, Flow & Application Control Device, Guidance & Steering, and Electronic Shelf Label), Application (SCADA, MES, PLM, Distribution Management System, Transit Management System, Outage Management System, Visualization Software, Remote Patient Monitoring, Retail Management Software, Farm Management System, and Others), Connectivity (Wired, Wireless, and Hybrid), End Use (Manufacturing, Transportation & Logistics, Energy, Oil & Gas, Metal & Mining, Healthcare, Retail, Agriculture, and Others)– Industry Trends and Forecast to 2029 |
|
Countries Covered |
Germany, France, Italy, U.K., Turkey, Switzerland, Spain, Russia, Netherlands, Belgium, and the Rest of Europe |
|
Market Players Covered |
Cisco Systems, Inc., Siemens. General Electric, IBM Corporation, Intel Corporation, PTC, Honeywell International Inc., NEC Corporation, Rockwell Automation, ABB, SAP SE, Texas Instruments Incorporated, Robert Bosch GmbH, Emerson Electric Co., Microsoft, KUKA AG, Sigfox Network Limited (a subsidiary of UnaBiz), Wipro, Arm Limited (a subsidiary of Softbank Group Corp.) and Huawei Technologies Co., Ltd., among others |
Market Definition
The extension and application of the internet of things (IoT) in industrial sectors and applications are referred to as the industrial internet of things (IoT). The Machine-to-Machine (M2M) Internet of Things (IIoT) enables businesses and industries to operate more efficiently and reliably because of its strong emphasis on M2M connectivity, big data, and machine learning. Industrial applications such as robotics, medical technology, and software-defined production processes are all included in the IIoT.
Industrial IoT Market Dynamics
This section deals with understanding the market drivers, advantages, opportunities, restraints, and challenges. All of this is discussed in detail below:
Drivers
- Increase in adoption of artificial intelligence (AI) and machine learning (ML) in end user industry
The popularity of AI and ML is increasing year over year in various industries such as manufacturing, healthcare, energy, oil & gas, and many others. Most of these industries adopt the technology to increase working efficiency, automate the service delivery process and modernize the offerings, which has gained an important role in competing with competitors in the market. Thus, the rising trend of AI & ML adoption is a major driver of the growth of the Europe industrial IoT market.
- Surge in implementation of sensors and distributed control systems in business operations
The adoption of sensors and distributed control system will help control and manage the work process and automate the management process for all industrial processes. Thus, the demand for implementing sensors and DCS in various business operations will increase yearly. Thus, globally, the need for sensors and DCS is increasing due to multiple advantages associated with the implementation. It promotes the growth of the Europe Industrial IoT market and acts as a driver for the development of the market.
- Increase in the need for real-time data solutions and services
The real-time data solutions require a wide range of electronic devices, and the demand for IoT devices is expected to increase to support real-time data analysis in business operations to keep a quick understanding of data and guide the decisions to deliver products or services to customers. Thus, there is high demand for the adoption of real-time solutions that directly involve the usage of IoT devices for industries. Therefore it is expected to be a major driver of market growth.
Restraints/ Challenges
- Lack of skilled labor and training sessions
Adopting IoT solutions for industries is not quick and easy; it involves complete visualization and an adequate method of automating the sector. Therefore, end users need more time and labor to adopt the solutions and train the employees to understand the process and maintenance.
- Higher probability of device theft and data breaches
The dependability of the IT climate suggests getting the plant's resources, organization, and information created by these associated gadgets. The reliability responsibility is higher in adopting digitalization in business operations; however, there is a high probability of a safety disadvantage.
- Rise in the technical complexities due to day-by-day technological advancement
Flexible security is one thought for giving medical care, instruction, and lodging help, whether somebody is officially utilized. Furthermore, action records can back deep-rooted training and laborer retraining. Regardless of how individuals decide to invest energy, there should be ways for individuals to live satisfying lives irrespective of whether society needs fewer specialists. Thus, continuous technological advancement will lead to constant employee training and hinder the market growth.
Post COVID-19 Impact on Industrial IoT Market
COVID-19 significantly impacted the industrial IoT market as almost every country has opted for the shutdown for every production facility except those dealing in producing essential goods. The government has taken strict actions, such as shutting down production and sale of non-essential goods, blocking international trade, and many more, to prevent the spread of COVID-19. The only business dealing in this pandemic situation is the essential services allowed to open and run the processes.
The growth of the industrial IoT market is rising due to the digitalization in the production process and supply chains across agriculture, electrical utilities, mining, oil and gas, and transportation. Moreover, the IoT adoption in industries had huge progress from 2020 to 2021 as the pandemic demonstrated the importance of IoT in all types of businesses. The surge in demand for automation to avoid the involvement of a maximum workforce has driven the adoption of IoT in industries. This replicates the positive impact of COVID-19 on the IIoT market, which has further catalyzed the business through adopting industry 4.0 technologies.
Manufacturers are making various strategic decisions to bounce back post-COVID-19. The players are conducting multiple research and development activities to improve the technology involved in the industrial IoT market. The companies will bring advanced and accurate solutions to the market.
Recent Development
- In March 2022, Cisco Systems, Inc. developed an advanced IoT Control Center platform to help improve service reliability and reduce operational costs. This development will help the company diversify its solution portfolio and offers better quality solutions
- In April 2022, Arm Limited introduced two new solutions, Arm Cortex-M85 and Cortex-A. These new products and solutions will help the company offer better solutions to customers, attracting new customers and accelerating revenue growth
Europe Industrial IoT Market Scope
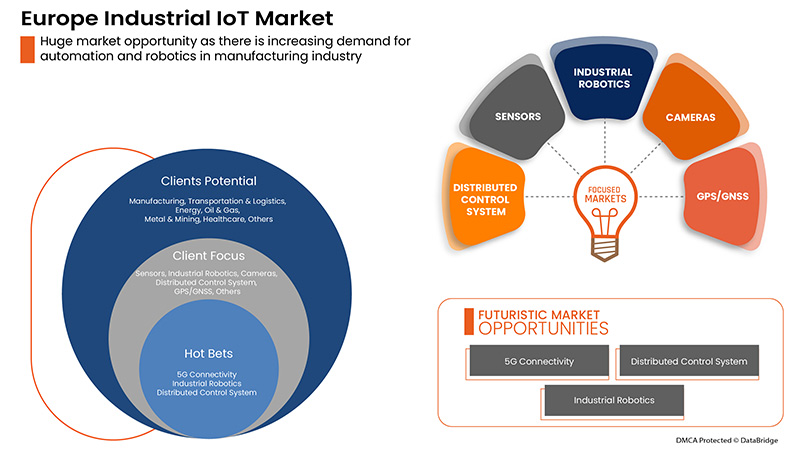
The industrial IoT market is segmented based on technology, application, connectivity, and end use. The growth amongst these segments will help you analyze meager growth segments in the industries and provide the users with a valuable market overview and market insights to help them make strategic decisions for identifying core market applications.
By Technology
- Sensors
- Industrial Robotics
- Cameras
- Distributed Control System
- GPS/GNSS
- Networking Technology
- RFID
- Interface Board
- Condition Monitoring
- Yield Monitoring
- Smart Meters
- Smart Beacon
- Flow & Application Control Device
- Guidance & Steering
- Electronic Shelf Label
On the basis of technology, the Europe industrial IoT market is segmented into sensors, industrial robotics, cameras, distributed control system, GPS/GNSS, networking technology, RFID, interface board, condition monitoring, yield monitoring, smart meters, smart beacon, flow & application control device, guidance & steering, and electronic shelf label.
By Application
- SCADA
- MES
- PLM
- Distribution Management System
- Transit Management System
- Outage Management System
- Visualization Software
- Remote Patient Monitoring
- Retail Management Software
- Farm Management System
- Others
On the basis of application, the Europe industrial IoT market has been segmented into SCADA, MES, PLM, distribution management system, transit management system, outage management system, visualization software, remote patient monitoring, retail management software, farm management system, and others.
By Connectivity
- Wired
- Wireless
- Hybrid
On the basis of connectivity, the Europe industrial IoT market has been segmented into wired, wireless, and hybrid.
By End-Use
- Manufacturing
- Transportation & Logistics
- Energy
- Oil & Gas
- Metal & Mining
- Healthcare
- Retail
- Agriculture
- Others
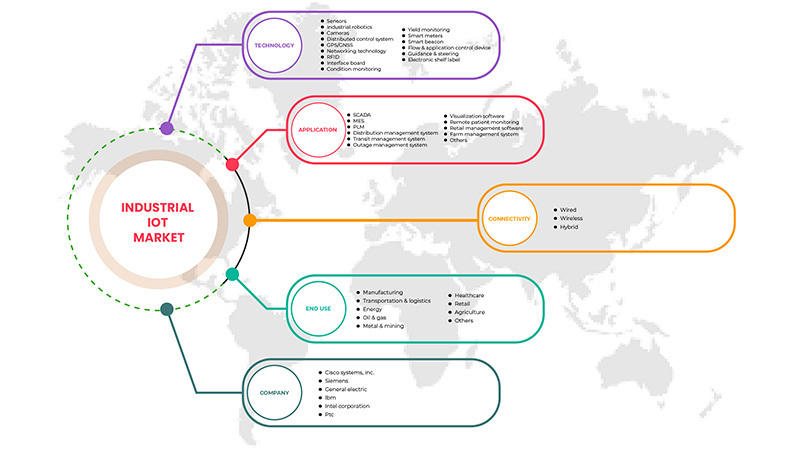
On the basis of End-Use, the Europe industrial IoT market has been segmented into manufacturing, transportation & logistics, energy, oil & gas, metal & mining, healthcare, retail, agriculture, and others.
Industrial IoT Market Regional Analysis/Insights
The industrial IoT market is analyzed, and market size insights and trends are provided by technology, application, connectivity, and end-use, as referenced above.
The countries covered in the industrial IoT market report are Germany, France, Italy, U.K., Turkey, Switzerland, Spain, Russia, Netherlands, Belgium, and the rest of Europe.
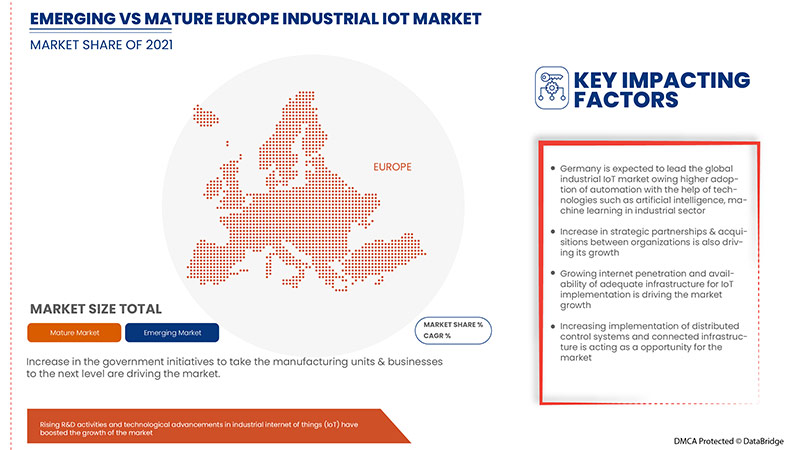
Germany dominates the Europe industrial IoT market. Germany is likely to be the fastest-growing industrial IoT market. Germany develops cloud-based solutions and services to improve security and contribute new levels of operational intelligence for governments, enterprises, transport, and communities. This will boost the demand for industrial IoT products in the Europe region.
The country section of the report also provides individual market-impacting factors and market regulation changes that impact the market's current and future trends. Data points like downstream and upstream value chain analysis, technical trends, porter's five forces analysis, and case studies are some of the pointers used to forecast the market scenario for individual countries. Also, the presence and availability of Europe brands and their challenges faced due to large or scarce competition from local and domestic brands, the impact of domestic tariffs, and trade routes are considered while providing a forecast analysis of the country data.
Competitive Landscape and Industrial IoT Market Share Analysis
The industrial IoT market competitive landscape provides details about the competitor. Components included are company overview, company financials, revenue generated, market potential, investment in research and development, new market initiatives, Europe presence, production sites and facilities, production capacities, company strengths and weaknesses, product launch, product width and breadth, and application dominance. The above data points provided are only related to the companies' focus related Inter to the industrial IoT market.
Some of the major players operating in the industrial IoT market are:
- Cisco Systems, Inc.
- Siemens
- General Electric
- IBM Corporation
- Intel Corporation
- PTC
- Honeywell International Inc.
- NEC Corporation
- Rockwell Automation, Inc.
- ABB
- SAP SE
- Texas Instruments Incorporated
- Robert Bosch GmbH
- Emerson Electric Co.
- Microsoft
- KUKA AG
- Sigfox Partner Network (a subsidiary of UnaBiz)
- Wipro
- Arm Limited (a subsidiary of Softbank Group Corp.)
- Huawei Technologies Co., Ltd.
SKU-
Obtenha acesso online ao relatório sobre a primeira nuvem de inteligência de mercado do mundo

- Painel interativo de análise de dados
- Painel de análise da empresa para oportunidades de elevado potencial de crescimento
- Acesso de analista de pesquisa para personalização e customização. consultas
- Análise da concorrência com painel interativo
- Últimas notícias, atualizações e atualizações Análise de tendências
- Aproveite o poder da análise de benchmark para um rastreio abrangente da concorrência
Índice
1 INTRODUÇÃO
1.1 OBJETIVOS DO ESTUDO
1.2 DEFINIÇÃO DE MERCADO
1.3 VISÃO GERAL DO MERCADO INDUSTRIAL DE IOT DA EUROPA
1.4 MOEDA E PREÇOS
1.5 LIMITAÇÕES
1.6 MERCADOS COBERTOS
2 SEGMENTAÇÃO DE MERCADO
2.1 MERCADOS COBERTOS
2.2 ÂMBITO GEOGRÁFICO
2,3 ANOS CONSIDERADOS PARA O ESTUDO
2.4 MODELO DE VALIDAÇÃO DE DADOS TRIPÉ DBMR
2.5 ENTREVISTAS PRINCIPAIS COM PRINCIPAIS LÍDERES DE OPINIÃO
2.6 GRADE DE POSIÇÃO DE MERCADO DBMR
2.7 ANÁLISE DA PARTICIPAÇÃO DO FORNECEDOR
2.8 MODELAGEM MULTIVARIADA
2.9 CURVA DO TEMPO DA TECNOLOGIA
2.1 GRADE DE COBERTURA DE USO FINAL DO MERCADO
2.11 FONTES SECUNDÁRIAS
2.12 PREMISSAS
3 RESUMO EXECUTIVO
4 INSIGHTS PREMIUM
4.1 ANÁLISE DE CASO DE USO
4.1.1 VISÃO GERAL
4.1.2 MANUTENÇÃO PREDITIVA
4.1.3 RASTREAMENTO DE LOCALIZAÇÃO
4.1.4 ANÁLISE DO LOCAL DE TRABALHO
4.1.5 MONITORAMENTO REMOTO DA QUALIDADE
4.1.6 OTIMIZAÇÃO DE ENERGIA
5 VISÃO GERAL DO MERCADO
5.1 MOTORISTAS
5.1.1 AUMENTO DA ADOÇÃO DE INTELIGÊNCIA ARTIFICIAL (IA) E APRENDIZAGEM DE MÁQUINA (AM) NA INDÚSTRIA DO USUÁRIO FINAL
5.1.2 AUMENTO NA IMPLEMENTAÇÃO DE SENSORES E SISTEMAS DE CONTROLE DISTRIBUÍDOS NAS OPERAÇÕES COMERCIAIS
5.1.3 AUMENTO DA NECESSIDADE DE SOLUÇÕES E SERVIÇOS DE DADOS EM TEMPO REAL
5.1.4 AUMENTO DA PENETRAÇÃO DA INDÚSTRIA 4.0 NAS INDÚSTRIAS AUTOMOTIVA E DE MANUFATURA
5.2 RESTRIÇÕES
5.2.1 FALTA DE MÃO DE OBRA QUALIFICADA E DE FORMAÇÃO
5.2.2 MAIOR PROBABILIDADE DE ROUBO DE DISPOSITIVOS E VIOLAÇÃO DE DADOS
5.2.3 AUMENTO DAS COMPLEXIDADES TÉCNICAS DEVIDO AO AVANÇO TECNOLÓGICO DIÁRIO
5.3 OPORTUNIDADES
5.3.1 AUMENTO DA PENETRAÇÃO DA INTERNET EM TODO O MUNDO
5.3.2 AUMENTO DA TENDÊNCIA DE DIGITALIZAÇÃO
5.3.3 PROGRESSÃO NAS TECNOLOGIAS INTELIGENTES
5.3.4 ALTA ADOÇÃO DO MODELO DE IMPLANTAÇÃO BASEADO EM NUVEM
5.4 DESAFIOS
5.4.1 ALTO CUSTO DE INSTALAÇÃO
5.4.2 DIFICULDADES NA INTEGRAÇÃO DE DISPOSITIVOS IOT
6 MERCADO INDUSTRIAL DE IOT DA EUROPA, POR TECNOLOGIA
6.1 VISÃO GERAL
6.2 SENSORES
6.3 ROBÓTICA INDUSTRIAL
6.4 CÂMERAS
6.5 SISTEMA DE CONTROLE DISTRIBUÍDO
6.6 GPS/GNSS
6.7 TECNOLOGIA DE REDE
6.8 RFID
6.9 PLACA DE INTERFACE
6.1 MONITORAMENTO DE CONDIÇÕES
6.11 MONITORAMENTO DE RENDIMENTO
6.12 MEDIDORES INTELIGENTES
6.13 SINALIZADOR INTELIGENTE
6.14 DISPOSITIVO DE CONTROLE DE FLUXO E APLICAÇÃO
6.15 ORIENTAÇÃO E DIREÇÃO
6.16 ETIQUETA ELETRÔNICA DE PRATELEIRA
7 MERCADO INDUSTRIAL DE IOT DA EUROPA, POR APLICAÇÃO
7.1 VISÃO GERAL
7.2 SCADA
7.3 MES
7.4 PLM
7.5 SISTEMA DE CONTROLE DISTRIBUÍDO
7.6 SISTEMA DE GESTÃO DE TRÂNSITO
7.7 SISTEMA DE GERENCIAMENTO DE INTERRUPÇÕES
7.8 SOFTWARE DE VISUALIZAÇÃO
7.9 MONITORAMENTO REMOTO DE PACIENTES
7.1 SOFTWARE DE GESTÃO DE VAREJO
7.11 SISTEMA DE GERENCIAMENTO DA FAZENDA
7.12 OUTROS
8 MERCADO INDUSTRIAL DE IOT DA EUROPA, POR CONECTIVIDADE
8.1 VISÃO GERAL
8.2 COM FIO
8.3 SEM FIO
8.4 HÍBRIDO
9 MERCADO INDUSTRIAL DE IOT DA EUROPA, POR USO FINAL
9.1 VISÃO GERAL
9.2 FABRICAÇÃO
9.3 TRANSPORTE E LOGÍSTICA
9.4 ENERGIA
9.5 PETRÓLEO E GÁS
9.6 METAL E MINERAÇÃO
9.7 SAÚDE
9.8 VAREJO
9.9 AGRICULTURA
9.1 OUTROS
10 MERCADO INDUSTRIAL DE IOT DA EUROPA, POR REGIÃO
10.1 EUROPA
10.1.1 ALEMANHA
10.1.2 Reino Unido
10.1.3 FRANÇA
10.1.4 ITÁLIA
10.1.5 ESPANHA
10.1.6 SUÍÇA
10.1.7 HOLANDA
10.1.8 TURQUIA
10.1.9 RÚSSIA
10.1.10 BÉLGICA
10.1.11 RESTO DA EUROPA
11 MERCADO INDUSTRIAL DE IOT DA EUROPA, CENÁRIO DA EMPRESA
11.1 ANÁLISE DE AÇÕES DA EMPRESA: EUROPA
12 ANÁLISE SWOT
13 PERFIL DA EMPRESA
13.1 CISCO SYSTEMS, INC.
13.1.1 RESUMO DA EMPRESA
13.1.2 ANÁLISE DE RECEITA
13.1.3 ANÁLISE DAS AÇÕES DA EMPRESA
13.1.4 PORTFÓLIO DE PRODUTOS
13.1.5 DESENVOLVIMENTOS RECENTES
13.2 SIEMENS
13.2.1 RESUMO DA EMPRESA
13.2.2 ANÁLISE DE RECEITA
13.2.3 ANÁLISE DAS AÇÕES DA EMPRESA
13.2.4 PORTFÓLIO DE PRODUTOS
13.2.5 DESENVOLVIMENTOS RECENTES
13.3 ELÉTRICA GERAL
13.3.1 RESUMO DA EMPRESA
13.3.2 ANÁLISE DE RECEITA
13.3.3 ANÁLISE DE AÇÕES DA EMPRESA
13.3.4 PORTFÓLIO DE PRODUTOS
13.3.5 DESENVOLVIMENTOS RECENTES
13.4 IBM CORPORAÇÃO
13.4.1 RESUMO DA EMPRESA
13.4.2 ANÁLISE DE RECEITA
13.4.3 ANÁLISE DAS AÇÕES DA EMPRESA
13.4.4 PORTFÓLIO DE PRODUTOS
13.4.5 DESENVOLVIMENTOS RECENTES
13.5 CORPORAÇÃO INTEL
13.5.1 RESUMO DA EMPRESA
13.5.2 ANÁLISE DE RECEITA
13.5.3 ANÁLISE DAS AÇÕES DA EMPRESA
13.5.4 PORTFÓLIO DE PRODUTOS
13.5.5 DESENVOLVIMENTOS RECENTES
13,6 ABB
13.6.1 RESUMO DA EMPRESA
13.6.2 ANÁLISE DE RECEITA
13.6.3 PORTFÓLIO DE PRODUTOS
13.6.4 DESENVOLVIMENTO RECENTE
13.7 ARM LIMITED (UMA SUBSIDIÁRIA DO GRUPO SOFTBANK)
13.7.1 RESUMO DA EMPRESA
13.7.2 ANÁLISE DE RECEITA
13.7.3 PORTFÓLIO DE PRODUTOS
13.7.4 DESENVOLVIMENTOS RECENTES
13.8 EMERSON ELECTRIC CO.
13.8.1 RESUMO DA EMPRESA
13.8.2 ANÁLISE DE RECEITA
13.8.3 PORTFÓLIO DE PRODUTOS
13.8.4 DESENVOLVIMENTOS RECENTES
13.9 HONEYWELL INTERNATIONAL INC.
13.9.1 RESUMO DA EMPRESA
13.9.2 ANÁLISE DE RECEITA
13.9.3 PORTFÓLIO DE PRODUTOS
13.9.4 DESENVOLVIMENTOS RECENTES
13.1 HUAWEI TECHNOLOGIES CO., LTD.
13.10.1 RESUMO DA EMPRESA
13.10.2 PORTFÓLIO DE PRODUTOS
13.10.3 DESENVOLVIMENTOS RECENTES
13.11 KUKA AG
13.11.1 RESUMO DA EMPRESA
13.11.2 ANÁLISE DE RECEITA
13.11.3 PORTFÓLIO DE PRODUTOS
13.11.4 DESENVOLVIMENTOS RECENTES
13.12 MICROSOFT
13.12.1 RESUMO DA EMPRESA
13.12.2 ANÁLISE DE RECEITA
13.12.3 PORTFÓLIO DE PRODUTOS
13.12.4 DESENVOLVIMENTOS RECENTES
13.13 CORPORAÇÃO NEC
13.13.1 RESUMO DA EMPRESA
13.13.2 ANÁLISE DE RECEITA
13.13.3 PORTFÓLIO DE PRODUTOS
13.13.4 DESENVOLVIMENTOS RECENTES
13.14 PTC
13.14.1 RESUMO DA EMPRESA
13.14.2 ANÁLISE DE RECEITA
13.14.3 PORTFÓLIO DE PRODUTOS
13.14.4 DESENVOLVIMENTOS RECENTES
13h15 ROBERT BOSCH GMBH
13.15.1 RESUMO DA EMPRESA
13.15.2 ANÁLISE DE RECEITA
13.15.3 PORTFÓLIO DE PRODUTOS
13.15.4 DESENVOLVIMENTOS RECENTES
13.16 ROCKWELL AUTOMATION, INC.
13.16.1 RESUMO DA EMPRESA
13.16.2 ANÁLISE DE RECEITA
13.16.3 PORTFÓLIO DE PRODUTOS
13.16.4 DESENVOLVIMENTOS RECENTES
13.17 SAP SE
13.17.1 RESUMO DA EMPRESA
13.17.2 ANÁLISE DE RECEITA
13.17.3 PORTFÓLIO DE PRODUTOS
13.17.4 DESENVOLVIMENTOS RECENTES
13.18 REDE DE PARCEIROS SIGFOX
13.18.1 RESUMO DA EMPRESA
13.18.2 PORTFÓLIO DE PRODUTOS
13.18.3 DESENVOLVIMENTOS RECENTES
13.19 TEXAS INSTRUMENTS INCORPORATED
13.19.1 RESUMO DA EMPRESA
13.19.2 ANÁLISE DE RECEITA
13.19.3 PORTFÓLIO DE PRODUTOS
13.19.4 DESENVOLVIMENTOS RECENTES
13.2 WIPRO
13.20.1 RESUMO DA EMPRESA
13.20.2 ANÁLISE DE RECEITA
13.20.3 PORTFÓLIO DE PRODUTOS
13.20.4 DESENVOLVIMENTOS RECENTES
14 QUESTIONÁRIO
15 RELATÓRIOS RELACIONADOS
Lista de Tabela
TABELA 1 MERCADO INDUSTRIAL DE IOT NA EUROPA, POR TECNOLOGIA, 2020-2029 (US$ MILHÕES)
TABELA 2 SENSORES EUROPEUS NO MERCADO INDUSTRIAL DE IOT, POR REGIÃO, 2020-2029 (US$ MILHÕES)
TABELA 3 ROBÓTICA INDUSTRIAL EUROPEIA NO MERCADO DE IOT INDUSTRIAL, POR REGIÃO, 2020-2029 (US$ MILHÕES)
TABELA 4 CÂMERAS EUROPEIAS NO MERCADO INDUSTRIAL DE IOT, POR REGIÃO, 2020-2029 (US$ MILHÕES)
TABELA 5 SISTEMA DE CONTROLE DISTRIBUÍDO NA EUROPA NO MERCADO INDUSTRIAL DE IOT, POR REGIÃO, 2020-2029 (US$ MILHÕES)
TABELA 6 GPS/GNSS NA EUROPA NO MERCADO INDUSTRIAL DE IOT, POR REGIÃO, 2020-2029 (US$ MILHÕES)
TABELA 7 TECNOLOGIA DE REDE EUROPEIA NO MERCADO INDUSTRIAL DE IOT, POR REGIÃO, 2020-2029 (US$ MILHÕES)
TABELA 8 EUROPA RFID NO MERCADO INDUSTRIAL DE IOT, POR REGIÃO, 2020-2029 (US$ MILHÕES)
TABELA 9 PLACA DE INTERFACE EUROPEIA NO MERCADO INDUSTRIAL DE IOT, POR REGIÃO, 2020-2029 (US$ MILHÕES)
TABELA 10 MONITORAMENTO DAS CONDIÇÕES DO MERCADO INDUSTRIAL DE IOT NA EUROPA, POR REGIÃO, 2020-2029 (MILHÕES DE USD)
TABELA 11 MONITORAMENTO DE RENDIMENTO NA EUROPA NO MERCADO INDUSTRIAL DE IOT, POR REGIÃO, 2020-2029 (US$ MILHÕES)
TABELA 12 MEDIDORES INTELIGENTES DA EUROPA NO MERCADO INDUSTRIAL DE IOT, POR REGIÃO, 2020-2029 (US$ MILHÕES)
TABELA 13 SMART BEACONS DA EUROPA NO MERCADO INDUSTRIAL DE IOT, POR REGIÃO, 2020-2029 (US$ MILHÕES)
TABELA 14 DISPOSITIVOS DE CONTROLE DE FLUXO E APLICAÇÃO NA EUROPA NO MERCADO INDUSTRIAL DE IOT, POR REGIÃO, 2020-2029 (US$ MILHÕES)
TABELA 15 ORIENTAÇÃO E DIREÇÃO NA EUROPA NO MERCADO INDUSTRIAL DE IOT, POR REGIÃO, 2020-2029 (US$ MILHÕES)
TABELA 16 ETIQUETA ELETRÔNICA DE PRATELEIRA NA EUROPA NO MERCADO INDUSTRIAL DE IOT, POR REGIÃO, 2020-2029 (US$ MILHÕES)
TABELA 17 MERCADO INDUSTRIAL DE IOT NA EUROPA, POR APLICAÇÃO, 2020-2029 (MILHÕES DE USD)
TABELA 18 SCADA EUROPA NO MERCADO INDUSTRIAL DE IOT, POR REGIÃO, 2020-2029 (US$ MILHÕES)
TABELA 19 MES DA EUROPA NO MERCADO INDUSTRIAL DE IOT, POR REGIÃO, 2020-2029 (US$ MILHÕES)
TABELA 20 PLM DA EUROPA NO MERCADO INDUSTRIAL DE IOT, POR REGIÃO, 2020-2029 (US$ MILHÕES)
TABELA 21 SISTEMA DE CONTROLE DISTRIBUÍDO NA EUROPA NO MERCADO INDUSTRIAL DE IOT, POR REGIÃO, 2020-2029 (US$ MILHÕES)
TABELA 22 SISTEMA DE GESTÃO DE TRÂNSITO DA EUROPA NO MERCADO INDUSTRIAL DE IOT, POR REGIÃO, 2020-2029 (US$ MILHÕES)
TABELA 23 SISTEMA DE GERENCIAMENTO DE INTERRUPÇÕES NA EUROPA NO MERCADO INDUSTRIAL DE IOT, POR REGIÃO, 2020-2029 (US$ MILHÕES)
TABELA 24 SOFTWARES DE VISUALIZAÇÃO NA EUROPA NO MERCADO INDUSTRIAL DE IOT, POR REGIÃO, 2020-2029 (US$ MILHÕES)
TABELA 25 MONITORAMENTO REMOTO DE PACIENTES NA EUROPA NO MERCADO INDUSTRIAL DE IOT, POR REGIÃO, 2020-2029 (US$ MILHÕES)
TABELA 26 SOFTWARE DE GESTÃO DE VAREJO NA EUROPA NO MERCADO DE IOT INDUSTRIAL, POR REGIÃO, 2020-2029 (US$ MILHÕES)
TABELA 27 SISTEMA DE GESTÃO AGRÍCOLA EUROPEU NO MERCADO DE IOT INDUSTRIAL, POR REGIÃO, 2020-2029 (US$ MILHÕES)
TABELA 28 OUTROS INDUSTRIAIS NO MERCADO DE IOT INDUSTRIAL DA EUROPA, POR REGIÃO, 2020-2029 (US$ MILHÕES)
TABELA 29 MERCADO INDUSTRIAL DE IOT NA EUROPA, POR CONECTIVIDADE, 2020-2029 (MILHÕES DE USD)
TABELA 30 EUROPA CONECTADA NO MERCADO INDUSTRIAL DE IOT, POR REGIÃO, 2020-2029 (US$ MILHÕES)
TABELA 31: MERCADO DE IOT INDUSTRIAL SEM FIO NA EUROPA, POR REGIÃO, 2020-2029 (US$ MILHÕES)
TABELA 32 HÍBRIDO NA EUROPA NO MERCADO INDUSTRIAL DE IOT, POR REGIÃO, 2020-2029 (US$ MILHÕES)
TABELA 33 MERCADO INDUSTRIAL DE IOT NA EUROPA, POR USO FINAL, 2020-2029 (MILHÕES DE USD)
TABELA 34: MERCADO DE MANUFATURA INDUSTRIAL DE IOT NA EUROPA, POR REGIÃO, 2020-2029 (MILHÕES DE DÓLARES)
TABELA 35 TRANSPORTE E LOGÍSTICA NA EUROPA NO MERCADO INDUSTRIAL DE IOT, POR REGIÃO, 2020-2029 (US$ MILHÕES)
TABELA 36 ENERGIA EUROPEIA NO MERCADO INDUSTRIAL DE IOT, POR REGIÃO, 2020-2029 (US$ MILHÕES)
TABELA 37: PETRÓLEO E GÁS NA EUROPA NO MERCADO INDUSTRIAL DE IOT, POR REGIÃO, 2020-2029 (MILHÕES DE DÓLARES)
TABELA 38 METAL E MINERAÇÃO NA EUROPA NO MERCADO INDUSTRIAL DE IOT, POR REGIÃO, 2020-2029 (US$ MILHÕES)
TABELA 39 SAÚDE NA EUROPA NO MERCADO INDUSTRIAL DE IOT, POR REGIÃO, 2020-2029 (US$ MILHÕES)
TABELA 40 VAREJO EUROPEU NO MERCADO INDUSTRIAL DE IOT, POR REGIÃO, 2020-2029 (US$ MILHÕES)
TABELA 41 AGRICULTURA EUROPEIA NO MERCADO INDUSTRIAL DE IOT, POR REGIÃO, 2020-2029 (US$ MILHÕES)
TABELA 42 OUTROS INDUSTRIAIS NO MERCADO DE IOT INDUSTRIAL DA EUROPA, POR REGIÃO, 2020-2029 (US$ MILHÕES)
TABELA 43 MERCADO INDUSTRIAL DE IOT NA EUROPA, POR PAÍS, 2020-2029 (MILHÕES DE DÓLARES)
TABELA 44 MERCADO INDUSTRIAL DE IOT NA EUROPA, POR TECNOLOGIA, 2020-2029 (US$ MILHÕES)
TABELA 45 MERCADO INDUSTRIAL DE IOT NA EUROPA, POR APLICAÇÃO, 2020-2029 (MILHÕES DE USD)
TABELA 46 MERCADO INDUSTRIAL DE IOT NA EUROPA, POR CONECTIVIDADE, 2020-2029 (MILHÕES DE USD)
TABELA 47 MERCADO INDUSTRIAL DE IOT NA EUROPA, POR USO FINAL, 2020-2029 (MILHÕES DE USD)
TABELA 48 MERCADO INDUSTRIAL DE IOT DA ALEMANHA, POR TECNOLOGIA, 2020-2029 (US$ MILHÕES)
TABELA 49 MERCADO INDUSTRIAL DE IOT DA ALEMANHA, POR APLICAÇÃO, 2020-2029 (US$ MILHÕES)
TABELA 50 MERCADO INDUSTRIAL DE IOT DA ALEMANHA, POR CONECTIVIDADE, 2020-2029 (US$ MILHÕES)
TABELA 51 MERCADO INDUSTRIAL DE IOT DA ALEMANHA, POR USO FINAL, 2020-2029 (US$ MILHÕES)
TABELA 52 MERCADO INDUSTRIAL DE IOT DO REINO UNIDO, POR TECNOLOGIA, 2020-2029 (US$ MILHÕES)
TABELA 53 MERCADO INDUSTRIAL DE IOT DO REINO UNIDO, POR APLICAÇÃO, 2020-2029 (MILHÕES DE DÓLARES)
TABELA 54 MERCADO INDUSTRIAL DE IOT DO REINO UNIDO, POR CONECTIVIDADE, 2020-2029 (US$ MILHÕES)
TABELA 55 MERCADO INDUSTRIAL DE IOT DO REINO UNIDO, POR USO FINAL, 2020-2029 (MILHÕES DE DÓLARES)
TABELA 56 MERCADO INDUSTRIAL DE IOT NA FRANÇA, POR TECNOLOGIA, 2020-2029 (US$ MILHÕES)
TABELA 57 MERCADO INDUSTRIAL DE IOT NA FRANÇA, POR APLICAÇÃO, 2020-2029 (MILHÕES DE DÓLARES)
TABELA 58 MERCADO INDUSTRIAL DE IOT NA FRANÇA, POR CONECTIVIDADE, 2020-2029 (US$ MILHÕES)
TABELA 59 MERCADO INDUSTRIAL DE IOT NA FRANÇA, POR USO FINAL, 2020-2029 (US$ MILHÕES)
TABELA 60 MERCADO INDUSTRIAL DE IOT DA ITÁLIA, POR TECNOLOGIA, 2020-2029 (US$ MILHÕES)
TABELA 61 MERCADO INDUSTRIAL DE IOT NA ITÁLIA, POR APLICAÇÃO, 2020-2029 (US$ MILHÕES)
TABELA 62 MERCADO INDUSTRIAL DE IOT DA ITÁLIA, POR CONECTIVIDADE, 2020-2029 (US$ MILHÕES)
TABELA 63 MERCADO INDUSTRIAL DE IOT DA ITÁLIA, POR USO FINAL, 2020-2029 (US$ MILHÕES)
TABELA 64 MERCADO INDUSTRIAL DE IOT DA ESPANHA, POR TECNOLOGIA, 2020-2029 (US$ MILHÕES)
TABELA 65 MERCADO INDUSTRIAL DE IOT DA ESPANHA, POR APLICAÇÃO, 2020-2029 (US$ MILHÕES)
TABELA 66 MERCADO INDUSTRIAL DE IOT DA ESPANHA, POR CONECTIVIDADE, 2020-2029 (US$ MILHÕES)
TABELA 67 MERCADO INDUSTRIAL DE IOT DA ESPANHA, POR USO FINAL, 2020-2029 (US$ MILHÕES)
TABELA 68 MERCADO INDUSTRIAL DE IOT NA SUÍÇA, POR TECNOLOGIA, 2020-2029 (US$ MILHÕES)
TABELA 69 MERCADO INDUSTRIAL DE IOT DA SUÍÇA, POR APLICAÇÃO, 2020-2029 (US$ MILHÕES)
TABELA 70 MERCADO INDUSTRIAL DE IOT NA SUÍÇA, POR CONECTIVIDADE, 2020-2029 (US$ MILHÕES)
TABELA 71 MERCADO INDUSTRIAL DE IOT NA SUÍÇA, POR USO FINAL, 2020-2029 (US$ MILHÕES)
TABELA 72 MERCADO INDUSTRIAL DE IOT DA HOLANDA, POR TECNOLOGIA, 2020-2029 (US$ MILHÕES)
TABELA 73 MERCADO INDUSTRIAL DE IOT DA HOLANDA, POR APLICAÇÃO, 2020-2029 (US$ MILHÕES)
TABELA 74 MERCADO INDUSTRIAL DE IOT DA HOLANDA, POR CONECTIVIDADE, 2020-2029 (US$ MILHÕES)
TABELA 75 MERCADO INDUSTRIAL DE IOT DA HOLANDA, POR USO FINAL, 2020-2029 (US$ MILHÕES)
TABELA 76 MERCADO INDUSTRIAL DE IOT DA TURQUIA, POR TECNOLOGIA, 2020-2029 (US$ MILHÕES)
TABELA 77 MERCADO INDUSTRIAL DE IOT DA TURQUIA, POR APLICAÇÃO, 2020-2029 (US$ MILHÕES)
TABELA 78 MERCADO INDUSTRIAL DE IOT DA TURQUIA, POR CONECTIVIDADE, 2020-2029 (US$ MILHÕES)
TABELA 79 MERCADO INDUSTRIAL DE IOT DA TURQUIA, POR USO FINAL, 2020-2029 (US$ MILHÕES)
TABELA 80 MERCADO INDUSTRIAL DE IOT DA RÚSSIA, POR TECNOLOGIA, 2020-2029 (US$ MILHÕES)
TABELA 81 MERCADO INDUSTRIAL DE IOT DA RÚSSIA, POR APLICAÇÃO, 2020-2029 (US$ MILHÕES)
TABELA 82 MERCADO INDUSTRIAL DE IOT DA RÚSSIA, POR CONECTIVIDADE, 2020-2029 (US$ MILHÕES)
TABELA 83 MERCADO INDUSTRIAL DE IOT DA RÚSSIA, POR USO FINAL, 2020-2029 (US$ MILHÕES)
TABELA 84 MERCADO INDUSTRIAL DE IOT DA BÉLGICA, POR TECNOLOGIA, 2020-2029 (US$ MILHÕES)
TABELA 85 MERCADO INDUSTRIAL DE IOT DA BÉLGICA, POR APLICAÇÃO, 2020-2029 (US$ MILHÕES)
TABELA 86 MERCADO INDUSTRIAL DE IOT DA BÉLGICA, POR CONECTIVIDADE, 2020-2029 (US$ MILHÕES)
TABELA 87 MERCADO INDUSTRIAL DE IOT DA BÉLGICA, POR USO FINAL, 2020-2029 (US$ MILHÕES)
TABELA 88 MERCADO INDUSTRIAL DE IOT NO RESTO DA EUROPA, POR TECNOLOGIA, 2020-2029 (US$ MILHÕES)
Lista de Figura
FIGURA 1 MERCADO INDUSTRIAL DE IOT DA EUROPA: SEGMENTAÇÃO
FIGURA 2 MERCADO INDUSTRIAL DE IOT DA EUROPA: TRIANGULAÇÃO DE DADOS
FIGURA 3 MERCADO INDUSTRIAL DE IOT DA EUROPA: ANÁLISE DROC
FIGURA 4 MERCADO INDUSTRIAL DE IOT NA EUROPA: ANÁLISE DE MERCADO EUROPEU VS MERCADO REGIONAL
FIGURA 5 MERCADO INDUSTRIAL DE IOT NA EUROPA: ANÁLISE DE PESQUISA DA EMPRESA
FIGURA 6 MERCADO INDUSTRIAL DE IOT DA EUROPA: DEMOGRAFIA DA ENTREVISTA
FIGURA 7 MERCADO INDUSTRIAL DE IOT DA EUROPA: GRADE DE POSIÇÃO DE MERCADO DE DBMR
FIGURA 8 MERCADO INDUSTRIAL DE IOT DA EUROPA: ANÁLISE DA PARTICIPAÇÃO DE FORNECEDORES
FIGURA 9 MERCADO INDUSTRIAL DE IOT DA EUROPA: GRADE DE COBERTURA DE USO FINAL DO MERCADO
FIGURA 10 MERCADO INDUSTRIAL DE IOT DA EUROPA: SEGMENTAÇÃO
FIGURA 11 O AUMENTO NA ADOÇÃO DE INTELIGÊNCIA ARTIFICIAL (IA) E APRENDIZADO DE MÁQUINA (AM) NA INDÚSTRIA DO USUÁRIO FINAL DEVE IMPULSIONAR O MERCADO INDUSTRIAL DE IOT NA EUROPA NO PERÍODO PREVISTO DE 2022 A 2029
FIGURA 12 O SEGMENTO SCADA DEVE SER REPRESENTANTE DA MAIOR PARTICIPAÇÃO DO MERCADO INDUSTRIAL DE IOT DA EUROPA EM 2022 E 2029
FIGURA 13 MOTIVADORES, RESTRIÇÕES, OPORTUNIDADES E DESAFIOS DO MERCADO INDUSTRIAL DE IOT NA EUROPA
FIGURA 14 TAXAS DE ADOÇÃO DE IA EM TODO O MUNDO
FIGURA 15 EMPRESAS OBTENDO BENEFÍCIOS DE SOLUÇÕES ANALÍTICAS
FIGURA 16 CRESCIMENTO DE USUÁRIOS DA INTERNET EM TODO O MUNDO
FIGURA 17 TAXA DE DESEMPREGO NA REGIÃO DO ORIENTE MÉDIO E NORTE DA ÁFRICA
FIGURA 18 DESPESAS COM PESQUISA E DESENVOLVIMENTO (% DO PIB)
FIGURA 19 INVESTIMENTO MUNDIAL EM NUVEM, 2019 – 2025
FIGURA 20 MERCADO INDUSTRIAL DE IOT NA EUROPA, POR TECNOLOGIA, 2021
FIGURA 21 MERCADO INDUSTRIAL DE IOT NA EUROPA, POR APLICAÇÃO, 2021
FIGURA 22 MERCADO INDUSTRIAL DE IOT NA EUROPA, POR CONECTIVIDADE, 2021
FIGURA 23 MERCADO INDUSTRIAL DE IOT NA EUROPA, POR USO FINAL, 2021
FIGURA 24 MERCADO INDUSTRIAL DE IOT NA EUROPA: INSTANTÂNEO (2021)
FIGURA 25 MERCADO INDUSTRIAL DE IOT NA EUROPA: POR PAÍS (2021)
FIGURA 26 MERCADO INDUSTRIAL DE IOT NA EUROPA: POR PAÍS (2022 E 2029)
FIGURA 27 MERCADO INDUSTRIAL DE IOT NA EUROPA: POR PAÍS (2021 E 2029)
FIGURA 28 MERCADO INDUSTRIAL DE IOT NA EUROPA: POR TECNOLOGIA (2022 E 2029)
FIGURA 29 MERCADO INDUSTRIAL DE IOT DA EUROPA: PARTICIPAÇÃO DA EMPRESA EM 2021 (%)
Metodologia de Investigação
A recolha de dados e a análise do ano base são feitas através de módulos de recolha de dados com amostras grandes. A etapa inclui a obtenção de informações de mercado ou dados relacionados através de diversas fontes e estratégias. Inclui examinar e planear antecipadamente todos os dados adquiridos no passado. Da mesma forma, envolve o exame de inconsistências de informação observadas em diferentes fontes de informação. Os dados de mercado são analisados e estimados utilizando modelos estatísticos e coerentes de mercado. Além disso, a análise da quota de mercado e a análise das principais tendências são os principais fatores de sucesso no relatório de mercado. Para saber mais, solicite uma chamada de analista ou abra a sua consulta.
A principal metodologia de investigação utilizada pela equipa de investigação do DBMR é a triangulação de dados que envolve a mineração de dados, a análise do impacto das variáveis de dados no mercado e a validação primária (especialista do setor). Os modelos de dados incluem grelha de posicionamento de fornecedores, análise da linha de tempo do mercado, visão geral e guia de mercado, grelha de posicionamento da empresa, análise de patentes, análise de preços, análise da quota de mercado da empresa, normas de medição, análise global versus regional e de participação dos fornecedores. Para saber mais sobre a metodologia de investigação, faça uma consulta para falar com os nossos especialistas do setor.
Personalização disponível
A Data Bridge Market Research é líder em investigação formativa avançada. Orgulhamo-nos de servir os nossos clientes novos e existentes com dados e análises que correspondem e atendem aos seus objetivos. O relatório pode ser personalizado para incluir análise de tendências de preços de marcas-alvo, compreensão do mercado para países adicionais (solicite a lista de países), dados de resultados de ensaios clínicos, revisão de literatura, mercado remodelado e análise de base de produtos . A análise de mercado dos concorrentes-alvo pode ser analisada desde análises baseadas em tecnologia até estratégias de carteira de mercado. Podemos adicionar quantos concorrentes necessitar de dados no formato e estilo de dados que procura. A nossa equipa de analistas também pode fornecer dados em tabelas dinâmicas de ficheiros Excel em bruto (livro de factos) ou pode ajudá-lo a criar apresentações a partir dos conjuntos de dados disponíveis no relatório.

