Europe Microalgae Market
Tamanho do mercado em biliões de dólares
CAGR :
% 
 USD
228.66 Million
USD
355.48 Million
2022
2030
USD
228.66 Million
USD
355.48 Million
2022
2030
| 2023 –2030 | |
| USD 228.66 Million | |
| USD 355.48 Million | |
| % | |
Europe Microalgae Market, By Type (Chlaspirulina, Chlorella, Haematococcus Pluvialis, Dunaliella Salina, Isochrysis, Phaeodactylum Tricornutum, Chlamydomonas Cruentum, Nannochloropsis And Others), Category (Organic And Inorganic), Form (Powder/Dry And Liquid), Grade (Food Grade, Feed Grade, Fuel Grade, Cosmetic Grade and Others), Application (Food & Beverage, Dietary Supplements, Pharmaceuticals, Cosmetics & Personal Care, Bio-Fuel, Inks, Animal Feed and Others), Distribution Channel (Indirect And Direct) - Industry Trends and Forecast to 2030.
Europe Microalgae Market Analysis and Insights
Microalgae are simple cell structure that needs some requirement for their growth, such as light, water, carbon dioxide and nutrients such as nitrogen and phosphorus. Microalgae growth under these requirements with optimum climatic conditions can be 5-10 times more than conventional crops.
Europe microalgae market is growing tremendously in the North America region due to increased health concerns among consumers and the rising incidence of chronic diseases. The quality of the product of microalgae depends on various factors like algal biomass, specificity of strain and good extraction method. The different forms of microalgae, including blue-green microalgae (BGA), red microalgae and brown microalgae, are used to make useful products enriched with healthy nutrients. Increasing R&D investments in microalgae production and rising demand for an alternative food source due to the increased worldwide population have driven the market's growth. The high cost of extraction of essential components from algal biomass and the adverse impact of climatic variations on microalgae production restrain the market growth.
The Europe microalgae market facing high maintenance and operating costs and technical challenges of large-scale microalgae harvesting are the major challenges for the market's growth in the forecast years.
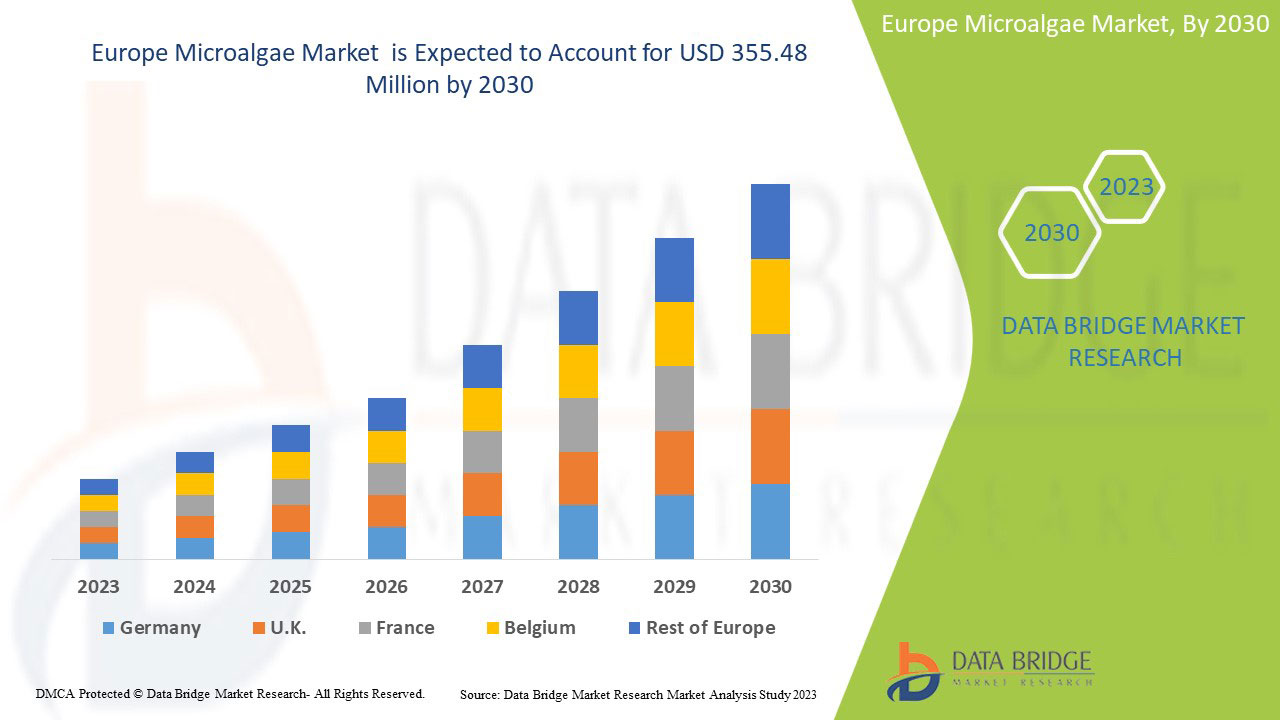
Europe microalgae market is expected to gain market growth in the forecast period of 2023 to 2030. Data Bridge Market Research analyses that the market is growing with a CAGR of 5.8% in the forecast period of 2023 to 2030 and is expected to reach USD 355.48 million by 2030, from USD 228.66 million in 2022.
|
Report Metric |
Details |
|
Forecast Period |
2023 to 2030 |
|
Base Year |
2022 |
|
Historic Years |
2021 (Customisable to 2020-2015) |
|
Quantitative Units |
Revenue in USD Million |
|
Segments Covered |
By Type (Chlaspirulina, Chlorella, Haematococcus Pluvialis, Dunaliella Salina, Isochrysis, Phaeodactylum Tricornutum, Chlamydomonas Cruentum, Nannochloropsis And Others), Category (Organic And Inorganic), Form (Powder/Dry And Liquid), Grade (Food Grade, Feed Grade, Fuel Grade, Cosmetic Grade and Others), Application (Food & Beverage, Dietary Supplements, Pharmaceuticals, Cosmetics & Personal Care, Bio-Fuel, Inks, Animal Feed and Others), Distribution Channel (Indirect and Direct) |
|
Countries Covered |
Germany, U.K., France, Italy, Spain, Netherlands, Russia, Switzerland, Turkey, Belgium and Rest of Europe |
|
Market Players Covered |
Euglena Co. Ltd., DIC CORPORATION, DSM, Cyanotech Corporation, Corbion, Far East Bio-Tec Co., Ltd., Earthrise Nutritionals, LLC, AstaReal Co., Ltd., BUGGYPOWER, Inner Mongolia Rejuve Biotech Co.,Ltd. , Algatech LTD., AlgaEnergy S.A., Parry Nutraceuticals, Heliae Development, LLC, Algarithm, Necton S.A., and Yemoja Ltd. |
Market Definition
Microalgae are microscopic algae which are also called single-celled algae. They can either live independently or in the form of colonies. These are photosynthetic micro-organisms that reside in freshwater or salty water. According to their species, they can vary in size and shape whose size ranges from micrometers to hundred micrometers. The main function of microalgae is they convert sunlight, carbon dioxide and water into algal biomass. Microalgae are used in the food, nutraceuticals, feed and cosmetic industries, as well as it is also used to make paper ink. Microalgae have been considered the most promising in biodiesel feedstock and have been known as a third-generation feedstock. Microalgae are members of the larger group of phytoplankton.
Microalgae Market Dynamics
This section deals with understanding the market drivers, advantages, opportunities, restraints and challenges. All of this is discussed in detail below:
Drivers
-
Rising awareness among consumers about wider health benefits of microalgae products
Microalgae cultivation is done on a large scale to produce high-quality dietary products. Microalgae are exploited for their high protein content, which has fulfilled the unmet diet demand of the growing population. Along with dietary components, microalgae comprises several other bio-active components with anti-oxidative, anti-carcinogenic and anti-hypertensive properties. Microalgae have been utilized for thousands of years due to their high dietary content. As new microalgae-containing products are launching, several market players are adopting initiatives to create awareness among consumers towards their innovative brands. Increasing awareness boosts product sales, which positively impacts the microalgae market growth.
-
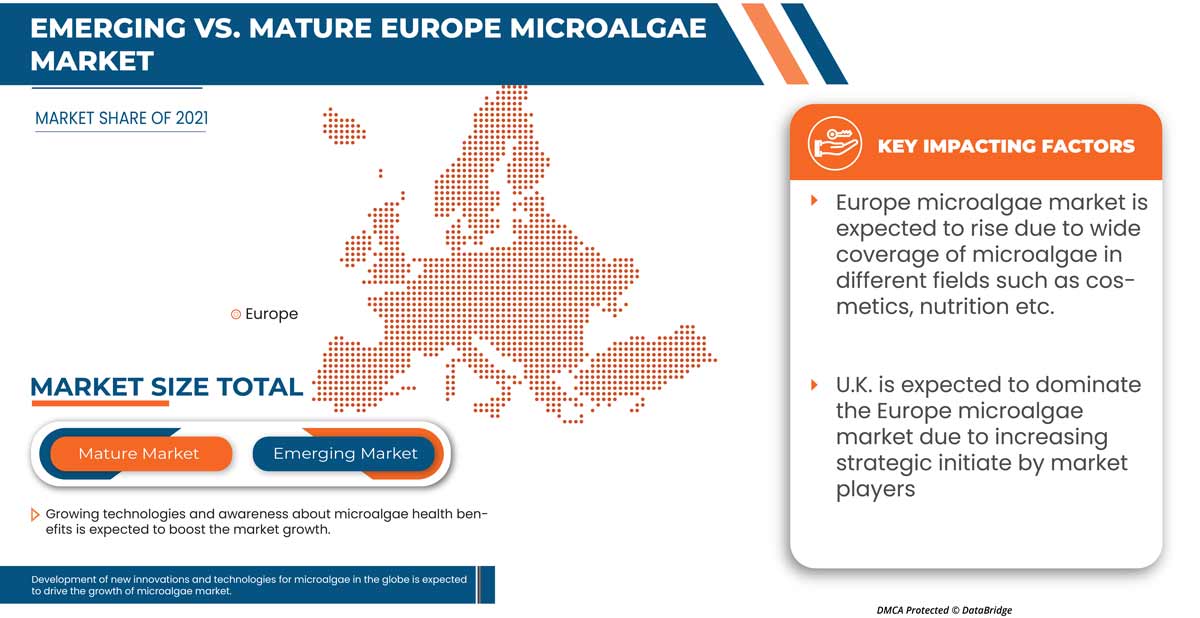
Development of new innovation and technology for microalgae products
Microalgae growth and its content extraction are crucial processes in dilute state cultivation. Microalgae cultivation poses several challenges because of its small size. It becomes quite problematic to grow for economic purpose and to process it into biofuels. The major problems associated with microalgae production are strain selection, strain improvement, inefficient quantity of sunlight present while microalgae culturing in ponds, enhanced need of removal of large water volume to obtain concentrates. These obstacles demand the appropriate technological advancements and scientific innovation for the production of microalgae and its conversion to required products. As the market players are using technologically advanced cultural methods and innovative technologies for the production formation of microalgae, it is boosting the microalgae market growth
Opportunities
-
Increase in the fund for microalgae production
The products derived from microalgae-based technologies are changing almost everything around us. The various transformations in microalgae production enhance the way of eating, introduction of biofuels for the automobile and aviation industry, production of microalgae-derived skincare products and recycling of greenhouse gases. The increased investment in microalgae products is due to their miraculous properties and ability to provide satisfactory products for every major industry. The out-sized impact on the consumer's market and providing sustainable solutions to combat Europe challenges increased investments in advanced microalgae technologies aiding in its production by both the private and public sectors.
-
Rise in the strategic initiatives by market players
Various strategic initiatives are implemented by market players for the production of microalgae products, which include acquisition, collaboration and expansion, among others. These initiatives allow market players to increase their company's product portfolio, leading to market expansion and increasing the product demand among customers, ultimately allowing them to earn maximum revenue. As the demand for effective and novel products derived from microalgae is increasing worldwide, these strategic initiatives are taken by top market players aimed at enhancing business operations and earning more profitability in the market.
Restraints/Challenges
- Side-effects related to microalgae products
Microalgae products are now days used due to their high nutritional value and showed promising biological results, due to which the demand has increased in the market. But these products show some adverse effects or side effects to the body. These side-effects were reported by the consumers who have used the microalgae products as their supplements for boosting immunity.
- Complications associated with microalgae production
Microalgae products are considered very efficient and their increased demand in nutraceuticals, renewable energy and biopharmaceutical industries makes them more considerable among the consumer. Microalgae are a renewable, sustainable and economical source of ingredients in bioactive medicinal plants, food and biofuels. Microalgae biofuels are the best alternative to liquid fossil fuels as they are renewable and do not cause any harm to the environment. Microalgae can convert atmospheric carbon dioxide into beneficial products such as carbohydrates, lipids and bioactive metabolites. But it is very challenging to harvest and process microalgae.
Post-COVID-19 Impact on the Microalgae Market
The COVID-19 pandemic had a great impact on the pharmaceutical and nutraceutical industries. Trade groups in the nutritional products sector claim that the Europe supply chain for functional foods and dietary supplements has been significantly damaged, impacting end-user consumption of microalgae market growth. Sales of microalgae in the first quarter of 2020 were significantly delayed in the algal industry due to logistical and transportation issues. The supply of raw materials for culture medium and manufacturing, packaging and biomass delivery were all disrupted along the whole value chain. China, one of the world's main producers and consumers of microalgal species, began to experience the COVID-19 pandemic's effects on this market in 2020. However, the demand for microalgae is also increasing, with consumers consuming dietary supplements and functional food to stay healthy.
Recent Developments
- In November 2022, euglena Co., Ltd revealed that regular consumption of the microalgae Euglena (also known as Euglena in Japan) reduces the severity of various symptoms and prevents the development of cold-like symptoms
- In November 2019, Algarithm launched a program to enhance awareness regarding the kappamega3 product, which comprises omega-3 DHA oil derived from microalgae. This program launch allowed the company to maintain a potential position in the microalgae market
Europe Microalgae Market Scope
The Europe microalgae market is segmented into type, category, form, grade, application and distribution channel. The growth amongst these segments will help you analyze meager growth segments in the industries and provide the users with a valuable market overview and market insights to make strategic decisions to identify core market applications.
Type
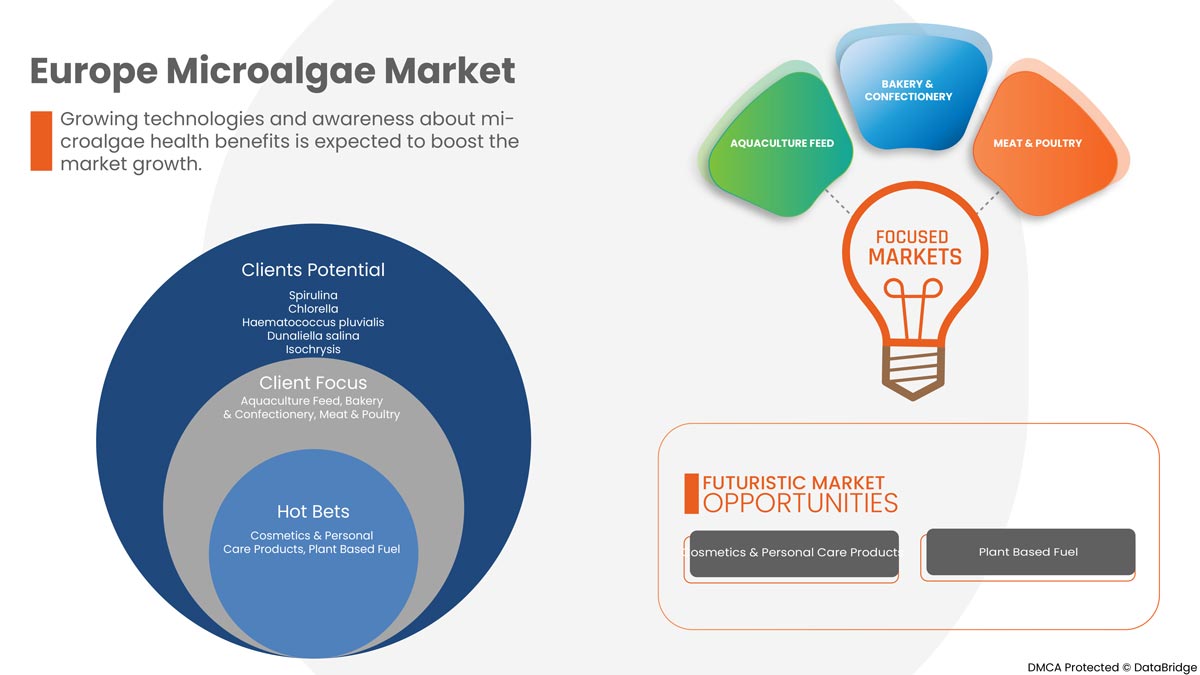
- Spirulina
- Chlorella
- Haematococcus Pluvialis
- Dunaliella Salina
- Isochrysis
- Phaeodactylum Tricornutum
- Chlamydomonas Cruentum
- Nannochloropsis
- Others
Based on type, the microalgae market is segmented into chlaspirulina, chlorella, haematococcus pluvialis, dunaliella salina, isochrysis, phaeodactylum tricornutum, chlamydomonas cruentum, nannochloropsis and others.
Category
- Organic
- Inorganic
Based on category, the microalgae market is segmented into organic and inorganic.
Form
- Powder/ Dry
- Liquid
Based on form, the microalgae market is segmented into powder/dry and liquid.
Grade
- Food Grade
- Cosmetic Grade
- Feed Grade
- Fuel Grade
- Others
Based on grade, the microalgae market is segmented into food grade, cosmetic grade, feed grade, fuel grade and others.
Application
- Dietary Supplements
- Cosmetics & Personal
- Food & Beverages
- Pharmaceuticals
- Animal Feed
- Bio-Fuel
- Inks
- Others
Based on application, the microalgae market is segmented into dietary supplements, cosmetics & personal, food & beverages, pharmaceuticals, animal feed, bio-fuel, inks and others.
Distribution Channel
- Direct
- Indirect
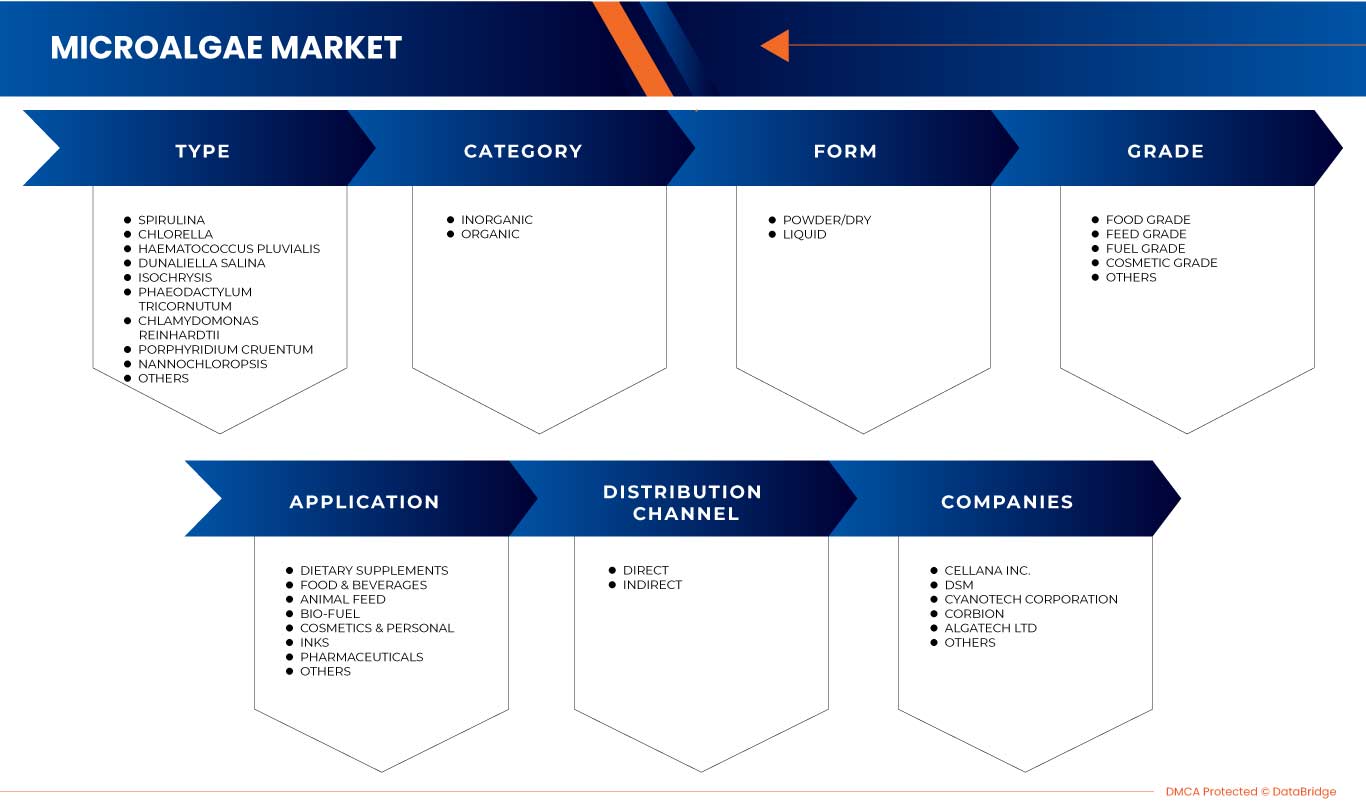
Based on distribution channel, the microalgae market is segmented into direct and indirect.
Microalgae Market Regional Analysis/Insights
The microalgae market is analysed and market size insights and trends are provided by country, type, category, form, grade, application and distribution channel.
The countries covered in this report are Germany, U.K., France, Italy, Spain, Netherlands, Russia, Switzerland, Turkey, Belgium, and Rest of Europe.
U.K. is expected to dominate the Europe microalgae market due to increasing awareness among consumers about the health benefits of microalgae products and multiple industry coverage. An increase in demand for microalgae products and an increase in research and development activities in nutraceutical industries are also expected to drive the market in the forecasted period.
The region section of the report also provides individual market-impacting factors and changes in regulations that impact the market's current and future trends. Data points, such as new and replacement sales, country demographics, disease epidemiology and import-export tariffs, are some of the major pointers used to forecast the market scenario for individual countries. In addition, the presence and availability of Europe brands and their challenges faced due to high competition from local and domestic brands and the impact of sales channels are considered while providing forecast analysis of the country data.
Competitive Landscape and Europe Microalgae Market Share Analysis
The microalgae market competitive landscape provides details of the competitors. Details include company overview, company financials, revenue generated, market potential, investment in research and development, new market initiatives, Europe presence, production sites and facilities, production capacities, company strengths and weaknesses, product launch, product width and breadth, and application dominance. The above data points are only related to the companies focusing on the Europe microalgae market.
Some of the major players operating in this market are Euglena Co. Ltd., DIC CORPORATION, DSM, Cyanotech Corporation, Corbion, Far East Bio-Tec Co., Ltd., Earthrise Nutritionals, LLC, AstaReal Co., Ltd., BUGGYPOWER, Inner Mongolia Rejuve Biotech Co.,Ltd., Algatech LTD., AlgaEnergy S.A., Parry Nutraceuticals, Heliae Development, LLC, Algarithm, Necton S.A., and Yemoja Ltd., among others.
SKU-
Obtenha acesso online ao relatório sobre a primeira nuvem de inteligência de mercado do mundo

- Painel interativo de análise de dados
- Painel de análise da empresa para oportunidades de elevado potencial de crescimento
- Acesso de analista de pesquisa para personalização e customização. consultas
- Análise da concorrência com painel interativo
- Últimas notícias, atualizações e atualizações Análise de tendências
- Aproveite o poder da análise de benchmark para um rastreio abrangente da concorrência
Índice
1 INTRODUÇÃO
1.1 OBJETIVOS DO ESTUDO
1.2 DEFINIÇÃO DE MERCADO
1.3 VISÃO GERAL DO MERCADO EUROPEU DE MICROALGAS
1.4 MOEDA E PREÇOS
1.5 LIMITAÇÕES
1.6 MERCADOS COBERTOS
2 SEGMENTAÇÃO DE MERCADO
2.1 MERCADOS COBERTOS
2.2 ÂMBITO GEOGRÁFICO
2,3 ANOS CONSIDERADOS PARA O ESTUDO
2.4 MODELO DE VALIDAÇÃO DE DADOS TRIPÉ DBMR
2.5 MODELAGEM MULTIVARIADA
2.6 TIPO CURVA DE LINHA DE VIDA
2.7 ENTREVISTAS PRINCIPAIS COM PRINCIPAIS LÍDERES DE OPINIÃO
2.8 GRADE DE POSIÇÃO DE MERCADO DBMR
2.9 ANÁLISE DA PARTICIPAÇÃO DO FORNECEDOR
2.1 GRADE DE COBERTURA DO USUÁRIO FINAL DO MERCADO
2.11 FONTES SECUNDÁRIAS
2.12 PREMISSAS
3 RESUMO EXECUTIVO
4 VISÃO PREMIUM
4.1 ANÁLISE DE PATENTES
4.2 ANÁLISE DE MARCA
4.3 ANÁLISE DA CADEIA DE SUPRIMENTOS
4.3.1 VISÃO GERAL
4.4 PROCESSO DE PRODUÇÃO DE MICROALGAS
4.5 ANÁLISE DA CADEIA DE VALOR
5 MERCADO EUROPEU DE MICROALGAS: LEIS E REGULAMENTOS
6 VISÃO GERAL DO MERCADO
6.1 MOTORISTAS
6.1.1 AUMENTO DA CONSCIENTIZAÇÃO ENTRE OS CONSUMIDORES SOBRE OS AMPLOS BENEFÍCIOS PARA A SAÚDE DOS PRODUTOS À BASE DE MICROALGAS
6.1.2 DESENVOLVIMENTO DE NOVAS INOVAÇÕES E TECNOLOGIAS PARA PRODUTOS DE MICROALGAS
6.1.3 AMPLA COBERTURA DE MICROALGAS EM DIFERENTES CAMPOS, COMO COSMÉTICOS, NUTRIÇÃO ETC.
6.1.4 AUMENTO DO FOCO EM UMA DIETA RICA EM PLANTAS
6.2 RESTRIÇÕES
6.2.1 EFEITOS COLATERAIS RELACIONADOS A PRODUTOS À BASE DE MICROALGAS
6.2.2 ALTO CUSTO DE PRODUÇÃO
6.2.3 A PRODUTIVIDADE DEPENDE DO CLIMA
6.3 OPORTUNIDADES
6.3.1 AUMENTO DO FUNDO PARA PRODUÇÃO DE MICROALGAS
6.3.2 AUMENTO DAS INICIATIVAS ESTRATÉGICAS DOS ATORES DO MERCADO
6.3.3 AUMENTO DO INTERESSE POR MATÉRIAS-PRIMAS PARA BIODIESEL
6.4 DESAFIOS
6.4.1 COMPLICAÇÕES ASSOCIADAS À PRODUÇÃO DE MICROALGAS
6.4.2 REGULAMENTAÇÕES RIGOROSAS RELACIONADAS ÀS MICROALGAS
6.4.3 DESVANTAGENS DO MERCADO DOWNSTREAM
7 MERCADO EUROPEU DE MICROALGAS, POR TIPO
7.1 VISÃO GERAL
7.2 ESPIRULINA
7.3 CLORELA
7.4 HAEMATOCOCCUS PLUVIALIS
7.5 DUNALIELLA SALINA
7.6 ISOCRISE
7.7 PHAEODACTYLUM TRICORNUTUM
7.8 CHLAMYDOMONAS REINHARDTII
7.9 PORPHYRIDIUM CRUENTUM
7.1 NANOCLOROPSE
7.11 OUTROS
8 MERCADO EUROPEU DE MICROALGAS, POR CATEGORIA
8.1 VISÃO GERAL
8.2 INORGÂNICOS
8.3 ORGÂNICO
9 MERCADO EUROPEU DE MICROALGAS, POR FORMULÁRIO
9.1 VISÃO GERAL
9.2 PÓ/SECO
9.3 LÍQUIDO
10 MERCADO EUROPEU DE MICROALGAS, POR FORMULÁRIO
10.1 VISÃO GERAL
10.2 GRAU ALIMENTAR
10.3 QUALIDADE DE ALIMENTAÇÃO
10.4 GRAU DE COMBUSTÍVEL
10.5 GRAU COSMÉTICO
10.6 OUTROS
11 MERCADO EUROPEU DE MICROALGAS, POR APLICAÇÃO
11.1 VISÃO GERAL
11.2 SUPLEMENTOS ALIMENTARES
11.2.1 PÓ
11.2.2 Cápsulas macias
11.2.3 CÁPSULAS
11.2.4 OUTROS
11.3 ALIMENTOS E BEBIDAS
11.3.1 CARNES E AVES
11.3.2 PADARIA E CONFEITARIA
11.3.3 LANCHES
11.3.4 REFEIÇÕES RTE
11.3.5 BEBIDAS
11.3.6 FÓRMULA INFANTIL
11.3.7 PRODUTOS LÁCTEOS
11.4 ALIMENTAÇÃO ANIMAL
11.4.1 AQUICULTURA
11.4.2 RUMINANTES
11.4.3 SUÍNOS
11.4.4 AVES
11.4.5 OUTROS
11.5 BIOCOMBUSTÍVEL
11.6 COSMÉTICOS E PESSOAIS
11.6.1 CUIDADOS COM A PELE
11.6.2 CUIDADOS COM O CABELO
11,7 TINTAS
11.8 PRODUTOS FARMACÊUTICOS
11.9 OUTROS
12 MERCADO EUROPEU DE MICROALGAS, POR CANAL DE DISTRIBUIÇÃO
12.1 VISÃO GERAL
12.2 DIRETO
12.3 INDIRETO
13 MERCADO EUROPEU DE MICROALGAS, POR REGIÃO
13.1 EUROPA
13.1.1 Reino Unido
13.1.2 FRANÇA
13.1.3 ESPANHA
13.1.4 ALEMANHA
13.1.5 ITÁLIA
13.1.6 HOLANDA
13.1.7 SUÍÇA
13.1.8 BÉLGICA
13.1.9 RÚSSIA
13.1.10 TURQUIA
13.1.11 RESTO DA EUROPA
14 MERCADO EUROPEU DE MICROALGAS: PANORAMA DA EMPRESA
14.1 ANÁLISE DE AÇÕES DA EMPRESA: EUROPA
15 ANÁLISE SWOT
16 PERFIL DA EMPRESA
16.1 EUGLENA CO., LTD.
16.1.1 RESUMO DA EMPRESA
16.1.2 ANÁLISE DE RECEITA
16.1.3 ANÁLISE DAS AÇÕES DA EMPRESA
16.1.4 PORTFÓLIO DE PRODUTOS
16.1.5 DESENVOLVIMENTOS RECENTES
16.2 CORPORAÇÃO DIC
16.2.1 RESUMO DA EMPRESA
16.2.2 ANÁLISE DE RECEITA
16.2.3 ANÁLISE DAS AÇÕES DA EMPRESA
16.2.4 PORTFÓLIO DE PRODUTOS
16.2.5 DESENVOLVIMENTO RECENTE
16.3 DSM
16.3.1 RESUMO DA EMPRESA
16.3.2 ANÁLISE DE RECEITA
16.3.3 ANÁLISE DE AÇÕES DA EMPRESA
16.3.4 PORTFÓLIO DE PRODUTOS
16.3.5 DESENVOLVIMENTO RECENTE
16.4 CORPORAÇÃO CYANOTECH
16.4.1 RESUMO DA EMPRESA
16.4.2 ANÁLISE DE RECEITA
16.4.3 ANÁLISE DAS AÇÕES DA EMPRESA
16.4.4 PORTFÓLIO DE PRODUTOS
16.4.5 DESENVOLVIMENTOS RECENTES
16,5 CORBION
16.5.1 RESUMO DA EMPRESA
16.5.2 ANÁLISE DE RECEITA
16.5.3 ANÁLISE DAS AÇÕES DA EMPRESA
16.5.4 PORTFÓLIO DE PRODUTOS
16.5.5 DESENVOLVIMENTOS RECENTES
16.6 A4F ALGAS PARA O FUTURO
16.6.1 RESUMO DA EMPRESA
16.6.2 PORTFÓLIO DE PRODUTOS
16.6.3 DESENVOLVIMENTOS RECENTES
16.7 ALGAENERGIA
16.7.1 RESUMO DA EMPRESA
16.7.2 PORTFÓLIO DE PRODUTOS
16.7.3 DESENVOLVIMENTOS RECENTES
16.8 ALGAHEALTH
16.8.1 RESUMO DA EMPRESA
16.8.2 PORTFÓLIO DE PRODUTOS
16.8.3 DESENVOLVIMENTOS RECENTES
16.9 ALGATECH LTD
16.9.1 RESUMO DA EMPRESA
16.9.2 PORTFÓLIO DE PRODUTOS
16.9.3 DESENVOLVIMENTO RECENTE
16.1 ASTAREAL CO., LTDA.
16.10.1 RESUMO DA EMPRESA
16.10.2 PORTFÓLIO DE PRODUTOS
16.10.3 DESENVOLVIMENTOS RECENTES
16.11 BLUETEC NATURALS CO., LTD
16.11.1 RESUMO DA EMPRESA
16.11.2 PORTFÓLIO DE PRODUTOS
16.11.3 DESENVOLVIMENTO RECENTE
16.12 BUGGYPOWER
16.12.1 RESUMO DA EMPRESA
16.12.2 PORTFÓLIO DE PRODUTOS
16.12.3 DESENVOLVIMENTO RECENTE
16.13 CELLANA INC.
16.13.1 RESUMO DA EMPRESA
16.13.2 PORTFÓLIO DE PRODUTOS
16.13.3 DESENVOLVIMENTO RECENTE
16.14 NUTRICIONAIS EARTHRISE, LLC
16.14.1 RESUMO DA EMPRESA
16.14.2 PORTFÓLIO DE PRODUTOS
16.14.3 DESENVOLVIMENTO RECENTE
16.15 FAR EAST BIO-TEC CO., LTD
16.15.1 RESUMO DA EMPRESA
16.15.2 PORTFÓLIO DE PRODUTOS
16.15.3 DESENVOLVIMENTOS RECENTES
16.16 DESENVOLVIMENTO HELIAE, LLC
16.16.1 RESUMO DA EMPRESA
16.16.2 PORTFÓLIO DE PRODUTOS
16.16.3 DESENVOLVIMENTOS RECENTES
16.17 INALVE
16.17.1 RESUMO DA EMPRESA
16.17.2 PORTFÓLIO DE PRODUTOS
16.17.3 DESENVOLVIMENTO RECENTE
16.18 MICRÓFITAS
16.18.1 RESUMO DA EMPRESA
16.18.2 PORTFÓLIO DE PRODUTOS
16.18.3 DESENVOLVIMENTO RECENTE
16.19 PARRY NUTRACÊUTICOS
16.19.1 RESUMO DA EMPRESA
16.19.2 PORTFÓLIO DE PRODUTOS
16.19.3 DESENVOLVIMENTO RECENTE
16.2 MONGÓLIA INTERNA REJUVE BIOTECH CO., LTD
16.20.1 RESUMO DA EMPRESA
16.20.2 PORTFÓLIO DE PRODUTOS
16.20.3 DESENVOLVIMENTOS RECENTES
17 QUESTIONÁRIO
18 RELATÓRIOS RELACIONADOS
Lista de Tabela
TABELA 1 MERCADO EUROPEU DE MICROALGAS, ANÁLISE DE PATENTES
TABELA 2 PADRÃO GERAL DE ANÁLISE DA CADEIA DE SUPRIMENTOS DE MICROALGAS
TABELA 3 CADEIA DE VALOR DAS MICROALGAS-
TABELA 4 REGULAMENTAÇÃO IMPOSTA POR DIVERSAS AGÊNCIAS REGULADORAS PARA A COMERCIALIZAÇÃO DE ALIMENTOS E RAÇÕES
TABELA 5 REGULAMENTAÇÃO IMPOSTA POR DIVERSAS AGÊNCIAS REGULADORAS PARA PESQUISA (INCLUINDO MICROALGAS GM) DE ALIMENTOS E RAÇÕES
TABELA 6 REGULAMENTAÇÃO IMPOSTA POR DIVERSAS AGÊNCIAS REGULADORAS PARA A PRODUÇÃO (INCLUINDO MICROALGAS GM) DE ALIMENTOS E RAÇÕES
TABELA 7 REGULAMENTAÇÃO IMPOSTA POR DIVERSAS AGÊNCIAS REGULADORAS DE PRODUTOS COSMÉTICOS À BASE DE MICROALGAS
TABELA 8 PRODUTOS À BASE DE MICROALGAS PARA DIVERSAS APLICAÇÕES
TABELA 9 COMPONENTES DE ALTO VALOR DE CEPAS DE MICROALGAS
TABELA 10 NUTRACÊUTICOS E SUPLEMENTOS DIETÉTICOS À BASE DE MICROALGAS
TABELA 11 EFEITOS COLATERAIS RELATADOS EM PACIENTES COM INSUFICIÊNCIA RENAL
TABELA 12 CUSTO RELACIONADO AO PROCESSO DE COLHEITA DE MICROALGAS
TABELA 13 CONDIÇÕES CLIMÁTICAS PARA O CRESCIMENTO DE MICROALGAS
TABELA 14 LISTA DE AUTORIDADES, REGULAMENTOS E FERRAMENTAS PARA DIFERENTES REGIÕES
TABELA 15 MERCADO EUROPEU DE MICROALGAS, POR TIPO, 2021-2030 (MILHÕES DE DÓLARES)
TABELA 16 MERCADO EUROPEU DE SPIRULINA NO MERCADO DE MICROALGAS, POR REGIÃO, 2021-2030 (US$ MILHÕES)
TABELA 17 MERCADO EUROPEU DE CLORELA EM MICROALGAS, POR REGIÃO, 2021-2030 (US$ MILHÕES)
TABELA 18 HAEMATOCOCCUS PLUVIALIS NO MERCADO DE MICROALGAS DA EUROPA, POR REGIÃO, 2021-2030 (US$ MILHÕES)
TABELA 19 EUROPA DUNALIELLA SALINA NO MERCADO DE MICROALGAS, POR REGIÃO, 2021-2030 (US$ MILHÕES)
TABELA 20 MERCADO EUROPEU DE ISOCRISE EM MICROALGAS, POR REGIÃO, 2021-2030 (US$ MILHÕES)
TABELA 21 PHAEODACTYLUM TRICORNUTUM NO MERCADO EUROPEU DE MICROALGAS, POR REGIÃO, 2021-2030 (US$ MILHÕES)
TABELA 22 CHLAMYDOMONAS REINHARDTII NO MERCADO DE MICROALGAS DA EUROPA, POR REGIÃO, 2021-2030 (US$ MILHÕES)
TABELA 23 PORPHYRIDIUM CRUENTUM NO MERCADO DE MICROALGAS DA EUROPA, POR REGIÃO, 2021-2030 (US$ MILHÕES)
TABELA 24 NANOCLOROPSE NO MERCADO EUROPEU DE MICROALGAS, POR REGIÃO, 2021-2030 (US$ MILHÕES)
TABELA 25 OUTROS MERCADOS DE MICROALGAS DA EUROPA, POR REGIÃO, 2021-2030 (US$ MILHÕES)
TABELA 26 MERCADO EUROPEU DE MICROALGAS, POR CATEGORIA, 2021-2030 (MILHÕES DE DÓLARES)
TABELA 27 MERCADO EUROPEU DE MICROALGAS INORGÂNICAS, POR REGIÃO, 2021-2030 (US$ MILHÕES)
TABELA 28 MERCADO EUROPEU DE MICROALGAS ORGÂNICAS, POR REGIÃO, 2021-2030 (US$ MILHÕES)
TABELA 29 MERCADO EUROPEU DE MICROALGAS, POR FORMA, 2021-2030 (MILHÕES DE USD)
TABELA 30 MERCADO EUROPEU DE PÓ/SECO PARA MICROALGAS, POR REGIÃO, 2021-2030 (US$ MILHÕES)
TABELA 31 MERCADO EUROPEU DE LÍQUIDOS EM MICROALGAS, POR REGIÃO, 2021-2030 (US$ MILHÕES)
TABELA 32 MERCADO EUROPEU DE MICROALGAS, POR GRAU, 2021-2030 (MILHÕES DE DÓLARES)
TABELA 33 MERCADO EUROPEU DE MICROALGAS DE GRAU ALIMENTAR, POR REGIÃO, 2021-2030 (MILHÕES DE DÓLARES)
TABELA 34: QUALIDADE DE ALIMENTAÇÃO NA EUROPA NO MERCADO DE MICROALGAS, POR REGIÃO, 2021-2030 (US$ MILHÕES)
TABELA 35 GRAU DE COMBUSTÍVEL NA EUROPA NO MERCADO DE MICROALGAS, POR REGIÃO, 2021-2030 (US$ MILHÕES)
TABELA 36 QUALIDADE COSMÉTICA NA EUROPA NO MERCADO DE MICROALGAS, POR REGIÃO, 2021-2030 (US$ MILHÕES)
TABELA 37 OUTROS INGRESSOS NO MERCADO DE MICROALGAS DA EUROPA, POR REGIÃO, 2021-2030 (US$ MILHÕES)
TABELA 38 MERCADO EUROPEU DE MICROALGAS, POR APLICAÇÃO, 2021-2030 (MILHÕES DE DÓLARES)
TABLE 39 EUROPE DIETARY SUPPLEMENTS IN MICROALGAE MARKET, BY REGION, 2021-2030 (USD MILLION)
TABLE 40 EUROPE DIETARY SUPPLEMENTS IN MICROALGAE MARKET, BY APPLICATION, 2021-2030 (USD MILLION)
TABLE 41 EUROPE FOOD & BEVERAGES IN MICROALGAE MARKET, BY REGION, 2021-2030 (USD MILLION)
TABLE 42 EUROPE FOOD & BEVERAGES IN MICROALGAE MARKET, BY APPLICATION, 2021-2030 (USD MILLION)
TABLE 43 EUROPE ANIMAL FEED IN MICROALGAE MARKET, BY REGION, 2021-2030 (USD MILLION)
TABLE 44 EUROPE ANIMAL FEED IN MICROALGAE MARKET, BY APPLICATION, 2021-2030 (USD MILLION)
TABLE 45 EUROPE BIO-FUEL IN MICROALGAE MARKET, BY REGION, 2021-2030 (USD MILLION)
TABLE 46 EUROPE COSMETICS & PERSONAL IN MICROALGAE MARKET, BY REGION, 2021-2030 (USD MILLION)
TABLE 47 EUROPE COSMETICS & PERSONAL IN MICROALGAE MARKET, BY APPLICATION, 2021-2030 (USD MILLION)
TABLE 48 EUROPE INKS IN MICROALGAE MARKET, BY REGION, 2021-2030 (USD MILLION)
TABLE 49 EUROPE PHARMACEUTICALS IN MICROALGAE MARKET, BY REGION, 2021-2030 (USD MILLION)
TABLE 50 EUROPE OTHERS IN MICROALGAE MARKET, BY REGION, 2021-2030 (USD MILLION)
TABLE 51 EUROPE MICROALGAE MARKET, BY DISTRIBUTION CHANNEL, 2021-2030 (USD MILLION)
TABLE 52 EUROPE DIRECT IN MICROALGAE MARKET, BY REGION, 2021-2030 (USD MILLION)
TABLE 53 EUROPE INDIRECT IN MICROALGAE MARKET, BY REGION, 2021-2030 (USD MILLION)
TABLE 54 EUROPE MICROALGAE MARKET, BY COUNTRY, 2021-2030 (USD MILLION)
TABLE 55 EUROPE MICROALGAE MARKET, BY TYPE, 2021-2030 (USD MILLION)
TABLE 56 EUROPE MICROALGAE MARKET, BY CATEGORY, 2021-2030 (USD MILLION)
TABLE 57 EUROPE MICROALGAE MARKET, BY FORM, 2021-2030 (USD MILLION)
TABLE 58 EUROPE MICROALGAE MARKET, BY GRADE, 2021-2030 (USD MILLION)
TABLE 59 EUROPE MICROALGAE MARKET, BY APPLICATION, 2021-2030 (USD MILLION)
TABLE 60 EUROPE DIETARY SUPPLEMENTS IN MICROALGAE MARKET, BY APPLICATION, 2021-2030 (USD MILLION)
TABLE 61 EUROPE FOOD & BEVERAGES IN MICROALGAE MARKET, BY APPLICATION, 2021-2030 (USD MILLION)
TABLE 62 EUROPE ANIMAL FEED IN MICROALGAE MARKET, BY APPLICATION, 2021-2030 (USD MILLION)
TABLE 63 EUROPE COSMETIC & PERSONAL IN MICROALGAE MARKET, BY APPLICATION, 2021-2030 (USD MILLION)
TABLE 64 EUROPE MICROALGAE MARKET, BY DISTRIBUTION CHANNEL, 2021-2030 (USD MILLION)
TABLE 65 U.K. MICROALGAE MARKET, BY TYPE, 2021-2030 (USD MILLION)
TABLE 66 U.K. MICROALGAE MARKET, BY CATEGORY, 2021-2030 (USD MILLION)
TABLE 67 U.K. MICROALGAE MARKET, BY FORM, 2021-2030 (USD MILLION)
TABLE 68 U.K. MICROALGAE MARKET, BY GRADE, 2021-2030 (USD MILLION)
TABLE 69 U.K. MICROALGAE MARKET, BY APPLICATION, 2021-2030 (USD MILLION)
TABLE 70 U.K. DIETARY SUPPLEMENTS IN MICROALGAE MARKET, BY APPLICATION, 2021-2030 (USD MILLION)
TABLE 71 U.K. FOOD & BEVERAGES IN MICROALGAE MARKET, BY APPLICATION, 2021-2030 (USD MILLION)
TABLE 72 U.K. ANIMAL FEED IN MICROALGAE MARKET, BY APPLICATION, 2021-2030 (USD MILLION)
TABLE 73 U.K. COSMETIC & PERSONAL IN MICROALGAE MARKET, BY APPLICATION, 2021-2030 (USD MILLION)
TABLE 74 U.K. MICROALGAE MARKET, BY DISTRIBUTION CHANNEL, 2021-2030 (USD MILLION)
TABELA 75 MERCADO DE MICROALGAS DA FRANÇA, POR TIPO, 2021-2030 (US$ MILHÕES)
TABELA 76 MERCADO DE MICROALGAS DA FRANÇA, POR CATEGORIA, 2021-2030 (US$ MILHÕES)
TABELA 77 MERCADO DE MICROALGAS DA FRANÇA, POR FORMA, 2021-2030 (US$ MILHÕES)
TABELA 78 MERCADO DE MICROALGAS DA FRANÇA, POR GRAU, 2021-2030 (US$ MILHÕES)
TABELA 79 MERCADO DE MICROALGAS DA FRANÇA, POR APLICAÇÃO, 2021-2030 (MILHÕES DE DÓLARES)
TABELA 80 SUPLEMENTOS ALIMENTARES NO MERCADO DE MICROALGAS DA FRANÇA, POR APLICAÇÃO, 2021-2030 (US$ MILHÕES)
TABELA 81 MERCADO DE ALIMENTOS E BEBIDAS DA FRANÇA NO MERCADO DE MICROALGAS, POR APLICAÇÃO, 2021-2030 (US$ MILHÕES)
TABELA 82 RAÇÃO ANIMAL NO MERCADO DE MICROALGAS DA FRANÇA, POR APLICAÇÃO, 2021-2030 (US$ MILHÕES)
TABELA 83 FRANÇA COSMÉTICOS E PESSOAIS NO MERCADO DE MICROALGAS, POR APLICAÇÃO, 2021-2030 (US$ MILHÕES)
TABELA 84 MERCADO DE MICROALGAS DA FRANÇA, POR CANAL DE DISTRIBUIÇÃO, 2021-2030 (US$ MILHÕES)
TABELA 85 MERCADO ESPANHA DE MICROALGAS, POR TIPO, 2021-2030 (US$ MILHÕES)
TABELA 86 MERCADO ESPANHA DE MICROALGAS, POR CATEGORIA, 2021-2030 (US$ MILHÕES)
TABELA 87 MERCADO DE MICROALGAS DA ESPANHA, POR FORMA, 2021-2030 (US$ MILHÕES)
TABELA 88 MERCADO DE MICROALGAS DA ESPANHA, POR GRAU, 2021-2030 (US$ MILHÕES)
TABELA 89 MERCADO ESPANHA DE MICROALGAS, POR APLICAÇÃO, 2021-2030 (US$ MILHÕES)
TABELA 90 SUPLEMENTOS ALIMENTARES NO MERCADO DE MICROALGAS DA ESPANHA, POR APLICAÇÃO, 2021-2030 (US$ MILHÕES)
TABELA 91 MERCADO ESPANHA DE ALIMENTOS E BEBIDAS NO MERCADO DE MICROALGAS, POR APLICAÇÃO, 2021-2030 (US$ MILHÕES)
TABELA 92 RAÇÃO ANIMAL NO MERCADO DE MICROALGAS DA ESPANHA, POR APLICAÇÃO, 2021-2030 (US$ MILHÕES)
TABELA 93 ESPANHA COSMÉTICOS E PESSOAIS NO MERCADO DE MICROALGAS, POR APLICAÇÃO, 2021-2030 (US$ MILHÕES)
TABELA 94 MERCADO ESPANHA DE MICROALGAS, POR CANAL DE DISTRIBUIÇÃO, 2021-2030 (US$ MILHÕES)
TABELA 95 MERCADO DE MICROALGAS DA ALEMANHA, POR TIPO, 2021-2030 (US$ MILHÕES)
TABELA 96 MERCADO DE MICROALGAS DA ALEMANHA, POR CATEGORIA, 2021-2030 (US$ MILHÕES)
TABELA 97 MERCADO DE MICROALGAS DA ALEMANHA, POR FORMA, 2021-2030 (US$ MILHÕES)
TABELA 98 MERCADO DE MICROALGAS DA ALEMANHA, POR GRAU, 2021-2030 (US$ MILHÕES)
TABELA 99 MERCADO DE MICROALGAS DA ALEMANHA, POR APLICAÇÃO, 2021-2030 (MILHÕES DE DÓLARES)
TABELA 100 SUPLEMENTOS ALIMENTARES NO MERCADO DE MICROALGAS DA ALEMANHA, POR APLICAÇÃO, 2021-2030 (US$ MILHÕES)
TABELA 101 ALIMENTOS E BEBIDAS NO MERCADO DE MICROALGAS DA ALEMANHA, POR APLICAÇÃO, 2021-2030 (US$ MILHÕES)
TABELA 102 ALIMENTAÇÃO ANIMAL NO MERCADO DE MICROALGAS DA ALEMANHA, POR APLICAÇÃO, 2021-2030 (US$ MILHÕES)
TABELA 103 ALEMANHA COSMÉTICOS E PESSOAIS NO MERCADO DE MICROALGAS, POR APLICAÇÃO, 2021-2030 (US$ MILHÕES)
TABELA 104 MERCADO DE MICROALGAS DA ALEMANHA, POR CANAL DE DISTRIBUIÇÃO, 2021-2030 (US$ MILHÕES)
TABELA 105 MERCADO DE MICROALGAS DA ITÁLIA, POR TIPO, 2021-2030 (US$ MILHÕES)
TABELA 106 MERCADO DE MICROALGAS DA ITÁLIA, POR CATEGORIA, 2021-2030 (US$ MILHÕES)
TABELA 107 MERCADO DE MICROALGAS DA ITÁLIA, POR FORMA, 2021-2030 (US$ MILHÕES)
TABELA 108 MERCADO DE MICROALGAS DA ITÁLIA, POR GRAU, 2021-2030 (US$ MILHÕES)
TABELA 109 MERCADO DE MICROALGAS DA ITÁLIA, POR APLICAÇÃO, 2021-2030 (US$ MILHÕES)
TABELA 110 SUPLEMENTOS ALIMENTARES NO MERCADO DE MICROALGAS DA ITÁLIA, POR APLICAÇÃO, 2021-2030 (US$ MILHÕES)
TABELA 111 MERCADO DE ALIMENTOS E BEBIDAS DA ITÁLIA NO MERCADO DE MICROALGAS, POR APLICAÇÃO, 2021-2030 (US$ MILHÕES)
TABLE 112 ITALY ANIMAL FEED IN MICROALGAE MARKET, BY APPLICATION, 2021-2030 (USD MILLION)
TABLE 113 ITALY COSMETIC & PERSONAL IN MICROALGAE MARKET, BY APPLICATION, 2021-2030 (USD MILLION)
TABLE 114 ITALY MICROALGAE MARKET, BY DISTRIBUTION CHANNEL, 2021-2030 (USD MILLION)
TABLE 115 NETHERLANDS MICROALGAE MARKET, BY TYPE, 2021-2030 (USD MILLION)
TABLE 116 NETHERLANDS MICROALGAE MARKET, BY CATEGORY, 2021-2030 (USD MILLION)
TABLE 117 NETHERLANDS MICROALGAE MARKET, BY FORM, 2021-2030 (USD MILLION)
TABLE 118 NETHERLANDS MICROALGAE MARKET, BY GRADE, 2021-2030 (USD MILLION)
TABLE 119 NETHERLANDS MICROALGAE MARKET, BY APPLICATION, 2021-2030 (USD MILLION)
TABLE 120 NETHERLANDS DIETARY SUPPLEMENTS IN MICROALGAE MARKET, BY APPLICATION, 2021-2030 (USD MILLION)
TABLE 121 NETHERLANDS FOOD & BEVERAGES IN MICROALGAE MARKET, BY APPLICATION, 2021-2030 (USD MILLION)
TABLE 122 NETHERLANDS ANIMAL FEED IN MICROALGAE MARKET, BY APPLICATION, 2021-2030 (USD MILLION)
TABLE 123 NETHERLANDS COSMETIC & PERSONAL IN MICROALGAE MARKET, BY APPLICATION, 2021-2030 (USD MILLION)
TABLE 124 NETHERLANDS MICROALGAE MARKET, BY DISTRIBUTION CHANNEL, 2021-2030 (USD MILLION)
TABLE 125 SWITZERLAND MICROALGAE MARKET, BY TYPE, 2021-2030 (USD MILLION)
TABLE 126 SWITZERLAND MICROALGAE MARKET, BY CATEGORY, 2021-2030 (USD MILLION)
TABLE 127 SWITZERLAND MICROALGAE MARKET, BY FORM, 2021-2030 (USD MILLION)
TABLE 128 SWITZERLAND MICROALGAE MARKET, BY GRADE, 2021-2030 (USD MILLION)
TABLE 129 SWITZERLAND MICROALGAE MARKET, BY APPLICATION, 2021-2030 (USD MILLION)
TABLE 130 SWITZERLAND DIETARY SUPPLEMENTS IN MICROALGAE MARKET, BY APPLICATION, 2021-2030 (USD MILLION)
TABLE 131 SWITZERLAND FOOD & BEVERAGES IN MICROALGAE MARKET, BY APPLICATION, 2021-2030 (USD MILLION)
TABLE 132 SWITZERLAND ANIMAL FEED IN MICROALGAE MARKET, BY APPLICATION, 2021-2030 (USD MILLION)
TABLE 133 SWITZERLAND COSMETIC & PERSONAL IN MICROALGAE MARKET, BY APPLICATION, 2021-2030 (USD MILLION)
TABLE 134 SWITZERLAND MICROALGAE MARKET, BY DISTRIBUTION CHANNEL, 2021-2030 (USD MILLION)
TABLE 135 BELGIUM MICROALGAE MARKET, BY TYPE, 2021-2030 (USD MILLION)
TABLE 136 BELGIUM MICROALGAE MARKET, BY CATEGORY, 2021-2030 (USD MILLION)
TABLE 137 BELGIUM MICROALGAE MARKET, BY FORM, 2021-2030 (USD MILLION)
TABLE 138 BELGIUM MICROALGAE MARKET, BY GRADE, 2021-2030 (USD MILLION)
TABLE 139 BELGIUM MICROALGAE MARKET, BY APPLICATION, 2021-2030 (USD MILLION)
TABLE 140 BELGIUM DIETARY SUPPLEMENTS IN MICROALGAE MARKET, BY APPLICATION, 2021-2030 (USD MILLION)
TABLE 141 BELGIUM FOOD & BEVERAGES IN MICROALGAE MARKET, BY APPLICATION, 2021-2030 (USD MILLION)
TABLE 142 BELGIUM ANIMAL FEED IN MICROALGAE MARKET, BY APPLICATION, 2021-2030 (USD MILLION)
TABLE 143 BELGIUM COSMETIC & PERSONAL IN MICROALGAE MARKET, BY APPLICATION, 2021-2030 (USD MILLION)
TABLE 144 BELGIUM MICROALGAE MARKET, BY DISTRIBUTION CHANNEL, 2021-2030 (USD MILLION)
TABLE 145 RUSSIA MICROALGAE MARKET, BY TYPE, 2021-2030 (USD MILLION)
TABLE 146 RUSSIA MICROALGAE MARKET, BY CATEGORY, 2021-2030 (USD MILLION)
TABLE 147 RUSSIA MICROALGAE MARKET, BY FORM, 2021-2030 (USD MILLION)
TABLE 148 RUSSIA MICROALGAE MARKET, BY GRADE, 2021-2030 (USD MILLION)
TABLE 149 RUSSIA MICROALGAE MARKET, BY APPLICATION, 2021-2030 (USD MILLION)
TABLE 150 RUSSIA DIETARY SUPPLEMENTS IN MICROALGAE MARKET, BY APPLICATION, 2021-2030 (USD MILLION)
TABLE 151 RUSSIA FOOD & BEVERAGES IN MICROALGAE MARKET, BY APPLICATION, 2021-2030 (USD MILLION)
TABLE 152 RUSSIA ANIMAL FEED IN MICROALGAE MARKET, BY APPLICATION, 2021-2030 (USD MILLION)
TABLE 153 RUSSIA COSMETIC & PERSONAL IN MICROALGAE MARKET, BY APPLICATION, 2021-2030 (USD MILLION)
TABLE 154 RUSSIA MICROALGAE MARKET, BY DISTRIBUTION CHANNEL, 2021-2030 (USD MILLION)
TABLE 155 TURKEY MICROALGAE MARKET, BY TYPE, 2021-2030 (USD MILLION)
TABLE 156 TURKEY MICROALGAE MARKET, BY CATEGORY, 2021-2030 (USD MILLION)
TABLE 157 TURKEY MICROALGAE MARKET, BY FORM, 2021-2030 (USD MILLION)
TABLE 158 TURKEY MICROALGAE MARKET, BY GRADE, 2021-2030 (USD MILLION)
TABLE 159 TURKEY MICROALGAE MARKET, BY APPLICATION, 2021-2030 (USD MILLION)
TABLE 160 TURKEY DIETARY SUPPLEMENTS IN MICROALGAE MARKET, BY APPLICATION, 2021-2030 (USD MILLION)
TABLE 161 TURKEY FOOD & BEVERAGES IN MICROALGAE MARKET, BY APPLICATION, 2021-2030 (USD MILLION)
TABLE 162 TURKEY ANIMAL FEED IN MICROALGAE MARKET, BY APPLICATION, 2021-2030 (USD MILLION)
TABLE 163 TURKEY COSMETIC & PERSONAL IN MICROALGAE MARKET, BY APPLICATION, 2021-2030 (USD MILLION)
TABLE 164 TURKEY MICROALGAE MARKET, BY DISTRIBUTION CHANNEL, 2021-2030 (USD MILLION)
TABLE 165 REST OF EUROPE MICROALGAE MARKET, BY TYPE, 2021-2030 (USD MILLION)
Lista de Figura
FIGURE 1 EUROPE MICROALGAE MARKET: SEGMENTATION
FIGURE 2 EUROPE MICROALGAE MARKET: DATA TRIANGULATION
FIGURE 3 EUROPE MICROALGAE MARKET: DROC ANALYSIS
FIGURE 4 EUROPE MICROALGAE MARKET: EUROPE VS. REGIONAL MARKET ANALYSIS
FIGURE 5 EUROPE MICROALGAE MARKET: COMPANY RESEARCH ANALYSIS
FIGURE 6 EUROPE MICROALGAE MARKET: MULTIVARIATE MODELLING
FIGURE 7 EUROPE MICROALGAE MARKET: INTERVIEW DEMOGRAPHICS
FIGURE 8 EUROPE MICROALGAE MARKET: DBMR MARKET POSITION GRID
FIGURE 9 EUROPE MICROALGAE MARKET: VENDOR SHARE ANALYSIS
FIGURE 10 EUROPE MICROALGAE MARKET: MARKET APPLICATION COVERAGE GRID
FIGURE 11 EUROPE MICROALGAE MARKET: SEGMENTATION
FIGURE 12 INCREASING AWARENESS AMONG CONSUMERS ABOUT HEALTH BENEFITS OF MICROALGAE PRODUCTS IS DRIVING THE EUROPE MICROALGAE MARKET IN THE FORECAST PERIOD OF 2023 TO 2030
FIGURE 13 TYPE MICROALGAE SEGMENT IS EXPECTED TO ACCOUNT FOR THE LARGEST SHARE OF THE EUROPE MICROALGAE MARKET FROM 2023 TO 2030
FIGURE 14 DRYING METHODS OF MICROALGAE BIOMAS
FIGURE 15 DRIVERS, RESTRAINTS, CHALLENGES, AND RESTRAINTS OF THE EUROPE MICROALGAE MARKET
FIGURE 16 EUROPE MICROALGAE MARKET: BY TYPE, 2022
FIGURE 17 EUROPE MICROALGAE MARKET: BY TYPE, 2023-2030 (USD MILLION)
FIGURE 18 EUROPE MICROALGAE MARKET: BY TYPE, CAGR (2023-2030)
FIGURE 19 EUROPE MICROALGAE MARKET: BY TYPE, LIFELINE CURVE
FIGURE 20 EUROPE MICROALGAE MARKET: BY CATEGORY, 2022
FIGURA 21 MERCADO EUROPEU DE MICROALGAS: POR CATEGORIA, 2023-2030 (MILHÕES DE DÓLARES)
FIGURA 22 MERCADO EUROPEU DE MICROALGAS: POR CATEGORIA, CAGR (2023-2030)
FIGURA 23 MERCADO EUROPEU DE MICROALGAS: POR CATEGORIA, CURVA DA LINHA DE SALVAÇÃO
FIGURA 24 MERCADO EUROPEU DE MICROALGAS: POR FORMA, 2022
FIGURA 25 MERCADO EUROPEU DE MICROALGAS: POR FORMA, 2023-2030 (MILHÕES DE DÓLARES)
FIGURA 26 MERCADO EUROPEU DE MICROALGAS: POR FORMA, CAGR (2023-2030)
FIGURA 27 MERCADO EUROPEU DE MICROALGAS: POR FORMA, CURVA DA LINHA DE SALVAÇÃO
FIGURA 28 MERCADO EUROPEU DE MICROALGAS: POR GRAU, 2022
FIGURA 29 MERCADO EUROPEU DE MICROALGAS: POR GRAU, 2023-2030 (MILHÕES DE DÓLARES)
FIGURA 30 MERCADO EUROPEU DE MICROALGAS: POR GRAU, CAGR (2023-2030)
FIGURA 31 MERCADO EUROPEU DE MICROALGAS: POR GRAU, CURVA DE LINHA DE SALVAÇÃO
FIGURA 32 MERCADO EUROPEU DE MICROALGAS: POR APLICAÇÃO, 2022
FIGURA 33 MERCADO EUROPEU DE MICROALGAS: POR APLICAÇÃO, 2023-2030 (MILHÕES DE DÓLARES)
FIGURA 34 MERCADO EUROPEU DE MICROALGAS: POR APLICAÇÃO, CAGR (2023-2030)
FIGURA 35 MERCADO EUROPEU DE MICROALGAS: POR APLICAÇÃO, CURVA DA LINHA DE SALVAÇÃO
FIGURA 36 MERCADO EUROPEU DE MICROALGAS: POR CANAL DE DISTRIBUIÇÃO, 2022
FIGURA 37 MERCADO EUROPEU DE MICROALGAS: POR CANAL DE DISTRIBUIÇÃO, 2023-2030 (MILHÕES DE DÓLARES)
FIGURA 38 MERCADO EUROPEU DE MICROALGAS: POR CANAL DE DISTRIBUIÇÃO, CAGR (2023-2030)
FIGURA 39 MERCADO EUROPEU DE MICROALGAS: POR CANAL DE DISTRIBUIÇÃO, CURVA DA LINHA DE SALVAÇÃO
FIGURA 40 MERCADO EUROPEU DE MICROALGAS: INSTANTÂNEO (2022)
FIGURA 41 MERCADO EUROPEU DE MICROALGAS: POR PAÍS (2022)
FIGURA 42 MERCADO EUROPEU DE MICROALGAS: POR PAÍS (2023 E 2030)
FIGURA 43 MERCADO EUROPEU DE MICROALGAS: POR PAÍS (2022 E 2030)
FIGURA 44 MERCADO EUROPEU DE MICROALGAS: POR TIPO (2023-2030)
FIGURA 45 MERCADO EUROPEU DE MICROALGAS: PARTICIPAÇÃO DA EMPRESA EM 2022 (%)
Metodologia de Investigação
A recolha de dados e a análise do ano base são feitas através de módulos de recolha de dados com amostras grandes. A etapa inclui a obtenção de informações de mercado ou dados relacionados através de diversas fontes e estratégias. Inclui examinar e planear antecipadamente todos os dados adquiridos no passado. Da mesma forma, envolve o exame de inconsistências de informação observadas em diferentes fontes de informação. Os dados de mercado são analisados e estimados utilizando modelos estatísticos e coerentes de mercado. Além disso, a análise da quota de mercado e a análise das principais tendências são os principais fatores de sucesso no relatório de mercado. Para saber mais, solicite uma chamada de analista ou abra a sua consulta.
A principal metodologia de investigação utilizada pela equipa de investigação do DBMR é a triangulação de dados que envolve a mineração de dados, a análise do impacto das variáveis de dados no mercado e a validação primária (especialista do setor). Os modelos de dados incluem grelha de posicionamento de fornecedores, análise da linha de tempo do mercado, visão geral e guia de mercado, grelha de posicionamento da empresa, análise de patentes, análise de preços, análise da quota de mercado da empresa, normas de medição, análise global versus regional e de participação dos fornecedores. Para saber mais sobre a metodologia de investigação, faça uma consulta para falar com os nossos especialistas do setor.
Personalização disponível
A Data Bridge Market Research é líder em investigação formativa avançada. Orgulhamo-nos de servir os nossos clientes novos e existentes com dados e análises que correspondem e atendem aos seus objetivos. O relatório pode ser personalizado para incluir análise de tendências de preços de marcas-alvo, compreensão do mercado para países adicionais (solicite a lista de países), dados de resultados de ensaios clínicos, revisão de literatura, mercado remodelado e análise de base de produtos . A análise de mercado dos concorrentes-alvo pode ser analisada desde análises baseadas em tecnologia até estratégias de carteira de mercado. Podemos adicionar quantos concorrentes necessitar de dados no formato e estilo de dados que procura. A nossa equipa de analistas também pode fornecer dados em tabelas dinâmicas de ficheiros Excel em bruto (livro de factos) ou pode ajudá-lo a criar apresentações a partir dos conjuntos de dados disponíveis no relatório.

