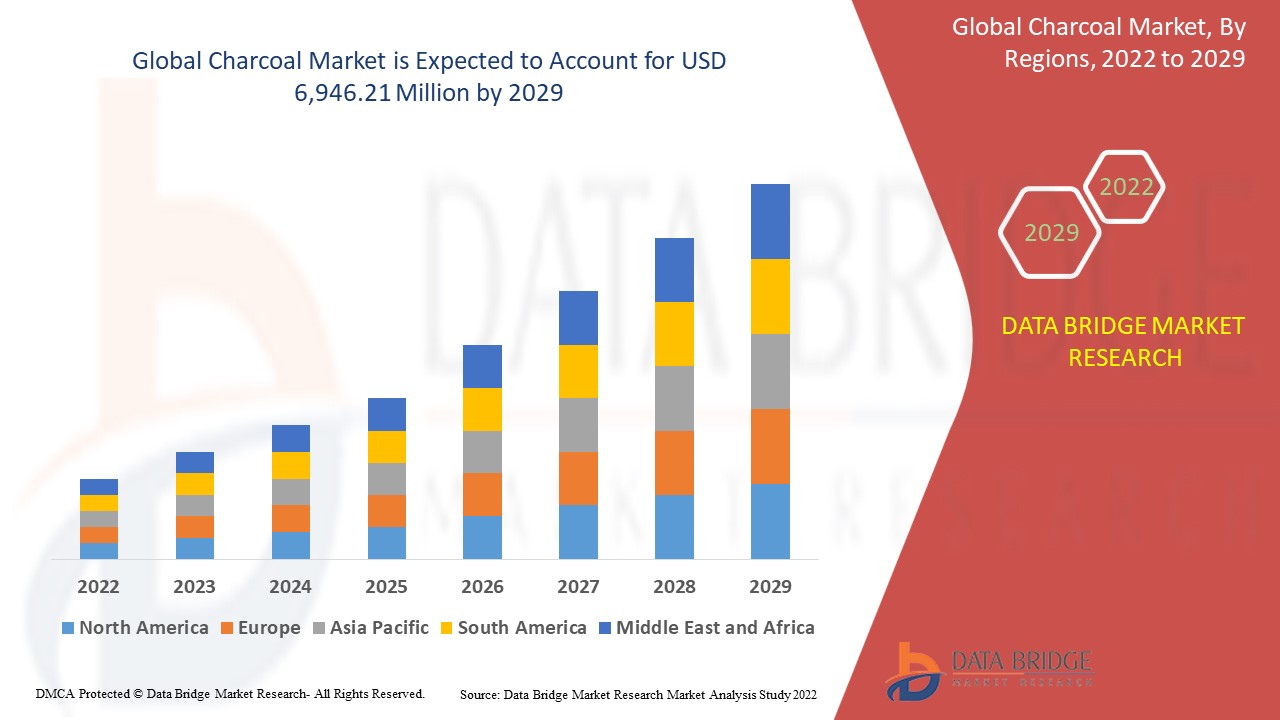
Global Charcoal Market, By Product (Lump Charcoal, Charcoal Briquettes, Japanese Charcoal, Sugar Charcoal and Others), Application (Outdoor Activities, Restaurant Business, Metallurgical Fuel, Industrial Fuel, Filtration and Others) Industry Trends and Forecast to 2029.
Market Defintion
Charcoal is a manmade black carbon residue product that is produced the plant material such as wood. This process is carried out in the presence of oxygen to remove volatile and water constitutes Due to increased demand for the product in recreational cooking and metal manufacturing, building & construction, healthcare, industrial filtration, and pharmaceutical applications, the global charcoal market is estimated to develop significantly over the forecast period. In recreational cooking, charcoal can be used as a substitute for coal. In addition, the increased popularity of barbeque cooking in restaurants is likely to boost demand for charcoal.
Market Analysis and Size
Data Bridge Market Research analyses that the charcoal market is expected to reach the value of USD 6,946.21 million by 2029, at a CAGR of 2.7% during the forecast period. The charcoal market report also covers pricing analysis, patent analysis, and technological advancements in depth.
|
Report Metric |
Details |
|
Forecast Period |
2022 to 2029 |
|
Base Year |
2021 |
|
Historic Years |
2020 |
|
Quantitative Units |
Revenue in USD Million, Pricing in USD |
|
Segments Covered |
By Product (Lump Charcoal, Charcoal Briquettes, Japanese Charcoal, Sugar Charcoal and Others), Application (Outdoor Activities, Restaurant Business, Metallurgical Fuel, Industrial Fuel, Filtration and Others) |
|
Countries Covered |
U.S., Canada and Mexico in North America, Germany, France, U.K., Netherlands, Switzerland, Belgium, Russia, Italy, Spain, Turkey, Rest of Europe in Europe, China, Japan, India, South Korea, Singapore, Malaysia, Australia, Thailand, Indonesia, Philippines, Hong Kong, Taiwan, Rest of Asia-Pacific (APAC) in the Asia-Pacific (APAC), Saudi Arabia, U.A.E, South Africa, Egypt, Israel, Rest of Middle East and Africa (MEA) as a part of Middle East and Africa (MEA), Brazil, Argentina and Rest of South America as part of South America. |
|
Market Players Covered |
Plantar, Rancher Charcoal, E & C Charcoal, Jumbo Charcoal (Pty) Ltd., Sagar Charcoal and Firewood Depot, Subur Tiasa Holdings Berhad, Etosha , The Clorox Company, Fire & Flavor, Timber Charcoal Company LLC, FogoCharcoal.com, NamCo Charcoal and Timber Products, Namchar, Mesjaya Sdn Bhd, Cook In Wood, maurobera.com, Royal Oak Enterprises, LLC., Duraflame, Inc. |
Charcoal Market Dynamics
This section deals with understanding the market drivers, advantages, opportunities, restraints and challenges. All of this is discussed in detail as below:
Drivers
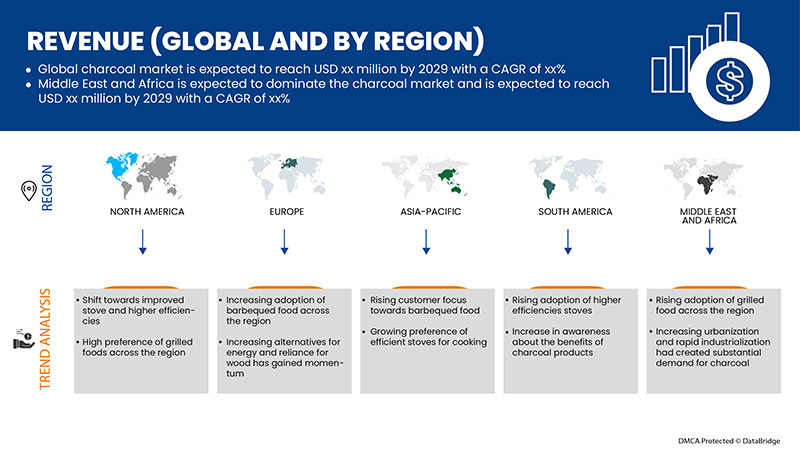
- Increase in urbanization and rapid industrialization had created substantial demand for charcoal
The demand for charcoal is increasing mainly due to urban population in developing countries. More than half the global population now lives in cities, and urban-dwellers are restricted to charcoal use because of easiness of production, access, transport, and tradition. Urbanization have influenced the type of fuels used and also the total energy consumption for different functions which have further increased the demand for charcoal production across the region.
- Rise in consumption of barbequed food
In much of the world, barbecuing is practically very common activity in many regions especially in summer time. And while some people grill with gas and electricity, many people also prefers grilling with charcoal gives their food with a particularly smoky flavour. Furthermore, charcoal is mostly used for recreational barbecuing in places like North America and Europe, but it’s the primary cooking fuel in most African nations. In addition, it is reported that the market is majorly driven by the rising influence of grilled food worldwide and the growing adoption of grilled food among millennials. In addition, lockdown restrictions and the need to maintain social distancing due to the ongoing COVID-19 pandemic have resulted in more number of people staying at home. Thereby, an increasing number of people have been engaged in-home cooking and organizing small social events at home. This situation has resulted in an increasing demand for home cooking equipment and materials.
Opportunity
- Shift towards improved stove and higher efficiencies
Traditional stoves for heating and cooking at the household level are typically inefficient and generate considerable indoor air pollution, which can be deleterious to human health. Improved cook stoves have been deployed in many countries in attempts to improve cooking and heating efficiency and reduce indoor pollution in domestic households. Furthermore, charcoal can be burned cleanly and safely if prepared properly and used correctly in efficient appliances. Improved cook stoves are convex in shape and insulated on all sides. Because of their insulation, they require less charcoal to generate an equivalent amount of useful heat, and they retain heat for longer. Also, recently there is the introduction of improved cook stoves that can reduce GHG emissions by improving fuel efficiency and thereby reducing demand for charcoal for the same quantity of cooking energy.
Restraints/Challenges
- Stringent government regulation for charcoal production
A number of policies and standards have been initiated for charcoal production to ensure the quality and safe handling of the product. For instance, Canada Consumer Product Safety Act (S.C. 2010, c. 21) addresses the prevention to human health or safety that are posed by consumer products in Canada, including those that circulate within Canada and those that are imported.
- Inadequate baseline information for policy formulation related to charcoal
Population growth and the shift from fire-wood to charcoal were highlighted as the main driving factors for the growth of charcoal market. However, wood-fuel exploitation alone clearly does not provide a summary explanation for ongoing deforestation on a national scale. The problems related to wood fuel have increased due to unstructured baseline information related to various polices of charcoal production, which have further created demand and supply gap of charcoal across the region. Therefore, precise data on the charcoal value chain needs to be provided for an excellent entry-point for shaping proper policy frameworks. This will also offer an opportunity to the various stakeholders to add knowledge, innovation capital and technology at each step or link in the value chain of charcoal production. Hence, the inadequate baseline information for policy formulation is creating a major challenge for the market to grow.
Post COVID-19 Impact on Charcoal Market
COVID-19 created a major impact on the charcoal market as almost every country has opted for the shutdown for every production facility except the ones dealing in producing the essential goods.
The COVID-19 pandemic has impacted the charcoal market to an extent in negative manner. So, the market has resulted in a lower estimated year-on-year growth rate as compared with 2019 because of the fewer amounts of activities of the sectors associated with the charcoal market. However, the growth has been high after the market has opened after COVID-19, and it is expected that there would be considerable growth in the sector owing to higher demand of barbequed food. And this factor is further expected to drive the overall growth of the market.
Manufacturers are making various strategic decisions to bounce back post-COVID-19. The players are conducting multiple research and development activities to improve the technology involved in the charcoal. With this, the companies will bring advanced technologies to the market. In addition, government initiatives for usage of electric vehicle has led to the market's growth
Recent Development
- In March 2022, Kingsford Products Company, a subsidiary of The Clorox Company launched new product line of signature flavored charcoals and hardwood pellets. The main objective of this product launch is to improve the grilling experience with various flavor and aroma. This will improve the product portfolio of the company
Global Charcoal Market Scope
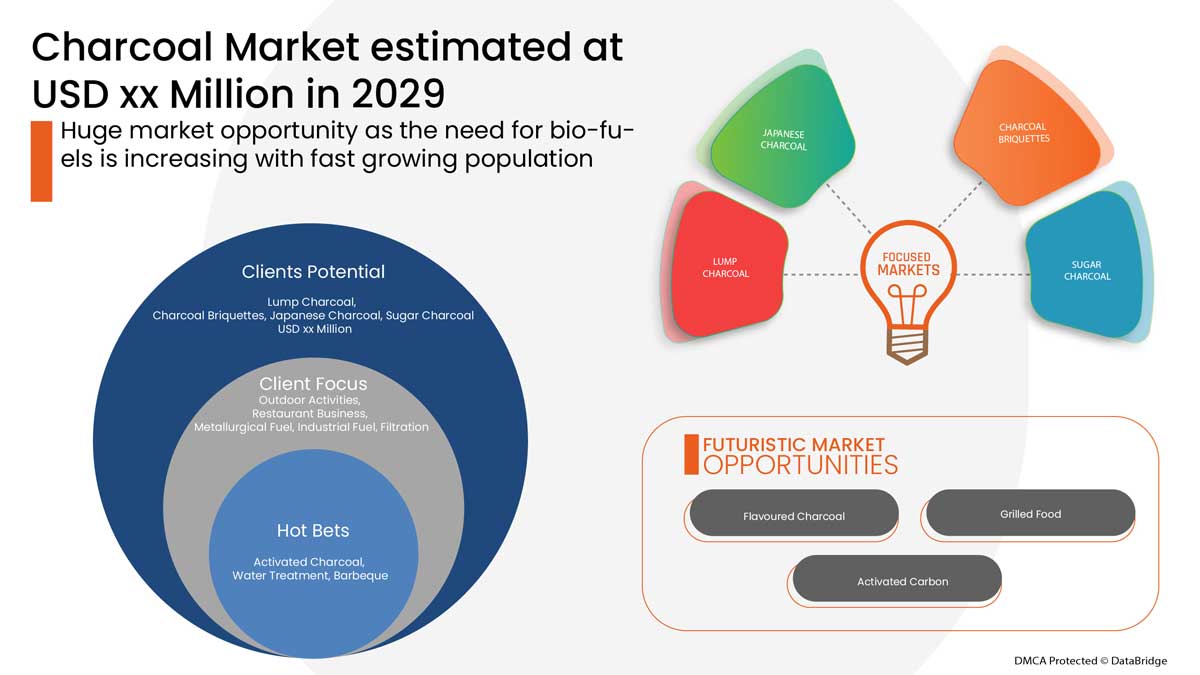
The charcoal market is segmented on the basis of product and application. The growth amongst these segments will help you analyze meagre growth segments in the industries and provide the users with a valuable market overview and market insights to help them make strategic decisions for identifying core market applications.
Product
- Lump Charcoal
- Charcoal Briquettes
- Japanese Charcoal
- Sugar Charcoal
- Others
On the basis of product, the global charcoal market is segmented into lump charcoal, charcoal briquettes, Japanese charcoal, sugar charcoal and others.
Application
- Outdoor Activities
- Restaurant Business
- Metallurgical Fuel
- Industrial Fuel
- Filtration
- Others
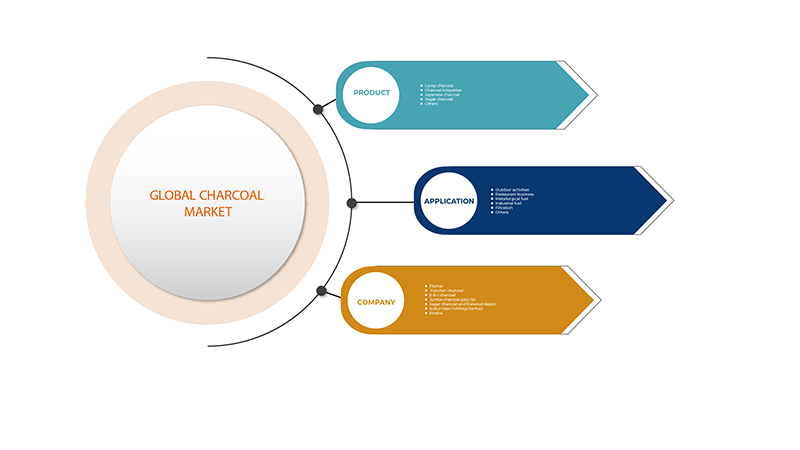
On the basis of application, the global charcoal market has been segmented into below outdoor activities, restaurant business, metallurgical fuel, industrial fuel, filtration and others.
Charcoal Market Regional Analysis/Insights
The charcoal market is analysed and market size insights and trends are provided by country, product and application as referenced above.
The countries covered in the charcoal market report are U.S., Canada and Mexico in North America, Germany, France, U.K., Netherlands, Switzerland, Belgium, Russia, Italy, Spain, Turkey, Rest of Europe in Europe, China, Japan, India, South Korea, Singapore, Malaysia, Australia, Thailand, Indonesia, Philippines, Hong Kong, Taiwan, Rest of Asia-Pacific (APAC) in the Asia-Pacific (APAC), Saudi Arabia, U.A.E, South Africa, Egypt, Israel, Rest of Middle East and Africa (MEA) as a part of Middle East and Africa (MEA), Brazil, Argentina and Rest of South America as part of South America.
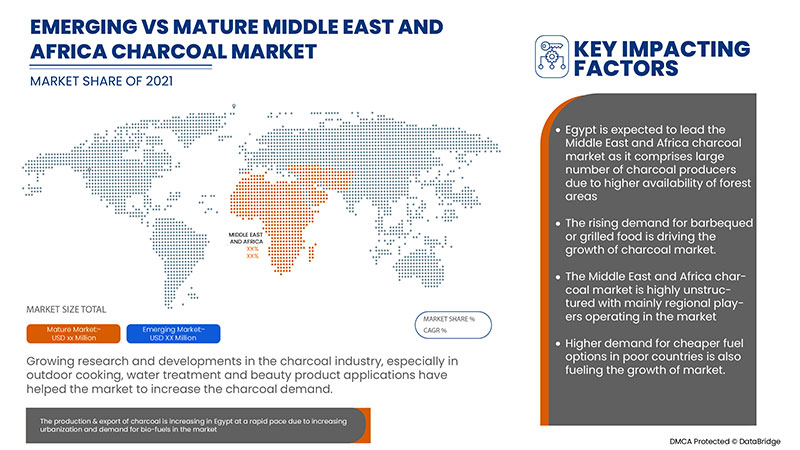
Middle East and Africa region dominates the charcoal market because it has demonstrated strong demand of industrial waste and water treatment using activated carbon.
Egypt dominates in the Middle East and Africa region owing to the massive demand for cheaper and efficient wood fuel in this country.
The country section of the report also provides individual market impacting factors and changes in market regulation that impact the current and future trends of the market. Data points like down-stream and upstream value chain analysis, technical trends and porter's five forces analysis, case studies are some of the pointers used to forecast the market scenario for individual countries. Also, the presence and availability of global brands and their challenges faced due to large or scarce competition from local and domestic brands, impact of domestic tariffs and trade routes are considered while providing forecast analysis of the country data.
Competitive Landscape and Charcoal Market Share Analysis
The charcoal market competitive landscape provides details by competitor. Details included are company overview, company financials, revenue generated, market potential, investment in research and development, new market initiatives, global presence, production sites and facilities, production capacities, company strengths and weaknesses, product launch, product width and breadth, application dominance. The above data points provided are only related to the companies' focus related to charcoal market.
Some of the major players operating in the charcoal market are Plantar, Rancher Charcoal, E & C Charcoal, Jumbo Charcoal (Pty) Ltd., Sagar Charcoal and Firewood Depot, Subur Tiasa Holdings Berhad, Etosha , The Clorox Company, Fire & Flavor, Timber Charcoal Company LLC, FogoCharcoal.com, NamCo Charcoal and Timber Products, Namchar , Mesjaya Sdn Bhd, Cook In Wood, maurobera.com, Royal Oak Enterprises, LLC., Duraflame, Inc.
SKU-
Obtenha acesso online ao relatório sobre a primeira nuvem de inteligência de mercado do mundo

- Painel interativo de análise de dados
- Painel de análise da empresa para oportunidades de elevado potencial de crescimento
- Acesso de analista de pesquisa para personalização e customização. consultas
- Análise da concorrência com painel interativo
- Últimas notícias, atualizações e atualizações Análise de tendências
- Aproveite o poder da análise de benchmark para um rastreio abrangente da concorrência
Índice
1 INTRODUÇÃO
1.1 OBJETIVOS DO ESTUDO
1.2 DEFINIÇÃO DE MERCADO
1.3 VISÃO GERAL DO MERCADO GLOBAL DE CARVÃO VEGETAL
1.4 MOEDA E PREÇOS
1.5 LIMITAÇÕES
1.6 MERCADOS COBERTOS
2 SEGMENTAÇÃO DE MERCADO
2.1 MERCADOS COBERTOS
2.2 ÂMBITO GEOGRÁFICO
2,3 ANOS CONSIDERADOS PARA O ESTUDO
2.4 MODELO DE VALIDAÇÃO DE DADOS TRIPÉ DBMR
2.5 ENTREVISTAS PRINCIPAIS COM PRINCIPAIS LÍDERES DE OPINIÃO
2.6 GRADE DE POSIÇÃO DE MERCADO DBMR
2.7 ANÁLISE DA PARTICIPAÇÃO DO FORNECEDOR
2.8 MODELAGEM MULTIVARIADA
2.9 CURVA DO CRONOGRAMA DO PRODUTO
2.1 MATRIZ DE DESAFIOS DE MERCADO
2.11 FONTES SECUNDÁRIAS
2.12 PREMISSAS
3 RESUMO EXECUTIVO
4 INSIGHTS PREMIUM
4.1 ANÁLISE DE PRODUÇÃO E CONSUMO
4.2 CENÁRIO DE IMPORTAÇÃO E EXPORTAÇÃO
4.3 COBERTURA DA PRODUÇÃO DE MATÉRIA-PRIMA
4.4 AVANÇOS TECNOLÓGICOS DOS FABRICANTES
4.5 LISTA DE COMPRADORES PRINCIPAIS POR REGIÃO
4.5.1 AMÉRICA DO NORTE
4.5.2 EUROPA
4.5.3 ÁSIA-PACÍFICO
4.5.4 AMÉRICA DO SUL
4.5.5 ORIENTE MÉDIO E ÁFRICA
4.6 AS CINCO FORÇAS DE PORTER
4.7 CRITÉRIOS DE SELEÇÃO DE FORNECEDORES
4.8 ANÁLISE PESTEL
4.9 COBERTURA REGULAMENTAR
5 ANÁLISE DA CADEIA DE SUPRIMENTOS
5.1 VISÃO GERAL
5.2 CENÁRIO DE CUSTOS LOGÍSTICOS
5.3 IMPORTANCE OF LOGISTICS SERVICE PROVIDERS
6 CLIMATE CHANGE SCENARIO
6.1 ENVIRONMENTAL CONCERNS
6.2 INDUSTRY RESPONSE
6.3 GOVERNMENT'S ROLE
6.4 ANALYST RECOMMENDATION
7 MARKET OVERVIEW
7.1 DRIVERS
7.1.1 AN INCREASE IN URBANIZATION AND RAPID INDUSTRIALIZATION HAS CREATED SUBSTANTIAL DEMAND FOR CHARCOAL
7.1.2 RISE IN CONSUMPTION OF BARBEQUED FOOD
7.1.3 INCREASING ALTERNATIVES FOR ENERGY AND RELIANCE ON WOOD HAS GAINED MOMENTUM
7.1.4 GROWING DEMAND FOR INDUSTRIAL WASTE AND WATER TREATMENT USING ACTIVATED CARBON
7.2 RESTRAINTS
7.2.1 STRINGENT GOVERNMENT REGULATIONS FOR CHARCOAL PRODUCTION
7.2.2 HIGHER ENVIRONMENTAL IMPACTS OF CHARCOAL PRODUCTION IN TROPICAL ECOSYSTEM
7.3 OPPORTUNITIES
7.3.1 SHIFT TOWARDS IMPROVED STOVE AND HIGHER EFFICIENCIES
7.3.2 INCREASE IN SOURCE OF INCOME FOR RURAL DWELLERS WITH CHARCOAL PRODUCTION
7.3.3 HIGH PREFERENCE FOR GRILLED FOODS ACROSS THE REGION
7.4 CHALLENGES
7.4.1 INADEQUATE BASELINE INFORMATION FOR POLICY FORMULATION RELATED TO CHARCOAL
7.4.2 LACK OF AWARENESS OF THE ENVIRONMENTAL EFFECTS OF CHARCOAL PRODUCTION
8 IMPACT OF COVID-19 ON THE GLOBAL CHARCOAL MARKET
8.1 AFTERMATH AND GOVERNMENT INITIATIVES FOR THE CHARCOAL MARKET
8.2 STRATEGIC DECISIONS FOR MANUFACTURERS AFTER COVID-19 TO GAIN COMPETITIVE MARKET SHARE
8.3 IMPACT ON DEMAND AND PRICE
8.4 IMPACT ON SUPPLY CHAIN
8.5 CONCLUSION
9 GLOBAL CHARCOAL MARKET, BY PRODUCT
9.1 OVERVIEW
9.2 LUMP CHARCOAL
9.3 CHARCOAL BRIQUETTES
9.4 JAPANESE CHARCOAL
9.5 SUGAR CHARCOAL
9.6 OTHERS
10 GLOBAL CHARCOAL MARKET, BY APPLICATION
10.1 OVERVIEW
10.2 OUTDOOR ACTIVITIES
10.3 RESTAURANT BUSINESS
10.4 METALLURGICAL FUEL
10.5 INDUSTRIAL FUEL
10.6 FILTRATION
10.7 OTHERS
11 GLOBAL CHARCOAL MARKET, BY REGION
11.1 OVERVIEW
11.2 MIDDLE EAST & AFRICA
11.2.1 EGYPT
11.2.2 SOUTH AFRICA
11.2.3 SAUDI ARABIA
11.2.4 U.A.E.
11.2.5 ISRAEL
11.2.6 REST OF MIDDLE EAST & AFRICA
11.3 ASIA-PACIFIC
11.3.1 CHINA
11.3.2 INDIA
11.3.3 JAPAN
11.3.4 SOUTH KOREA
11.3.5 THAILAND
11.3.6 INDONESIA
11.3.7 AUSTRALIA
11.3.8 MALAYSIA
11.3.9 SINGAPORE
11.3.10 PHILIPPINES
11.3.11 HONG KONG
11.3.12 TAIWAN
11.3.13 REST OF ASIA-PACIFIC
11.4 SOUTH AMERICA
11.4.1 BRAZIL
11.4.2 ARGENTINA
11.4.3 REST OF SOUTH AMERICA
11.5 NORTH AMERICA
11.5.1 U.S.
11.5.2 CANADA
11.5.3 MEXICO
11.6 EUROPE
11.6.1 GERMANY
11.6.2 FRANCE
11.6.3 U.K.
11.6.4 ITALY
11.6.5 NETHERLANDS
11.6.6 SPAIN
11.6.7 RUSSIA
11.6.8 BELGIUM
11.6.9 SWITZERLAND
11.6.10 TURKEY
11.6.11 REST OF EUROPE
12 GLOBAL CHARCOAL MARKET: COMPANY LANDSCAPE
12.1 COMPANY SHARE ANALYSIS: GLOBAL
12.2 COMPANY SHARE ANALYSIS: ASIA-PACIFIC
12.3 COMPANY SHARE ANALYSIS: NORTH AMERICA
12.4 COMPANY SHARE ANALYSIS: EUROPE
13 SWOT ANALYSIS
14 COMPANY PROFILE
14.1 THE CLOROX COMPANY
14.1.1 COMPANY SNAPSHOT
14.1.2 REVENUE ANALYSIS
14.1.3 COMPANY SHARE ANALYSIS
14.1.4 PRODUCT PORTFOLIO
14.1.5 RECENT DEVELOPMENTS
14.2 ROYAL OAK ENTERPRISES, LLC.
14.2.1 COMPANY SNAPSHOT
14.2.2 COMPANY SHARE ANALYSIS
14.2.3 PRODUCT PORTFOLIO
14.2.4 RECENT DEVELOPMENT
14.3 DURAFLAME, INC.
14.3.1 COMPANY SNAPSHOT
14.3.2 COMPANY SHARE ANALYSIS
14.3.3 PRODUCT PORTFOLIO
14.3.4 RECENT DEVELOPMENT
14.4 SUBUR TIASA HOLDINGS BERHAD
14.4.1 RESUMO DA EMPRESA
14.4.2 ANÁLISE DE RECEITA
14.4.3 ANÁLISE DAS AÇÕES DA EMPRESA
14.4.4 PORTFÓLIO DE PRODUTOS
14.4.5 DESENVOLVIMENTO RECENTE
14.5 NAMCO CARVÃO E PRODUTOS DE MADEIRA
14.5.1 RESUMO DA EMPRESA
14.5.2 ANÁLISE DAS AÇÕES DA EMPRESA
14.5.3 PORTFÓLIO DE PRODUTOS
14.5.4 DESENVOLVIMENTO RECENTE
14.6 COZINHAR EM LENHA
14.6.1 RESUMO DA EMPRESA
14.6.2 PORTFÓLIO DE PRODUTOS
14.6.3 DESENVOLVIMENTO RECENTE
14.7 E&C CARVÃO
14.7.1 RESUMO DA EMPRESA
14.7.2 PORTFÓLIO DE PRODUTOS
14.7.3 DESENVOLVIMENTO RECENTE
14.8 ETOSHA
14.8.1 RESUMO DA EMPRESA
14.8.2 PORTFÓLIO DE PRODUTOS
14.8.3 DESENVOLVIMENTO RECENTE
14.9 FOGO E SABOR
14.9.1 RESUMO DA EMPRESA
14.9.2 PORTFÓLIO DE PRODUTOS
14.9.3 DESENVOLVIMENTO RECENTE
14.1 FOGOCHARCOAL.COM
14.10.1 RESUMO DA EMPRESA
14.10.2 PORTFÓLIO DE PRODUTOS
14.10.3 DESENVOLVIMENTO RECENTE
14.11 JUMBO CHARCOAL (PTY) LTD.
14.11.1 RESUMO DA EMPRESA
14.11.2 PORTFÓLIO DE PRODUTOS
14.11.3 DESENVOLVIMENTO RECENTE
14.12 MAUROBERA.COM
14.12.1 RESUMO DA EMPRESA
14.12.2 PORTFÓLIO DE PRODUTOS
14.12.3 DESENVOLVIMENTO RECENTE
14.13 MESJAYA SDN BHD
14.13.1 RESUMO DA EMPRESA
14.13.2 PORTFÓLIO DE PRODUTOS
14.13.3 DESENVOLVIMENTO RECENTE
14.14 NAMCHAR
14.14.1 RESUMO DA EMPRESA
14.14.2 PORTFÓLIO DE PRODUTOS
14.14.3 DESENVOLVIMENTO RECENTE
14.15 CARVÃO RANCHER
14.15.1 FOTOGRAFIA DA EMPRESA
14.15.2 PORTFÓLIO DE PRODUTOS
14.15.3 DESENVOLVIMENTO RECENTE
14.16 DEPÓSITO DE CARVÃO E LENHA DE SAGAR
14.16.1 RESUMO DA EMPRESA
14.16.2 PORTFÓLIO DE PRODUTOS
14.16.3 DESENVOLVIMENTO RECENTE
14.17 TIMBER CHARCOAL CO. LLC
14.17.1 RESUMO DA EMPRESA
14.17.2 PORTFÓLIO DE PRODUTOS
14.17.3 DESENVOLVIMENTO RECENTE
14.18 PLANTAR
14.18.1 RESUMO DA EMPRESA
14.18.2 PORTFÓLIO DE SOLUÇÕES
14.18.3 DESENVOLVIMENTO RECENTE
15 QUESTIONÁRIO
16 RELATÓRIOS RELACIONADOS
Lista de Tabela
TABELA 1 VALORES DE CERTAS CARACTERÍSTICAS DO CARVÃO VEGETAL DE ACORDO COM A NORMA EUROPEIA EN 1860-2 E A NORMA ALEMÃ DIN 51749
TABELA 2 CUSTOS DE TRANSPORTE DE CARVÃO COM DISTÂNCIA PERCORRIDA ATRAVÉS DE DIFERENTES DISTRITOS DA TAILÂNDIA ESTÃO ABAIXO:
TABELA 3 MERCADO GLOBAL DE CARVÃO VEGETAL, POR PRODUTO, 2020-2029 (US$ MILHÕES)
TABELA 4 CARVÃO VEGETAL EM GRÃOS NO MERCADO GLOBAL DE CARVÃO VEGETAL, POR REGIÃO, 2020-2029 (US$ MILHÕES)
TABELA 5 BRIQUETES DE CARVÃO VEGETAL NO MERCADO GLOBAL DE CARVÃO VEGETAL, POR REGIÃO, 2020-2029 (US$ MILHÕES)
TABELA 6 CARVÃO VEGETAL JAPONÊS NO MERCADO GLOBAL DE CARVÃO VEGETAL, POR REGIÃO, 2020-2029 (US$ MILHÕES)
TABELA 7 CARVÃO VEGETAL DE AÇÚCAR NO MERCADO GLOBAL DE CARVÃO VEGETAL, POR REGIÃO, 2020-2029 (US$ MILHÕES)
TABELA 8 OUTROS INDUSTRIAIS NO MERCADO GLOBAL DE CARVÃO VEGETAL, POR REGIÃO, 2020-2029 (US$ MILHÕES)
TABELA 9 MERCADO GLOBAL DE CARVÃO VEGETAL, POR APLICAÇÃO, 2020-2029 (US$ MILHÕES)
TABELA 10 ATIVIDADES GLOBAIS AO AR LIVRE NO MERCADO DE CARVÃO VEGETAL, POR REGIÃO, 2020-2029 (US$ MILHÕES)
TABELA 11 NEGÓCIOS GLOBAIS DE RESTAURANTES NO MERCADO DE CARVÃO VEGETAL, POR REGIÃO, 2020-2029 (US$ MILHÕES)
TABELA 12 MERCADO GLOBAL DE COMBUSTÍVEIS METALÚRGICOS EM CARVÃO VEGETAL, POR REGIÃO, 2020-2029 (US$ MILHÕES)
TABELA 13 MERCADO GLOBAL DE COMBUSTÍVEIS INDUSTRIAL DE CARVÃO VEGETAL, POR REGIÃO, 2020-2029 (US$ MILHÕES
TABELA 14 FILTRAÇÃO GLOBAL NO MERCADO DE CARVÃO VEGETAL, POR REGIÃO, 2020-2029 (US$ MILHÕES)
TABELA 15 OUTROS MERCADOS GLOBAIS DE CARVÃO VEGETAL, POR REGIÃO, 2020-2029 (US$ MILHÕES)
TABELA 17 MERCADO DE CARVÃO VEGETAL NO ORIENTE MÉDIO E ÁFRICA, POR PAÍS, 2020-2029 (US$ MILHÕES)
TABELA 18 MERCADO DE CARVÃO VEGETAL NO ORIENTE MÉDIO E ÁFRICA, POR PRODUTO, 2020-2029 (US$ MILHÕES)
TABELA 19 MERCADO DE CARVÃO VEGETAL NO ORIENTE MÉDIO E ÁFRICA, POR APLICAÇÃO, 2020-2029 (US$ MILHÕES)
TABELA 20 MERCADO DE CARVÃO VEGETAL DO EGITO, POR PRODUTO, 2020-2029 (US$ MILHÕES)
TABELA 21 MERCADO DE CARVÃO VEGETAL DO EGITO, POR APLICAÇÃO, 2020-2029 (US$ MILHÕES)
TABELA 22 MERCADO DE CARVÃO VEGETAL DA ÁFRICA DO SUL, POR PRODUTO, 2020-2029 (US$ MILHÕES)
TABELA 23 MERCADO DE CARVÃO VEGETAL DA ÁFRICA DO SUL, POR APLICAÇÃO, 2020-2029 (US$ MILHÕES)
TABELA 24 MERCADO DE CARVÃO VEGETAL DA ARÁBIA SAUDITA, POR PRODUTO, 2020-2029 (US$ MILHÕES)
TABELA 25 MERCADO DE CARVÃO VEGETAL DA ARÁBIA SAUDITA, POR APLICAÇÃO, 2020-2029 (US$ MILHÕES)
TABELA 26 MERCADO DE CARVÃO VEGETAL DOS EAU, POR PRODUTO, 2020-2029 (MILHÕES DE DÓLARES)
TABELA 27 MERCADO DE CARVÃO VEGETAL DOS EAU, POR APLICAÇÃO, 2020-2029 (US$ MILHÕES)
TABELA 28 MERCADO DE CARVÃO VEGETAL DE ISRAEL, POR PRODUTO, 2020-2029 (US$ MILHÕES)
TABELA 29 MERCADO DE CARVÃO VEGETAL DE ISRAEL, POR APLICAÇÃO, 2020-2029 (US$ MILHÕES)
TABELA 30 MERCADO DE CARVÃO VEGETAL DO RESTANTE DO ORIENTE MÉDIO E ÁFRICA, POR PRODUTO, 2020-2029 (US$ MILHÕES)
TABELA 31 MERCADO DE CARVÃO VEGETAL DA ÁSIA-PACÍFICO, POR PAÍS, 2020-2029 (US$ MILHÕES)
TABELA 32 MERCADO DE CARVÃO VEGETAL DA ÁSIA-PACÍFICO, POR PRODUTO, 2020-2029 (US$ MILHÕES)
TABELA 33 MERCADO DE CARVÃO VEGETAL DA ÁSIA-PACÍFICO, POR APLICAÇÃO, 2020-2029 (US$ MILHÕES)
TABELA 34 MERCADO DE CARVÃO VEGETAL DA CHINA, POR PRODUTO, 2020-2029 (US$ MILHÕES)
TABELA 35 MERCADO DE CARVÃO VEGETAL DA CHINA, POR APLICAÇÃO, 2020-2029 (US$ MILHÕES)
TABELA 36 MERCADO DE CARVÃO VEGETAL DA ÍNDIA, POR PRODUTO, 2020-2029 (US$ MILHÕES)
TABELA 37 MERCADO DE CARVÃO VEGETAL DA ÍNDIA, POR APLICAÇÃO, 2020-2029 (US$ MILHÕES)
TABELA 38 MERCADO DE CARVÃO VEGETAL DO JAPÃO, POR PRODUTO, 2020-2029 (US$ MILHÕES)
TABELA 39 MERCADO DE CARVÃO VEGETAL DO JAPÃO, POR APLICAÇÃO, 2020-2029 (US$ MILHÕES)
TABELA 40 MERCADO DE CARVÃO VEGETAL DA COREIA DO SUL, POR PRODUTO, 2020-2029 (US$ MILHÕES)
TABELA 41 MERCADO DE CARVÃO VEGETAL DA COREIA DO SUL, POR APLICAÇÃO, 2020-2029 (MILHÕES DE DÓLARES)
TABELA 42 MERCADO DE CARVÃO VEGETAL DA TAILÂNDIA, POR PRODUTO, 2020-2029 (US$ MILHÕES)
TABELA 43 MERCADO DE CARVÃO VEGETAL DA TAILÂNDIA, POR APLICAÇÃO, 2020-2029 (US$ MILHÕES)
TABELA 44 MERCADO DE CARVÃO VEGETAL DA INDONÉSIA, POR PRODUTO, 2020-2029 (US$ MILHÕES)
TABELA 45 MERCADO DE CARVÃO VEGETAL DA INDONÉSIA, POR APLICAÇÃO, 2020-2029 (US$ MILHÕES)
TABELA 46 MERCADO DE CARVÃO VEGETAL DA AUSTRÁLIA, POR PRODUTO, 2020-2029 (US$ MILHÕES)
TABELA 47 MERCADO DE CARVÃO VEGETAL DA AUSTRÁLIA, POR APLICAÇÃO, 2020-2029 (US$ MILHÕES)
TABELA 48 MERCADO DE CARVÃO VEGETAL DA MALÁSIA, POR PRODUTO, 2020-2029 (US$ MILHÕES)
TABELA 49 MERCADO DE CARVÃO VEGETAL DA MALÁSIA, POR APLICAÇÃO, 2020-2029 (MILHÕES DE DÓLARES)
TABELA 50 MERCADO DE CARVÃO VEGETAL DE SINGAPURA, POR PRODUTO, 2020-2029 (US$ MILHÕES)
TABELA 51 MERCADO DE CARVÃO VEGETAL DE SINGAPURA, POR APLICAÇÃO, 2020-2029 (US$ MILHÕES)
TABELA 52 MERCADO DE CARVÃO VEGETAL DAS FILIPINAS, POR PRODUTO, 2020-2029 (US$ MILHÕES)
TABELA 53 MERCADO DE CARVÃO VEGETAL DAS FILIPINAS, POR APLICAÇÃO, 2020-2029 (US$ MILHÕES)
TABELA 54 MERCADO DE CARVÃO VEGETAL DE HONG KONG, POR PRODUTO, 2020-2029 (US$ MILHÕES)
TABELA 55 MERCADO DE CARVÃO VEGETAL DE HONG KONG, POR APLICAÇÃO, 2020-2029 (US$ MILHÕES)
TABELA 56 MERCADO DE CARVÃO VEGETAL DE TAIWAN, POR PRODUTO, 2020-2029 (US$ MILHÕES)
TABELA 57 MERCADO DE CARVÃO VEGETAL DE TAIWAN, POR APLICAÇÃO, 2020-2029 (US$ MILHÕES)
TABELA 58 RESTANTE DO MERCADO DE CARVÃO VEGETAL DA ÁSIA-PACÍFICO, POR PRODUTO, 2020-2029 (US$ MILHÕES)
TABELA 59 MERCADO DE CARVÃO VEGETAL DA AMÉRICA DO SUL, POR PAÍS, 2020-2029 (US$ MILHÕES)
TABELA 60 MERCADO DE CARVÃO VEGETAL DA AMÉRICA DO SUL, POR PRODUTO, 2020-2029 (US$ MILHÕES)
TABELA 61 MERCADO DE CARVÃO VEGETAL DA AMÉRICA DO SUL, POR APLICAÇÃO, 2020-2029 (US$ MILHÕES)
TABELA 62 MERCADO BRASILEIRO DE CARVÃO VEGETAL, POR PRODUTO, 2020-2029 (US$ MILHÕES)
TABELA 63 MERCADO BRASILEIRO DE CARVÃO VEGETAL, POR APLICAÇÃO, 2020-2029 (USD MILHÕES)
TABELA 64 MERCADO DE CARVÃO VEGETAL DA ARGENTINA, POR PRODUTO, 2020-2029 (US$ MILHÕES)
TABELA 65 MERCADO DE CARVÃO VEGETAL DA ARGENTINA, POR APLICAÇÃO, 2020-2029 (US$ MILHÕES)
TABELA 66 MERCADO DE CARVÃO VEGETAL DO RESTO DA AMÉRICA DO SUL, POR PRODUTO, 2020-2029 (US$ MILHÕES)
TABELA 67 MERCADO DE CARVÃO VEGETAL DA AMÉRICA DO NORTE, POR PAÍS, 2020-2029 (US$ MILHÕES)
TABELA 68 MERCADO DE CARVÃO VEGETAL DA AMÉRICA DO NORTE, POR PRODUTO, 2020-2029 (US$ MILHÕES)
TABELA 69 MERCADO DE CARVÃO VEGETAL DA AMÉRICA DO NORTE, POR APLICAÇÃO, 2020-2029 (US$ MILHÕES)
TABELA 70 MERCADO DE CARVÃO VEGETAL DOS EUA, POR PRODUTO, 2020-2029 (US$ MILHÕES)
TABELA 71 MERCADO DE CARVÃO VEGETAL DOS EUA, POR APLICAÇÃO, 2020-2029 (US$ MILHÕES)
TABELA 72 MERCADO DE CARVÃO VEGETAL DO CANADÁ, POR PRODUTO, 2020-2029 (MILHÕES DE DÓLARES)
TABELA 73 MERCADO DE CARVÃO VEGETAL DO CANADÁ, POR APLICAÇÃO, 2020-2029 (MILHÕES DE DÓLARES)
TABELA 74 MERCADO DE CARVÃO VEGETAL DO MÉXICO, POR PRODUTO, 2020-2029 (US$ MILHÕES)
TABELA 75 MERCADO DE CARVÃO VEGETAL DO MÉXICO, POR APLICAÇÃO, 2020-2029 (US$ MILHÕES)
TABELA 76 MERCADO DE CARVÃO VEGETAL NA EUROPA, POR PAÍS, 2020-2029 (MILHÕES DE USD)
TABELA 77 MERCADO DE CARVÃO VEGETAL NA EUROPA, POR PRODUTO, 2020-2029 (MILHÕES DE USD)
TABELA 78 MERCADO DE CARVÃO VEGETAL NA EUROPA, POR APLICAÇÃO, 2020-2029 (MILHÕES DE USD)
TABELA 79 MERCADO DE CARVÃO VEGETAL DA ALEMANHA, POR PRODUTO, 2020-2029 (US$ MILHÕES)
TABELA 80 MERCADO DE CARVÃO VEGETAL DA ALEMANHA, POR APLICAÇÃO, 2020-2029 (MILHÕES DE DÓLARES)
TABELA 81 MERCADO DE CARVÃO VEGETAL DA FRANÇA, POR PRODUTO, 2020-2029 (MILHÕES DE DÓLARES)
TABELA 82 MERCADO DE CARVÃO VEGETAL DA FRANÇA, POR APLICAÇÃO, 2020-2029 (MILHÕES DE DÓLARES)
TABELA 83 MERCADO DE CARVÃO VEGETAL DO REINO UNIDO, POR PRODUTO, 2020-2029 (MILHÕES DE DÓLARES)
TABELA 84 MERCADO DE CARVÃO VEGETAL DO REINO UNIDO, POR APLICAÇÃO, 2020-2029 (MILHÕES DE DÓLARES)
TABELA 85 MERCADO DE CARVÃO VEGETAL DA ITÁLIA, POR PRODUTO, 2020-2029 (US$ MILHÕES)
TABELA 86 MERCADO DE CARVÃO VEGETAL DA ITÁLIA, POR APLICAÇÃO, 2020-2029 (US$ MILHÕES)
TABELA 87 MERCADO DE CARVÃO VEGETAL HOLANDÊS, POR PRODUTO, 2020-2029 (US$ MILHÕES)
TABELA 88 MERCADO DE CARVÃO VEGETAL HOLANDÊS, POR APLICAÇÃO, 2020-2029 (MILHÕES DE DÓLARES)
TABELA 89 MERCADO DE CARVÃO VEGETAL DA ESPANHA, POR PRODUTO, 2020-2029 (US$ MILHÕES)
TABELA 90 MERCADO DE CARVÃO VEGETAL DA ESPANHA, POR APLICAÇÃO, 2020-2029 (US$ MILHÕES)
TABELA 91 MERCADO DE CARVÃO VEGETAL DA RÚSSIA, POR PRODUTO, 2020-2029 (US$ MILHÕES)
TABELA 92 MERCADO DE CARVÃO VEGETAL DA RÚSSIA, POR APLICAÇÃO, 2020-2029 (US$ MILHÕES)
TABELA 93 MERCADO DE CARVÃO VEGETAL DA BÉLGICA, POR PRODUTO, 2020-2029 (US$ MILHÕES)
TABELA 94 MERCADO DE CARVÃO VEGETAL DA BÉLGICA, POR APLICAÇÃO, 2020-2029 (US$ MILHÕES)
TABELA 95 MERCADO DE CARVÃO VEGETAL DA SUÍÇA, POR PRODUTO, 2020-2029 (US$ MILHÕES)
TABELA 96 MERCADO DE CARVÃO VEGETAL DA SUÍÇA, POR APLICAÇÃO, 2020-2029 (US$ MILHÕES)
TABELA 97 MERCADO DE CARVÃO VEGETAL DA TURQUIA, POR PRODUTO, 2020-2029 (US$ MILHÕES)
TABELA 98 MERCADO DE CARVÃO VEGETAL DA TURQUIA, POR APLICAÇÃO, 2020-2029 (US$ MILHÕES)
TABELA 99 MERCADO DE CARVÃO VEGETAL NO RESTO DA EUROPA, POR PRODUTO, 2020-2029 (MILHÕES DE USD)
Lista de Figura
FIGURA 1 MERCADO GLOBAL DE CARVÃO VEGETAL: SEGMENTAÇÃO
FIGURA 2 MERCADO GLOBAL DE CARVÃO VEGETAL: TRIANGULAÇÃO DE DADOS
FIGURA 3 MERCADO GLOBAL DE CARVÃO VEGETAL: ANÁLISE DROC
FIGURA 4 MERCADO GLOBAL DE CARVÃO VEGETAL: ANÁLISE DE MERCADO GLOBAL VS. REGIONAL
FIGURA 5 MERCADO GLOBAL DE CARVÃO VEGETAL: ANÁLISE DE PESQUISA DA EMPRESA
FIGURA 6 MERCADO GLOBAL DE CARVÃO VEGETAL: DEMOGRAFIA DA ENTREVISTA
FIGURA 7 MERCADO GLOBAL DE CARVÃO VEGETAL: GRADE DE POSIÇÃO DE MERCADO DBMR
FIGURA 8 MERCADO GLOBAL DE CARVÃO VEGETAL: ANÁLISE DA PARTICIPAÇÃO DOS FORNECEDORES
FIGURA 9 MERCADO GLOBAL DE CARVÃO VEGETAL: SEGMENTAÇÃO
FIGURA 10 O AUMENTO DO CONSUMO DE ALIMENTOS CHURRASCOS DEVE IMPULSIONAR O MERCADO GLOBAL DE CARVÃO VEGETAL NO PERÍODO PREVISTO DE 2022 A 2029
FIGURA 11 O SEGMENTO DE CARVÃO VEGETAL EM GRÃOS DEVE SER REPRESENTANTE DA MAIOR PARCIALIDADE DO MERCADO GLOBAL DE CARVÃO VEGETAL EM 2022 E 2029
FIGURA 12 ORIENTE MÉDIO E ÁFRICA DEVEM DOMINAREM E SEREM A REGIÃO DE CRESCIMENTO MAIS RÁPIDO NO MERCADO GLOBAL DE CARVÃO VEGETAL NO PERÍODO DE PREVISÃO DE 2022 A 2029
FIGURA 13 ORIENTE MÉDIO E ÁFRICA SÃO O MERCADO DE CRESCIMENTO MAIS RÁPIDO PARA FABRICANTES DE CARVÃO VEGETAL NO PERÍODO PREVISTO DE 2022 A 2029
FIGURA 14 QUANTIDADE DE PRODUÇÃO DE CARVÃO VEGETAL POR REGIÃO (2020)
FIGURA 15 PRINCIPAIS IMPORTADORES DE CARVÃO VEGETAL EM 2020
FIGURA 16 PRINCIPAIS EXPORTADORES DE CARVÃO VEGETAL EM 2020
FIGURA 17 MOTIVADORES, RESTRIÇÕES, OPORTUNIDADES E DESAFIOS DO MERCADO GLOBAL DE CARVÃO VEGETAL
FIGURA 18 QUANTIDADE MÉDIA DE PRODUÇÃO DE CARVÃO VEGETAL POR REGIÃO (2019-2020)
FIGURA 19 MERCADO GLOBAL DE CARVÃO VEGETAL: POR PRODUTO, 2021
FIGURA 20 MERCADO GLOBAL DE CARVÃO VEGETAL: POR APLICAÇÃO, 2021
FIGURA 21 MERCADO GLOBAL DE CARVÃO VEGETAL: RESUMO (2021)
FIGURA 22 MERCADO GLOBAL DE CARVÃO VEGETAL: POR REGIÃO (2021)
FIGURA 23 MERCADO GLOBAL DE CARVÃO VEGETAL: POR REGIÃO (2022 E 2029)
FIGURA 24 MERCADO GLOBAL DE CARVÃO VEGETAL: POR REGIÃO (2021 E 2029)
FIGURA 25 MERCADO GLOBAL DE CARVÃO VEGETAL: POR PRODUTO (2022-2029)
FIGURA 26 MERCADO DE CARVÃO VEGETAL NO ORIENTE MÉDIO E ÁFRICA: INSTANTÂNEO (2021)
FIGURA 27 MERCADO DE CARVÃO VEGETAL NO ORIENTE MÉDIO E ÁFRICA: POR PAÍS (2021)
FIGURA 28 MERCADO DE CARVÃO VEGETAL DO ORIENTE MÉDIO E ÁFRICA: POR PAÍS (2022 E 2029)
FIGURA 29 MERCADO DE CARVÃO VEGETAL DO ORIENTE MÉDIO E ÁFRICA: POR PAÍS (2021 E 2029)
FIGURA 30 MERCADO DE CARVÃO VEGETAL NO ORIENTE MÉDIO E ÁFRICA: POR PRODUTO (2022-2029)
FIGURA 31 MERCADO DE CARVÃO VEGETAL DA ÁSIA-PACÍFICO: RESUMO (2021)
FIGURA 32 MERCADO DE CARVÃO VEGETAL DA ÁSIA-PACÍFICO: POR PAÍS (2021)
FIGURA 33 MERCADO DE CARVÃO VEGETAL DA ÁSIA-PACÍFICO: POR PAÍS (2022 E 2029)
FIGURA 34 MERCADO DE CARVÃO VEGETAL DA ÁSIA-PACÍFICO: POR PAÍS (2021 E 2029)
FIGURA 35 MERCADO DE CARVÃO VEGETAL DA ÁSIA-PACÍFICO: POR PRODUTO (2022-2029)
FIGURA 36 MERCADO DE CARVÃO VEGETAL DA AMÉRICA DO SUL: RESUMO (2021)
FIGURA 37 MERCADO DE CARVÃO VEGETAL DA AMÉRICA DO SUL: POR PAÍS (2021)
FIGURA 38 MERCADO DE CARVÃO VEGETAL DA AMÉRICA DO SUL: POR PAÍS (2022 E 2029)
FIGURA 39 MERCADO DE CARVÃO VEGETAL DA AMÉRICA DO SUL: POR PAÍS (2021 E 2029)
FIGURA 40 MERCADO DE CARVÃO VEGETAL DA AMÉRICA DO SUL: POR PRODUTO (2022-2029)
FIGURA 41 MERCADO DE CARVÃO VEGETAL DA AMÉRICA DO NORTE: RESUMO (2021)
FIGURA 42 MERCADO DE CARVÃO VEGETAL DA AMÉRICA DO NORTE: POR PAÍS (2021)
FIGURA 43 MERCADO DE CARVÃO VEGETAL DA AMÉRICA DO NORTE: POR PAÍS (2022 E 2029)
FIGURA 44 MERCADO DE CARVÃO VEGETAL DA AMÉRICA DO NORTE: POR PAÍS (2021 E 2029)
FIGURA 45 MERCADO DE CARVÃO VEGETAL DA AMÉRICA DO NORTE: POR PRODUTO (2022-2029)
FIGURA 46 MERCADO DE CARVÃO VEGETAL DA EUROPA: INSTANTÂNEO (2021)
FIGURA 47 MERCADO DE CARVÃO VEGETAL DA EUROPA: POR PAÍS (2021)
FIGURA 48 MERCADO DE CARVÃO VEGETAL DA EUROPA: POR PAÍS (2022 E 2029)
FIGURA 49 MERCADO DE CARVÃO VEGETAL DA EUROPA: POR PAÍS (2021 E 2029)
FIGURA 50 MERCADO DE CARVÃO VEGETAL DA EUROPA: POR PRODUTO (2022-2029)
FIGURA 51 MERCADO GLOBAL DE CARVÃO VEGETAL: PARTICIPAÇÃO DA EMPRESA EM 2021 (%)
FIGURA 52 MERCADO DE CARVÃO VEGETAL DA ÁSIA-PACÍFICO: PARTICIPAÇÃO DA EMPRESA EM 2021 (%)
FIGURA 53 MERCADO DE CARVÃO VEGETAL DA AMÉRICA DO NORTE: PARTICIPAÇÃO DA EMPRESA EM 2021 (%)
FIGURA 54 MERCADO DE CARVÃO VEGETAL DA EUROPA: PARTICIPAÇÃO DA EMPRESA EM 2021 (%)
Metodologia de Investigação
A recolha de dados e a análise do ano base são feitas através de módulos de recolha de dados com amostras grandes. A etapa inclui a obtenção de informações de mercado ou dados relacionados através de diversas fontes e estratégias. Inclui examinar e planear antecipadamente todos os dados adquiridos no passado. Da mesma forma, envolve o exame de inconsistências de informação observadas em diferentes fontes de informação. Os dados de mercado são analisados e estimados utilizando modelos estatísticos e coerentes de mercado. Além disso, a análise da quota de mercado e a análise das principais tendências são os principais fatores de sucesso no relatório de mercado. Para saber mais, solicite uma chamada de analista ou abra a sua consulta.
A principal metodologia de investigação utilizada pela equipa de investigação do DBMR é a triangulação de dados que envolve a mineração de dados, a análise do impacto das variáveis de dados no mercado e a validação primária (especialista do setor). Os modelos de dados incluem grelha de posicionamento de fornecedores, análise da linha de tempo do mercado, visão geral e guia de mercado, grelha de posicionamento da empresa, análise de patentes, análise de preços, análise da quota de mercado da empresa, normas de medição, análise global versus regional e de participação dos fornecedores. Para saber mais sobre a metodologia de investigação, faça uma consulta para falar com os nossos especialistas do setor.
Personalização disponível
A Data Bridge Market Research é líder em investigação formativa avançada. Orgulhamo-nos de servir os nossos clientes novos e existentes com dados e análises que correspondem e atendem aos seus objetivos. O relatório pode ser personalizado para incluir análise de tendências de preços de marcas-alvo, compreensão do mercado para países adicionais (solicite a lista de países), dados de resultados de ensaios clínicos, revisão de literatura, mercado remodelado e análise de base de produtos . A análise de mercado dos concorrentes-alvo pode ser analisada desde análises baseadas em tecnologia até estratégias de carteira de mercado. Podemos adicionar quantos concorrentes necessitar de dados no formato e estilo de dados que procura. A nossa equipa de analistas também pode fornecer dados em tabelas dinâmicas de ficheiros Excel em bruto (livro de factos) ou pode ajudá-lo a criar apresentações a partir dos conjuntos de dados disponíveis no relatório.

