Middle East And Africa Instrument Cluster Market
Tamanho do mercado em biliões de dólares
CAGR :
% 
 USD
878.79 Million
USD
1,221.31 Million
2025
2033
USD
878.79 Million
USD
1,221.31 Million
2025
2033
| 2026 –2033 | |
| USD 878.79 Million | |
| USD 1,221.31 Million | |
| % | |
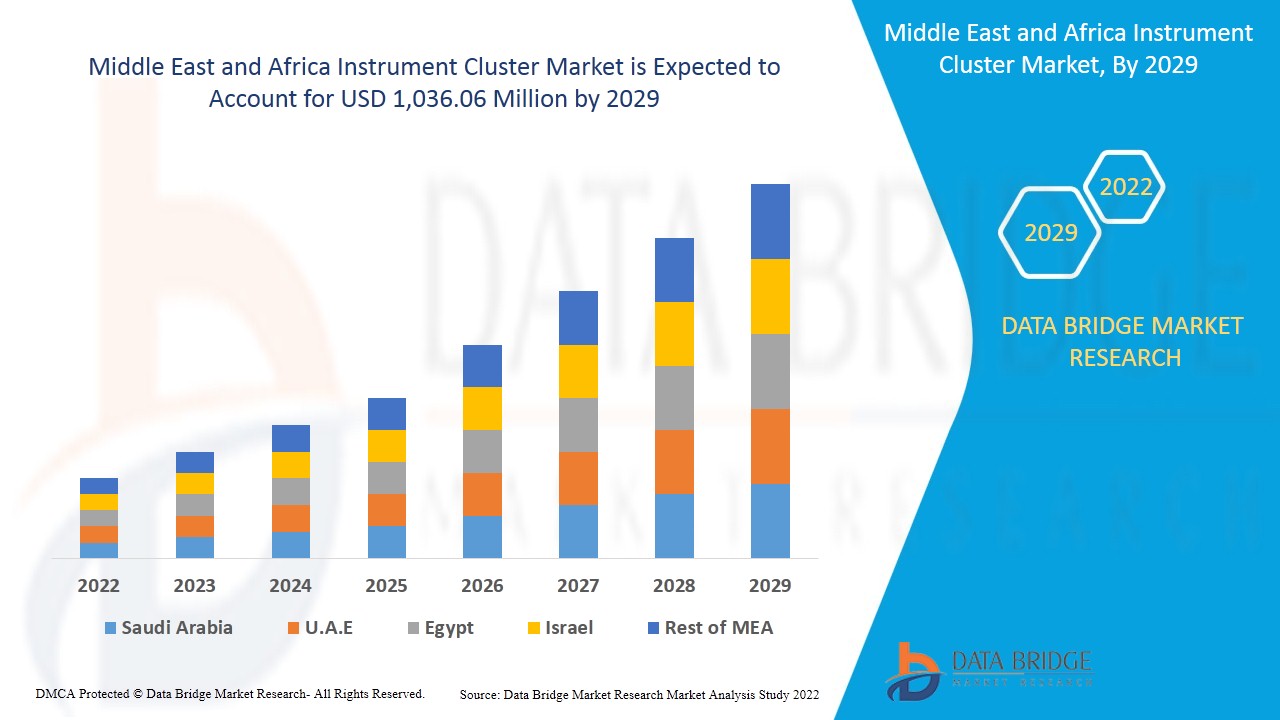
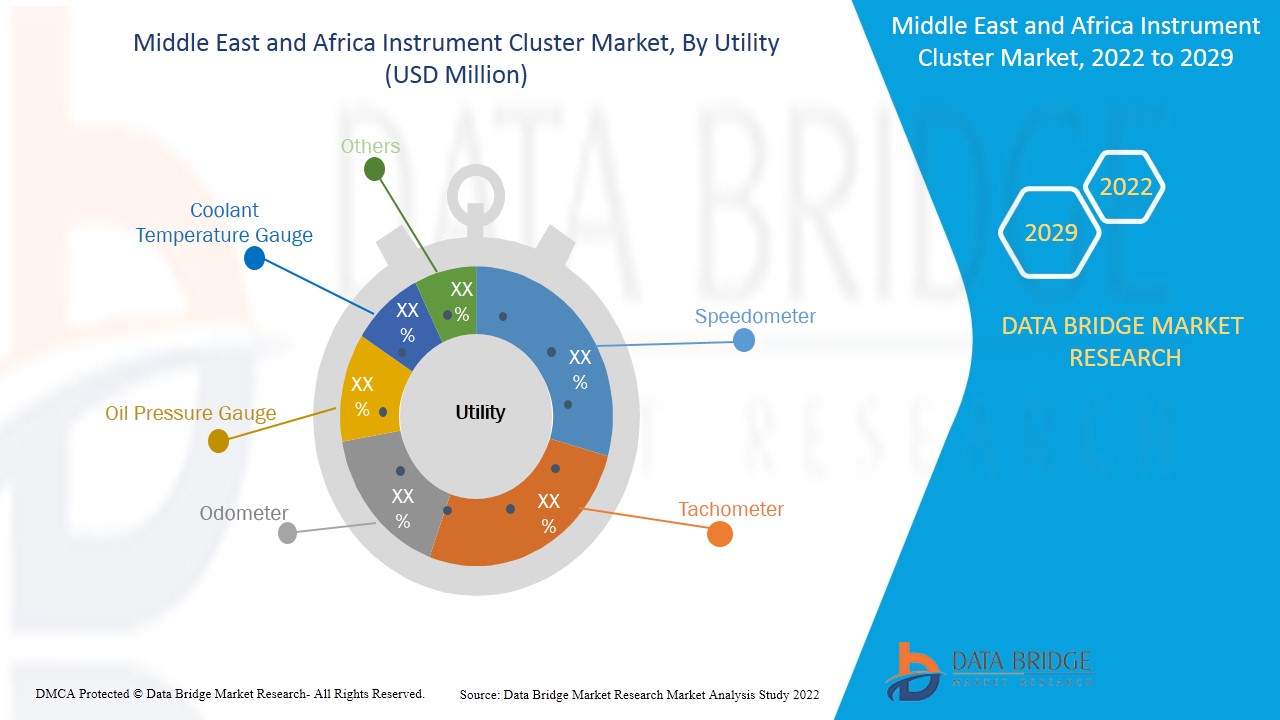
Middle East and Africa Instrument Cluster Market, By Utility (Speedometer, Odometer, Tachometer, Coolant Temperature Gauge, Oil Pressure Gauge, and Others) , Vehicle Type (ICE Vehicle, Battery Electric Vehicle (BEV), Plug-In Hybrid Electric Vehicle (PHEV), Hybrid Electric Vehicle (HEV), And Fuel Cell Electric Vehicle (FCEV)), Technology (Hybrid, Analog, and Digital), Enterprise Size (Small-Scale Organization, Semi-Urban Mid- Scale Organization, and Large Scale Organizations), End-User (Passenger Cars, Commercial Vehicles, Two-Wheelers, Off-Highway Vehicle, Agriculture Vehicle, and Others), Country (Saudi Arabia, South Africa, UAE, Egypt, Israel, and Rest of Middle East and Africa) Industry Trends and Forecast to 2029.
Market Analysis and Insights: Middle East and Africa Instrument Cluster Market
Middle East and Africa instrument cluster market is expected to gain market growth in the forecast period of 2022 to 2029. Data Bridge Market Research analyses that the market is growing with the CAGR of 4.2% in the forecast period of 2022 to 2029 and expected to reach USD 1,036.06 million by 2029. The growth of the automotive industry in developing countries, and the rise in demand for high-end passenger cars are driving the automotive instrument cluster market. In addition, the rise in production & sales of vehicles and increase in infotainment systems are boosting the market growth. However, fluctuation in raw material costs, such as chips, ICs, and displays, and higher costs associated with digital instrument clusters are expected to hinder the demand in the market.
The instrument cluster is placed directly in front of the steering wheel in most modern automobiles and trucks, placing all of the instruments within the driver's natural line of sight. Some vehicles have turned signal indicators mounted at the front, top end of each fender, many early automobiles had coolant temperature gauges built right into the radiator caps, and some vehicles have also had tachometers that were hood-mounted. No doubt, the first vehicles didn't have instrument clusters when they rolled out of the barns and sheds where they were made (or even when the first mass-produced cars went on sale). They didn't have any instruments at all, for that matter. These early automobiles resembled carriages of the time rather than modern automobiles, and they lacked the passenger compartment or "cockpit" that we are familiar with today.
Rising demand for development of complete digital cockpit solution is expected to drive the growth of the market however, stringent government regulations for vehicle safety is expected to hinder the market’s growth. The increasing adoption of luxury vehicle is expected to create an opportunity for the market’s growth but complicated design structure of digital instrument cluster is expected to challenge the market’s growth
The instrument cluster market report provides details of market share, new developments, and product pipeline analysis, impact of domestic and localized market players, analyses opportunities in terms of emerging revenue pockets, changes in market regulations, product approvals, strategic decisions, product launches, geographic expansions, and technological innovations in the market. To understand the analysis and the instrument cluster market scenario contact Data Bridge Market Research for an Analyst Brief, our team will help you create a revenue impact solution to achieve your desired goal.
Instrument Cluster Market Scope and Market Size
Middle East and Africa instrument cluster market is segmented into five notable segments which are based on the utility, vehicle type, technology, enterprise size and end-use. The growth among segments helps you analyze niche pockets of growth and strategies to approach the market and determine your core application areas and the difference in your target markets.
- On the basis of utility, the Middle East and Africa instrument cluster market is segmented into speedometer, tachometer, odometer, oil pressure gauge, coolant temperature gauge, and others. In 2022, the speedometer is expected to dominate the market as the rapid increase in the production of vehicles and the increase in road safety parameters, increases the demand for automotive speedometers.
- On the basis of vehicle type, the Middle East and Africa instrument cluster market is segmented into ICE vehicle, battery electric vehicle (BEV), plug-in hybrid electric vehicle (PHEV), hybrid electric vehicle (HEV), and fuel cell electric vehicle (FCEV). In 2022, ICE vehicle is expected to dominate the market due to rising consumer demand for high-end luxury vehicles including BMW, Audi and Mercedes pertaining to better economic conditions and high purchasing power will promote the usage of instrument cluster products in UAE and Saudi Arabia for ICE vehicles.
- On the basis of technology, the Middle East and Africa instrument cluster market is segmented into hybrid, analog, digital and others. In 2022, hybrid technology is expected to dominate the market as concerns regarding convenience, safety, and comfort has increased, use of technologies such as steering mounted control and gesture control systems has increased, which has led to growth of the hybrid instrument cluster.
- On the basis of enterprise size, the Middle East and Africa instrument cluster market is segmented into large scale organizations, semi-urban mid-scale organizations, and small-scale organizations. In 2022, large-scale organizations are expected to dominate the market as they have a higher capacity of production volume and deal with a wide range of product portfolios in the market.
- On the basis of end-user, the Middle East and Africa instrument cluster market is segmented into passenger cars, commercial vehicles, two-wheelers, agriculture vehicles, off-highway vehicles and others. In 2022, passenger car is expected to dominate the market as the Rising demand for lightweight vehicles, favorable government standards regarding fuel emissions and increasing demand for passenger cars will drive MEA instrument cluster market for automotive industry demand.
Instrument Cluster Market Country Level Analysis
The instrument cluster market is analyzed and market size information is provided by the country, utility, vehicle type, technology, enterprise size and end-user as referenced above.
The countries covered in the instrument cluster market report the United Arab Emirates, Saudi Arabia, Israel, Egypt, South Africa and rest of Middle East and Africa. Saudi Arabia dominates the Middle East and Africa region due to the Increasing disposable income along with proliferating economic conditions are providing potential opportunities for recreation activities, further strengthening the market size. Saudi Arabia will exhibit significant growth due to increasing recreational spending and economic growth. Easy availability of vehicles and vehicle parts through an effective chain of distributors and dealers will significantly enhance the market size.
The country section of the report also provides individual market impacting factors and changes in regulation in the market domestically that impacts the current and future trends of the market. Data points such as new sales, replacement sales, country demographics, regulatory acts and import-export tariffs are some of the major pointers used to forecast the market scenario for individual countries. Also, presence and availability of Middle East and Africa brands and their challenges faced due to large or scarce competition from local and domestic brands, impact of sales channels are considered while providing forecast analysis of the country data.
Rising Demand for Development of Complete Digital Cockpit Solution is Expected to Drive the Growth of the Market
The instrument cluster market also provides you with detailed market analysis for every country growth in particular market. Additionally, it provides the detail information regarding the market players’ strategy and their geographical presence. The data is available for historic period from 2011 to 2020.
Competitive Landscape and Instrument Cluster Market Share Analysis
Instrument cluster market competitive landscape provides details by competitor. Details included are company overview, company financials, revenue generated, market potential, investment in research and development, new market initiatives, production sites and facilities, company strengths and weaknesses, product launch, product trials pipelines, product approvals, patents, product width and breadth, application dominance, technology lifeline curve. The above data points provided are only related to the company’s focus related to instrument cluster market.
Some of the major players operating in the instrument cluster market are Visteon Corporation., Continental AG, PARKER HANNIFIN CORP, Robert Bosch GmbH, Infenion Technologies AG, Delphi Technologies, HARMAN International, Aptiv, YAZAKI Corporation, Nippon Seiki Co., Ltd., DENSO CORPORATION, Renesas Electronics Corporation, IAC Group, LUXOFT, A DXC TECHNOLOGY COMPANY, Spark Minda, ALPS ALPINE CO., LTD, Panasonic Corporation, Simco Ltd, Texas Instruments Incorporated, Mini Meters Manufacturing Co. Pvt. Ltd., and Embitel among others.
Many contracts and agreements are also initiated by the companies’ which are also accelerating the instrument cluster market.
For instances,
- In March 2019, Visteon Corporation had launched the first 3D cluster for all-new PEUGEOT 208 in all parts of PEUGEOT’s unique 3D i-Cockpit, where the instrument cluster mostly represents the first real 3D cluster in automotive production. It had helped in displaying advanced reflections for creating the impressions of 3D graphics
- In September 2021, HARMAN International announced a collaboration with Renault Mégane E-TECH electric. The collaboration between companies took place for redesigning the interior of the vehicle. The company product launch is in all-new in-car experiences for drivers and customers. The market is expected to have new products with best features and new designs
SKU-
Obtenha acesso online ao relatório sobre a primeira nuvem de inteligência de mercado do mundo

- Painel interativo de análise de dados
- Painel de análise da empresa para oportunidades de elevado potencial de crescimento
- Acesso de analista de pesquisa para personalização e customização. consultas
- Análise da concorrência com painel interativo
- Últimas notícias, atualizações e atualizações Análise de tendências
- Aproveite o poder da análise de benchmark para um rastreio abrangente da concorrência
Índice
1 INTRODUÇÃO
1.1 OBJETIVOS DO ESTUDO
1.2 DEFINIÇÃO DE MERCADO
1.3 VISÃO GERAL DO MERCADO DE CLUSTER DE INSTRUMENTOS DO ORIENTE MÉDIO E ÁFRICA
1.4 MOEDA E PREÇOS
1.5 LIMITAÇÕES
1.6 MERCADOS COBERTOS
2 SEGMENTAÇÃO DE MERCADO
2.1 MERCADOS COBERTOS
2.2 ÂMBITO GEOGRÁFICO
2,3 ANOS CONSIDERADOS PARA O ESTUDO
2.4 MODELO DE VALIDAÇÃO DE DADOS TRIPÉ DBMR
2.5 ENTREVISTAS PRINCIPAIS COM PRINCIPAIS LÍDERES DE OPINIÃO
2.6 GRADE DE POSIÇÃO DE MERCADO DBMR
2.7 ANÁLISE DA PARTICIPAÇÃO DO FORNECEDOR
2.8 MODELAGEM MULTIVARIADA
2.9 CURVA DE TEMPO DO TIPO DE COMPONENTE
2.1 GRADE DE APLICAÇÃO DE MERCADO
2.11 FONTES SECUNDÁRIAS
2.12 PREMISSAS
3 RESUMO EXECUTIVO
4 INSIGHTS PREMIUM
4.1 ANÁLISE DE PREÇOS
4.2 ESTUDO DE CASO
4.3 TENDÊNCIAS TECNOLÓGICAS
4.3.1 MANUTENÇÃO PREDITIVA
4.3.2 SISTEMA DE MONITORAMENTO DO MOTORISTA
4.3.3 SOLUÇÕES DE COCKPIT DIGITAL
4.4 QUADRO REGULAMENTAR
5 VISÃO GERAL DO MERCADO
5.1 MOTORISTAS
5.1.1 CRESCENTE DEMANDA POR DESENVOLVIMENTO DE SOLUÇÃO COMPLETA DE COCKPIT DIGITAL
5.1.2 TRANSIÇÃO DO SISTEMA MECÂNICO PARA O SISTEMA ELETRÔNICO NO SETOR AUTOMOTIVO
5.1.3 AUMENTO DAS VENDAS DE VEÍCULOS ELÉTRICOS
5.2 RESTRIÇÕES
5.2.1 REGULAMENTOS GOVERNAMENTAIS RIGOROSOS PARA A SEGURANÇA DOS VEÍCULOS
5.2.2 A PRECISÃO DA MAIORIA DOS VELOCÍMETROS DIMINUI À MEDIDA QUE OS PNEUS SE DESGASTAM
5.3 OPORTUNIDADES
5.3.1 A ADOÇÃO DE VEÍCULOS DE LUXO ESTÁ IMPONDO UMA PERSPECTIVA POSITIVA AO MERCADO
5.3.2 INTEGRAÇÃO DA SOLUÇÃO HMI NO CLUSTER DE INSTRUMENTOS
5.3.3 AUMENTO DAS AQUISIÇÕES E FUSÕES ENTRE DIVERSOS ATORES DO MERCADO
5.4 DESAFIOS
5.4.1 ESTRUTURA DE PROJETO COMPLICADA DE CLUSTER DE INSTRUMENTOS DIGITAIS
5.4.2 ERROS ASSOCIADOS A QUALQUER SENSOR DO VEÍCULO IMPACTAM O FUNCIONAMENTO DO CONJUNTO DE INSTRUMENTOS
6 IMPACTO DA COVID-19 NO MERCADO DE CLUSTERS DE INSTRUMENTOS DO ORIENTE MÉDIO E ÁFRICA
6.1 CONSEQUÊNCIAS DA COVID-19 E INICIATIVA DO GOVERNO PARA IMPULSIONAR O CRESCIMENTO DO MERCADO
6.2 DECISÕES ESTRATÉGICAS PARA FABRICANTES APÓS A COVID-19 PARA GANHAR PARTICIPAÇÃO COMPETITIVA NO MERCADO
6.3 IMPACTO NO PREÇO E NA DEMANDA
6.4 IMPACTO NA CADEIA DE SUPRIMENTOS
6.5 CONCLUSÃO
7 MERCADO DE CLUSTER DE INSTRUMENTOS DO ORIENTE MÉDIO E ÁFRICA, POR CONCESSIONÁRIA
7.1 VISÃO GERAL
7.2 VELOCÍMETRO
7.2.1 ANALÓGICO
7.2.2 DIGITAL
7.3 TACÔMETRO
7.4 HODÔMETRO
7.4.1 MECÂNICO
7.4.2 ELETRÔNICO
MANÔMETRO DE PRESSÃO DE ÓLEO 7.5
7.6 MEDIDOR DE TEMPERATURA DO LÍQUIDO DE REFRIGERAÇÃO
7.7 OUTROS
8 MERCADO DE CLUSTER DE INSTRUMENTOS DO ORIENTE MÉDIO E ÁFRICA, POR TIPO DE VEÍCULO
8.1 VISÃO GERAL
8.2 VEÍCULO DE GELO
8.3 VEÍCULO ELÉTRICO A BATERIA (BEV)
8.4 VEÍCULO ELÉTRICO HÍBRIDO (VEH)
8.5 VEÍCULO ELÉTRICO HÍBRIDO PLUG-IN (PHEV)
8.6 VEÍCULO ELÉTRICO DE CÉLULA DE COMBUSTÍVEL (FCEV)
9 MERCADO DE CLUSTER DE INSTRUMENTOS DO ORIENTE MÉDIO E ÁFRICA, POR TECNOLOGIA
9.1 VISÃO GERAL
9.2 HÍBRIDO
9.3 DIGITAL
9.3.1 TELA DE CRISTAL LÍQUIDO (LCD)
9.3.2 DIODO EMISSOR DE LUZ ORGÂNICO (OLED)
9.3.3 TELA DE TRANSISTOR DE CRISTAL LÍQUIDO DE PELÍCULA FINA (TFT-LCD)
9.3.4 5-8 POLEGADAS
9,3,5 9-11 POLEGADAS
9.3.6 MAIS DE 12 POLEGADAS
9.3.7 BASEADO EM IA: CLUSTER DE INSTRUMENTOS DIGITAIS
9.3.8 NÃO BASEADO EM IA: CLUSTER DE INSTRUMENTOS DIGITAIS
9.4 ANALÓGICO
10 MERCADOS DE CLUSTER DE INSTRUMENTOS DO ORIENTE MÉDIO E ÁFRICA, POR TAMANHO DA EMPRESA
10.1 VISÃO GERAL
10.2 ORGANIZAÇÕES DE GRANDE ESCALA
10.3 ORGANIZAÇÕES SEMI-URBANAS DE MÉDIA ESCALA
10.4 ORGANIZAÇÕES DE PEQUENA ESCALA
11 MERCADO DE CLUSTER DE INSTRUMENTOS DO ORIENTE MÉDIO E ÁFRICA, POR USUÁRIO FINAL
11.1 VISÃO GERAL
11.2 AUTOMÓVEIS DE PASSAGEIROS
11.3 VEÍCULOS COMERCIAIS
11.4 DUAS RODAS
11.5 VEÍCULOS AGRÍCOLAS
11.6 VEÍCULOS FORA DE ESTRADA
11.7 OUTROS
12 MERCADOS DE CLUSTER DE INSTRUMENTOS DO ORIENTE MÉDIO E ÁFRICA, POR REGIÃO
12.1 ORIENTE MÉDIO E ÁFRICA
13 MERCADO DE CLUSTER DE INSTRUMENTOS DO ORIENTE MÉDIO E ÁFRICA: CENÁRIO DA EMPRESA
13.1 ANÁLISE DE AÇÕES DA EMPRESA: ORIENTE MÉDIO E ÁFRICA
14 ANÁLISE SWOT
15 PERFIL DA EMPRESA
15.1 VISTEON CORPORATION
15.1.1 RESUMO DA EMPRESA
15.1.2 ANÁLISE DE RECEITA
15.1.3 ANÁLISE DAS AÇÕES DA EMPRESA
15.1.4 PORTFÓLIO DE PRODUTOS
15.1.5 DESENVOLVIMENTO RECENTE
15.2 INFINEON TECHNOLOGIES AG
15.2.1 RESUMO DA EMPRESA
15.2.2 ANÁLISE DE RECEITA
15.2.3 ANÁLISE DAS AÇÕES DA EMPRESA
15.2.4 PORTFÓLIO DE PRODUTOS
15.2.5 DESENVOLVIMENTO RECENTE
15.3 CONTINENTAL AG
15.3.1 RESUMO DA EMPRESA
15.3.2 ANÁLISE DE RECEITA
15.3.3 ANÁLISE DE AÇÕES DA EMPRESA
15.3.4 PORTFÓLIO DE PRODUTOS
15.3.5 DESENVOLVIMENTOS RECENTES
15.4 ROBERT BOSCH GMBH
15.4.1 RESUMO DA EMPRESA
15.4.2 ANÁLISE DE RECEITA
15.4.3 ANÁLISE DAS AÇÕES DA EMPRESA
15.4.4 PORTFÓLIO DE PRODUTOS
15.4.5 DESENVOLVIMENTOS RECENTES
15.5 RENESAS ELECTRONICS CORPORATION.
15.5.1 RESUMO DA EMPRESA
15.5.2 PORTFÓLIO DE PRODUTOS
15.5.3 ANÁLISE DE AÇÕES DA EMPRESA
15.5.4 DESENVOLVIMENTO RECENTE
15.6 APTIV
15.6.1 RESUMO DA EMPRESA
15.6.2 PORTFÓLIO DE PRODUTOS
15.6.3 DESENVOLVIMENTO RECENTE
15.7 ALPS ALPINE CO., LTD
15.7.1 RESUMO DA EMPRESA
15.7.2 ANÁLISE DE RECEITA
15.7.3 PORTFÓLIO DE PRODUTOS
15.7.4 DESENVOLVIMENTO RECENTE
15.8 DENSO CORPORATION
15.8.1 RESUMO DA EMPRESA
15.8.2 ANÁLISE DE RECEITA
15.8.3 PORTFÓLIO DE PRODUTOS
15.8.4 DESENVOLVIMENTO RECENTE
15.9 DELPHI TECHNOLOGIES (BORGWARNER INC)
15.9.1 RESUMO DA EMPRESA
15.9.2 PORTFÓLIO DE PRODUTOS
15.9.3 DESENVOLVIMENTOS RECENTES
15.1 PEÇAS DO MOTOR DONGFENG (GRUPO) CO., LTD.
15.10.1 RESUMO DA EMPRESA
15.10.2 PORTFÓLIO DE PRODUTOS
15.10.3 DESENVOLVIMENTO RECENTE
15.11 EMBITEL
15.11.1 RESUMO DA EMPRESA
15.11.2 PORTFÓLIO DE PRODUTOS
15.11.3 DESENVOLVIMENTOS RECENTES
15.12 HARMAN INTERNACIONAL.
15.12.1 RESUMO DA EMPRESA
15.12.2 PORTFÓLIO DE PRODUTOS
15.12.3 DESENVOLVIMENTOS RECENTES
15.13 GRUPO IAC
15.13.1 RESUMO DA EMPRESA
15.13.2 PORTFÓLIO DE PRODUTOS
15.13.3 DESENVOLVIMENTOS RECENTES
15.14 LUXOFT, UMA EMPRESA DE TECNOLOGIA DXC
15.14.1 RESUMO DA EMPRESA
15.14.2 PORTFÓLIO DE PRODUTOS
15.14.3 DESENVOLVIMENTOS RECENTES
15.15 MINI METERS MANUFACTURING CO.
15.15.1 RESUMO DA EMPRESA
15.15.2 PORTFÓLIO DE PRODUTOS
15.15.3 DESENVOLVIMENTO RECENTE
15.16 MARELLI HOLDINGS CO., LTD.
15.16.1 RESUMO DA EMPRESA
15.16.2 PORTFÓLIO DE PRODUTOS
15.16.3 DESENVOLVIMENTOS RECENTES
15.17 NIPPON SEIKI CO., LTD
15.17.1 RESUMO DA EMPRESA
15.17.2 ANÁLISE DE RECEITA
15.17.3 PORTFÓLIO DE PRODUTOS
15.17.4 DESENVOLVIMENTOS RECENTES
15.18 PARKER HANNIFIN CORP
15.18.1 RESUMO DA EMPRESA
15.18.2 PORTFÓLIO DE PRODUTOS
15.18.3 DESENVOLVIMENTO RECENTE
15.19 PANASONIC CORPORATION
15.19.1 RESUMO DA EMPRESA
15.19.2 PORTFÓLIO DE PRODUTOS
15.19.3 DESENVOLVIMENTO RECENTE
15.2 PRICOL LIMITADA
15.20.1 RESUMO DA EMPRESA
15.20.2 ANÁLISE DE RECEITA
15.20.3 PORTFÓLIO DE PRODUTOS
15.20.4 DESENVOLVIMENTO RECENTE
15.21 SIMCO LTD
15.21.1 RESUMO DA EMPRESA
15.21.2 PORTFÓLIO DE PRODUTOS
15.21.3 DESENVOLVIMENTO RECENTE
15.22 FAÍSCA MINDA
15.22.1 RESUMO DA EMPRESA
15.22.2 PORTFÓLIO DE PRODUTOS
15.22.3 DESENVOLVIMENTOS RECENTES
15.23 TEXAS INSTRUMENTS INCORPORATED
15.23.1 RESUMO DA EMPRESA
15.23.2 ANÁLISE DE RECEITA
15.23.3 PORTFÓLIO DE PRODUTOS
15.23.4 DESENVOLVIMENTO RECENTE
15.24 CORPORAÇÃO YAZAKI
15.24.1 RESUMO DA EMPRESA
15.24.2 PORTFÓLIO DE PRODUTOS
15.24.3 DESENVOLVIMENTOS RECENTES
16 QUESTIONÁRIO
17 RELATÓRIOS RELACIONADOS
Lista de Tabela
TABELA 1 MERCADO DE CLUSTER DE INSTRUMENTOS DO ORIENTE MÉDIO E ÁFRICA, POR CONCESSIONÁRIA, 2020-2029 (US$ MILHÕES)
TABELA 2 VELOCÍMETRO NO MERCADO DE CONJUNTOS DE INSTRUMENTOS DO ORIENTE MÉDIO E ÁFRICA, POR REGIÃO, 2020-2029 (US$ MILHÕES)
TABELA 3 VELOCÍMETRO NO MERCADO DE CONJUNTOS DE INSTRUMENTOS DO ORIENTE MÉDIO E ÁFRICA, POR TIPO, 2020-2029 (US$ MILHÕES)
TABELA 4 TACÔMETRO NO MERCADO DE CLUSTER DE INSTRUMENTOS DO ORIENTE MÉDIO E ÁFRICA, POR REGIÃO, 2020-2029 (US$ MILHÕES)
TABELA 5 ODÔMETRO NO MERCADO DE CONJUNTOS DE INSTRUMENTOS DO ORIENTE MÉDIO E ÁFRICA, POR REGIÃO, 2020-2029 (US$ MILHÕES)
TABELA 6 ODÔMETRO NO MERCADO DE CONJUNTOS DE INSTRUMENTOS DO ORIENTE MÉDIO E ÁFRICA, POR TIPO, 2020-2029 (US$ MILHÕES)
TABELA 7 MEDIDOR DE PRESSÃO DE PETRÓLEO NO ORIENTE MÉDIO E ÁFRICA NO MERCADO DE CLUSTER DE INSTRUMENTOS, POR REGIÃO, 2020-2029 (US$ MILHÕES)
TABELA 8 MEDIDOR DE TEMPERATURA DO LÍQUIDO DE REFRIGERAÇÃO NO ORIENTE MÉDIO E ÁFRICA NO MERCADO DE CONJUNTOS DE INSTRUMENTOS, POR REGIÃO, 2020-2029 (US$ MILHÕES)
TABELA 9 ORIENTE MÉDIO E ÁFRICA OUTROS NO MERCADO DE CLUSTER DE INSTRUMENTOS, POR REGIÃO, 2022-2029 (US$ MILHÕES)
TABELA 10 MERCADO DE CLUSTER DE INSTRUMENTOS DO ORIENTE MÉDIO E ÁFRICA, POR TIPO DE VEÍCULO, 2020-2029 (US$ MILHÕES)
TABELA 11 MERCADO DE VEÍCULOS DE GELO NO ORIENTE MÉDIO E ÁFRICA NO CONJUNTO DE INSTRUMENTOS, POR REGIÃO, 2020-2029 (US$ MILHÕES)
TABELA 12 VEÍCULOS ELÉTRICOS A BATERIA (BEV) NO ORIENTE MÉDIO E ÁFRICA NO MERCADO DE CONJUNTOS DE INSTRUMENTOS, POR REGIÃO, 2020-2029 (US$ MILHÕES)
TABELA 13 VEÍCULOS ELÉTRICOS HÍBRIDOS (VEH) NO MERCADO DE CONJUNTOS DE INSTRUMENTOS DO ORIENTE MÉDIO E ÁFRICA, POR REGIÃO, 2020-2029 (US$ MILHÕES)
TABELA 14 VEÍCULOS ELÉTRICOS PLUG-IN (PHEV) DO ORIENTE MÉDIO E ÁFRICA NO MERCADO DE CONJUNTOS DE INSTRUMENTOS, POR REGIÃO, 2020-2029 (US$ MILHÕES)
TABELA 15 VEÍCULOS ELÉTRICOS A CÉLULA DE COMBUSTÍVEL (FCEV) NO MERCADO DE CONJUNTOS DE INSTRUMENTOS DO ORIENTE MÉDIO E ÁFRICA, POR REGIÃO, 2020-2029 (US$ MILHÕES)
TABELA 16 MERCADO DE CLUSTER DE INSTRUMENTOS DO ORIENTE MÉDIO E ÁFRICA, POR TECNOLOGIA, 2020-2029 (US$ MILHÕES)
TABELA 17 ORIENTE MÉDIO E ÁFRICA HÍBRIDO NO MERCADO DE CLUSTER DE INSTRUMENTOS, POR REGIÃO, 2020-2029 (US$ MILHÕES)
TABELA 18 MERCADO DE CLUSTER DE INSTRUMENTOS DIGITAL NO ORIENTE MÉDIO E ÁFRICA, POR REGIÃO, 2020-2029 (US$ MILHÕES)
TABELA 19 MERCADO DE CLUSTER DE INSTRUMENTOS DIGITAIS NO ORIENTE MÉDIO E ÁFRICA, POR TIPO DE TELA, 2020-2029 (US$ MILHÕES)
TABELA 20 MERCADO DE CLUSTER DE INSTRUMENTOS DIGITAIS NO ORIENTE MÉDIO E ÁFRICA, POR TAMANHO DE TELA, 2020-2029 (US$ MILHÕES)
TABELA 21 MERCADO DE CLUSTER DE INSTRUMENTOS DIGITAL NO ORIENTE MÉDIO E ÁFRICA, POR TECNOLOGIA EMBUTIDA, 2020-2029 (US$ MILHÕES)
TABELA 22 MERCADO DE ANALÓGICOS EM CONJUNTOS DE INSTRUMENTOS NO ORIENTE MÉDIO E ÁFRICA, POR REGIÃO, 2020-2029 (US$ MILHÕES)
TABELA 23 MERCADO DE CLUSTER DE INSTRUMENTOS DO ORIENTE MÉDIO E ÁFRICA, POR TAMANHO DA EMPRESA, 2020-2029 (US$ MILHÕES)
TABELA 24 ORGANIZAÇÕES DE GRANDE ESCALA DO ORIENTE MÉDIO E ÁFRICA NO MERCADO DE CLUSTER DE INSTRUMENTOS, POR REGIÃO, 2020-2029 (US$ MILHÕES)
TABELA 25 ORGANIZAÇÕES SEMIURBANAS DE MÉDIA ESCALA DO ORIENTE MÉDIO E ÁFRICA NO MERCADO DE CLUSTER DE INSTRUMENTOS, POR REGIÃO, 2020-2029 (US$ MILHÕES)
TABELA 26 ORGANIZAÇÕES DE PEQUENA ESCALA DO ORIENTE MÉDIO E ÁFRICA NO MERCADO DE CLUSTER DE INSTRUMENTOS, POR REGIÃO, 2020-2029 (US$ MILHÕES)
TABELA 27 MERCADO DE CLUSTER DE INSTRUMENTOS DO ORIENTE MÉDIO E ÁFRICA, POR USUÁRIO FINAL, 2020-2029 (US$ MILHÕES)
TABELA 28 CARROS DE PASSAGEIROS DO ORIENTE MÉDIO E ÁFRICA NO MERCADO DE CONJUNTOS DE INSTRUMENTOS, POR REGIÃO, 2020-2029 (US$ MILHÕES)
TABELA 29 VEÍCULOS COMERCIAIS DO ORIENTE MÉDIO E ÁFRICA NO MERCADO DE CLUSTER DE INSTRUMENTOS, POR REGIÃO, 2020-2029 (US$ MILHÕES)
TABELA 30: MERCADO DE VEÍCULOS DE DUAS RODAS NO ORIENTE MÉDIO E ÁFRICA, POR REGIÃO, 2020-2029 (US$ MILHÕES)
TABELA 31 VEÍCULOS AGRÍCOLAS DO ORIENTE MÉDIO E ÁFRICA NO MERCADO DE CONJUNTOS DE INSTRUMENTOS, POR REGIÃO, 2020-2029 (US$ MILHÕES)
TABELA 32 VEÍCULOS OFF-HIGHWAY DO ORIENTE MÉDIO E ÁFRICA NO MERCADO DE CONJUNTOS DE INSTRUMENTOS, POR REGIÃO, 2020-2029 (US$ MILHÕES)
TABELA 33 ORIENTE MÉDIO E ÁFRICA OUTROS NO MERCADO DE CLUSTER DE INSTRUMENTOS, POR REGIÃO, 2020-2029 (US$ MILHÕES)
TABELA 34 MERCADO DE CLUSTER DE INSTRUMENTOS DO ORIENTE MÉDIO E ÁFRICA, POR PAÍS, 2020-2029 (US$ MILHÕES)
Lista de Figura
FIGURA 1 MERCADO DE CLUSTER DE INSTRUMENTOS DO ORIENTE MÉDIO E ÁFRICA: SEGMENTAÇÃO
FIGURA 2 MERCADO DE CLUSTER DE INSTRUMENTOS DO ORIENTE MÉDIO E ÁFRICA: TRIANGULAÇÃO DE DADOS
FIGURA 3 MERCADO DE CLUSTER DE INSTRUMENTOS DO ORIENTE MÉDIO E ÁFRICA: ANÁLISE DROC
FIGURA 4 MERCADO DE CLUSTER DE INSTRUMENTOS DO ORIENTE MÉDIO E ÁFRICA: ANÁLISE DE MERCADO DO ORIENTE MÉDIO E ÁFRICA VS MERCADO REGIONAL
FIGURA 5 MERCADO DE CLUSTER DE INSTRUMENTOS DO ORIENTE MÉDIO E ÁFRICA: ANÁLISE DE PESQUISA DA EMPRESA
FIGURA 6 MERCADO DE CLUSTER DE INSTRUMENTOS DO ORIENTE MÉDIO E ÁFRICA: DEMOGRAFIA DA ENTREVISTA
FIGURA 7 MERCADO DE CLUSTER DE INSTRUMENTOS DO ORIENTE MÉDIO E ÁFRICA: GRADE DE POSIÇÃO DE MERCADO DBMR
FIGURA 8 MERCADO DE CLUSTER DE INSTRUMENTOS DO ORIENTE MÉDIO E ÁFRICA: ANÁLISE DA PARTICIPAÇÃO DE FORNECEDORES
FIGURA 9 MERCADO DE CLUSTER DE INSTRUMENTOS DO ORIENTE MÉDIO E ÁFRICA: GRADE DE COBERTURA DE APLICAÇÃO DE MERCADO
FIGURA 10 MERCADO DE CLUSTER DE INSTRUMENTOS DO ORIENTE MÉDIO E ÁFRICA: SEGMENTAÇÃO
FIGURA 11 A CRESCENTE DEMANDA POR COCKPIT DIGITAL COMPLETO DEVE IMPULSIONAR O MERCADO DE CLUSTER DE INSTRUMENTOS DO ORIENTE MÉDIO E ÁFRICA NO PERÍODO DE PREVISÃO DE 2022-2029
FIGURA 12 O SEGMENTO DE VELOCÍMETRO DEVE SER REPRESENTANTE DA MAIOR PARCIALIDADE DO MERCADO DE CLUSTERS DE INSTRUMENTOS DO ORIENTE MÉDIO E ÁFRICA EM 2022 E 2029
FIGURA 13 ESPERA-SE QUE A ÁSIA-PACÍFICO DOMINE E SEJA A REGIÃO DE CRESCIMENTO MAIS RÁPIDO NO MERCADO DE CLUSTERS DE INSTRUMENTOS DO ORIENTE MÉDIO E ÁFRICA NO PERÍODO DE PREVISÃO DE 2022 A 2029
A FIGURA 14 ABAIXO É O PREÇO ESTIMADO DOS VÁRIOS COMPONENTES DO CLUSTER DE INSTRUMENTOS (USD)
FIGURA 15 MOTIVADORES, RESTRIÇÕES, OPORTUNIDADES E DESAFIOS DO MERCADO DE CLUSTERS DE INSTRUMENTOS DO ORIENTE MÉDIO E DA ÁFRICA
FIGURA 16 GASTOS DO CONSUMIDOR E DO GOVERNO COM CARROS ELÉTRICOS, 2016-2020 (USD BILHÕES)
FIGURA 17 MERCADO DE CLUSTER DE INSTRUMENTOS DO ORIENTE MÉDIO E ÁFRICA: POR CONCESSIONÁRIA, 2021
FIGURA 18 MERCADO DE CLUSTER DE INSTRUMENTOS DO ORIENTE MÉDIO E ÁFRICA: POR TIPO DE VEÍCULO, 2021
FIGURA 19 MERCADO DE CLUSTER DE INSTRUMENTOS DO ORIENTE MÉDIO E ÁFRICA: POR TECNOLOGIA, 2021
FIGURA 20 MERCADO DE CLUSTER DE INSTRUMENTOS DO ORIENTE MÉDIO E ÁFRICA: POR TAMANHO DA EMPRESA, 2021
FIGURA 21 MERCADO DE CLUSTER DE INSTRUMENTOS DO ORIENTE MÉDIO E ÁFRICA: POR USUÁRIO FINAL, 2021
FIGURA 22 MERCADO DE CLUSTER DE INSTRUMENTOS DO ORIENTE MÉDIO E ÁFRICA: RESUMO (2021)
FIGURA 23 MERCADO DE CLUSTER DE INSTRUMENTOS DO ORIENTE MÉDIO E ÁFRICA: POR PAÍS (2021)
FIGURA 24 MERCADO DE CLUSTER DE INSTRUMENTOS DO ORIENTE MÉDIO E ÁFRICA: POR PAÍS (2022 E 2029)
FIGURA 25 MERCADO DE CLUSTER DE INSTRUMENTOS DO ORIENTE MÉDIO E ÁFRICA: POR PAÍS (2021 E 2029)
FIGURA 26 MERCADO DE CLUSTER DE INSTRUMENTOS DO ORIENTE MÉDIO E ÁFRICA: POR MATÉRIA-PRIMA (2022-2029)
FIGURA 27 MERCADO DE CLUSTER DE INSTRUMENTOS DO ORIENTE MÉDIO E ÁFRICA: PARTICIPAÇÃO DA EMPRESA EM 2021 (%)
Metodologia de Investigação
A recolha de dados e a análise do ano base são feitas através de módulos de recolha de dados com amostras grandes. A etapa inclui a obtenção de informações de mercado ou dados relacionados através de diversas fontes e estratégias. Inclui examinar e planear antecipadamente todos os dados adquiridos no passado. Da mesma forma, envolve o exame de inconsistências de informação observadas em diferentes fontes de informação. Os dados de mercado são analisados e estimados utilizando modelos estatísticos e coerentes de mercado. Além disso, a análise da quota de mercado e a análise das principais tendências são os principais fatores de sucesso no relatório de mercado. Para saber mais, solicite uma chamada de analista ou abra a sua consulta.
A principal metodologia de investigação utilizada pela equipa de investigação do DBMR é a triangulação de dados que envolve a mineração de dados, a análise do impacto das variáveis de dados no mercado e a validação primária (especialista do setor). Os modelos de dados incluem grelha de posicionamento de fornecedores, análise da linha de tempo do mercado, visão geral e guia de mercado, grelha de posicionamento da empresa, análise de patentes, análise de preços, análise da quota de mercado da empresa, normas de medição, análise global versus regional e de participação dos fornecedores. Para saber mais sobre a metodologia de investigação, faça uma consulta para falar com os nossos especialistas do setor.
Personalização disponível
A Data Bridge Market Research é líder em investigação formativa avançada. Orgulhamo-nos de servir os nossos clientes novos e existentes com dados e análises que correspondem e atendem aos seus objetivos. O relatório pode ser personalizado para incluir análise de tendências de preços de marcas-alvo, compreensão do mercado para países adicionais (solicite a lista de países), dados de resultados de ensaios clínicos, revisão de literatura, mercado remodelado e análise de base de produtos . A análise de mercado dos concorrentes-alvo pode ser analisada desde análises baseadas em tecnologia até estratégias de carteira de mercado. Podemos adicionar quantos concorrentes necessitar de dados no formato e estilo de dados que procura. A nossa equipa de analistas também pode fornecer dados em tabelas dinâmicas de ficheiros Excel em bruto (livro de factos) ou pode ajudá-lo a criar apresentações a partir dos conjuntos de dados disponíveis no relatório.

