Middle East And Africa Structural Health Monitoring Market
Tamanho do mercado em biliões de dólares
CAGR :
% 
 USD
230.03 Million
USD
691.13 Million
2022
2030
USD
230.03 Million
USD
691.13 Million
2022
2030
| 2023 –2030 | |
| USD 230.03 Million | |
| USD 691.13 Million | |
| % | |
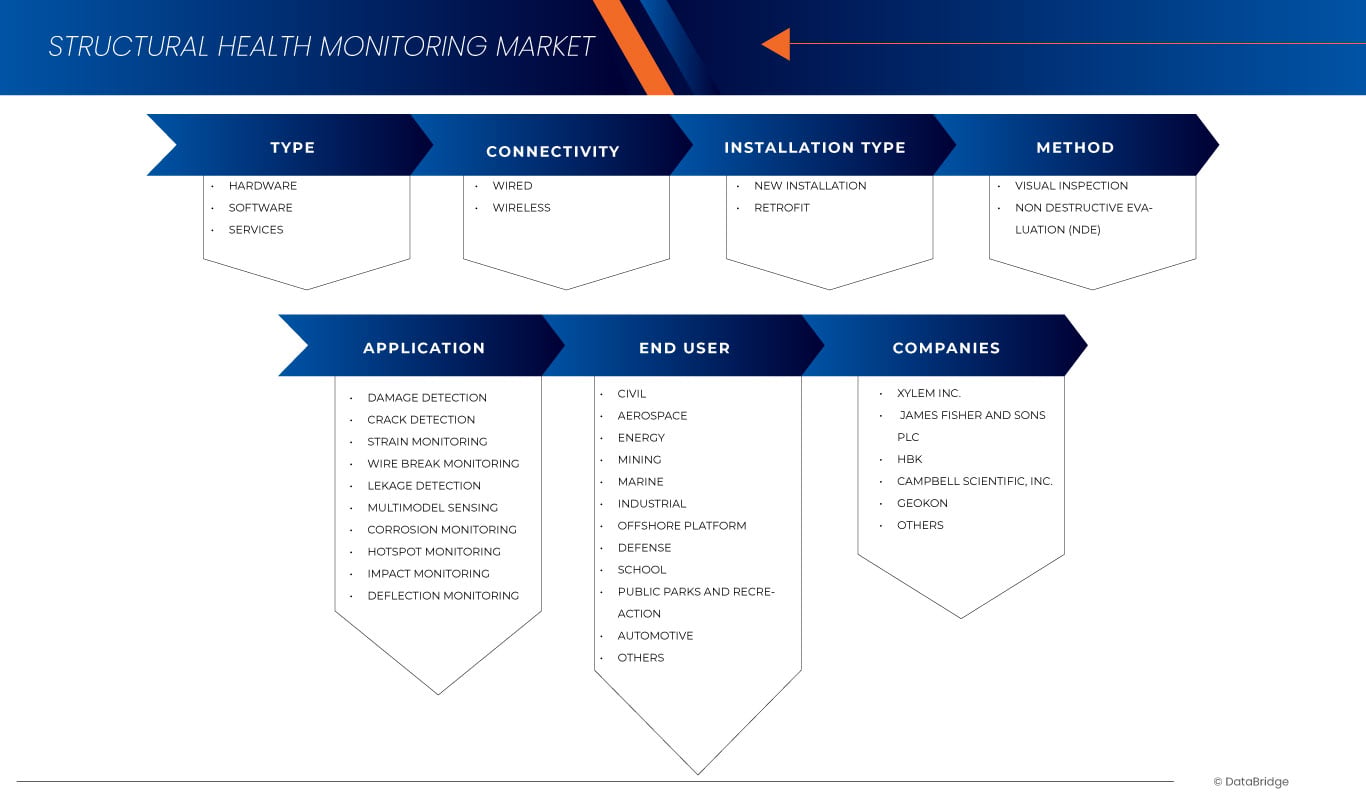
Middle East and Africa Structural Health Monitoring Market, By Type (Hardware, Software, and Services), Connectivity (Wired and Wireless), Installation Type (New installation and Retrofit), Method (Visual Inspection and Non-Destructive Evaluation (NDE)), Application (Damage Detection, Crack Detection, Strain Monitoring, Wire Break Monitoring, Leakage Detection, Multimodal Sensing, Corrosion Monitoring, Hotspot Monitoring, Impact Monitoring, and Deflection Monitoring), End User (Civil, Aerospace, Energy, Mining, Marine, Industrial, Offshore Platform, Defense, School, Public Park and Recreation, Automotive, and Others) - Industry Trends and Forecast to 2030.
Middle East and Africa Structural Health Monitoring Market Analysis and Insights
Manufacturers are continuously trying to find ways to increase the precision of work, enhance services, and safety, and work with growing technology. The requirement for these reasons is being fulfilled by implementing structural health monitoring as they are used to provide enhanced, uninterrupted, free, and timely services at the end user applications. Structural health monitoring in the infrastructure industry is being used widely for structural health monitoring solutions and the rising adoption of digital technologies in the industrial sector. Structural health monitoring helps operators make better decisions around supply chain, machinery, assets performance, drilling, and others. The Middle East and Africa structural health monitoring market is expected to grow due to growing digitization in the construction industry.
Data Bridge Market Research analyzes that the Middle East and Africa structural health monitoring market is expected to reach the value of USD 691.13 million by 2030 from USD 230.03 million in 2022, growing at a CAGR of 14.9% during the forecast period of 2023 to 2030.
|
Report Metric |
Details |
|
Forecast Period |
2023 to 2030 |
|
Base Year |
2022 |
|
Historic Years |
2021 (Customizable to 2015-2020) |
|
Quantitative Units |
Revenue in USD Million |
|
Segments Covered |
Type (Hardware, Software, and Services), Connectivity (Wired and Wireless), Installation Type (New installation and Retrofit), Method (Visual Inspection and Non-Destructive Evaluation (NDE)), Application (Damage Detection, Crack Detection, Strain Monitoring, Wire Break Monitoring, Leakage Detection, Multimodal Sensing, Corrosion Monitoring, Hotspot Monitoring, Impact Monitoring, and Deflection Monitoring), End User (Civil, Aerospace, Energy, Mining, Marine, Industrial, Offshore Platform, Defense, School, Public Park and Recreation, Automotive, and Others) |
|
Countries Covered |
South Africa, Saudi Arabia, Bahrain, U.A.E., Kuwait, Oman, Qatar, Egypt, Israel and rest of Middle East and Africa |
|
Market Players Covered |
Xylem Inc., James Fisher and Sons plc, HBK, Campbell Scientific, Inc., GEOKON, NATIONAL INSTRUMENTS CORP., GeoSIG Ltd, Kinemetrics, Sisgeo S.r.L, SIXSENSE System, and OSMOS Group SA (A subsidiary of Eren Group) among others |
Market Definition
Structural Health Monitoring (SHM) monitors changes in the material and geometric qualities of engineering structures, such as bridges and buildings, over time using periodically sampled response measurements. The output of this process is periodically updated information regarding the ability of the structure to perform its intended function in light of the inevitable aging and degradation resulting from operational environments for long-term structural health monitoring. After extreme events, such as earthquakes or blast loading, structural health monitoring is used for rapid condition screening and aims to provide, in near real-time, reliable information regarding the integrity of the structure.
Middle East and Africa Structural Health Monitoring Market Dynamics
This section deals with understanding the market drivers, advantages, opportunities, restraints, and challenges. All of this is discussed in detail below:
Driver
- Growing Infrastructural Development Across the Globe
Structural Health Monitoring (SHM) is a range of systems implemented on full-scale civil infrastructures to assist and inform operators about the continued 'fitness for purpose' of structures under gradual or sudden changes to their state and to learn about either or both of the load and response mechanisms.
The importance of infrastructure is widely recognized and well-researched. However, there have been relatively few attempts to track and monitor infrastructure investment across countries where studies have assessed Middle East and Africa infrastructure needs; the adoption of myriad definitions and approaches has consistently made monitoring trends difficult. The various initiatives and developments in infrastructure across the globe are expected to drive the growth of the Middle East and Africa structural health monitoring market.
Restraint
- High Installation and Monitoring Costs
The need and requirement for structural health monitoring systems have increased due to rapid digitalization and improved industrialization. Most complicated civil structures need structural health monitoring systems. But small structures cannot manage the structural health monitoring systems' installation cost and maintenance charges. As the need increases, the raw materials cost for structural health monitoring systems gradually increases.
Both capital expenditure (CAPEX) and operational expenditure (OPEX) are essential for structural health monitoring systems. The initial procurement of structural health monitoring systems, huge cabinets, and monitoring software is included in CAPEX. Structural health monitoring systems cost more than others because they require huge cabinets containing modules that allow growth. As a result, organizations must plan for their desired capacity to reap the full benefits of structural health monitoring systems. Also, structural health monitoring systems involve costing issues in the maintenance and upgradation of the system, which is projected to restrain the market.
Opportunity
-
Integration of Technologically Advanced Solutions for Structural Health Monitoring
Business process automation uses technology to execute recurring tasks or processes in a business where manual effort can be replaced. It is done to minimize costs, increase efficiency, and streamline processes. Digital transformation has been a top priority for companies in recent years, but now many businesses are taking a closer look at the actively evolving concept of digitalization.
Structural health monitoring implements a damage detection strategy for aerospace, civil and mechanical engineering infrastructure. Advances in sensors and information technologies have brought structural health monitoring (SHM) a data-driven remedy for civil infrastructure safety. Typical damage experienced by this infrastructure might be the development of fatigue cracks, degradation of structural connections, or bearing wear in rotating machinery. This application's structural health monitoring solution will integrate structural dynamics, wireless data acquisition, local actuation, micro-electromechanical systems (MEMS) technology, and statistical pattern recognition algorithms.
Challenge
- Lack of Standardization in Managing Large Volumes of Data
The lack of standardized terminology for categorizing and describing various interventions in the field of structural health monitoring involves structural factors, environmental factors, and others that are causing problems for the health of critical structures. The structural health monitoring solution installed places is classified depending upon the criticality of the civil structures and the location of the structures. Different structural health monitoring solutions, such as the sensor system, the data acquisition, and transmission system, the data management system, the condition evaluation system, and others, are used for different intense critical structures in dams, bridges, and other manufacturing industries. Therefore, standardization acts as the major factor that acts as a major challenge for the market.
Recent Developments
- In May 2021, Sisgeo S.r.l. introduced the MD-Profile gauges. The system is suitable for geotechnical and structural applications, for which vertical or horizontal accurate profiling is needed, to improve the product portfolio of the company
- In November 2020, HBK updated or technically refined its compressive force transducer C10 to make it more cost-efficient due to increased precision. This helped the product as an ideal solution for demanding test branches, laboratory, and production applications
Middle East and Africa Structural Health Monitoring Market Scope
Middle East and Africa structural health monitoring market is segmented into six notable segments such as type, connectivity, installation, method, application, and end user. The growth among segments helps you analyze niche pockets of growth and strategies to approach the market and determine your core application areas and the difference in your target markets.
Type
- Hardware
- Software
- Services
On the basis of type, the Middle East and Africa structural health monitoring market is segmented into hardware, software and services.
Connectivity
- Wired
- Wireless
On the basis of connectivity, the Middle East and Africa structural health monitoring market is segmented into wired and wireless.
Installation Type
- New Installation
- Retrofit
On the basis of installation, the Middle East and Africa structural health monitoring market is segmented into new installation and retrofit.
Method
- Visual Inspection
- Non-Destructive Evaluation (NDE)
On the basis of method, the Middle East and Africa structural health monitoring market is segmented into visual inspection and non-destructive evaluation.
Application
- Damage Detection
- Crack Detection
- Strain Monitoring
- Wire Break Monitoring
- Leakage Detection
- Multimodal Sensing
- Corrosion Monitoring
- Hotspot Monitoring
- Impact Monitoring
- Deflection Monitoring
On the basis of application, the Middle East and Africa structural health monitoring market is segmented into damage detection, crack detection, strain monitoring, wire break monitoring, leakage detection, multimodal sensing, corrosion monitoring, hotspot monitoring, impact monitoring and deflection monitoring.
End User
- Civil
- Aerospace
- Energy
- Mining
- Marine
- Industrial
- Offshore Platform
- Defense
- Schools
- Public Parks and Recreation
- Automotive
- Others
On the basis of end user, the Middle East and Africa structural health monitoring market is segmented into civil, aerospace, energy, mining, marine, industrial, offshore platform, defense, school, public park & recreation, automotive and others.
Middle East and Africa Structural Health Monitoring Regional Analysis/Insights
The Middle East and Africa structural health monitoring market is categorized into six notable segments such as type, connectivity, installation type, method, application, and end user.
The countries covered in the Middle East and Africa structural health monitoring market report South Africa, Saudi Arabia, Bahrain, U.A.E., Kuwait, Oman, Qatar, Egypt, Israel and the rest of Middle East and Africa.
U.A.E. is expected to dominate the market due to rise in technological advancement in structural health monitoring market.
The country section of the report also provides individual market impacting factors and changes in regulation in the market domestically that impact the current and future trends of the market. Data points such as new sales, replacement sales, country demographics, regulatory acts, and import-export tariffs are some of the major pointers used to forecast the market scenario for individual countries. In addition, presence and availability of Middle East and Africa brands and their challenges faced due to large or scarce competition from local and domestic brands, and impact of sales channels are considered while providing forecast analysis of the country data.
Competitive Landscape and Middle East and Africa Structural Health Monitoring Market Share Analysis
Middle East and Africa structural health monitoring market competitive landscape provides details by competitor. Details included are company overview, company financials, revenue generated, market potential, investment in R&D, new market initiatives, production sites and facilities, company strengths and weaknesses, product launch, product approvals, product width and breath, application dominance, product type lifeline curve. The above data points provided are only related to the company’s focus on the Middle East and Africa structural health monitoring market.
Some of the major players operating in the Middle East and Africa structural health monitoring market are Xylem Inc., James Fisher and Sons plc, HBK, Campbell Scientific, Inc., GEOKON, NATIONAL INSTRUMENTS CORP., GeoSIG Ltd, Kinemetrics, Sisgeo S.r.L, SIXSENSE System, and OSMOS Group SA (A subsidiary of Eren Group) among others.
SKU-
Obtenha acesso online ao relatório sobre a primeira nuvem de inteligência de mercado do mundo

- Painel interativo de análise de dados
- Painel de análise da empresa para oportunidades de elevado potencial de crescimento
- Acesso de analista de pesquisa para personalização e customização. consultas
- Análise da concorrência com painel interativo
- Últimas notícias, atualizações e atualizações Análise de tendências
- Aproveite o poder da análise de benchmark para um rastreio abrangente da concorrência
Índice
1 INTRODUCTION
1.1 OBJECTIVES OF THE STUDY
1.2 MARKET DEFINITION
1.3 OVERVIEW OF THE MIDDLE EAST AND AFRICA STRUCTURAL HEALTH MONITORING MARKET
1.4 CURRENCY AND PRICING
1.5 LIMITATIONS
1.6 MARKETS COVERED
2 MARKET SEGMENTATION
2.1 MARKETS COVERED
2.2 GEOGRAPHICAL SCOPE
2.3 YEARS CONSIDERED FOR THE STUDY
2.4 DBMR TRIPOD DATA VALIDATION MODEL
2.5 PRIMARY INTERVIEWS WITH KEY OPINION LEADERS
2.6 DBMR MARKET POSITION GRID
2.7 VENDOR SHARE ANALYSIS
2.8 MULTIVARIATE MODELING
2.9 MARKET APPLICATION COVERAGE GRID
2.1 SECONDARY SOURCES
2.11 ASSUMPTIONS
3 EXECUTIVE SUMMARY
4 PREMIUM INSIGHTS
4.1 PORTER'S FIVE FORCES
4.2 TECHNOLOGICAL TRENDS
4.3 MIDDLE EAST AND AFRICA STRUCTURAL HEALTH MONITORING MARKET, VALUE CHAIN ANALYSIS
4.4 CASE STUDIES
5 MARKET OVERVIEW
5.1 DRIVERS
5.1.1 GROWING INFRASTRUCTURAL DEVELOPMENT ACROSS THE GLOBE
5.1.2 INCREASING AUTOMATION AND STANDARDIZATION IN THE MAINTENANCE & REPAIR OF CIVIL INFRASTRUCTURE
5.1.3 GROWING ADVANCEMENT IN SENSOR TECHNOLOGIES
5.1.4 IMPROVED SAFETY AND MAINTAINABILITY OF CRITICAL STRUCTURES
5.2 RESTRAINTS
5.2.1 HIGH INSTALLATION AND MONITORING COSTS
5.2.2 INACCURATE RESULTS DUE TO CALIBRATION ERRORS
5.2.3 FLUCTUATING PRICES OF RAW MATERIALS
5.3 OPPORTUNITIES
5.3.1 INTEGRATION OF TECHNOLOGICALLY ADVANCED SOLUTIONS FOR STRUCTURAL HEALTH MONITORING
5.3.2 GROWTH IN INVESTMENTS IN INFRASTRUCTURE AND ADVANCES IN WIRELESS SENSOR NETWORKS
5.3.3 INCREASE IN VARIOUS STRATEGIC DECISIONS, SUCH AS PARTNERSHIP AND ACQUISITION
5.4 CHALLENGES
5.4.1 REQUIREMENT OF SKILLED OPERATORS FOR INSTALLATION AND CALIBRATION OF STRUCTURAL HEALTH MONITORING INSTRUMENTS
5.4.2 LACK OF STANDARDIZATION IN MANAGING LARGE VOLUMES OF DATA
5.4.3 TECHNICAL CHALLENGES AND OPERATIONAL FACTORS
6 MIDDLE EAST AND AFRICA STRUCTURAL HEALTH MONITORING MARKET, BY TYPE
6.1 OVERVIEW
6.2 HARDWARE
6.3 SOFTWARE
6.4 SERVICES
7 MIDDLE EAST AND AFRICA STRUCTURAL HEALTH MONITORING MARKET, BY CONNECTIVITY
7.1 OVERVIEW
7.2 WIRED
7.3 WIRELESS
8 MIDDLE EAST AND AFRICA STRUCTURAL HEALTH MONITORING MARKET, BY INSTALLATION TYPE
8.1 OVERVIEW
8.2 NEW INSTALLATION
8.3 RETROFIT
9 MIDDLE EAST AND AFRICA STRUCTURAL HEALTH MONITORING MARKET, BY METHOD
9.1 OVERVIEW
9.2 VISUAL INSPECTION
9.3 NON-DESTRUCTIVE EVALUATION (NDE)
10 MIDDLE EAST AND AFRICA STRUCTURAL HEALTH MONITORING MARKET, BY APPLICATION
10.1 OVERVIEW
10.2 DAMAGE DETECTION
10.3 CRACK DETECTION
10.4 STRAIN MONITORING
10.5 WIRE BREAK MONITORING
10.6 LEAKAGE DETECTION
10.7 MULTIMODAL SENSING
10.8 CORROSION MONITORING
10.9 HOTSPOT MONITORING
10.1 IMPACT MONITORING
10.11 DEFLECTION MONITORING
11 MIDDLE EAST AND AFRICA STRUCTURAL HEALTH MONITORING MARKET, BY END USER
11.1 OVERVIEW
11.2 CIVIL
11.3 AEROSPACE
11.4 ENERGY
11.5 MINING
11.6 MARINE
11.7 INDUSTRIAL
11.8 OFFSHORE PLATFORM
11.9 DEFENSE
11.1 SCHOOLS
11.11 PUBLIC PARKS AND RECREATION
11.12 AUTOMOTIVE
11.13 OTHERS
12 MIDDLE EAST AND AFRICA, BY COUNTRIES
12.1 MIDDLE EAST AND AFRICA
12.1.1 UAE
12.1.2 SAUDI ARABIA
12.1.3 SOUTH AFRICA
12.1.4 EGYPT
12.1.5 OMAN
12.1.6 QATAR
12.1.7 KUWAIT
12.1.8 ISRAEL
12.1.9 BAHRAIN
12.1.10 REST OF MIDDLE EAST AND AFRICA
13 MIDDLE EAST AND AFRICA STRUCTURAL HEALTH MONITORING MARKET, COMPANY LANDSCAPE
13.1 COMPANY SHARE ANALYSIS: MIDDLE EAST AND AFRICA
14 SWOT ANALYSIS
15 COMPANY PROFILE
15.1 XYLEM INC.
15.1.1 COMPANY SNAPSHOT
15.1.2 REVENUE ANALYSIS
15.1.3 PRODUCT PORTFOLIO
15.1.4 RECENT DEVELOPMENTS
15.2 JAMES FISHER AND SONS PLC. (2022)
15.2.1 COMPANY SNAPSHOT
15.2.2 REVENUE ANALYSIS
15.2.3 PRODUCT PORTFOLIO
15.2.4 RECENT DEVELOPMENTS
15.3 HBK
15.3.1 COMPANY SNAPSHOT
15.3.2 PRODUCT PORTFOLIO
15.3.3 RECENT DEVELOPMENTS
15.4 CAMPBELL SCIENTIFIC, INC.
15.4.1 COMPANY SNAPSHOT
15.4.2 PRODUCT PORTFOLIO
15.4.3 RECENT DEVELOPMENTS
15.5 GEOKON
15.5.1 COMPANY SNAPSHOT
15.5.2 PRODUCT PORTFOLIO
15.5.3 RECENT DEVELOPMENTS
15.6 GEOSIG LTD
15.6.1 COMPANY SNAPSHOT
15.6.2 PRODUCT PORTFOLIO
15.6.3 RECENT DEVELOPMENTS
15.7 KINEMETRICS
15.7.1 COMPANY SNAPSHOT
15.7.2 PRODUCT PORTFOLIO
15.7.3 RECENT DEVELOPMENTS
15.8 NATIONAL INSTRUMENTS CORP.
15.8.1 COMPANY SNAPSHOT
15.8.2 REVENUE ANALYSIS
15.8.3 PRODUCT PORTFOLIO
15.8.4 RECENT DEVELOPMENTS
15.9 OSMOS GROUP SA (A SUBSIDIARY OF EREN GROUP)
15.9.1 COMPANY SNAPSHOT
15.9.2 PRODUCT PORTFOLIO
15.9.3 RECENT DEVELOPMENTS
15.1 SISGEO S.R.L.
15.10.1 COMPANY SNAPSHOT
15.10.2 PRODUCT PORTFOLIO
15.10.3 RECENT DEVELOPMENTS
15.11 SIXENSE SYSTEMS
15.11.1 COMPANY SNAPSHOT
15.11.2 PRODUCT PORTFOLIO
15.11.3 RECENT DEVELOPMENTS
16 QUESTIONNAIRE
17 RELATED REPORTS
Lista de Tabela
TABELA 1 MERCADO DE MONITORAMENTO DA SAÚDE ESTRUTURAL NO ORIENTE MÉDIO E ÁFRICA, POR TIPO, 2021-2030 (US$ MILHÕES)
TABELA 2: HARDWARE NO MERCADO DE MONITORAMENTO DE SAÚDE ESTRUTURAL DO ORIENTE MÉDIO E ÁFRICA, POR TIPO, 2021-2030 (US$ MILHÕES)
TABELA 3 SENSORES DO ORIENTE MÉDIO E ÁFRICA NO MERCADO DE MONITORAMENTO DE SAÚDE ESTRUTURAL, POR TIPO, 2021-2030 (US$ MILHÕES)
TABELA 4 SERVIÇOS NO MERCADO DE MONITORAMENTO DE SAÚDE ESTRUTURAL DO ORIENTE MÉDIO E ÁFRICA, POR TIPO, 2021-2030 (US$ MILHÕES)
TABELA 5 INSTALAÇÃO NO MERCADO DE MONITORAMENTO DE SAÚDE ESTRUTURAL NO ORIENTE MÉDIO E ÁFRICA, POR TIPO, 2021-2030 (US$ MILHÕES)
TABELA 6 MERCADO DE MONITORAMENTO DE SAÚDE ESTRUTURAL NO ORIENTE MÉDIO E ÁFRICA, POR CONECTIVIDADE, 2021-2030 (US$ MILHÕES)
TABELA 7 MERCADO DE MONITORAMENTO DA SAÚDE ESTRUTURAL NO ORIENTE MÉDIO E ÁFRICA, POR TIPO DE INSTALAÇÃO, 2021-2030 (US$ MILHÕES)
TABELA 8 MERCADO DE MONITORAMENTO DA SAÚDE ESTRUTURAL NO ORIENTE MÉDIO E ÁFRICA, POR MÉTODO, 2021-2030 (US$ MILHÕES)
TABELA 9 INSPEÇÃO VISUAL NO ORIENTE MÉDIO E ÁFRICA NO MONITORAMENTO DA SAÚDE ESTRUTURAL, POR MÉTODO, 2021-2030 (MILHÕES DE DÓLARES)
TABELA 10 MERCADO DE MONITORAMENTO DA SAÚDE ESTRUTURAL NO ORIENTE MÉDIO E ÁFRICA, POR APLICAÇÃO, 2021-2030 (US$ MILHÕES)
TABELA 11 MONITORAMENTO DE RUPTURA DE FIO NO ORIENTE MÉDIO E ÁFRICA NO MERCADO DE MONITORAMENTO DE SAÚDE ESTRUTURAL, POR APLICAÇÃO, 2021-2030 (US$ MILHÕES)
TABELA 12 MERCADO DE MONITORAMENTO DE SAÚDE ESTRUTURAL NO ORIENTE MÉDIO E ÁFRICA, POR USUÁRIO FINAL, 2021-2030 (US$ MILHÕES)
TABELA 13 MERCADO DE MONITORAMENTO DE SAÚDE ESTRUTURAL NO ORIENTE MÉDIO E ÁFRICA, POR TIPO, 2021-2030 (US$ MILHÕES)
TABELA 14: CONSTRUÇÃO NO ORIENTE MÉDIO E ÁFRICA NO MERCADO DE MONITORAMENTO DA SAÚDE ESTRUTURAL, POR APLICAÇÃO, 2021-2030 (US$ MILHÕES)
TABELA 15 PONTES DO ORIENTE MÉDIO E DA ÁFRICA NO MERCADO DE MONITORAMENTO DA SAÚDE ESTRUTURAL, POR APLICAÇÃO, 2021-2030 (US$ MILHÕES)
TABELA 16 TÚNEIS DO ORIENTE MÉDIO E ÁFRICA NO MERCADO DE MONITORAMENTO DA SAÚDE ESTRUTURAL, POR APLICAÇÃO, 2021-2030 (US$ MILHÕES)
TABELA 17 BARRAGENS DO ORIENTE MÉDIO E ÁFRICA NO MERCADO DE MONITORAMENTO DA SAÚDE ESTRUTURAL, POR APLICAÇÃO, 2021-2030 (US$ MILHÕES)
TABELA 18 ESTRADAS DO ORIENTE MÉDIO E ÁFRICA NO MERCADO DE MONITORAMENTO DA SAÚDE ESTRUTURAL, POR APLICAÇÃO, 2021-2030 (US$ MILHÕES)
TABELA 19 ESTÁDIO DO ORIENTE MÉDIO E DA ÁFRICA NO MERCADO DE MONITORAMENTO DA SAÚDE ESTRUTURAL, POR APLICAÇÃO, 2021-2030 (US$ MILHÕES)
TABELA 20 MERCADO DE MONITORAMENTO DA SAÚDE ESTRUTURAL NO ORIENTE MÉDIO E ÁFRICA AEROESPACIAL, POR APLICAÇÃO, 2021-2030 (US$ MILHÕES)
TABELA 21 ENERGIA NO MERCADO DE MONITORAMENTO DA SAÚDE ESTRUTURAL DO ORIENTE MÉDIO E DA ÁFRICA, POR APLICAÇÃO, 2021-2030 (US$ MILHÕES)
TABELA 22 ENERGIA NO MERCADO DE MONITORAMENTO DA SAÚDE ESTRUTURAL DO ORIENTE MÉDIO E DA ÁFRICA, POR TIPO, 2021-2030 (US$ MILHÕES)
TABELA 23 TURBINAS EÓLICAS NO ORIENTE MÉDIO E ÁFRICA NO MERCADO DE MONITORAMENTO DA SAÚDE ESTRUTURAL, POR APLICAÇÃO, 2021-2030 (US$ MILHÕES)
TABELA 24 MINERAÇÃO NO ORIENTE MÉDIO E ÁFRICA NO MERCADO DE MONITORAMENTO DA SAÚDE ESTRUTURAL, POR APLICAÇÃO, 2021-2030 (US$ MILHÕES)
TABELA 25 MERCADO DE MONITORAMENTO DA SAÚDE ESTRUTURAL MARINHA NO ORIENTE MÉDIO E ÁFRICA, POR APLICAÇÃO, 2021-2030 (US$ MILHÕES)
TABELA 26 MERCADO INDUSTRIAL DE MONITORAMENTO DA SAÚDE ESTRUTURAL NO ORIENTE MÉDIO E ÁFRICA, POR APLICAÇÃO, 2021-2030 (US$ MILHÕES)
TABELA 27 PLATAFORMA OFFSHORE DO ORIENTE MÉDIO E ÁFRICA NO MERCADO DE MONITORAMENTO DA SAÚDE ESTRUTURAL, POR APLICAÇÃO, 2021-2030 (US$ MILHÕES)
TABELA 28 MERCADO DE MONITORAMENTO DE SAÚDE ESTRUTURAL NO ORIENTE MÉDIO E ÁFRICA, POR APLICAÇÃO, 2021-2030 (US$ MILHÕES)
TABELA 29 ESCOLAS DO ORIENTE MÉDIO E ÁFRICA NO MERCADO DE MONITORAMENTO DE SAÚDE ESTRUTURAL, POR APLICAÇÃO, 2021-2030 (US$ MILHÕES)
TABELA 30 PARQUES PÚBLICOS E RECREAÇÃO NO ORIENTE MÉDIO E ÁFRICA NO MERCADO DE MONITORAMENTO DA SAÚDE ESTRUTURAL, POR APLICAÇÃO, 2021-2030 (US$ MILHÕES)
TABELA 31 MERCADO DE MONITORAMENTO DA SAÚDE ESTRUTURAL NO ORIENTE MÉDIO E ÁFRICA AUTOMOTIVO, POR APLICAÇÃO, 2021-2030 (US$ MILHÕES)
TABELA 32 MONITORAMENTO DA SAÚDE ESTRUTURAL NO ORIENTE MÉDIO E ÁFRICA, POR PAÍS, 2021-2030 (MILHÕES DE DÓLARES)
TABELA 33 MONITORAMENTO DA SAÚDE ESTRUTURAL NOS EAU, POR TIPO, 2021-2030 (MILHÕES DE DÓLARES)
TABELA 34 HARDWARE NOS EAU PARA MONITORAMENTO DA SAÚDE ESTRUTURAL, POR TIPO, 2021-2030 (US$ MILHÕES)
TABELA 35 SENSORES DOS EAU NO MONITORAMENTO DA SAÚDE ESTRUTURAL, POR TIPO, 2021-2030 (US$ MILHÕES)
TABELA 36 SERVIÇOS DOS EAU EM MONITORAMENTO DA SAÚDE ESTRUTURAL, POR TIPO, 2021-2030 (US$ MILHÕES)
TABELA 37 INSTALAÇÃO NOS EAU EM MONITORAMENTO DE SAÚDE ESTRUTURAL, POR TIPO, 2021-2030 (US$ MILHÕES)
TABELA 38 MONITORAMENTO DA SAÚDE ESTRUTURAL DOS EAU, POR CONECTIVIDADE, 2021-2030 (MILHÕES DE DÓLARES AMERICANOS)
TABELA 39 MONITORAMENTO DA SAÚDE ESTRUTURAL NOS EAU, POR TIPO DE INSTALAÇÃO, 2021-2030 (US$ MILHÕES)
TABELA 40 MONITORAMENTO DA SAÚDE ESTRUTURAL NOS EAU, POR MÉTODO, 2021-2030 (MILHÕES DE DÓLARES)
TABELA 41 INSPEÇÃO VISUAL NOS EAU NO MONITORAMENTO DA SAÚDE ESTRUTURAL, POR MÉTODO, 2021-2030 (US$ MILHÕES)
TABELA 42 MONITORAMENTO DA SAÚDE ESTRUTURAL DOS EAU, POR APLICAÇÃO, 2021-2030 (MILHÕES DE DÓLARES)
TABELA 43 MONITORAMENTO DE RUPTURA DE FIO NOS EAU NO MONITORAMENTO DA SAÚDE ESTRUTURAL, POR APLICAÇÃO, 2021-2030 (US$ MILHÕES)
TABELA 44 MONITORAMENTO DA SAÚDE ESTRUTURAL NOS EAU, POR USUÁRIO FINAL, 2021-2030 (MILHÕES DE DÓLARES)
TABELA 45 MONITORAMENTO DA SAÚDE ESTRUTURAL CIVIL NOS EAU, POR TIPO, 2021-2030 (US$ MILHÕES)
TABELA 46 ENERGIA NOS EAU NO MONITORAMENTO DA SAÚDE ESTRUTURAL, POR TIPO, 2021-2030 (US$ MILHÕES)
TABELA 47 MONITORAMENTO DA SAÚDE ESTRUTURAL NOS EAU, POR APLICAÇÃO, 2021-2030 (MILHÕES DE DÓLARES AMERICANOS)
TABELA 48 PONTES DOS EAU EM MONITORAMENTO DA SAÚDE ESTRUTURAL, POR APLICAÇÃO, 2021-2030 (US$ MILHÕES)
TABELA 49 TÚNEIS DOS EAU NO MONITORAMENTO DA SAÚDE ESTRUTURAL, POR APLICAÇÃO, 2021-2030 (MILHÕES DE DÓLARES)
TABELA 50 BARRAGENS DOS EAU EM MONITORAMENTO DA SAÚDE ESTRUTURAL, POR APLICAÇÃO, 2021-2030 (US$ MILHÕES)
TABELA 51 ESTRADAS DOS EAU NO MONITORAMENTO DA SAÚDE ESTRUTURAL, POR APLICAÇÃO, 2021-2030 (MILHÕES DE DÓLARES)
TABELA 52 ESTÁDIO DOS EAU EM MONITORAMENTO DA SAÚDE ESTRUTURAL, POR APLICAÇÃO, 2021-2030 (MILHÕES DE DÓLARES)
TABELA 53 MONITORAMENTO DA SAÚDE ESTRUTURAL NOS EAU AEROESPACIAL, POR APLICAÇÃO, 2021-2030 (MILHÕES DE DÓLARES)
TABELA 54 ENERGIA DOS EAU NO MONITORAMENTO DA SAÚDE ESTRUTURAL, POR APLICAÇÃO, 2021-2030 (MILHÕES DE DÓLARES)
TABELA 55 MONITORAMENTO DA SAÚDE ESTRUTURAL DE TURBINAS EÓLICAS NOS EAU, POR APLICAÇÃO, 2021-2030 (MILHÕES DE DÓLARES)
TABELA 56 MINERAÇÃO NOS EAU NO MONITORAMENTO DA SAÚDE ESTRUTURAL, POR APLICAÇÃO, 2021-2030 (US$ MILHÕES)
TABELA 57 MONITORAMENTO DA SAÚDE ESTRUTURAL MARINHA DOS EAU, POR APLICAÇÃO, 2021-2030 (MILHÕES DE DÓLARES AMERICANOS)
TABELA 58 MONITORAMENTO INDUSTRIAL DA SAÚDE ESTRUTURAL DOS EAU, POR APLICAÇÃO, 2021-2030 (MILHÕES DE DÓLARES AMERICANOS)
TABELA 59 PLATAFORMA OFFSHORE DOS EAU EM MONITORAMENTO DA SAÚDE ESTRUTURAL, POR APLICAÇÃO, 2021-2030 (US$ MILHÕES)
TABELA 60 PLATAFORMA DE DEFESA DOS EAU EM MONITORAMENTO DA SAÚDE ESTRUTURAL, POR APLICAÇÃO, 2021-2030 (US$ MILHÕES)
TABELA 61 ESCOLAS DOS EAU EM MONITORAMENTO DA SAÚDE ESTRUTURAL, POR APLICAÇÃO, 2021-2030 (US$ MILHÕES)
TABELA 62 PARQUES PÚBLICOS E RECREAÇÃO NOS EAU NO MONITORAMENTO DA SAÚDE ESTRUTURAL, POR APLICAÇÃO, 2021-2030 (MILHÕES DE DÓLARES)
TABELA 63 MONITORAMENTO DA SAÚDE ESTRUTURAL NOS EAU EM PARQUES E RECREAÇÃO, POR APLICAÇÃO, 2021-2030 (US$ MILHÕES)
TABELA 64 MONITORAMENTO DA SAÚDE ESTRUTURAL DA ARÁBIA SAUDITA, POR TIPO, 2021-2030 (MILHÕES DE DÓLARES)
TABELA 65 HARDWARE DA ARÁBIA SAUDITA EM MONITORAMENTO DE SAÚDE ESTRUTURAL, POR TIPO, 2021-2030 (US$ MILHÕES)
TABELA 66 SENSORES DA ARÁBIA SAUDITA NO MONITORAMENTO DA SAÚDE ESTRUTURAL, POR TIPO, 2021-2030 (US$ MILHÕES)
TABELA 67 SERVIÇOS DE MONITORAMENTO DA SAÚDE ESTRUTURAL DA ARÁBIA SAUDITA, POR TIPO, 2021-2030 (US$ MILHÕES)
TABELA 68 INSTALAÇÃO NA ARÁBIA SAUDITA EM MONITORAMENTO DE SAÚDE ESTRUTURAL, POR TIPO, 2021-2030 (US$ MILHÕES)
TABELA 69 MONITORAMENTO DA SAÚDE ESTRUTURAL DA ARÁBIA SAUDITA, POR CONECTIVIDADE, 2021-2030 (US$ MILHÕES)
TABELA 70 MONITORAMENTO DA SAÚDE ESTRUTURAL DA ARÁBIA SAUDITA, POR TIPO DE INSTALAÇÃO, 2021-2030 (US$ MILHÕES)
TABELA 71 MONITORAMENTO DA SAÚDE ESTRUTURAL DA ARÁBIA SAUDITA, POR MÉTODO, 2021-2030 (MILHÕES DE DÓLARES)
TABELA 72 INSPEÇÃO VISUAL NA ARÁBIA SAUDITA NO MONITORAMENTO DA SAÚDE ESTRUTURAL, POR MÉTODO, 2021-2030 (MILHÕES DE DÓLARES)
TABELA 73 MONITORAMENTO DA SAÚDE ESTRUTURAL DA ARÁBIA SAUDITA, POR APLICAÇÃO, 2021-2030 (MILHÕES DE DÓLARES)
TABELA 74 MONITORAMENTO DE RUPTURA DE FIO NA ARÁBIA SAUDITA NO MONITORAMENTO DA SAÚDE ESTRUTURAL, POR APLICAÇÃO, 2021-2030 (US$ MILHÕES)
TABELA 75 MONITORAMENTO DA SAÚDE ESTRUTURAL DA ARÁBIA SAUDITA, POR USUÁRIO FINAL, 2021-2030 (MILHÕES DE DÓLARES)
TABELA 76 MONITORAMENTO DA SAÚDE ESTRUTURAL DA ARÁBIA SAUDITA, POR TIPO, 2021-2030 (US$ MILHÕES)
TABELA 77 ENERGIA DA ARÁBIA SAUDITA NO MONITORAMENTO DA SAÚDE ESTRUTURAL, POR TIPO, 2021-2030 (US$ MILHÕES)
TABELA 78 MONITORAMENTO DA SAÚDE ESTRUTURAL DA ARÁBIA SAUDITA, POR APLICAÇÃO, 2021-2030 (US$ MILHÕES)
TABELA 79 PONTES DA ARÁBIA SAUDITA NO MONITORAMENTO DA SAÚDE ESTRUTURAL, POR APLICAÇÃO, 2021-2030 (MILHÕES DE DÓLARES)
TABELA 80 TÚNEIS DA ARÁBIA SAUDITA NO MONITORAMENTO DA SAÚDE ESTRUTURAL, POR APLICAÇÃO, 2021-2030 (MILHÕES DE DÓLARES)
TABELA 81 BARRAGENS DA ARÁBIA SAUDITA NO MONITORAMENTO DA SAÚDE ESTRUTURAL, POR APLICAÇÃO, 2021-2030 (US$ MILHÕES)
TABELA 82 ESTRADAS DA ARÁBIA SAUDITA NO MONITORAMENTO DA SAÚDE ESTRUTURAL, POR APLICAÇÃO, 2021-2030 (US$ MILHÕES)
TABELA 83 ESTÁDIO DA ARÁBIA SAUDITA EM MONITORAMENTO DA SAÚDE ESTRUTURAL, POR APLICAÇÃO, 2021-2030 (MILHÕES DE DÓLARES)
TABELA 84 MONITORAMENTO DA SAÚDE ESTRUTURAL DA ARÁBIA SAUDITA AEROESPACIAL, POR APLICAÇÃO, 2021-2030 (US$ MILHÕES)
TABELA 85 ENERGIA DA ARÁBIA SAUDITA NO MONITORAMENTO DA SAÚDE ESTRUTURAL, POR APLICAÇÃO, 2021-2030 (MILHÕES DE DÓLARES)
TABELA 86 MONITORAMENTO DA SAÚDE ESTRUTURAL DA TURBINA EÓLICA DA ARÁBIA SAUDITA, POR APLICAÇÃO, 2021-2030 (MILHÕES DE DÓLARES)
TABELA 87 MINERAÇÃO NA ARÁBIA SAUDITA NO MONITORAMENTO DA SAÚDE ESTRUTURAL, POR APLICAÇÃO, 2021-2030 (US$ MILHÕES)
TABELA 88 MONITORAMENTO DA SAÚDE ESTRUTURAL MARINHA DA ARÁBIA SAUDITA, POR APLICAÇÃO, 2021-2030 (MILHÕES DE DÓLARES)
TABELA 89 MONITORAMENTO INDUSTRIAL DA SAÚDE ESTRUTURAL DA ARÁBIA SAUDITA, POR APLICAÇÃO, 2021-2030 (US$ MILHÕES)
TABELA 90 PLATAFORMA OFFSHORE DA ARÁBIA SAUDITA EM MONITORAMENTO DA SAÚDE ESTRUTURAL, POR APLICAÇÃO, 2021-2030 (US$ MILHÕES)
TABELA 91 PLATAFORMA DE DEFESA DA ARÁBIA SAUDITA EM MONITORAMENTO DA SAÚDE ESTRUTURAL, POR APLICAÇÃO, 2021-2030 (MILHÕES DE DÓLARES)
TABELA 92 ESCOLAS DA ARÁBIA SAUDITA EM MONITORAMENTO DA SAÚDE ESTRUTURAL, POR APLICAÇÃO, 2021-2030 (US$ MILHÕES)
TABELA 93 PARQUES PÚBLICOS E RECREAÇÃO DA ARÁBIA SAUDITA NO MONITORAMENTO DA SAÚDE ESTRUTURAL, POR APLICAÇÃO, 2021-2030 (MILHÕES DE DÓLARES)
TABELA 94 ARÁBIA SAUDITA AUTOMOTIVO EM PARQUES E RECREAÇÃO NO MONITORAMENTO DA SAÚDE ESTRUTURAL, POR APLICAÇÃO, 2021-2030 (US$ MILHÕES)
TABELA 95 MONITORAMENTO DA SAÚDE ESTRUTURAL NA ÁFRICA DO SUL, POR TIPO, 2021-2030 (MILHÕES DE DÓLARES)
TABELA 96 HARDWARE NA ÁFRICA DO SUL PARA MONITORAMENTO DA SAÚDE ESTRUTURAL, POR TIPO, 2021-2030 (US$ MILHÕES)
TABELA 97 SENSORES DA ÁFRICA DO SUL NO MONITORAMENTO DA SAÚDE ESTRUTURAL, POR TIPO, 2021-2030 (US$ MILHÕES)
TABELA 98 SERVIÇOS DE MONITORAMENTO DA SAÚDE ESTRUTURAL NA ÁFRICA DO SUL, POR TIPO, 2021-2030 (MILHÕES DE DÓLARES)
TABELA 99 INSTALAÇÃO NA ÁFRICA DO SUL EM MONITORAMENTO DE SAÚDE ESTRUTURAL, POR TIPO, 2021-2030 (US$ MILHÕES)
TABELA 100 MONITORAMENTO DA SAÚDE ESTRUTURAL NA ÁFRICA DO SUL, POR CONECTIVIDADE, 2021-2030 (MILHÕES DE DÓLARES)
TABELA 101 MONITORAMENTO DA SAÚDE ESTRUTURAL NA ÁFRICA DO SUL, POR TIPO DE INSTALAÇÃO, 2021-2030 (US$ MILHÕES)
TABELA 102 MONITORAMENTO DA SAÚDE ESTRUTURAL NA ÁFRICA DO SUL, POR MÉTODO, 2021-2030 (MILHÕES DE DÓLARES)
TABELA 103 INSPEÇÃO VISUAL NA ÁFRICA DO SUL NO MONITORAMENTO DA SAÚDE ESTRUTURAL, POR MÉTODO, 2021-2030 (US$ MILHÕES)
TABELA 104 MONITORAMENTO DA SAÚDE ESTRUTURAL NA ÁFRICA DO SUL, POR APLICAÇÃO, 2021-2030 (MILHÕES DE DÓLARES)
TABELA 105 MONITORAMENTO DE RUPTURA DE FIO NA ÁFRICA DO SUL NO MONITORAMENTO DA SAÚDE ESTRUTURAL, POR APLICAÇÃO, 2021-2030 (US$ MILHÕES)
TABELA 106 MONITORAMENTO DA SAÚDE ESTRUTURAL NA ÁFRICA DO SUL, POR USUÁRIO FINAL, 2021-2030 (MILHÕES DE DÓLARES)
TABELA 107 MONITORAMENTO DA SAÚDE ESTRUTURAL CIVIL NA ÁFRICA DO SUL, POR TIPO, 2021-2030 (US$ MILHÕES)
TABELA 108 ENERGIA DA ÁFRICA DO SUL NO MONITORAMENTO DA SAÚDE ESTRUTURAL, POR TIPO, 2021-2030 (US$ MILHÕES)
TABELA 109 AUMENTO DA MONITORIZAÇÃO DA SAÚDE ESTRUTURAL NA ÁFRICA DO SUL, POR APLICAÇÃO, 2021-2030 (MILHÕES DE DÓLARES)
TABELA 110 PONTES DA ÁFRICA DO SUL NO MONITORAMENTO DA SAÚDE ESTRUTURAL, POR APLICAÇÃO, 2021-2030 (MILHÕES DE DÓLARES)
TABELA 111 TÚNEIS DA ÁFRICA DO SUL NO MONITORAMENTO DA SAÚDE ESTRUTURAL, POR APLICAÇÃO, 2021-2030 (MILHÕES DE DÓLARES)
TABELA 112 BARRAGENS DA ÁFRICA DO SUL NO MONITORAMENTO DA SAÚDE ESTRUTURAL, POR APLICAÇÃO, 2021-2030 (US$ MILHÕES)
TABELA 113 ESTRADAS DA ÁFRICA DO SUL NO MONITORAMENTO DA SAÚDE ESTRUTURAL, POR APLICAÇÃO, 2021-2030 (MILHÕES DE DÓLARES)
TABELA 114 ESTÁDIO DA ÁFRICA DO SUL EM MONITORAMENTO DA SAÚDE ESTRUTURAL, POR APLICAÇÃO, 2021-2030 (US$ MILHÕES)
TABELA 115 MONITORAMENTO DA SAÚDE ESTRUTURAL NA ÁFRICA DO SUL AEROESPACIAL, POR APLICAÇÃO, 2021-2030 (MILHÕES DE DÓLARES)
TABELA 116 ENERGIA DA ÁFRICA DO SUL NO MONITORAMENTO DA SAÚDE ESTRUTURAL, POR APLICAÇÃO, 2021-2030 (MILHÕES DE DÓLARES)
TABELA 117 MONITORAMENTO DA SAÚDE ESTRUTURAL DE TURBINAS EÓLICAS DA ÁFRICA DO SUL, POR APLICAÇÃO, 2021-2030 (MILHÕES DE DÓLARES)
TABELA 118 MINERAÇÃO NA ÁFRICA DO SUL NO MONITORAMENTO DA SAÚDE ESTRUTURAL, POR APLICAÇÃO, 2021-2030 (US$ MILHÕES)
TABELA 119 MONITORAMENTO DA SAÚDE ESTRUTURAL MARINHA DA ÁFRICA DO SUL, POR APLICAÇÃO, 2021-2030 (MILHÕES DE DÓLARES)
TABELA 120 MONITORAMENTO INDUSTRIAL DA SAÚDE ESTRUTURAL NA ÁFRICA DO SUL, POR APLICAÇÃO, 2021-2030 (MILHÕES DE DÓLARES)
TABELA 121 PLATAFORMA OFFSHORE DA ÁFRICA DO SUL EM MONITORAMENTO DA SAÚDE ESTRUTURAL, POR APLICAÇÃO, 2021-2030 (US$ MILHÕES)
TABELA 122 PLATAFORMA DE DEFESA DA ÁFRICA DO SUL EM MONITORAMENTO DA SAÚDE ESTRUTURAL, POR APLICAÇÃO, 2021-2030 (US$ MILHÕES)
TABELA 123 ESCOLAS DA ÁFRICA DO SUL EM MONITORAMENTO DA SAÚDE ESTRUTURAL, POR APLICAÇÃO, 2021-2030 (US$ MILHÕES)
TABELA 124 PARQUES PÚBLICOS E RECREAÇÃO DA ÁFRICA DO SUL NO MONITORAMENTO DA SAÚDE ESTRUTURAL, POR APLICAÇÃO, 2021-2030 (US$ MILHÕES)
TABELA 125 ÁFRICA DO SUL AUTOMOTIVO EM PARQUES E RECREAÇÃO NO MONITORAMENTO DA SAÚDE ESTRUTURAL, POR APLICAÇÃO, 2021-2030 (US$ MILHÕES)
TABELA 126 MONITORAMENTO DA SAÚDE ESTRUTURAL NO EGITO, POR TIPO, 2021-2030 (MILHÕES DE DÓLARES)
TABELA 127 HARDWARE DO EGITO EM MONITORAMENTO DE SAÚDE ESTRUTURAL, POR TIPO, 2021-2030 (US$ MILHÕES)
TABELA 128 SENSORES DO EGITO NO MONITORAMENTO DA SAÚDE ESTRUTURAL, POR TIPO, 2021-2030 (US$ MILHÕES)
TABELA 129 SERVIÇOS DE MONITORAMENTO DA SAÚDE ESTRUTURAL NO EGITO, POR TIPO, 2021-2030 (US$ MILHÕES)
TABELA 130 INSTALAÇÃO NO EGITO EM MONITORAMENTO DE SAÚDE ESTRUTURAL, POR TIPO, 2021-2030 (US$ MILHÕES)
TABELA 131 MONITORAMENTO DA SAÚDE ESTRUTURAL DO EGITO, POR CONECTIVIDADE, 2021-2030 (MILHÕES DE DÓLARES)
TABELA 132 MONITORAMENTO DA SAÚDE ESTRUTURAL NO EGITO, POR TIPO DE INSTALAÇÃO, 2021-2030 (US$ MILHÕES)
TABELA 133 MONITORAMENTO DA SAÚDE ESTRUTURAL NO EGITO, POR MÉTODO, 2021-2030 (MILHÕES DE DÓLARES)
TABELA 134 INSPEÇÃO VISUAL NO EGITO NO MONITORAMENTO DA SAÚDE ESTRUTURAL, POR MÉTODO, 2021-2030 (US$ MILHÕES)
TABELA 135 MONITORAMENTO DA SAÚDE ESTRUTURAL DO EGITO, POR APLICAÇÃO, 2021-2030 (MILHÕES DE DÓLARES)
TABELA 136 MONITORAMENTO DE RUPTURA DE FIO NO EGITO NO MONITORAMENTO DA SAÚDE ESTRUTURAL, POR APLICAÇÃO, 2021-2030 (US$ MILHÕES)
TABELA 137 MONITORAMENTO DA SAÚDE ESTRUTURAL NO EGITO, POR USUÁRIO FINAL, 2021-2030 (MILHÕES DE DÓLARES)
TABELA 138 MONITORAMENTO DA SAÚDE ESTRUTURAL CIVIL NO EGITO, POR TIPO, 2021-2030 (US$ MILHÕES)
TABELA 139 EGITO ENERGIA NO MONITORAMENTO DA SAÚDE ESTRUTURAL, POR TIPO, 2021-2030 (US$ MILHÕES)
TABELA 140 MONITORAMENTO DA SAÚDE ESTRUTURAL EM EDIFÍCIOS DO EGITO, POR APLICAÇÃO, 2021-2030 (MILHÕES DE DÓLARES)
TABELA 141 PONTES DO EGITO NO MONITORAMENTO DA SAÚDE ESTRUTURAL, POR APLICAÇÃO, 2021-2030 (MILHÕES DE DÓLARES)
TABELA 142 TÚNEIS DO EGITO NO MONITORAMENTO DA SAÚDE ESTRUTURAL, POR APLICAÇÃO, 2021-2030 (MILHÕES DE DÓLARES)
TABELA 143 BARRAGENS DO EGITO NO MONITORAMENTO DA SAÚDE ESTRUTURAL, POR APLICAÇÃO, 2021-2030 (US$ MILHÕES)
TABELA 144 ESTRADAS DO EGITO NO MONITORAMENTO DA SAÚDE ESTRUTURAL, POR APLICAÇÃO, 2021-2030 (US$ MILHÕES)
TABELA 145 ESTÁDIO DO EGITO EM MONITORAMENTO DA SAÚDE ESTRUTURAL, POR APLICAÇÃO, 2021-2030 (US$ MILHÕES)
TABELA 146 EGITO AEROESPACIAL NO MONITORAMENTO DA SAÚDE ESTRUTURAL, POR APLICAÇÃO, 2021-2030 (US$ MILHÕES)
TABLE 147 EGYPT ENERGY IN STRUCTURAL HEALTH MONITORING, BY APPLICATION, 2021-2030 (USD MILLION)
TABLE 148 EGYPT WIND TURBINE IN STRUCTURAL HEALTH MONITORING, BY APPLICATION, 2021-2030 (USD MILLION)
TABLE 149 EGYPT MINING IN STRUCTURAL HEALTH MONITORING, BY APPLICATION, 2021-2030 (USD MILLION)
TABLE 150 EGYPT MARINE IN STRUCTURAL HEALTH MONITORING, BY APPLICATION, 2021-2030 (USD MILLION)
TABLE 151 EGYPT INDUSTRIAL IN STRUCTURAL HEALTH MONITORING, BY APPLICATION, 2021-2030 (USD MILLION)
TABLE 152 EGYPT OFFSHORE PLATFORM IN STRUCTURAL HEALTH MONITORING, BY APPLICATION, 2021-2030 (USD MILLION)
TABLE 153 EGYPT DEFENSE PLATFORM IN STRUCTURAL HEALTH MONITORING, BY APPLICATION, 2021-2030 (USD MILLION)
TABLE 154 EGYPT SCHOOLS IN STRUCTURAL HEALTH MONITORING, BY APPLICATION, 2021-2030 (USD MILLION)
TABLE 155 EGYPT PUBLIC PARKS AND RECREATION IN STRUCTURAL HEALTH MONITORING, BY APPLICATION, 2021-2030 (USD MILLION)
TABLE 156 EGYPT AUTOMOTIVE IN PARKS AND RECREATION IN STRUCTURAL HEALTH MONITORING, BY APPLICATION, 2021-2030 (USD MILLION)
TABLE 157 OMAN STRUCTURAL HEALTH MONITORING, BY TYPE, 2021-2030 (USD MILLION)
TABLE 158 OMAN HARDWARE IN STRUCTURAL HEALTH MONITORING, BY TYPE, 2021-2030 (USD MILLION)
TABLE 159 OMAN SENSORS IN STRUCTURAL HEALTH MONITORING, BY TYPE, 2021-2030 (USD MILLION)
TABLE 160 OMAN SERVICES IN STRUCTURAL HEALTH MONITORING, BY TYPE, 2021-2030 (USD MILLION)
TABLE 161 OMAN INSTALLATION IN STRUCTURAL HEALTH MONITORING, BY TYPE, 2021-2030 (USD MILLION)
TABLE 162 OMAN STRUCTURAL HEALTH MONITORING, BY CONNECTIVITY, 2021-2030 (USD MILLION)
TABLE 163 OMAN STRUCTURAL HEALTH MONITORING, BY INSTALLATION TYPE, 2021-2030 (USD MILLION)
TABLE 164 OMAN STRUCTURAL HEALTH MONITORING, BY METHOD, 2021-2030 (USD MILLION)
TABLE 165 OMAN VISUAL INSPECTION IN STRUCTURAL HEALTH MONITORING, BY METHOD, 2021-2030 (USD MILLION)
TABLE 166 OMAN STRUCTURAL HEALTH MONITORING, BY APPLICATION, 2021-2030 (USD MILLION)
TABLE 167 OMAN WIRE BREAK MONITORING IN STRUCTURAL HEALTH MONITORING, BY APPLICATION, 2021-2030 (USD MILLION)
TABLE 168 OMAN STRUCTURAL HEALTH MONITORING, BY END USER, 2021-2030 (USD MILLION)
TABLE 169 OMAN CIVIL IN STRUCTURAL HEALTH MONITORING, BY TYPE, 2021-2030 (USD MILLION)
TABLE 170 OMAN ENERGY IN STRUCTURAL HEALTH MONITORING, BY TYPE, 2021-2030 (USD MILLION)
TABLE 171 OMAN BUILDING IN STRUCTURAL HEALTH MONITORING, BY APPLICATION, 2021-2030 (USD MILLION)
TABLE 172 QATAR STRUCTURAL HEALTH MONITORING, BY TYPE, 2021-2030 (USD MILLION)
TABLE 173 QATAR HARDWARE IN STRUCTURAL HEALTH MONITORING, BY TYPE, 2021-2030 (USD MILLION)
TABLE 174 QATAR SENSORS IN STRUCTURAL HEALTH MONITORING, BY TYPE, 2021-2030 (USD MILLION)
TABLE 175 QATAR SERVICES IN STRUCTURAL HEALTH MONITORING, BY TYPE, 2021-2030 (USD MILLION)
TABLE 176 QATAR INSTALLATION IN STRUCTURAL HEALTH MONITORING, BY TYPE, 2021-2030 (USD MILLION)
TABLE 177 QATAR STRUCTURAL HEALTH MONITORING, BY CONNECTIVITY, 2021-2030 (USD MILLION)
TABLE 178 QATAR STRUCTURAL HEALTH MONITORING, BY INSTALLATION TYPE, 2021-2030 (USD MILLION)
TABLE 179 QATAR STRUCTURAL HEALTH MONITORING, BY METHOD, 2021-2030 (USD MILLION)
TABLE 180 QATAR VISUAL INSPECTION IN STRUCTURAL HEALTH MONITORING, BY METHOD, 2021-2030 (USD MILLION)
TABLE 181 QATAR STRUCTURAL HEALTH MONITORING, BY APPLICATION, 2021-2030 (USD MILLION)
TABLE 182 QATAR WIRE BREAK MONITORING IN STRUCTURAL HEALTH MONITORING, BY APPLICATION, 2021-2030 (USD MILLION)
TABLE 183 QATAR STRUCTURAL HEALTH MONITORING, BY END USER, 2021-2030 (USD MILLION)
TABLE 184 QATAR CIVIL IN STRUCTURAL HEALTH MONITORING, BY TYPE, 2021-2030 (USD MILLION)
TABLE 185 QATAR ENERGY IN STRUCTURAL HEALTH MONITORING, BY TYPE, 2021-2030 (USD MILLION)
TABLE 186 QATAR BUILDING IN STRUCTURAL HEALTH MONITORING, BY APPLICATION, 2021-2030 (USD MILLION)
TABLE 187 QATAR BRIDGES IN STRUCTURAL HEALTH MONITORING, BY APPLICATION, 2021-2030 (USD MILLION)
TABLE 188 QATAR TUNNELS IN STRUCTURAL HEALTH MONITORING, BY APPLICATION, 2021-2030 (USD MILLION)
TABLE 189 QATAR DAMS IN STRUCTURAL HEALTH MONITORING, BY APPLICATION, 2021-2030 (USD MILLION)
TABLE 190 QATAR ROADS IN STRUCTURAL HEALTH MONITORING, BY APPLICATION, 2021-2030 (USD MILLION)
TABLE 191 QATAR STADIUM IN STRUCTURAL HEALTH MONITORING, BY APPLICATION, 2021-2030 (USD MILLION)
TABLE 192 QATAR AEROSPACE IN STRUCTURAL HEALTH MONITORING, BY APPLICATION, 2021-2030 (USD MILLION)
TABLE 193 QATAR ENERGY IN STRUCTURAL HEALTH MONITORING, BY APPLICATION, 2021-2030 (USD MILLION)
TABLE 194 QATAR WIND TURBINE IN STRUCTURAL HEALTH MONITORING, BY APPLICATION, 2021-2030 (USD MILLION)
TABLE 195 QATAR MINING IN STRUCTURAL HEALTH MONITORING, BY APPLICATION, 2021-2030 (USD MILLION)
TABLE 196 QATAR MARINE IN STRUCTURAL HEALTH MONITORING, BY APPLICATION, 2021-2030 (USD MILLION)
TABLE 197 QATAR INDUSTRIAL IN STRUCTURAL HEALTH MONITORING, BY APPLICATION, 2021-2030 (USD MILLION)
TABLE 198 QATAR OFFSHORE PLATFORM IN STRUCTURAL HEALTH MONITORING, BY APPLICATION, 2021-2030 (USD MILLION)
TABLE 199 QATAR DEFENSE PLATFORM IN STRUCTURAL HEALTH MONITORING, BY APPLICATION, 2021-2030 (USD MILLION)
TABLE 200 QATAR SCHOOLS IN STRUCTURAL HEALTH MONITORING, BY APPLICATION, 2021-2030 (USD MILLION)
TABLE 201 QATAR PUBLIC PARKS AND RECREATION IN STRUCTURAL HEALTH MONITORING, BY APPLICATION, 2021-2030 (USD MILLION)
TABLE 202 QATAR AUTOMOTIVE IN PARKS AND RECREATION IN STRUCTURAL HEALTH MONITORING, BY APPLICATION, 2021-2030 (USD MILLION)
TABLE 203 KUWAIT STRUCTURAL HEALTH MONITORING, BY TYPE, 2021-2030 (USD MILLION)
TABLE 204 KUWAIT HARDWARE IN STRUCTURAL HEALTH MONITORING, BY TYPE, 2021-2030 (USD MILLION)
TABLE 205 KUWAIT SENSORS IN STRUCTURAL HEALTH MONITORING, BY TYPE, 2021-2030 (USD MILLION)
TABLE 206 KUWAIT SERVICES IN STRUCTURAL HEALTH MONITORING, BY TYPE, 2021-2030 (USD MILLION)
TABLE 207 KUWAIT INSTALLATION IN STRUCTURAL HEALTH MONITORING, BY TYPE, 2021-2030 (USD MILLION)
TABLE 208 KUWAIT STRUCTURAL HEALTH MONITORING, BY CONNECTIVITY, 2021-2030 (USD MILLION)
TABLE 209 KUWAIT STRUCTURAL HEALTH MONITORING, BY INSTALLATION TYPE, 2021-2030 (USD MILLION)
TABLE 210 KUWAIT STRUCTURAL HEALTH MONITORING, BY METHOD, 2021-2030 (USD MILLION)
TABLE 211 KUWAIT VISUAL INSPECTION IN STRUCTURAL HEALTH MONITORING, BY METHOD, 2021-2030 (USD MILLION)
TABLE 212 KUWAIT STRUCTURAL HEALTH MONITORING, BY APPLICATION, 2021-2030 (USD MILLION)
TABLE 213 KUWAIT WIRE BREAK MONITORING IN STRUCTURAL HEALTH MONITORING, BY APPLICATION, 2021-2030 (USD MILLION)
TABLE 214 KUWAIT STRUCTURAL HEALTH MONITORING, BY END USER, 2021-2030 (USD MILLION)
TABLE 215 KUWAIT CIVIL IN STRUCTURAL HEALTH MONITORING, BY TYPE, 2021-2030 (USD MILLION)
TABLE 216 KUWAIT ENERGY IN STRUCTURAL HEALTH MONITORING, BY TYPE, 2021-2030 (USD MILLION)
TABLE 217 KUWAIT BUILDING IN STRUCTURAL HEALTH MONITORING, BY APPLICATION, 2021-2030 (USD MILLION)
TABLE 218 KUWAIT BRIDGES IN STRUCTURAL HEALTH MONITORING, BY APPLICATION, 2021-2030 (USD MILLION)
TABLE 219 KUWAIT TUNNELS IN STRUCTURAL HEALTH MONITORING, BY APPLICATION, 2021-2030 (USD MILLION)
TABLE 220 KUWAIT DAMS IN STRUCTURAL HEALTH MONITORING, BY APPLICATION, 2021-2030 (USD MILLION)
TABLE 221 KUWAIT ROADS IN STRUCTURAL HEALTH MONITORING, BY APPLICATION, 2021-2030 (USD MILLION)
TABLE 222 KUWAIT STADIUM IN STRUCTURAL HEALTH MONITORING, BY APPLICATION, 2021-2030 (USD MILLION)
TABLE 223 KUWAIT AEROSPACE IN STRUCTURAL HEALTH MONITORING, BY APPLICATION, 2021-2030 (USD MILLION)
TABLE 224 KUWAIT ENERGY IN STRUCTURAL HEALTH MONITORING, BY APPLICATION, 2021-2030 (USD MILLION)
TABLE 225 KUWAIT WIND TURBINE IN STRUCTURAL HEALTH MONITORING, BY APPLICATION, 2021-2030 (USD MILLION)
TABLE 226 KUWAIT MINING IN STRUCTURAL HEALTH MONITORING, BY APPLICATION, 2021-2030 (USD MILLION)
TABLE 227 KUWAIT MARINE IN STRUCTURAL HEALTH MONITORING, BY APPLICATION, 2021-2030 (USD MILLION)
TABLE 228 KUWAIT INDUSTRIAL IN STRUCTURAL HEALTH MONITORING, BY APPLICATION, 2021-2030 (USD MILLION)
TABLE 229 KUWAIT OFFSHORE PLATFORM IN STRUCTURAL HEALTH MONITORING, BY APPLICATION, 2021-2030 (USD MILLION)
TABLE 230 KUWAIT DEFENSE PLATFORM IN STRUCTURAL HEALTH MONITORING, BY APPLICATION, 2021-2030 (USD MILLION)
TABLE 231 KUWAIT SCHOOLS IN STRUCTURAL HEALTH MONITORING, BY APPLICATION, 2021-2030 (USD MILLION)
TABLE 232 KUWAIT PUBLIC PARKS AND RECREATION IN STRUCTURAL HEALTH MONITORING, BY APPLICATION, 2021-2030 (USD MILLION)
TABLE 233 KUWAIT AUTOMOTIVE IN PARKS AND RECREATION IN STRUCTURAL HEALTH MONITORING, BY APPLICATION, 2021-2030 (USD MILLION)
TABLE 234 ISRAEL STRUCTURAL HEALTH MONITORING, BY TYPE, 2021-2030 (USD MILLION)
TABLE 235 ISRAEL HARDWARE IN STRUCTURAL HEALTH MONITORING, BY TYPE, 2021-2030 (USD MILLION)
TABLE 236 ISRAEL SENSORS IN STRUCTURAL HEALTH MONITORING, BY TYPE, 2021-2030 (USD MILLION)
TABLE 237 ISRAEL SERVICES IN STRUCTURAL HEALTH MONITORING, BY TYPE, 2021-2030 (USD MILLION)
TABLE 238 ISRAEL INSTALLATION IN STRUCTURAL HEALTH MONITORING, BY TYPE, 2021-2030 (USD MILLION)
TABLE 239 ISRAEL STRUCTURAL HEALTH MONITORING, BY CONNECTIVITY, 2021-2030 (USD MILLION)
TABLE 240 ISRAEL STRUCTURAL HEALTH MONITORING, BY INSTALLATION TYPE, 2021-2030 (USD MILLION)
TABELA 241 MONITORAMENTO DA SAÚDE ESTRUTURAL DE ISRAEL, POR MÉTODO, 2021-2030 (US$ MILHÕES)
TABELA 242 INSPEÇÃO VISUAL EM ISRAEL NO MONITORAMENTO DA SAÚDE ESTRUTURAL, POR MÉTODO, 2021-2030 (US$ MILHÕES)
TABELA 243 MONITORAMENTO DA SAÚDE ESTRUTURAL DE ISRAEL, POR APLICAÇÃO, 2021-2030 (US$ MILHÕES)
TABELA 244 MONITORAMENTO DE RUPTURA DE FIO EM ISRAEL NO MONITORAMENTO DA SAÚDE ESTRUTURAL, POR APLICAÇÃO, 2021-2030 (US$ MILHÕES)
TABELA 245 MONITORAMENTO DA SAÚDE ESTRUTURAL DE ISRAEL, POR USUÁRIO FINAL, 2021-2030 (US$ MILHÕES)
TABELA 246 MONITORAMENTO DA SAÚDE ESTRUTURAL CIVIL EM ISRAEL, POR TIPO, 2021-2030 (US$ MILHÕES)
TABELA 247 ENERGIA DE ISRAEL NO MONITORAMENTO DA SAÚDE ESTRUTURAL, POR TIPO, 2021-2030 (US$ MILHÕES)
TABELA 248 MONITORAMENTO DA SAÚDE ESTRUTURAL EM ISRAEL, POR APLICAÇÃO, 2021-2030 (US$ MILHÕES)
TABELA 249 PONTES DE ISRAEL NO MONITORAMENTO DA SAÚDE ESTRUTURAL, POR APLICAÇÃO, 2021-2030 (US$ MILHÕES)
TABELA 250 TÚNEIS DE ISRAEL NO MONITORAMENTO DA SAÚDE ESTRUTURAL, POR APLICAÇÃO, 2021-2030 (US$ MILHÕES)
TABELA 251 BARRAGENS DE ISRAEL NO MONITORAMENTO DA SAÚDE ESTRUTURAL, POR APLICAÇÃO, 2021-2030 (US$ MILHÕES)
TABELA 252 ESTRADAS DE ISRAEL NO MONITORAMENTO DA SAÚDE ESTRUTURAL, POR APLICAÇÃO, 2021-2030 (US$ MILHÕES)
TABELA 253 ESTÁDIO DE ISRAEL EM MONITORAMENTO DA SAÚDE ESTRUTURAL, POR APLICAÇÃO, 2021-2030 (US$ MILHÕES)
TABELA 254 MONITORAMENTO DA SAÚDE ESTRUTURAL DA AEROESPACIAL DE ISRAEL, POR APLICAÇÃO, 2021-2030 (US$ MILHÕES)
TABELA 255 ENERGIA DE ISRAEL NO MONITORAMENTO DA SAÚDE ESTRUTURAL, POR APLICAÇÃO, 2021-2030 (US$ MILHÕES)
TABELA 256 MONITORAMENTO DA SAÚDE ESTRUTURAL DA TURBINA EÓLICA DE ISRAEL, POR APLICAÇÃO, 2021-2030 (US$ MILHÕES)
TABELA 257 MINERAÇÃO EM ISRAEL NO MONITORAMENTO DA SAÚDE ESTRUTURAL, POR APLICAÇÃO, 2021-2030 (US$ MILHÕES)
TABELA 258 MONITORAMENTO DA SAÚDE ESTRUTURAL MARINHA DE ISRAEL, POR APLICAÇÃO, 2021-2030 (US$ MILHÕES)
TABELA 259 MONITORAMENTO INDUSTRIAL DA SAÚDE ESTRUTURAL DE ISRAEL, POR APLICAÇÃO, 2021-2030 (US$ MILHÕES)
TABELA 260 PLATAFORMA OFFSHORE DE ISRAEL EM MONITORAMENTO DA SAÚDE ESTRUTURAL, POR APLICAÇÃO, 2021-2030 (US$ MILHÕES)
TABELA 261 PLATAFORMA DE DEFESA DE ISRAEL NO MONITORAMENTO DA SAÚDE ESTRUTURAL, POR APLICAÇÃO, 2021-2030 (US$ MILHÕES)
TABELA 262 ESCOLAS DE ISRAEL EM MONITORAMENTO DA SAÚDE ESTRUTURAL, POR APLICAÇÃO, 2021-2030 (US$ MILHÕES)
TABELA 263 PARQUES PÚBLICOS E RECREAÇÃO DE ISRAEL NO MONITORAMENTO DA SAÚDE ESTRUTURAL, POR APLICAÇÃO, 2021-2030 (US$ MILHÕES)
TABELA 264 ISRAEL AUTOMOTIVO EM PARQUES E RECREAÇÃO NO MONITORAMENTO DA SAÚDE ESTRUTURAL, POR APLICAÇÃO, 2021-2030 (US$ MILHÕES)
TABELA 265 MONITORAMENTO DA SAÚDE ESTRUTURAL NO BAHREIN, POR TIPO, 2021-2030 (MILHÕES DE DÓLARES)
TABELA 266 HARDWARE NO MONITORAMENTO DA SAÚDE ESTRUTURAL DO BAHREIN, POR TIPO, 2021-2030 (US$ MILHÕES)
TABELA 267 SENSORES DO BAHREIN NO MONITORAMENTO DA SAÚDE ESTRUTURAL, POR TIPO, 2021-2030 (US$ MILHÕES)
TABELA 268 SERVIÇOS DE MONITORAMENTO DA SAÚDE ESTRUTURAL NO BAHREIN, POR TIPO, 2021-2030 (US$ MILHÕES)
TABELA 269 INSTALAÇÃO NO BAHREIN EM MONITORAMENTO DE SAÚDE ESTRUTURAL, POR TIPO, 2021-2030 (US$ MILHÕES)
TABELA 270 MONITORAMENTO DA SAÚDE ESTRUTURAL NO BAHREIN, POR CONECTIVIDADE, 2021-2030 (US$ MILHÕES)
TABELA 271 MONITORAMENTO DA SAÚDE ESTRUTURAL NO BAHREIN, POR TIPO DE INSTALAÇÃO, 2021-2030 (US$ MILHÕES)
TABELA 272 MONITORAMENTO DA SAÚDE ESTRUTURAL NO BAHREIN, POR MÉTODO, 2021-2030 (MILHÕES DE DÓLARES)
TABELA 273 INSPEÇÃO VISUAL NO MONITORAMENTO DA SAÚDE ESTRUTURAL NO BAHREIN, POR MÉTODO, 2021-2030 (MILHÕES DE DÓLARES)
TABELA 274 MONITORAMENTO DA SAÚDE ESTRUTURAL DO BAHREIN, POR APLICAÇÃO, 2021-2030 (MILHÕES DE DÓLARES)
TABELA 275 MONITORAMENTO DE RUPTURA DE FIO NO BAHREIN NO MONITORAMENTO DA SAÚDE ESTRUTURAL, POR APLICAÇÃO, 2021-2030 (US$ MILHÕES)
TABELA 276 MONITORAMENTO DA SAÚDE ESTRUTURAL NO BAHREIN, POR USUÁRIO FINAL, 2021-2030 (MILHÕES DE DÓLARES)
TABELA 277 MONITORAMENTO DA SAÚDE ESTRUTURAL CIVIL NO BAHREIN, POR TIPO, 2021-2030 (MILHÕES DE DÓLARES)
TABELA 278 ENERGIA DO BAHREIN NO MONITORAMENTO DA SAÚDE ESTRUTURAL, POR TIPO, 2021-2030 (US$ MILHÕES)
TABELA 279 MONITORAMENTO DA SAÚDE ESTRUTURAL NO BAHREIN, POR APLICAÇÃO, 2021-2030 (MILHÕES DE DÓLARES)
TABELA 280 PONTES DO BAHREIN EM MONITORAMENTO DA SAÚDE ESTRUTURAL, POR APLICAÇÃO, 2021-2030 (MILHÕES DE DÓLARES)
TABELA 281 TÚNEIS DO BAHREIN NO MONITORAMENTO DA SAÚDE ESTRUTURAL, POR APLICAÇÃO, 2021-2030 (MILHÕES DE DÓLARES)
TABELA 282 BARRAGENS DO BAHREIN NO MONITORAMENTO DA SAÚDE ESTRUTURAL, POR APLICAÇÃO, 2021-2030 (MILHÕES DE DÓLARES)
TABELA 283 ESTRADAS DO BAHREIN NO MONITORAMENTO DA SAÚDE ESTRUTURAL, POR APLICAÇÃO, 2021-2030 (MILHÕES DE DÓLARES)
TABELA 284 ESTÁDIO DO BAHRAIN EM MONITORAMENTO DA SAÚDE ESTRUTURAL, POR APLICAÇÃO, 2021-2030 (MILHÕES DE DÓLARES)
TABELA 285 MONITORAMENTO DA SAÚDE ESTRUTURAL DO BAHREIN AEROESPACIAL, POR APLICAÇÃO, 2021-2030 (MILHÕES DE DÓLARES)
TABELA 286 ENERGIA DO BAHREIN NO MONITORAMENTO DA SAÚDE ESTRUTURAL, POR APLICAÇÃO, 2021-2030 (MILHÕES DE DÓLARES)
TABELA 287 MONITORAMENTO DA SAÚDE ESTRUTURAL DA TURBINA EÓLICA DO BAHREIN, POR APLICAÇÃO, 2021-2030 (MILHÕES DE DÓLARES)
TABELA 288 MINERAÇÃO NO BAHREIN NO MONITORAMENTO DA SAÚDE ESTRUTURAL, POR APLICAÇÃO, 2021-2030 (US$ MILHÕES)
TABELA 289 MONITORAMENTO DA SAÚDE ESTRUTURAL MARINHA DO BAHREIN, POR APLICAÇÃO, 2021-2030 (MILHÕES DE DÓLARES)
TABELA 290 MONITORAMENTO INDUSTRIAL DA SAÚDE ESTRUTURAL NO BAHREIN, POR APLICAÇÃO, 2021-2030 (MILHÕES DE DÓLARES)
TABELA 291 PLATAFORMA OFFSHORE DO BAHREIN EM MONITORAMENTO DA SAÚDE ESTRUTURAL, POR APLICAÇÃO, 2021-2030 (US$ MILHÕES)
TABELA 292 PLATAFORMA DE DEFESA DO BAHREIN EM MONITORAMENTO DA SAÚDE ESTRUTURAL, POR APLICAÇÃO, 2021-2030 (MILHÕES DE DÓLARES)
TABELA 293 ESCOLAS DO BAHREIN EM MONITORAMENTO DA SAÚDE ESTRUTURAL, POR APLICAÇÃO, 2021-2030 (US$ MILHÕES)
TABELA 294 PARQUES PÚBLICOS E RECREAÇÃO DO BAHREIN NO MONITORAMENTO DA SAÚDE ESTRUTURAL, POR APLICAÇÃO, 2021-2030 (MILHÕES DE DÓLARES)
TABELA 295 BAHREIN AUTOMOTIVE EM PARQUES E RECREAÇÃO NO MONITORAMENTO DA SAÚDE ESTRUTURAL, POR APLICAÇÃO, 2021-2030 (US$ MILHÕES)
TABELA 296 MONITORAMENTO DA SAÚDE ESTRUTURAL NO RESTO DO ORIENTE MÉDIO E ÁFRICA, POR TIPO, 2021-2030 (MILHÕES DE DÓLARES)
Lista de Figura
FIGURA 1 MERCADO DE MONITORAMENTO DE SAÚDE ESTRUTURAL NO ORIENTE MÉDIO E ÁFRICA: SEGMENTAÇÃO
FIGURA 2 MERCADO DE MONITORAMENTO DE SAÚDE ESTRUTURAL NO ORIENTE MÉDIO E ÁFRICA: TRIANGULAÇÃO DE DADOS
FIGURA 3 MERCADO DE MONITORAMENTO DA SAÚDE ESTRUTURAL NO ORIENTE MÉDIO E ÁFRICA: ANÁLISE DROC
FIGURA 4 MERCADO DE MONITORAMENTO DA SAÚDE ESTRUTURAL NO ORIENTE MÉDIO E ÁFRICA: ANÁLISE DE MERCADO REGIONAL VS ORIENTE MÉDIO E ÁFRICA
FIGURA 5 MERCADO DE MONITORAMENTO DA SAÚDE ESTRUTURAL NO ORIENTE MÉDIO E ÁFRICA: ANÁLISE DE PESQUISA DA EMPRESA
FIGURE 6 MIDDLE EAST AND AFRICA STRUCTURAL HEALTH MONITORING MARKET: INTERVIEW DEMOGRAPHICS
FIGURE 7 MIDDLE EAST AND AFRICA STRUCTURAL HEALTH MONITORING MARKET: DBMR MARKET POSITION GRID
FIGURE 8 MIDDLE EAST AND AFRICA STRUCTURAL HEALTH MONITORING MARKET: VENDOR SHARE ANALYSIS
FIGURE 9 MIDDLE EAST AND AFRICA STRUCTURAL HEALTH MONITORING MARKET: MARKET APPLICATION COVERAGE GRID
FIGURE 10 MIDDLE EAST AND AFRICA STRUCTURAL HEALTH MONITORING MARKET: SEGMENTATION
FIGURE 11 GROWING INFRASTRUCTURAL DEVELOPMENT ACROSS THE GLOBE AND IMPROVED SAFETY AND MAINTAINABILITY OF CRITICAL STRUCTURES ARE EXPECTED TO DRIVE THE MIDDLE EAST AND AFRICA STRUCTURAL HEALTH MONITORING MARKET IN THE FORECAST PERIOD OF 2023 TO 2030
FIGURE 12 HARDWARE SEGMENT IS EXPECTED TO ACCOUNT FOR THE LARGEST SHARE OF THE MIDDLE EAST AND AFRICA STRUCTURAL HEALTH MONITORING MARKET IN 2023 & 2030
FIGURE 13 DRIVERS, RESTRAINT, OPPORTUNITIES AND CHALLENGES OF THE MIDDLE EAST AND AFRICA STRUCTURAL HEALTH MONITORING MARKET
FIGURE 14 REGIONAL SHARE OF MIDDLE EAST AND AFRICA INFRASTRUCTURE INVESTMENT
FIGURE 15 MIDDLE EAST AND AFRICA STRUCTURAL HEALTH MONITORING MARKET: BY TYPE, 2022
FIGURE 16 MIDDLE EAST AND AFRICA STRUCTURAL HEALTH MONITORING MARKET: BY CONNECTIVITY, 2022
FIGURE 17 MIDDLE EAST AND AFRICA STRUCTURAL HEALTH MONITORING MARKET: BY INSTALLATION TYPE, 2022
FIGURE 18 MIDDLE EAST AND AFRICA STRUCTURAL HEALTH MONITORING MARKET: BY METHOD, 2022
FIGURE 19 MIDDLE EAST AND AFRICA STRUCTURAL HEALTH MONITORING MARKET: BY APPLICATION, 2022
FIGURE 20 MIDDLE EAST AND AFRICA STRUCTURAL HEALTH MONITORING MARKET: BY END USER, 2022
FIGURE 21 MIDDLE EAST AND AFRICA STRUCTURAL HEALTH MONITORING MARKET: SNAPSHOT (2023)
FIGURE 22 MIDDLE EAST AND AFRICA STRUCTURAL HEALTH MONITORING MARKET: COMPANY SHARE 2022 (%)
Metodologia de Investigação
A recolha de dados e a análise do ano base são feitas através de módulos de recolha de dados com amostras grandes. A etapa inclui a obtenção de informações de mercado ou dados relacionados através de diversas fontes e estratégias. Inclui examinar e planear antecipadamente todos os dados adquiridos no passado. Da mesma forma, envolve o exame de inconsistências de informação observadas em diferentes fontes de informação. Os dados de mercado são analisados e estimados utilizando modelos estatísticos e coerentes de mercado. Além disso, a análise da quota de mercado e a análise das principais tendências são os principais fatores de sucesso no relatório de mercado. Para saber mais, solicite uma chamada de analista ou abra a sua consulta.
A principal metodologia de investigação utilizada pela equipa de investigação do DBMR é a triangulação de dados que envolve a mineração de dados, a análise do impacto das variáveis de dados no mercado e a validação primária (especialista do setor). Os modelos de dados incluem grelha de posicionamento de fornecedores, análise da linha de tempo do mercado, visão geral e guia de mercado, grelha de posicionamento da empresa, análise de patentes, análise de preços, análise da quota de mercado da empresa, normas de medição, análise global versus regional e de participação dos fornecedores. Para saber mais sobre a metodologia de investigação, faça uma consulta para falar com os nossos especialistas do setor.
Personalização disponível
A Data Bridge Market Research é líder em investigação formativa avançada. Orgulhamo-nos de servir os nossos clientes novos e existentes com dados e análises que correspondem e atendem aos seus objetivos. O relatório pode ser personalizado para incluir análise de tendências de preços de marcas-alvo, compreensão do mercado para países adicionais (solicite a lista de países), dados de resultados de ensaios clínicos, revisão de literatura, mercado remodelado e análise de base de produtos . A análise de mercado dos concorrentes-alvo pode ser analisada desde análises baseadas em tecnologia até estratégias de carteira de mercado. Podemos adicionar quantos concorrentes necessitar de dados no formato e estilo de dados que procura. A nossa equipa de analistas também pode fornecer dados em tabelas dinâmicas de ficheiros Excel em bruto (livro de factos) ou pode ajudá-lo a criar apresentações a partir dos conjuntos de dados disponíveis no relatório.

