North America Cleanroom Particle Counters Market
Tamanho do mercado em biliões de dólares
CAGR :
% 
 USD
85.99 Billion
USD
161.53 Billion
2025
2033
USD
85.99 Billion
USD
161.53 Billion
2025
2033
| 2026 –2033 | |
| USD 85.99 Billion | |
| USD 161.53 Billion | |
| % | |
|
Segmentação do mercado de contadores de partículas para salas limpas na América do Norte, por tipo (contador de partículas portátil, contador de partículas de mão e contador de partículas remoto), tamanho de partícula (0,1 µm – 0,2 µm, 0,2 µm – 0,3 µm, 0,3 µm – 0,5 µm, 0,5 µm – 5 µm e mais de 5 µm), capacidade de vazão (baixa vazão, vazão padrão e alta vazão), instalação (pequena, grande), usuário final (indústria farmacêutica e biotecnológica , indústria de semicondutores e eletrônica, indústria química e outras), canal de distribuição (licitações diretas e distribuidores terceirizados) - Tendências e previsões do setor até 2033.
Tamanho do mercado de contadores de partículas para salas limpas na América do Norte
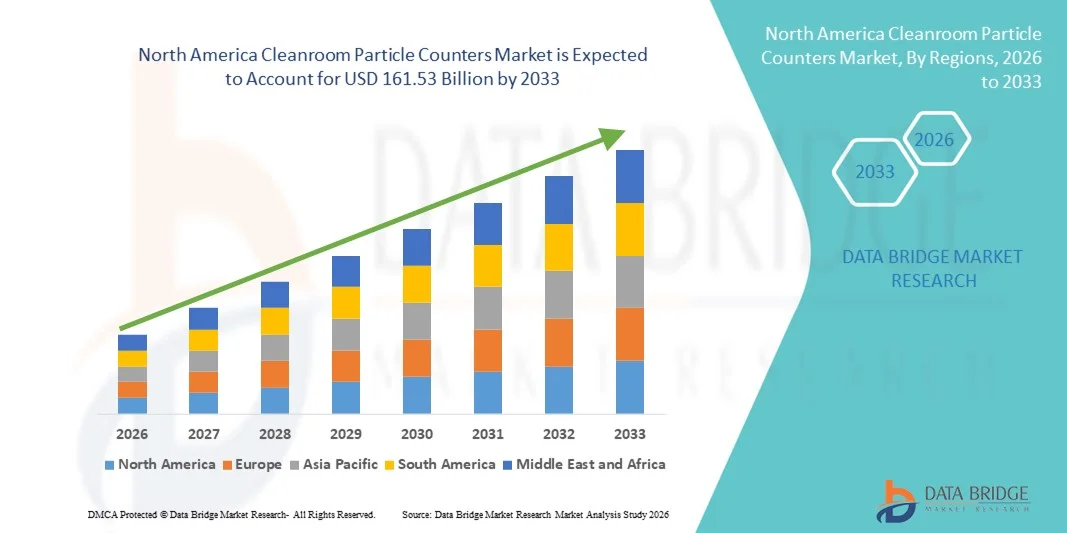
- O mercado de contadores de partículas para salas limpas na América do Norte foi avaliado em US$ 85,99 bilhões em 2025 e deverá atingir US$ 161,53 bilhões até 2033 , com uma taxa de crescimento anual composta (CAGR) de 8,20% durante o período de previsão.
- O crescimento do mercado é impulsionado principalmente pela crescente demanda por controle de contaminação e pelas rigorosas normas regulatórias em setores como o farmacêutico, biotecnológico, de dispositivos médicos e de fabricação de semicondutores, o que leva a uma maior adoção de contadores de partículas para salas limpas, visando a manutenção de ambientes controlados e a garantia da qualidade do produto.
- Além disso, o aumento dos investimentos em instalações de fabricação avançadas, a expansão das atividades de pesquisa e desenvolvimento e a crescente ênfase na conformidade com as normas GMP, ISO e FDA estão consolidando os contadores de partículas para salas limpas como ferramentas essenciais de monitoramento em ambientes de produção críticos. Esses fatores convergentes estão acelerando a adoção de soluções de contadores de partículas para salas limpas, impulsionando significativamente o crescimento do setor.
Análise do mercado de contadores de partículas para salas limpas na América do Norte
- Os contadores de partículas para salas limpas, projetados para detectar e medir partículas em suspensão no ar em ambientes controlados, são componentes cada vez mais vitais dos sistemas de controle de contaminação em instalações de fabricação farmacêutica, biotecnológica, de semicondutores e de dispositivos médicos, devido à sua capacidade de garantir a conformidade regulatória, a qualidade do produto e a segurança operacional.
- A crescente demanda por contadores de partículas para salas limpas é impulsionada principalmente por requisitos regulatórios rigorosos, como as normas GMP, ISO 14644 e FDA, pelos investimentos crescentes em instalações de fabricação estéril e pela necessidade cada vez maior de monitoramento ambiental em tempo real para minimizar os riscos de contaminação em processos de produção críticos.
- Os EUA dominaram o mercado de contadores de partículas para salas limpas na América do Norte, com a maior participação de receita, de 78,5% em 2025, impulsionados pela forte presença de empresas farmacêuticas e de biotecnologia líderes, pela expansão das instalações de fabricação de produtos biológicos e vacinas, pelas fábricas de semicondutores avançados e pelos rigorosos padrões regulatórios impostos por agências como a FDA e as autoridades ISO. Os investimentos contínuos do país em ambientes de fabricação estéreis e na produção de microeletrônica de alta tecnologia estão fortalecendo ainda mais a demanda do mercado.
- Prevê-se que o Canadá seja o mercado de crescimento mais rápido na América do Norte durante o período de previsão, impulsionado pelo aumento dos investimentos na produção farmacêutica, pela expansão dos laboratórios de pesquisa, pelo crescimento das iniciativas no setor de semicondutores e pelo foco crescente na conformidade regulatória em ambientes controlados. O Canadá representou aproximadamente 21,5% da participação no mercado regional em 2025, e os avanços contínuos na área da saúde e na infraestrutura de salas limpas estão acelerando a expansão do mercado.
- O segmento de Grandes Instalações dominou o mercado com uma participação de 48,5% na receita em 2025, impulsionado pela presença de salas limpas de alta capacidade na fabricação de produtos farmacêuticos, produção biotecnológica e fábricas de semicondutores.
Escopo do relatório e segmentação do mercado de contadores de partículas para salas limpas
|
Atributos |
Principais informações de mercado sobre contadores de partículas para salas limpas |
|
Segmentos abrangidos |
|
|
Países abrangidos |
América do Norte
Europa
Ásia-Pacífico
Oriente Médio e África
Ámérica do Sul
|
|
Principais participantes do mercado |
|
|
Oportunidades de mercado |
|
|
Conjuntos de informações de dados de valor agregado |
Além das informações sobre cenários de mercado, como valor de mercado, taxa de crescimento, segmentação, cobertura geográfica e principais participantes, os relatórios de mercado elaborados pela Data Bridge Market Research também incluem análises aprofundadas de especialistas, epidemiologia de pacientes, análise de projetos em desenvolvimento, análise de preços e estrutura regulatória. |
Tendências do mercado de contadores de partículas para salas limpas na América do Norte
Avanços no monitoramento em tempo real e na integração de dados
- Uma tendência significativa e crescente no mercado global de contadores de partículas para salas limpas é a adoção cada vez maior de sistemas avançados de monitoramento em tempo real, integrados a plataformas centralizadas de gerenciamento de dados. Esses sistemas permitem o rastreamento contínuo das concentrações de partículas em suspensão no ar, garantindo a estrita conformidade com os padrões de salas limpas em diversos setores, como o farmacêutico, o biotecnológico, o de semicondutores e o da saúde.
- Por exemplo, os principais fabricantes estão lançando contadores de partículas portáteis e remotos equipados com interfaces de tela sensível ao toque e recursos de armazenamento de dados em nuvem, permitindo que os gerentes de instalações monitorem os níveis de contaminação em várias zonas de salas limpas simultaneamente.
- A integração de recursos de monitoramento remoto permite alertas instantâneos quando a contagem de partículas excede os limites permitidos, ajudando a prevenir a contaminação do produto e a paralisação da produção. Isso é particularmente crítico em ambientes de fabricação farmacêutica, onde a conformidade com as normas ISO e GMP é obrigatória.
- A crescente ênfase na conformidade regulatória e na garantia da qualidade está incentivando a implantação de sistemas de monitoramento ambiental contínuo em vez de testes manuais periódicos. Os contadores de partículas para salas limpas estão sendo integrados a estruturas mais amplas de monitoramento ambiental, juntamente com amostradores de ar microbianos e sistemas de validação de HVAC.
- Essa mudança em direção a soluções automatizadas, de alta precisão e conectadas em rede para monitoramento de partículas está remodelando as estratégias de controle de contaminação em ambientes controlados, impulsionando a inovação e o desenvolvimento de produtos no mercado.
Dinâmica do mercado de contadores de partículas para salas limpas na América do Norte
Motorista
Normas regulatórias rigorosas e expansão da produção farmacêutica
- A crescente aplicação de normas regulamentares rigorosas relacionadas ao controle de contaminação na fabricação de produtos farmacêuticos, biotecnológicos e de dispositivos médicos é um dos principais impulsionadores do mercado de contadores de partículas para salas limpas. As autoridades reguladoras exigem o monitoramento contínuo da qualidade do ar para garantir a conformidade com as classificações ISO de salas limpas e as diretrizes de Boas Práticas de Fabricação (BPF).
- A rápida expansão das instalações de produção farmacêutica, unidades de fabricação de vacinas e centros de pesquisa de produtos biológicos em todo o mundo está aumentando significativamente a demanda por sistemas confiáveis de monitoramento de partículas.
- Por exemplo, a expansão de fábricas de injetáveis estéreis e unidades de fabricação de semicondutores na região Ásia-Pacífico e na América do Norte levou ao aumento da instalação de contadores de partículas fixos e portáteis para manter as condições de salas limpas validadas.
- Além disso, o aumento na fabricação de semicondutores e na produção de eletrônicos de precisão, onde até mesmo a contaminação microscópica pode causar defeitos nos produtos, está reforçando ainda mais a necessidade de equipamentos de contagem de partículas de alta sensibilidade.
- O aumento dos investimentos em infraestrutura de saúde e em laboratórios de pesquisa em ciências da vida também está contribuindo para o crescimento constante do mercado.
Restrição/Desafio
Altos custos de equipamentos e requisitos de manutenção
- O elevado custo inicial dos contadores de partículas avançados para salas limpas, particularmente os modelos remotos e de alta sensibilidade, representa uma restrição para instalações de fabricação de pequeno e médio porte.
- Por exemplo, contadores de partículas multicanal com software integrado de registro de dados e conformidade podem exigir investimentos de capital significativos, limitando sua adoção em mercados sensíveis a custos.
- Os requisitos regulares de calibração, manutenção e validação aumentam as despesas operacionais, uma vez que esses dispositivos devem atender a padrões regulamentares e de precisão rigorosos.
- A complexidade técnica e a necessidade de pessoal qualificado para operar e interpretar os dados de monitoramento podem representar um desafio adicional para instalações menores que não possuem conhecimento especializado.
- Superar as barreiras de custo por meio da padronização de produtos, soluções de monitoramento escaláveis e processos de manutenção simplificados será essencial para garantir uma penetração de mercado mais ampla e um crescimento sustentável do setor.
Escopo do mercado de contadores de partículas para salas limpas na América do Norte
O mercado é segmentado com base no tipo, tamanho das partículas, capacidade de vazão, instalação, usuário final e canal de distribuição.
- Por tipo
Com base no tipo, o mercado global de contadores de partículas para salas limpas é segmentado em contadores de partículas portáteis, contadores de partículas de mão e contadores de partículas remotos. O segmento de contadores de partículas portáteis dominou a maior participação de mercado em receita, com 39,6% em 2025, impulsionado por sua ampla adoção em salas limpas farmacêuticas e de semicondutores para monitoramento e validação de rotina. Os sistemas portáteis oferecem flexibilidade, alta precisão e conformidade com as normas ISO 14644 e GMP. Esses dispositivos são amplamente utilizados para certificação de salas limpas, testes de HVAC e solução de problemas de contaminação. A crescente fiscalização regulatória em ambientes de fabricação estéril sustenta a demanda. Sua capacidade de medir múltiplos tamanhos de partículas simultaneamente aumenta a eficiência operacional. A expansão da produção farmacêutica global impulsiona ainda mais as aquisições. Os modelos portáteis são preferidos para monitoramento periódico em instalações de médio a grande porte. Os avanços tecnológicos melhoraram a vida útil da bateria e os recursos de registro de dados. A crescente adoção em farmácias de manipulação hospitalares fortalece o uso. A demanda por controle de contaminação na fabricação de vacinas também contribui para o crescimento. O aumento dos projetos de construção de salas limpas em todo o mundo sustenta as vendas de equipamentos. A combinação de confiabilidade e mobilidade garante a continuidade da dominância.
Prevê-se que o segmento de Contadores Remotos de Partículas apresente a taxa de crescimento anual composta (CAGR) mais rápida, de 9,2%, entre 2026 e 2033, impulsionado pela crescente automação em sistemas de monitoramento de salas limpas. Os sistemas remotos permitem o monitoramento contínuo em tempo real e a integração com softwares de gestão de instalações. A crescente demanda por controle ininterrupto de contaminação em fábricas de semicondutores impulsiona a adoção. Esses contadores reduzem a intervenção manual e aumentam a precisão dos dados. O uso crescente em salas limpas de alta qualidade, classes ISO 1 a 3, também contribui para o crescimento. A integração com plataformas baseadas em IoT permite a manutenção preditiva e a geração de relatórios de conformidade. Os fabricantes farmacêuticos preferem cada vez mais sistemas de monitoramento centralizados. O aumento dos investimentos em instalações de manufatura inteligentes acelera a demanda. Os sistemas remotos melhoram a transparência operacional e a preparação para auditorias. A necessidade de monitoramento ambiental 24 horas por dia, 7 dias por semana, fortalece ainda mais a adoção. A expansão das instalações de produção de produtos biológicos e terapia celular impulsiona o crescimento do segmento. A inovação contínua na miniaturização de sensores aumenta a flexibilidade de instalação.
- Por tamanho de partícula
Com base no tamanho das partículas, o mercado é segmentado em 0,1 µm–0,2 µm, 0,2 µm–0,3 µm, 0,3 µm–0,5 µm, 0,5 µm–5 µm e mais de 5 µm. O segmento de 0,3 µm–0,5 µm detinha a maior participação na receita de mercado, com 31,8% em 2025, visto que essa faixa é amplamente utilizada como referência padrão para a classificação de salas limpas de acordo com as diretrizes da ISO. A maioria das normas regulatórias exige monitoramento nos limites de 0,3 µm e 0,5 µm. A fabricação estéril de produtos farmacêuticos depende fortemente dessa faixa de tamanho de partícula. A fabricação de semicondutores também exige monitoramento preciso nesse nível. Esses tamanhos de partícula são indicadores críticos de contaminação do ar. Os equipamentos calibrados para essa faixa são altamente padronizados. As crescentes exigências de conformidade global sustentam a demanda. Hospitais e laboratórios de pesquisa também priorizam essa faixa de medição. Auditorias contínuas de qualidade na produção de medicamentos reforçam ainda mais a posição dominante. A gama de produtos equilibra sensibilidade e praticidade operacional. A expansão da aplicação das Boas Práticas de Fabricação (BPF) em nível global impulsiona a adoção. O foco crescente na fabricação de injetáveis estéreis fortalece o segmento.
Prevê-se que o segmento de 0,1 µm a 0,2 µm registre a taxa de crescimento anual composta (CAGR) mais rápida, de 10,4%, entre 2026 e 2033, impulsionado pela crescente demanda das indústrias de semicondutores avançados e nanotecnologia. A detecção de partículas ultrafinas é essencial na fabricação de microeletrônica. O aumento da produção de chips menores exige um controle de contaminação aprimorado. O crescimento da pesquisa em nanofarmacêuticos sustenta a demanda. Esses contadores oferecem maior sensibilidade para ambientes críticos de alta precisão. Os investimentos crescentes em fábricas de alta precisão aceleram o crescimento. O rigor regulatório na fabricação de produtos biológicos também impulsiona a adoção. Os avanços tecnológicos melhoraram a eficiência da detecção em tamanhos ultrabaixos. O aumento das atividades de P&D em biotecnologia fortalece o potencial de mercado. Os padrões emergentes para salas limpas em indústrias avançadas impulsionam ainda mais a adoção. A demanda por sistemas de monitoramento ultrafino em tempo real aumenta globalmente. A inovação contínua na tecnologia de detecção a laser aumenta a confiabilidade.
- Por capacidade de vazão
Com base na capacidade de vazão, o mercado é segmentado em Baixo Fluxo, Fluxo Padrão e Alto Fluxo. O segmento de Fluxo Padrão representou a maior participação na receita, com 44,5% em 2025, por oferecer uma taxa de amostragem equilibrada, adequada para a maioria das salas limpas farmacêuticas e industriais. Os sistemas de fluxo padrão proporcionam contagem de partículas confiável com custos operacionais moderados. São amplamente utilizados em salas limpas de classe ISO 5 a 8. As instalações de produção farmacêutica preferem o fluxo padrão para validação e monitoramento. Esses sistemas garantem a conformidade sem consumo excessivo de energia. Sua versatilidade permite o uso em diversos setores. O aumento das inspeções regulatórias fortalece a adoção. O crescimento da produção de vacinas e medicamentos injetáveis impulsiona a demanda. Os contadores de fluxo padrão oferecem resultados precisos e repetíveis. Sua compatibilidade com sistemas portáteis e remotos aumenta a flexibilidade. A expansão de ambientes de fabricação limpos sustenta as vendas. A relação custo-benefício equilibrada garante a dominância do mercado.
O segmento de Alto Fluxo deverá apresentar a taxa de crescimento anual composta (CAGR) mais rápida, de 8,9%, entre 2026 e 2033, impulsionado pela demanda por amostragem rápida em grandes áreas de salas limpas. Os sistemas de alto fluxo reduzem significativamente o tempo de amostragem. As fábricas de semicondutores exigem detecção rápida e precisa de contaminação. Grandes indústrias farmacêuticas se beneficiam de ciclos de monitoramento mais rápidos. Esses sistemas aumentam a eficiência durante os processos de certificação. O crescimento da produção de produtos biológicos em larga escala sustenta a demanda. O aumento na construção de megafábricas impulsiona o crescimento. Os avanços tecnológicos reduzem o ruído do sistema e o consumo de energia. Os contadores de alto fluxo melhoram a produtividade em ambientes industriais. A expansão de grandes unidades estéreis hospitalares também contribui para a adoção. Os crescentes padrões de garantia de qualidade fortalecem a expansão do segmento.
- Por Instalação
Com base no tipo de instalação, o mercado é segmentado em Instalações de Pequeno Porte e Instalações de Grande Porte. O segmento de Instalações de Grande Porte dominou o mercado com uma participação de 48,5% da receita em 2025, impulsionado pela presença de salas limpas de alta capacidade na fabricação de produtos farmacêuticos, produção biotecnológica e fábricas de semicondutores. Operações em larga escala exigem monitoramento contínuo de partículas para atender às rigorosas normas GMP, ISO e FDA. A expansão da fabricação de produtos biológicos e vacinas em todo o mundo aumenta a adoção de contadores de partículas para salas limpas. Laboratórios de pesquisa avançada e organizações de fabricação por contrato (CMOs) dependem de sistemas de monitoramento de alto rendimento. Salas limpas de grande porte exigem integração com sistemas de gerenciamento de instalações para rastreamento de contaminação em tempo real. Inspeções regulatórias exigem protocolos de monitoramento validados. A crescente tendência de operações automatizadas em salas limpas reforça ainda mais a demanda. Os altos investimentos iniciais são compensados pela necessidade crítica de controle de contaminação. Instalações multiproduto também se beneficiam de soluções escaláveis de contadores de partículas. O aumento dos gastos com P&D em todo o mundo apoia a aquisição de equipamentos. Iniciativas governamentais para a expansão dos setores farmacêutico e de semicondutores impulsionam o crescimento do mercado.
Prevê-se que o segmento de Pequenas Instalações cresça à taxa composta de crescimento anual (CAGR) mais rápida, de 8,9%, de 2026 a 2033, impulsionado pela crescente adoção de salas limpas compactas em laboratórios de pesquisa, startups e unidades de produção especializadas. Laboratórios farmacêuticos e biotecnológicos de pequena escala necessitam de contadores de partículas portáteis ou de mão para maior flexibilidade e custo-benefício. O crescente interesse em terapia celular, terapia gênica e medicina personalizada promove a instalação de salas limpas em instalações menores. Instituições acadêmicas e a produção em escala piloto também impulsionam a adoção. Projetos de salas limpas compactas e configurações modulares exigem soluções de monitoramento de partículas sensíveis e com pequena área ocupada. A crescente disponibilidade de contadores acessíveis e fáceis de usar apoia o crescimento de pequenas instalações. As diretrizes regulatórias, mesmo para pequenas unidades de produção, reforçam o monitoramento de contaminação. A expansão de laboratórios de teste de semicondutores localizados contribui para a adoção. Startups e centros de P&D de nicho preferem contadores de partículas versáteis, capazes de uso em múltiplas instalações. No geral, o número crescente de pequenas instalações de salas limpas em todo o mundo destaca uma forte trajetória de crescimento para este segmento.
- Por usuário final
Com base no usuário final, o mercado é segmentado em Indústria Farmacêutica e Biotecnológica, Indústria de Semicondutores e Eletrônica, Indústria Química e Outros. O segmento da Indústria Farmacêutica e Biotecnológica dominou o mercado com uma participação de 42,7% da receita em 2025, impulsionado pelas rigorosas regulamentações de Boas Práticas de Fabricação (BPF) e pelos requisitos de controle de contaminação. A expansão da fabricação de vacinas em todo o mundo aumenta a demanda. O aumento da produção de produtos biológicos e terapias celulares impulsiona ainda mais a adoção. As inspeções regulatórias exigem monitoramento contínuo. O crescimento da produção de injetáveis estéreis sustenta as vendas de equipamentos. As salas limpas farmacêuticas exigem sistemas validados de monitoramento de partículas. A expansão dos laboratórios de P&D aprimora as aquisições. O aumento dos gastos com saúde em todo o mundo fortalece o crescimento. Os programas de garantia da qualidade reforçam os requisitos de monitoramento. As regulamentações governamentais garantem a demanda sustentada. A crescente terceirização para organizações de fabricação por contrato (CMOs) também impulsiona a adoção.
Prevê-se que o segmento da Indústria de Semicondutores e Eletrônica apresente o crescimento mais rápido, com uma taxa composta de crescimento anual (CAGR) de 9,8% entre 2026 e 2033, impulsionado pela rápida expansão das fábricas de chips em todo o mundo. A fabricação de nós avançados exige ambientes ultralimpos. A crescente demanda por eletrônicos de consumo acelera a produção. O aumento do investimento em fábricas de semicondutores sustenta a demanda por equipamentos. Os padrões de salas limpas na fabricação de eletrônicos estão se tornando mais rigorosos. O crescimento da inteligência artificial (IA) e da computação de alto desempenho aumenta a produção de chips. A expansão da eletrônica para veículos elétricos impulsiona a fabricação de semicondutores. A inovação contínua em microeletrônica reforça as necessidades de controle de contaminação. Os governos estão investindo fortemente na produção nacional de chips. A miniaturização tecnológica aumenta ainda mais os requisitos de sensibilidade de monitoramento.
- Por canal de distribuição
Com base no canal de distribuição, o mercado é segmentado em Licitações Diretas e Distribuidores Terceirizados. O segmento de Licitações Diretas detinha a maior participação na receita de mercado, com 53,1% em 2025, impulsionado por compras em grande volume por fabricantes farmacêuticos e fábricas de semicondutores. Grandes instalações preferem a compra direta para otimizar custos. Contratos diretos garantem acordos de serviço de longo prazo. Os fabricantes fornecem serviços de instalação e calibração. Projetos de salas limpas financiados pelo governo frequentemente realizam compras por meio de licitações. O fornecimento direto reduz os custos de intermediação. A crescente expansão da infraestrutura apoia as compras por meio de licitações. Compradores institucionais priorizam a aquisição de equipamentos padronizados. Contratos de longo prazo fortalecem o relacionamento com os fornecedores.
O segmento de distribuidores terceirizados deverá apresentar a taxa de crescimento anual composta (CAGR) mais rápida, de 8,5%, entre 2026 e 2033, impulsionado pela crescente demanda de instalações de salas limpas de pequeno e médio porte. Os distribuidores oferecem opções de compra flexíveis, garantindo entrega rápida e suporte técnico local. Laboratórios menores dependem fortemente das redes de distribuição. A expansão dos mercados regionais fortalece os canais de distribuição. Os serviços pós-venda aumentam a fidelização de clientes. O crescimento dos laboratórios de saúde e pesquisa impulsiona o crescimento das vendas. Estratégias de preços competitivos estimulam ainda mais a adoção.
Análise Regional do Mercado de Contadores de Partículas para Salas Limpas na América do Norte
- A América do Norte dominou o mercado de contadores de partículas para salas limpas, com a maior participação de receita, de 36,8% em 2025, caracterizada por uma forte presença de empresas farmacêuticas e de biotecnologia, infraestrutura avançada de fabricação de semicondutores e rigorosa aplicação de regulamentações.
- A região beneficia-se de padrões bem estabelecidos para salas limpas e da alta adoção de sistemas de monitoramento ambiental contínuo nas indústrias de ciências da vida e eletrônica.
- A estrutura regulatória rigorosa que rege a produção de medicamentos estéreis, a fabricação de produtos biológicos e a montagem de dispositivos médicos impulsiona uma demanda constante por sistemas de monitoramento de partículas em suspensão de alta precisão. Além disso, os avanços tecnológicos e a elevada capacidade de investimento de capital entre os fabricantes reforçam ainda mais a liderança do mercado regional.
Análise do Mercado de Contadores de Partículas para Salas Limpas nos EUA:
O mercado de contadores de partículas para salas limpas nos EUA representou a maior fatia da receita na América do Norte em 2025, com 78,5%, e projeta-se que cresça a uma taxa composta de crescimento anual (CAGR) significativa durante o período de previsão. O crescimento do mercado é atribuído principalmente à forte presença de empresas farmacêuticas e de biotecnologia líderes, à rápida expansão das instalações de fabricação de produtos biológicos e vacinas e ao número crescente de fábricas de semicondutores avançados em todo o país. Além disso, as rigorosas estruturas regulatórias impostas pelo FDA e a adesão aos padrões ISO para salas limpas estão impulsionando a ampla adoção de sistemas avançados de monitoramento de partículas. Investimentos contínuos em ambientes de fabricação estéreis, produção de microeletrônica de alta tecnologia e tecnologias de monitoramento ambiental em tempo real reforçam ainda mais a posição dominante do mercado americano na região.
Panorama do Mercado de Contadores de Partículas para Salas Limpas no Canadá:
O Canadá representou aproximadamente 21,5% do mercado de contadores de partículas para salas limpas na América do Norte em 2025 e prevê-se que seja o país de crescimento mais rápido na região durante o período de previsão. O crescimento é impulsionado pelo aumento dos investimentos em instalações de produção farmacêutica, expansão de laboratórios de pesquisa, crescente iniciativa de fabricação de semicondutores e eletrônicos e uma ênfase cada vez maior na conformidade regulatória em ambientes controlados. Além disso, o apoio governamental à inovação na área da saúde e os avanços na infraestrutura de salas limpas estão acelerando a adoção de tecnologias de contagem de partículas, posicionando o Canadá como um mercado emergente de rápido crescimento na América do Norte.
Participação de mercado de contadores de partículas para salas limpas na América do Norte
O setor de contadores de partículas para salas limpas é liderado principalmente por empresas consolidadas, incluindo:
- TSI Incorporated (EUA)
- Sistemas de Medição de Partículas (EUA)
- Lighthouse Worldwide Solutions (EUA)
- Beckman Coulter, Inc. (EUA)
- RION Co., Ltd. (Japão)
- Empresa de instrumentos Climet (EUA)
- Met One Instruments, Inc. (EUA)
- Kanomax USA, Inc. (EUA)
- PAMAS GmbH (Alemanha)
- Grimm Aerosol Technik GmbH & Co. KG (Alemanha)
- Aeroqual Limited (Nova Zelândia)
- Fluke Corporation (EUA)
- Extech Instruments (EUA)
- Topas GmbH (Alemanha)
- Empresa Hach (EUA)
- Sensirion AG (Suíça)
- Setra Systems, Inc. (EUA)
- Tecnologia Airy (EUA)
- Alphasense Ltda. (Reino Unido)
Novidades no mercado de contadores de partículas para salas limpas na América do Norte
- Em setembro de 2021, a Particle Measuring Systems lançou a Série PRO de Instrumentos de Contaminação, uma linha completa que abrange contadores de partículas viáveis, não viáveis, remotas e portáteis para salas limpas, projetados para auxiliar fabricantes nas indústrias farmacêutica, de semicondutores e biotecnológica a aprimorar o controle de contaminação e a conformidade regulatória.
- Em fevereiro de 2021, a Beckman Coulter Inc. recebeu reconhecimento da indústria por seu contador de partículas MET ONE 3400+, que ganhou um prêmio por inovação e valor em aplicações farmacêuticas e de saúde, aumentando significativamente a visibilidade e a adoção global em ambientes de salas limpas regulamentadas.
- Em fevereiro de 2023, a TSI lançou o contador de partículas portátil AeroTrak+, que oferece classificação e monitoramento simplificados de salas limpas, atendendo aos padrões globais e ajudando os técnicos a avaliar e manter rapidamente a qualidade do ar em salas limpas críticas para a indústria farmacêutica e de manufatura.
- Em outubro de 2023, a Particle Measuring Systems lançou o contador de partículas aerotransportadas Lasair Pro, projetado para aprimorar o monitoramento e a classificação de áreas limpas em ambientes críticos, como linhas de produção farmacêutica e fábricas de semicondutores, oferecendo um desempenho robusto na contagem de partículas para conformidade com as normas regulatórias.
SKU-
Obtenha acesso online ao relatório sobre a primeira nuvem de inteligência de mercado do mundo

- Painel interativo de análise de dados
- Painel de análise da empresa para oportunidades de elevado potencial de crescimento
- Acesso de analista de pesquisa para personalização e customização. consultas
- Análise da concorrência com painel interativo
- Últimas notícias, atualizações e atualizações Análise de tendências
- Aproveite o poder da análise de benchmark para um rastreio abrangente da concorrência
Metodologia de Investigação
A recolha de dados e a análise do ano base são feitas através de módulos de recolha de dados com amostras grandes. A etapa inclui a obtenção de informações de mercado ou dados relacionados através de diversas fontes e estratégias. Inclui examinar e planear antecipadamente todos os dados adquiridos no passado. Da mesma forma, envolve o exame de inconsistências de informação observadas em diferentes fontes de informação. Os dados de mercado são analisados e estimados utilizando modelos estatísticos e coerentes de mercado. Além disso, a análise da quota de mercado e a análise das principais tendências são os principais fatores de sucesso no relatório de mercado. Para saber mais, solicite uma chamada de analista ou abra a sua consulta.
A principal metodologia de investigação utilizada pela equipa de investigação do DBMR é a triangulação de dados que envolve a mineração de dados, a análise do impacto das variáveis de dados no mercado e a validação primária (especialista do setor). Os modelos de dados incluem grelha de posicionamento de fornecedores, análise da linha de tempo do mercado, visão geral e guia de mercado, grelha de posicionamento da empresa, análise de patentes, análise de preços, análise da quota de mercado da empresa, normas de medição, análise global versus regional e de participação dos fornecedores. Para saber mais sobre a metodologia de investigação, faça uma consulta para falar com os nossos especialistas do setor.
Personalização disponível
A Data Bridge Market Research é líder em investigação formativa avançada. Orgulhamo-nos de servir os nossos clientes novos e existentes com dados e análises que correspondem e atendem aos seus objetivos. O relatório pode ser personalizado para incluir análise de tendências de preços de marcas-alvo, compreensão do mercado para países adicionais (solicite a lista de países), dados de resultados de ensaios clínicos, revisão de literatura, mercado remodelado e análise de base de produtos . A análise de mercado dos concorrentes-alvo pode ser analisada desde análises baseadas em tecnologia até estratégias de carteira de mercado. Podemos adicionar quantos concorrentes necessitar de dados no formato e estilo de dados que procura. A nossa equipa de analistas também pode fornecer dados em tabelas dinâmicas de ficheiros Excel em bruto (livro de factos) ou pode ajudá-lo a criar apresentações a partir dos conjuntos de dados disponíveis no relatório.

