North America Smart Home Market
Tamanho do mercado em biliões de dólares
CAGR :
% 
 USD
79.65 Billion
USD
305.53 Billion
2025
2033
USD
79.65 Billion
USD
305.53 Billion
2025
2033
| 2026 –2033 | |
| USD 79.65 Billion | |
| USD 305.53 Billion | |
| % | |
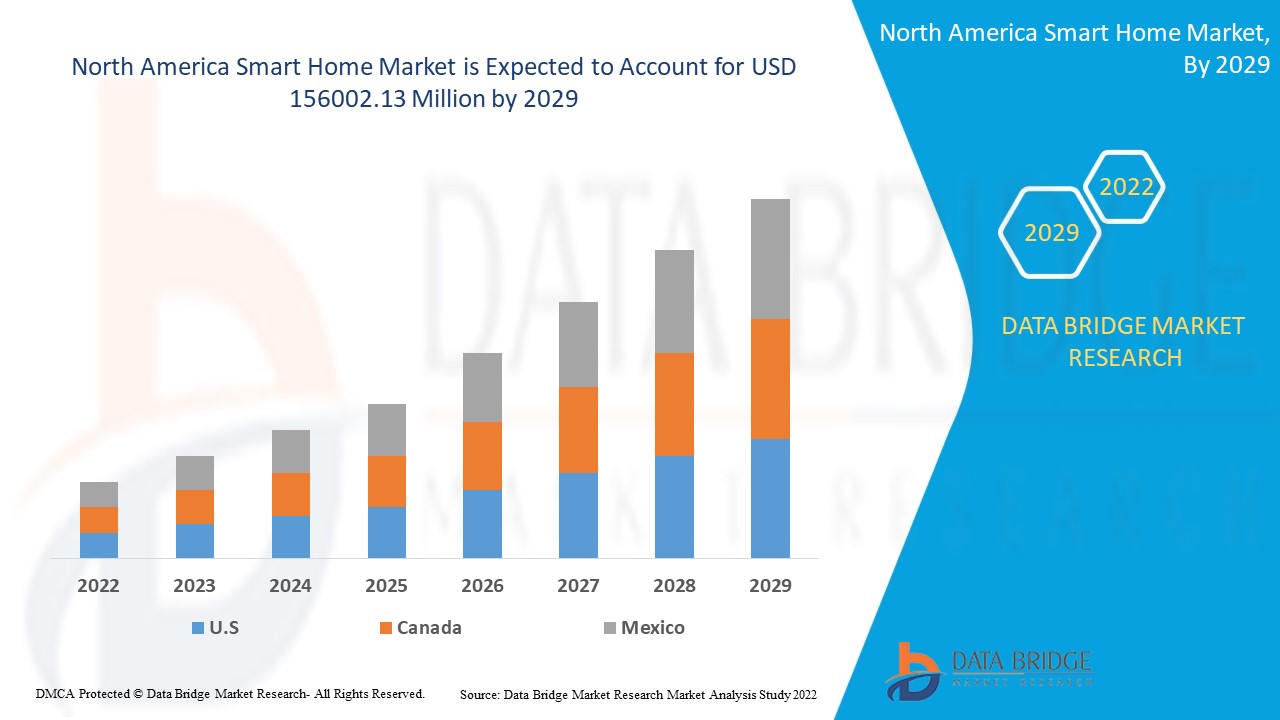
North America Smart Home Market, By Product Type (Entertainment Controls, Security and Access Control, HVAC Control, Home Appliances, Smart Kitchen, Lighting Control, Smart Furniture, Home Healthcare, Others), Technology (Wireless, Wired), Software and Service (Behavioral, Proactive), Sales Channel (Direct, Indirect) – Industry Trends and Forecast to 2029.
Market Analysis and Size
Smart homes are being high preferred among population as these are incorporated with advanced automated systems that are capable of controlling, temperature, multi-media, entertainment systems, security, thermostats, and window and door operations.
North America Smart Home Market was valued at USD 33150.75 million in 2021 and is expected to reach USD 156002.13 million by 2029, registering a CAGR of 18.30% during the forecast period of 2022-2029. Wireless accounts for the largest technology segment in the respective market owing to the rising number of IoT based devices. The market report curated by the Data Bridge Market Research team includes in-depth expert analysis, import/export analysis, pricing analysis, production consumption analysis, and pestle analysis.
Market Definition
Smart home devices are appropriate for a home setup in which devices may be operated remotely using a mobile or other networked device from any Internet-connected location in the world. The consumer may control services such as security access, temperature, lighting, and home entertainment in a smart home because all of its gadgets are connected to the Internet.
Report Scope and Market Segmentation
|
Report Metric |
Details |
|
Forecast Period |
2022 to 2029 |
|
Base Year |
2021 |
|
Historic Years |
2020 (Customizable to 2019 - 2014) |
|
Quantitative Units |
Revenue in USD Million, Volumes in Units, Pricing in USD |
|
Segments Covered |
Product Type (Entertainment Controls, Security and Access Control, HVAC Control, Home Appliances, Smart Kitchen, Lighting Control, Smart Furniture, Home Healthcare, Others), Technology (Wireless, Wired), Software and Service (Behavioral, Proactive), Sales Channel (Direct, Indirect) |
|
Countries Covered |
U.S., Canada and Mexico in North America |
|
Market Players Covered |
Honeywell International Inc. (U.S.), Siemens (Germany), Johnson Controls (Ireland), Axis Communications AB (Sweden), Schneider Electric (France), ASSA ABLOY (Sweden), Amazon (U.S.), Apple Inc., (U.S.), ADT (US), ABB (Switzerland), Robert Bosch GmbH (Germany), Sony Corporation (Japan), Samsung (South Korea), Ooma Inc., (U.S.), Delta Controls (Canada), Comcast (U.S.), Crestron Electronics Inc., (U.S.), SimpliSafe Inc., (U.S.), Armorax (U.S.), LG Electronics (South Korea), Lutron Electronics Co., Inc (U.S.) and Legrand (France) |
|
Market Opportunities |
|
North America Smart Home Market Dynamics
This section deals with understanding the market drivers, advantages, opportunities, restraints and challenges. All of this is discussed in detail as below:
Drivers
- Energy Efficiency and Low Carbon Emissions
The growing need for energy-saving and low-carbon-emission-oriented solutions propels the global smart home market. Energy efficiency is an important aspect of a country's economic development. There has been a growing demand to reduce energy usage and carbon emissions as a result of rising global warming and regulatory regulations. Smart homes account for a significant percentage of the world's total energy consumption. This factor is projected to be the most significant factor driving the growth for this market.
- Surge in Number of Smart Buildings
Additionally, with the growing urbanization in developing economies, there has been a surge in smart buildings, which is estimated to bolster the market's overall growth. Furthermore, the increasing number of internet users, growing adoption of smart devices, and increasing customer preference for video doorbells, voice-assisted technologies (such as Alexa and Google Home) and surveillance systems also further fuels market growth.
- Concerns Regarding Safety
Growing concerns regarding safety, security and public convenience also cushions the market's growth within the forecasted period. Moreover, the connected devices help consumers control and monitor the home appliances and office devices remotely from their smartphones or tablets, which acts as a market driver.
Additionally, rapid urbanization, change in lifestyle, surge in investments and increased consumer spending positively impact the smart home market.
Opportunities
- Technology Penetration and Investment
The penetration of IoT, z-wave, Wi-Fi, Bluetooth technology coupled with the investment in smart home security devices are estimated to generate lucrative opportunities for the market, which will further expand the smart home market's growth rate in the future. Additionally, the shifted focus on improving energy efficiency will also offer numerous growth opportunities within the market.
Restraints/Challenges North America Smart Home Market
- High Cost
The high cost for smart home setups is serving as a market restraint. The price range is expected to obstruct market growth.
- Increased Security and Privacy Concerns
Also, the consumer security and privacy concerns with more connected devices are projected to be challenge for the smart home market over the forecast period.
This smart home market report provides details of new recent developments, trade regulations, import-export analysis, production analysis, value chain optimization, market share, impact of domestic and localized market players, analyses opportunities in terms of emerging revenue pockets, changes in market regulations, strategic market growth analysis, market size, category market growths, application niches and dominance, product approvals, product launches, geographic expansions, technological innovations in the market. To gain more info on smart home market contact Data Bridge Market Research for an Analyst Brief, our team will help you take an informed market decision to achieve market growth.
Covid-19 Impact on North America Smart Home Market
The smart home market was immensely impacted by the outbreak of COVID-19. The pandemic has significantly damaged and disrupted supply chain hubs across all major end verticals across the globe. The lockdown harmed production across the globe and will exacerbate the existing manufacturing slump and trade uncertainty. The United States has been hit the worst in manufacturing, with China's production capacity falling by over 14% and worldwide electronic component sales falling by nearly 40%. The industrial industry, which accounts for roughly 17% of global GDP, is one of the worst-affected sectors during the COVID-19 epidemic. China is in the epicenter of the pandemic and the hub for most raw material suppliers who supply raw materials and components to a variety of manufacturing units around the world. This has had a direct influence on global FDI inflows, and as a result, some economies around the world have experienced significant declines. The worldwide standoff has stifled production at these plants, causing the entire supply chain to fall apart.
To combat the spread of the virus and for economic reasons, large industrial corporations have closed their facilities and laid off their personnel. To survive during the pandemic, some manufacturers have begun to change their companies in order to be able to provide crucial or high-demand products.
Recent Developments
- In January 2021, Samsung introduced big capacity Variable Refrigerant Flow (VRF) air conditioning systems that can be placed in upscale apartments, villas, bungalows, houses, and commercial and retail businesses, in just 0.5 sq. m of area in India. Using the SmartThings app on any smartphone, the Wi-Fi-enabled DVM S Eco series delivers smart features like voice control and a linked home experience. For added convenience, each indoor unit can be controlled independently. Current, daily, weekly, or even monthly energy consumption can be tracked based on the use of outside equipment to provide energy efficiency. The DVM S Eco series is simple to install, with up to 16 indoor devices able to be set up at once.
North America Smart Home Market Scope
The smart home market is segmented on the basis of product type, technology, software and service and sales channel. The growth amongst these segments will help you analyze meagre growth segments in the industries and provide the users with a valuable market overview and market insights to help them make strategic decisions for identifying core market applications.
Product Type
- Entertainment Controls
- Security and Access Control
- HVAC Control
- Home Appliances
- Smart Kitchen
- Lighting Control
- Smart Furniture
- Home Healthcare
- Others
On the basis of product type, the smart home market is segmented into entertainment controls, security and access control, HVAC control, home appliances, smart kitchen, lighting control, smart furniture, home healthcare and others. The home appliances will hold the largest market share owing to the market availability of wireless solutions that have enabled smart appliances to connect with smartphones and tablets wirelessly via the Internet or Bluetooth.
Technology
- Wireless
- Wired
On the basis of technology, the smart home market is segmented into wireless and wired.
Software and Service
- Behavioral
- Proactive
On the basis of software and service, the smart home market is segmented into behavioral and proactive.
Sales Channel
- Direct
- Indirect
On the basis of sales channel, the smart home market is segmented into direct and indirect.
North America Smart Home Market Regional Analysis/Insights
The smart home market is analysed and market size insights and trends are provided by country, product type, technology, software and service and sales channel as referenced above.
The countries covered in the smart home market report are U.S., Canada and Mexico in North America.
U.S. country is dominating the North America smart home market due to supporting infrastructure and strong product offering owing to strong manufactures base. North America smart home market is growing due to the increasing adoption of IoT based home devices and supporting strong connectivity solution.
The country section of the report also provides individual market impacting factors and changes in regulation in the market domestically that impacts the current and future trends of the market. Data points like down-stream and upstream value chain analysis, technical trends and porter's five forces analysis, case studies are some of the pointers used to forecast the market scenario for individual countries. Also, the presence and availability of global brands and their challenges faced due to large or scarce competition from local and domestic brands, impact of domestic tariffs and trade routes are considered while providing forecast analysis of the country data.
Competitive Landscape and North America Smart Home Market
The smart home market competitive landscape provides details by competitor. Details included are company overview, company financials, revenue generated, market potential, investment in research and development, new market initiatives, global presence, production sites and facilities, production capacities, company strengths and weaknesses, product launch, product width and breadth, application dominance. The above data points provided are only related to the companies' focus related to smart home market.
Some of the major players operating in the smart home market are
- Honeywell International Inc. (U.S.)
- Siemens (Germany)
- Johnson Controls (Ireland)
- Axis Communications AB (Sweden)
- Schneider Electric (France)
- ASSA ABLOY (Sweden)
- Amazon (U.S.)
- Apple Inc., (U.S.)
- ADT (US)
- ABB (Switzerland)
- Robert Bosch GmbH (Germany)
- Sony Corporation (Japan)
- Samsung (South Korea)
- Ooma Inc., (U.S.)
- Delta Controls (Canada)
- Comcast (U.S.)
- Crestron Electronics Inc., (U.S.)
- SimpliSafe Inc., (U.S.)
- Armorax (U.S.)
- LG Electronics (South Korea)
- Lutron Electronics Co., Inc (U.S.)
- Legrand (France)
SKU-
Obtenha acesso online ao relatório sobre a primeira nuvem de inteligência de mercado do mundo

- Painel interativo de análise de dados
- Painel de análise da empresa para oportunidades de elevado potencial de crescimento
- Acesso de analista de pesquisa para personalização e customização. consultas
- Análise da concorrência com painel interativo
- Últimas notícias, atualizações e atualizações Análise de tendências
- Aproveite o poder da análise de benchmark para um rastreio abrangente da concorrência
Índice
1 INTRODUÇÃO
1.1 OBJETIVOS DO ESTUDO
1.2 DEFINIÇÃO DE MERCADO
1.3 VISÃO GERAL DO MERCADO IMOBILIÁRIO INTELIGENTE DA AMÉRICA DO NORTE
1.4 MOEDA E PREÇOS
1.5 LIMITAÇÕES
1.6 MERCADOS COBERTOS
2 SEGMENTAÇÃO DE MERCADO
2.1 MERCADOS COBERTOS
2.2 ÂMBITO GEOGRÁFICO
2,3 ANOS CONSIDERADOS PARA O ESTUDO
2.4 MODELO DE VALIDAÇÃO DE DADOS TRIPÉ DBMR
2.5 ENTREVISTAS PRINCIPAIS COM PRINCIPAIS LÍDERES DE OPINIÃO
2.6 GRADE DE POSIÇÃO DE MERCADO DBMR
2.7 ANÁLISE DA PARTICIPAÇÃO DO FORNECEDOR
2.8 MODELAGEM MULTIVARIADA
2.9 CURVA DO CRONOGRAMA DO PRODUTO
2.1 FONTES SECUNDÁRIAS
2.11 PREMISSAS
3 RESUMO EXECUTIVO
4 INSIGHTS PREMIUM
5 VISÃO GERAL DO MERCADO
5.1 MOTORISTAS
5.1.1 AUMENTO DA ADOÇÃO DE DISPOSITIVOS COM ACESSO À INTERNET
5.1.2 AUMENTO DO USO DE SMARTPHONES PARA CONTROLAR ELETRODOMÉSTICOS INTELIGENTES
5.1.3 CRESCENTE CONSCIÊNCIA SOBRE A NECESSIDADE DE SOLUÇÕES DE EFICIÊNCIA ENERGÉTICA
5.1.4 AUMENTO DA RENDA DISPONÍVEL
5.2 RESTRIÇÕES
5.2.1 AUMENTO DA PREOCUPAÇÃO COM A SEGURANÇA CIBERNÉTICA EM RELAÇÃO À AUTOMAÇÃO
5.2.2 ALTO CUSTO INICIAL DOS DISPOSITIVOS DOMÉSTICOS INTELIGENTES
5.3 OPORTUNIDADES
5.3.1 AUMENTO DE EDIFÍCIOS VERDES POR PARTE DOS GOVERNOS
5.3.2 INTEGRAÇÃO DA TECNOLOGIA DE COMUNICAÇÃO POR LINHA DE ENERGIA EM CASAS INTELIGENTES
5.3.3 GRANDE NÚMERO DE FABRICANTES EXPANDINDO SEUS PORTFÓLIOS DE PRODUTOS PARA CASAS INTELIGENTES
5.3.4 AUMENTO DA POPULARIDADE DE DISPOSITIVOS DOMÉSTICOS INTELIGENTES NOS PAÍSES EM DESENVOLVIMENTO
5.4 DESAFIO
5.4.1 FALTA DE CONSCIENTIZAÇÃO E DE MÃO DE OBRA QUALIFICADA
6 MERCADO DE CASAS INTELIGENTES DA AMÉRICA DO NORTE, POR TIPO DE PRODUTO
6.1 VISÃO GERAL
6.2 CONTROLES DE ENTRETENIMENTO
6.2.1 CONTROLES DE ÁUDIO, VOLUME E MULTIMÍDIA DA SALA
6.2.2 CONTROLES DO SISTEMA DE HOME THEATER
6.2.3 TELAS SENSÍVEIS AO TOQUE E TECLADOS
6.3 SEGURANÇA E CONTROLE DE ACESSO
6.3.1 VIGILÂNCIA POR VÍDEO
6.3.1.1 HARDWARE
6.3.1.1.1 CÂMERAS DE SEGURANÇA
6.3.1.1.2 DISPOSITIVOS DE ARMAZENAMENTO
6.3.1.1.3 MONITORES
6.3.1.1.4 ACESSÓRIOS
6.3.1.2 ANÁLISE DE SOFTWARE/VÍDEO
6.3.1.3 SERVIÇOS
6.3.2 CONTROLE DE ACESSO
6.3.2.1 CONTROLE DE ACESSO NÃO BIOMÉTRICO
6.3.2.1.1 TECLADOS INTELIGENTES
6.3.2.1.2 CAMPAINHAS DE VÍDEO
6.3.2.2 CONTROLE DE ACESSO BIOMÉTRICO
6.3.2.2.1 RECONHECIMENTO DE IMPRESSÕES DIGITAIS
6.3.2.2.2 RECONHECIMENTO FACIAL
6.3.2.2.3 RECONHECIMENTO DE ÍRIS
6.3.2.2.4 OUTROS
6.4 CONTROLE DE HVAC
6.4.1 TERMOSTATOS INTELIGENTES
6.4.2 SENSORES
6.4.3 ATUADORES
6.4.4 AMORTECEDORES
6.4.5 VÁLVULAS DE CONTROLE
6.4.6 Serpentinas de aquecimento e resfriamento
6.4.7 BOMBAS E VENTILADORES
6.4.8 VENTILAÇÕES INTELIGENTES
6.5 ELETRODOMÉSTICOS
6.5.1 LAVADEIRAS INTELIGENTES
6.5.2 SECADORES INTELIGENTES
6.5.3 AQUECEDORES DE ÁGUA INTELIGENTES
6.5.4 ASPIRADORES INTELIGENTES
6.6 COZINHA INTELIGENTE
6.6.1 REFRIGERADORES INTELIGENTES
6.6.2 MÁQUINAS DE LAVAR LOUÇA INTELIGENTES
6.6.3 FOGÕES INTELIGENTES
6.6.4 FORNOS INTELIGENTES
6.6.5 COOKTOPS INTELIGENTES
6.6.6 CAFETEIRAS INTELIGENTES
6.6.7 CHALEIRAS INTELIGENTES
6.7 CONTROLE DE ILUMINAÇÃO
6.7.1 DIMMER
6.7.2 INTERRUPTORES
6.7.3 RELÉS
6.7.4 SENSORES DE LUZ DO DIA
6.7.5 TEMPORIZADORES
6.7.6 SENSORES DE OCUPAÇÃO
6.7.7 ACESSÓRIOS E OUTROS PRODUTOS
6.8 MÓVEIS INTELIGENTES
6.8.1 MESAS INTELIGENTES
6.8.2 BANCOS E BANCOS INTELIGENTES
6.8.3 SOFÁS INTELIGENTES
6.8.4 CADEIRAS INTELIGENTES
6.8.5 MESAS INTELIGENTES
6.9 CUIDADOS DE SAÚDE DOMICILIARES
6.9.1 MONITORES DE ESTADO DE SAÚDE
6.9.2 MONITORES DE ATIVIDADE FÍSICA
6.1 OUTROS
6.10.1 PLUGUES INTELIGENTES
6.10.2 DETECTORES DE FUMAÇA
6.10.3 MEDIDORES INTELIGENTES
7 MERCADO DE CASAS INTELIGENTES DA AMÉRICA DO NORTE, POR TECNOLOGIA
7.1 VISÃO GERAL
7.2 SEM FIO
7.2.1 WI-FI
7.2.2 BLUETOOTH
7.2.3 ZIGBEE
7.2.4 Z-WAVE
7.2.5 ENOCEAN
7.2.6 OUTROS
7.3 COM FIO
8 MERCADO DE CASAS INTELIGENTES DA AMÉRICA DO NORTE, POR SOFTWARE E SERVIÇO
8.1 VISÃO GERAL
8.2 COMPORTAMENTAL
8.3 PROATIVO
9 MERCADO DE CASAS INTELIGENTES DA AMÉRICA DO NORTE, POR GEOGRAFIA
9.1 AMÉRICA DO NORTE
9.1.1 EUA
9.1.2 CANADÁ
9.1.3 MÉXICO
10 MERCADO DE CASAS INTELIGENTES DA AMÉRICA DO NORTE, PAISAGISMO EMPRESARIAL
10.1 ANÁLISE DE AÇÕES DA EMPRESA: AMÉRICA DO NORTE
11 PERFIL DA EMPRESA
11.1 SAMSUNG
11.1.1 RESUMO DA EMPRESA
11.1.2 ANÁLISE DE RECEITA
11.1.3 ANÁLISE DAS AÇÕES DA EMPRESA
11.1.4 PORTFÓLIO DE PRODUTOS
11.1.5 DESENVOLVIMENTOS RECENTES
11.2 ROBERT BOSCH GMBH
11.2.1 RESUMO DA EMPRESA
11.2.2 ANÁLISE DE RECEITA
11.2.3 ANÁLISE DAS AÇÕES DA EMPRESA
11.2.4 PORTFÓLIO DE PRODUTOS
11.2.5 DESENVOLVIMENTO RECENTE
11.3 GRUPO HAIER
11.3.1 RESUMO DA EMPRESA
11.3.2 ANÁLISE DE RECEITA
11.3.3 ANÁLISE DE AÇÕES DA EMPRESA
11.3.4 PORTFÓLIO DE PRODUTOS
11.3.5 DESENVOLVIMENTOS RECENTES
11.4 SIEMENS
11.4.1 RESUMO DA EMPRESA
11.4.2 ANÁLISE DE RECEITA
11.4.3 ANÁLISE DAS AÇÕES DA EMPRESA
11.4.4 PORTFÓLIO DE PRODUTOS E SERVIÇOS
11.4.5 DESENVOLVIMENTOS RECENTES
11.5 SCHNEIDER ELECTRIC
11.5.1 RESUMO DA EMPRESA
11.5.2 REVENUE ANALYSIS
11.5.3 COMPANY SHARE ANALYSIS
11.5.4 PRODUCT PORTFOLIO
11.5.5 RECENT DEVELOPMENTS
11.6 ABB
11.6.1 COMPANY SNAPSHOT
11.6.2 REVENUE ANALYSIS
11.6.3 PRODUCT PORTFOLIO
11.6.4 RECENT DEVELOPMENTS
11.7 ACUITY BRANDS LIGHTING, INC.
11.7.1 COMPANY SNAPSHOT
11.7.2 REVENUE ANALYSIS
11.7.3 PRODUCT PORTFOLIO
11.7.4 RECENT DEVELOPMENTS
11.8 ADT
11.8.1 COMPANY SNAPSHOT
11.8.2 REVENUE ANALYSIS
11.8.3 PRODUCT PORTFOLIO
11.8.4 RECENT DEVELOPMENTS
11.9 BRINKS HOME SECURITY
11.9.1 COMPANY SNAPSHOT
11.9.2 PRODUCT PORTFOLIO
11.9.3 RECENT DEVELOPMENT
11.1 CARRIER
11.10.1 COMPANY SNAPSHOT
11.10.2 PRODUCT PORTFOLIO
11.10.3 RECENT DEVELOPMENTS
11.11 CRESTRON ELECTRONICS, INC.
11.11.1 COMPANY SNAPSHOT
11.11.2 SOLUTION PORTFOLIO
11.11.3 RECENT DEVELOPMENTS
11.12 EMERSON ELECTRIC CO.
11.12.1 COMPANY SNAPSHOT
11.12.2 REVENUE ANALYSIS
11.12.3 PRODUCT PORTFOLIO
11.12.4 RECENT DEVELOPMENTS
11.13 GENERAL ELECTRIC COMPANY (A SUBSIDIARY OF GENERAL ELECTRIC)
11.13.1 COMPANY SNAPSHOT
11.13.2 REVENUE ANALYSIS
11.13.3 PRODUCT PORTFOLIO
11.13.4 RECENT DEVELOPMENTS
11.14 GOOGLE (A SUBSIDIARY OF ALPHABET INC.)
11.14.1 COMPANY SNAPSHOT
11.14.2 REVENUE ANALYSIS
11.14.3 PRODUCT PORTFOLIO
11.14.4 RECENT DEVELOPMENT
11.15 HANWHA TECHWIN AMERICA.
11.15.1 COMPANY SNAPSHOT
11.15.2 PRODUCT PORTFOLIO
11.15.3 RECENT DEVELOPMENTS
11.16 JOHNSON CONTROLS
11.16.1 COMPANY SNAPSHOT
11.16.2 REVENUE ANALYSIS
11.16.3 PRODUCT PORTFOLIO
11.16.4 RECENT DEVELOPMENTS
11.17 KUNA SYSTEMS
11.17.1 COMPANY SNAPSHOT
11.17.2 PRODUCT PORTFOLIO
11.17.3 RECENT DEVELOPMENTS
11.18 LEGRAND
11.18.1 COMPANY SNAPSHOT
11.18.2 REVENUE ANALYSIS
11.18.3 SOLUTION PORTFOLIO
11.18.4 RECENT DEVELOPMENTS
11.19 LEVITON MANUFACTURING CO., INC.
11.19.1 COMPANY SNAPSHOT
11.19.2 PRODUCT PORTFOLIO
11.19.3 RECENT DEVELOPMENTS
11.2 LIFI LABS, INC.
11.20.1 COMPANY SNAPSHOT
11.20.2 PRODUCT PORTFOLIO
11.20.3 RECENT DEVELOPMENT
11.21 LUTRON ELECTRONICS CO., INC.
11.21.1 COMPANY SNAPSHOT
11.21.2 PRODUCT PORTFOLIO
11.21.3 RECENT DEVELOPMENTS
11.22 NICE S.P.A.
11.22.1 COMPANY SNAPSHOT
11.22.2 REVENUE ANALYSIS
11.22.3 SOLUTION PORTFOLIO
11.22.4 RECENT DEVELOPMENTS
11.23 RESIDEO TECHNOLOGIES INC.
11.23.1 COMPANY SNAPSHOT
11.23.2 REVENUE ANALYSIS
11.23.3 PRODUCT PORTFOLIO
11.23.4 RECENT DEVELOPMENTS
11.24 SLEEP NUMBER CORPORATION
11.24.1 COMPANY SNAPSHOT
11.24.2 REVENUE ANALYSIS
11.24.3 PRODUCT PORTFOLIO
11.24.4 RECENT DEVELOPMENT
11.25 SWITCHMATE
11.25.1 COMPANY SNAPSHOT
11.25.2 PRODUCT PORTFOLIO
11.25.3 RECENT DEVELOPMENT
11.26 THE CHAMBERLAIN GROUP INC.
11.26.1 COMPANY SNAPSHOT
11.26.2 PRODUCT PORTFOLIO
11.26.3 RECENT DEVELOPMENT
11.27 VIVINT, INC.
11.27.1 COMPANY SNAPSHOT
11.27.2 PRODUCT PORTFOLIO
11.27.3 RECENT DEVELOPMENTS
12 SWOT & DATA BRIDGE MARKET RESEARCH ANALYSIS
12.1 DATA BRIDGE MARKET RESEARCH ANALYSIS
13 CONCLUSION
14 QUESTIONNAIRE
15 RELATED REPORTS
Lista de Tabela
TABELA 1 MERCADO DE CASAS INTELIGENTES DA AMÉRICA DO NORTE, POR TIPO DE PRODUTO, 2018-2027 (US$ MILHÕES)
TABELA 2 CONTROLES DE ENTRETENIMENTO NA AMÉRICA DO NORTE NO MERCADO DE CASAS INTELIGENTES, POR REGIÃO, 2018-2027 (US$ MILHÕES)
TABELA 3 CONTROLES DE ENTRETENIMENTO NO MERCADO DE CASAS INTELIGENTES DA AMÉRICA DO NORTE, POR TIPO, 2018-2027 (US$ MILHÕES)
TABELA 4 SEGURANÇA E CONTROLE DE ACESSO NA AMÉRICA DO NORTE NO MERCADO DE CASAS INTELIGENTES, POR REGIÃO, 2018-2027 (US$ MILHÕES)
TABELA 5 SEGURANÇA E CONTROLE DE ACESSO NA AMÉRICA DO NORTE NO MERCADO DE CASAS INTELIGENTES, POR TIPO, 2018-2027 (US$ MILHÕES)
TABELA 6: VIGILÂNCIA POR VÍDEO NA AMÉRICA DO NORTE NO MERCADO DE CASAS INTELIGENTES, POR TIPO, 2018-2027 (US$ MILHÕES)
TABELA 7 HARDWARE DA AMÉRICA DO NORTE NO MERCADO DE CASAS INTELIGENTES, POR TIPO, 2018-2027 (US$ MILHÕES)
TABELA 8 CONTROLE DE ACESSO NO MERCADO DE CASAS INTELIGENTES DA AMÉRICA DO NORTE, POR TIPO, 2018-2027 (US$ MILHÕES)
TABELA 9 CONTROLE DE ACESSO NÃO BIOMÉTRICO NA AMÉRICA DO NORTE NO MERCADO DE CASAS INTELIGENTES, POR TIPO, 2018-2027 (US$ MILHÕES)
TABELA 10 CONTROLE DE ACESSO BIOMÉTRICO NA AMÉRICA DO NORTE NO MERCADO DE CASAS INTELIGENTES, POR TIPO, 2020-2027 (US$ MILHÕES)
TABELA 11 CONTROLE DE HVAC NO MERCADO DE CASAS INTELIGENTES DA AMÉRICA DO NORTE, POR REGIÃO, 2018-2027 (US$ MILHÕES)
TABELA 12 CONTROLE DE HVAC NO MERCADO DE CASAS INTELIGENTES DA AMÉRICA DO NORTE, POR TIPO, 2020-2027 (US$ MILHÕES)
TABELA 13 ELETRODOMÉSTICOS DA AMÉRICA DO NORTE NO MERCADO DE CASAS INTELIGENTES, POR REGIÃO, 2018-2027 (US$ MILHÕES)
TABELA 14 ELETRODOMÉSTICOS NA AMÉRICA DO NORTE NO MERCADO DE CASAS INTELIGENTES, POR TIPO, 2018-2027 (US$ MILHÕES)
TABELA 15 COZINHA INTELIGENTE NA AMÉRICA DO NORTE NO MERCADO DE CASAS INTELIGENTES, POR REGIÃO, 2018-2027 (US$ MILHÕES)
TABELA 16 COZINHA INTELIGENTE NA AMÉRICA DO NORTE NO MERCADO DE CASAS INTELIGENTES, POR TIPO, 2018-2027 (US$ MILHÕES)
TABELA 17 CONTROLE DE ILUMINAÇÃO NO MERCADO DE CASAS INTELIGENTES DA AMÉRICA DO NORTE, POR REGIÃO, 2018-2027 (US$ MILHÕES)
TABELA 18 CONTROLE DE ILUMINAÇÃO NO MERCADO DE CASAS INTELIGENTES DA AMÉRICA DO NORTE, POR TIPO, 2018-2027 (US$ MILHÕES)
TABELA 19 MÓVEIS INTELIGENTES DA AMÉRICA DO NORTE NO MERCADO DE CASAS INTELIGENTES, POR REGIÃO, 2018-2027 (US$ MILHÕES)
TABELA 20 MÓVEIS INTELIGENTES DA AMÉRICA DO NORTE NO MERCADO DE CASAS INTELIGENTES, POR TIPO, 2018-2027 (US$ MILHÕES)
TABELA 21: CUIDADOS DE SAÚDE DOMICILIARES NA AMÉRICA DO NORTE NO MERCADO DE CASAS INTELIGENTES, POR REGIÃO, 2018-2027 (US$ MILHÕES)
TABELA 22: CUIDADOS DE SAÚDE DOMICILIARES NA AMÉRICA DO NORTE NO MERCADO DE CASAS INTELIGENTES, POR TIPO, 2018-2027 (US$ MILHÕES)
TABELA 23 AMÉRICA DO NORTE OUTROS NO MERCADO DE CASAS INTELIGENTES, POR REGIÃO, 2018-2027 (US$ MILHÕES)
TABELA 24 AMÉRICA DO NORTE OUTROS NO MERCADO DE CASAS INTELIGENTES, POR TIPO, 2020-2027 (US$ MILHÕES)
TABELA 25 MERCADO DE CASAS INTELIGENTES DA AMÉRICA DO NORTE, POR TECNOLOGIA 2018-2027 (US$ MILHÕES)
TABELA 26 TECNOLOGIA SEM FIO DA AMÉRICA DO NORTE NO MERCADO DE CASAS INTELIGENTES, POR REGIÃO, 2018-2027 (US$ MILHÕES)
TABELA 27 TECNOLOGIA SEM FIO NA AMÉRICA DO NORTE NO MERCADO DE CASAS INTELIGENTES, POR TIPO, 2018-2027 (US$ MILHÕES)
TABELA 28 TECNOLOGIA COM FIO NA AMÉRICA DO NORTE NO MERCADO DE CASAS INTELIGENTES, POR REGIÃO, 2018-2027 (US$ MILHÕES)
TABELA 29 MERCADO DE CASAS INTELIGENTES DA AMÉRICA DO NORTE, POR SOFTWARE E SERVIÇO 2018-2027 (US$ MILHÕES)
TABELA 30 COMPORTAMENTO NA AMÉRICA DO NORTE NO MERCADO DE CASAS INTELIGENTES, POR REGIÃO, 2018-2027 (US$ MILHÕES)
TABELA 31 AMÉRICA DO NORTE PROATIVA NO MERCADO DE CASAS INTELIGENTES, POR REGIÃO, 2018-2027 (US$ MILHÕES)
TABELA 32 MERCADO DE CASAS INTELIGENTES DA AMÉRICA DO NORTE, POR PAÍS, 2018-2027 (US$ MILHÕES)
TABELA 33 MERCADO DE CASAS INTELIGENTES DA AMÉRICA DO NORTE, POR TIPO DE PRODUTO, 2018-2027 (US$ MILHÕES)
TABELA 34 CONTROLES DE ENTRETENIMENTO NO MERCADO DE CASAS INTELIGENTES DA AMÉRICA DO NORTE, POR TIPO, 2018-2027 (US$ MILHÕES)
TABELA 35 SEGURANÇA E CONTROLE DE ACESSO NO MERCADO DE CASAS INTELIGENTES DA AMÉRICA DO NORTE, POR TIPO, 2018-2027 (US$ MILHÕES)
TABELA 36 MERCADO DE VIDEOVIGILÂNCIA DA AMÉRICA DO NORTE NO MERCADO DE CASAS INTELIGENTES, POR TIPO, 2018-2027 (US$ MILHÕES)
TABELA 37 HARDWARE NA AMÉRICA DO NORTE NO MERCADO DE CASAS INTELIGENTES, POR TIPO, 2018-2027 (US$ MILHÕES)
TABELA 38 CONTROLE DE ACESSO NO MERCADO DE CASAS INTELIGENTES DA AMÉRICA DO NORTE, POR TIPO, 2018-2027 (US$ MILHÕES)
TABELA 39 CONTROLE DE ACESSO NÃO BIOMÉTRICO NA AMÉRICA DO NORTE NO MERCADO DE CASAS INTELIGENTES, POR TIPO, 2018-2027 (US$ MILHÕES)
TABELA 40 CONTROLE DE ACESSO BIOMÉTRICO NA AMÉRICA DO NORTE NO MERCADO DE CASAS INTELIGENTES, POR TIPO, 2018-2027 (US$ MILHÕES)
TABELA 41 CONTROLE DE HVAC NO MERCADO DE CASAS INTELIGENTES DA AMÉRICA DO NORTE, POR TIPO, 2018-2027 (US$ MILHÕES)
TABELA 42 ELETRODOMÉSTICOS NO MERCADO DE CASAS INTELIGENTES DA AMÉRICA DO NORTE, POR TIPO, 2018-2027 (US$ MILHÕES)
TABELA 43 COZINHA INTELIGENTE NA AMÉRICA DO NORTE NO MERCADO DE CASAS INTELIGENTES, POR TIPO, 2018-2027 (US$ MILHÕES)
TABELA 44 CONTROLE DE ILUMINAÇÃO NO MERCADO DE CASAS INTELIGENTES DA AMÉRICA DO NORTE, POR TIPO, 2018-2027 (US$ MILHÕES)
TABELA 45 MÓVEIS INTELIGENTES DA AMÉRICA DO NORTE NO MERCADO DE CASAS INTELIGENTES, POR TIPO, 2018-2027 (US$ MILHÕES)
TABELA 46 CUIDADOS DE SAÚDE DOMICILIAR NA AMÉRICA DO NORTE NO MERCADO DE CASAS INTELIGENTES, POR TIPO, 2018-2027 (US$ MILHÕES)
TABELA 47 AMÉRICA DO NORTE OUTROS NO MERCADO DE CASAS INTELIGENTES, POR TIPO, 2018-2027 (US$ MILHÕES)
TABELA 48 MERCADO DE CASAS INTELIGENTES DA AMÉRICA DO NORTE, POR TECNOLOGIA, 2018-2027 (US$ MILHÕES)
TABELA 49 TECNOLOGIA SEM FIO NA AMÉRICA DO NORTE NO MERCADO DE CASAS INTELIGENTES, POR TIPO, 2018-2027 (US$ MILHÕES)
TABELA 50 MERCADO DE CASAS INTELIGENTES DA AMÉRICA DO NORTE, POR SOFTWARE E SERVIÇO, 2018-2027 (US$ MILHÕES)
TABELA 51 MERCADO DE CASAS INTELIGENTES DOS EUA, POR TIPO DE PRODUTO, 2018-2027 (US$ MILHÕES)
TABELA 52 CONTROLES DE ENTRETENIMENTO NO MERCADO DE CASAS INTELIGENTES NOS EUA, POR TIPO, 2018-2027 (US$ MILHÕES)
TABELA 53 SEGURANÇA E CONTROLE DE ACESSO NO MERCADO DE CASAS INTELIGENTES NOS EUA, POR TIPO, 2018-2027 (US$ MILHÕES)
TABELA 54 VIGILÂNCIA POR VÍDEO NOS EUA NO MERCADO DE CASAS INTELIGENTES, POR TIPO, 2018-2027 (US$ MILHÕES)
TABELA 55 HARDWARE NOS EUA NO MERCADO DE CASAS INTELIGENTES, POR TIPO, 2018-2027 (US$ MILHÕES)
TABELA 56 CONTROLE DE ACESSO NO MERCADO DE CASAS INTELIGENTES NOS EUA, POR TIPO, 2018-2027 (US$ MILHÕES)
TABELA 57 CONTROLE DE ACESSO NÃO BIOMÉTRICO NO MERCADO DE CASAS INTELIGENTES NOS EUA, POR TIPO, 2018-2027 (US$ MILHÕES)
TABELA 58 CONTROLE DE ACESSO BIOMÉTRICO NOS EUA NO MERCADO DE CASAS INTELIGENTES, POR TIPO, 2018-2027 (US$ MILHÕES)
TABELA 59 CONTROLE DE HVAC NO MERCADO DE CASAS INTELIGENTES NOS EUA, POR TIPO, 2018-2027 (US$ MILHÕES)
TABELA 60 ELETRODOMÉSTICOS NO MERCADO DE CASAS INTELIGENTES NOS EUA, POR TIPO, 2018-2027 (US$ MILHÕES)
TABELA 61 COZINHA INTELIGENTE NOS EUA NO MERCADO DE CASAS INTELIGENTES, POR TIPO, 2018-2027 (US$ MILHÕES)
TABELA 62 CONTROLE DE ILUMINAÇÃO NO MERCADO DE CASAS INTELIGENTES NOS EUA, POR TIPO, 2018-2027 (US$ MILHÕES)
TABELA 63 MÓVEIS INTELIGENTES NO MERCADO DE CASAS INTELIGENTES DOS EUA, POR TIPO, 2018-2027 (US$ MILHÕES)
TABELA 64: CUIDADOS DE SAÚDE DOMICILIARES NO MERCADO DE CASAS INTELIGENTES NOS EUA, POR TIPO, 2018-2027 (US$ MILHÕES)
TABELA 65 OUTROS ESTADOS UNIDOS NO MERCADO DE CASAS INTELIGENTES, POR TIPO, 2018-2027 (US$ MILHÕES)
TABELA 66 MERCADO DE CASAS INTELIGENTES NOS EUA, POR TECNOLOGIA, 2018-2027 (US$ MILHÕES)
TABELA 67 TECNOLOGIA SEM FIO NOS EUA NO MERCADO DE CASAS INTELIGENTES, POR TIPO, 2018-2027 (US$ MILHÕES)
TABELA 68 MERCADO DE CASAS INTELIGENTES DOS EUA, POR SOFTWARE E SERVIÇO, 2018-2027 (US$ MILHÕES)
TABELA 69 MERCADO DE CASAS INTELIGENTES DO CANADÁ, POR TIPO DE PRODUTO, 2018-2027 (US$ MILHÕES)
TABELA 70 CONTROLES DE ENTRETENIMENTO NO MERCADO DE CASAS INTELIGENTES DO CANADÁ, POR TIPO, 2018-2027 (US$ MILHÕES)
TABELA 71 SEGURANÇA E CONTROLE DE ACESSO NO MERCADO DE CASAS INTELIGENTES DO CANADÁ, POR TIPO, 2018-2027 (US$ MILHÕES)
TABELA 72 VIGILÂNCIA POR VÍDEO NO MERCADO DE CASAS INTELIGENTES DO CANADÁ, POR TIPO, 2018-2027 (US$ MILHÕES)
TABELA 73 HARDWARE NO MERCADO DE CASAS INTELIGENTES DO CANADÁ, POR TIPO, 2018-2027 (US$ MILHÕES)
TABELA 74 CONTROLE DE ACESSO NO MERCADO DE CASAS INTELIGENTES DO CANADÁ, POR TIPO, 2018-2027 (US$ MILHÕES)
TABELA 75 CONTROLE DE ACESSO NÃO BIOMÉTRICO NO MERCADO DE CASAS INTELIGENTES DO CANADÁ, POR TIPO, 2018-2027 (US$ MILHÕES)
TABELA 76 CONTROLE DE ACESSO BIOMÉTRICO NO MERCADO DE CASAS INTELIGENTES DO CANADÁ, POR TIPO, 2018-2027 (US$ MILHÕES)
TABELA 77 CONTROLE DE HVAC NO MERCADO DE CASAS INTELIGENTES DO CANADÁ, POR TIPO, 2018-2027 (US$ MILHÕES)
TABELA 78 ELETRODOMÉSTICOS NO MERCADO DE CASAS INTELIGENTES DO CANADÁ, POR TIPO, 2018-2027 (US$ MILHÕES)
TABELA 79 COZINHA INTELIGENTE NO MERCADO DE CASAS INTELIGENTES DO CANADÁ, POR TIPO, 2018-2027 (US$ MILHÕES)
TABELA 80 CONTROLE DE ILUMINAÇÃO NO MERCADO DE CASAS INTELIGENTES DO CANADÁ, POR TIPO, 2018-2027 (US$ MILHÕES)
TABELA 81 MÓVEIS INTELIGENTES NO MERCADO DE CASAS INTELIGENTES DO CANADÁ, POR TIPO, 2018-2027 (US$ MILHÕES)
TABELA 82: CUIDADOS DE SAÚDE DOMICILIARES NO MERCADO DE CASAS INTELIGENTES NO CANADÁ, POR TIPO, 2018-2027 (US$ MILHÕES)
TABELA 83 CANADÁ OUTROS NO MERCADO DE CASAS INTELIGENTES, POR TIPO, 2018-2027 (US$ MILHÕES)
TABELA 84 MERCADO DE CASAS INTELIGENTES DO CANADÁ, POR TECNOLOGIA, 2018-2027 (US$ MILHÕES)
TABELA 85 TECNOLOGIA SEM FIO NO MERCADO DE CASAS INTELIGENTES DO CANADÁ, POR TIPO, 2018-2027 (US$ MILHÕES)
TABELA 86 MERCADO DE CASAS INTELIGENTES DO CANADÁ, POR SOFTWARE E SERVIÇO, 2018-2027 (US$ MILHÕES)
TABELA 87 MERCADO DE CASAS INTELIGENTES DO MÉXICO, POR TIPO DE PRODUTO, 2018-2027 (US$ MILHÕES)
TABELA 88 CONTROLES DE ENTRETENIMENTO NO MERCADO DE CASAS INTELIGENTES DO MÉXICO, POR TIPO, 2018-2027 (US$ MILHÕES)
TABELA 89 MÉXICO SEGURANÇA E CONTROLE DE ACESSO NO MERCADO DE CASAS INTELIGENTES, POR TIPO, 2018-2027 (US$ MILHÕES)
TABELA 90 MÉXICO VIGILÂNCIA POR VÍDEO NO MERCADO DE CASAS INTELIGENTES, POR TIPO, 2018-2027 (US$ MILHÕES)
TABELA 91 HARDWARE NO MERCADO DE CASAS INTELIGENTES DO MÉXICO, POR TIPO, 2018-2027 (US$ MILHÕES)
TABELA 92 CONTROLE DE ACESSO NO MERCADO DE CASAS INTELIGENTES DO MÉXICO, POR TIPO, 2018-2027 (US$ MILHÕES)
TABELA 93 CONTROLE DE ACESSO NÃO BIOMÉTRICO NO MERCADO DE CASAS INTELIGENTES DO MÉXICO, POR TIPO, 2018-2027 (US$ MILHÕES)
TABELA 94 CONTROLE DE ACESSO BIOMÉTRICO NO MERCADO DE CASAS INTELIGENTES DO MÉXICO, POR TIPO, 2018-2027 (US$ MILHÕES)
TABELA 95 CONTROLE DE HVAC NO MERCADO DE CASAS INTELIGENTES DO MÉXICO, POR TIPO, 2018-2027 (US$ MILHÕES)
TABELA 96 ELETRODOMÉSTICOS NO MERCADO DE CASAS INTELIGENTES DO MÉXICO, POR TIPO, 2018-2027 (US$ MILHÕES)
TABELA 97 COZINHA INTELIGENTE NO MÉXICO NO MERCADO DE CASAS INTELIGENTES, POR TIPO, 2018-2027 (US$ MILHÕES)
TABELA 98 CONTROLE DE ILUMINAÇÃO NO MERCADO DE CASAS INTELIGENTES DO MÉXICO, POR TIPO, 2018-2027 (US$ MILHÕES)
TABELA 99 MÓVEIS INTELIGENTES NO MERCADO DE CASAS INTELIGENTES DO MÉXICO, POR TIPO, 2018-2027 (US$ MILHÕES)
TABELA 100: ASSISTÊNCIA MÉDICA DOMICILIAR NO MERCADO DE CASAS INTELIGENTES NO MÉXICO, POR TIPO, 2018-2027 (US$ MILHÕES)
TABELA 101 MÉXICO OUTROS NO MERCADO DE CASAS INTELIGENTES, POR TIPO, 2018-2027 (US$ MILHÕES)
TABELA 102 MERCADO DE CASAS INTELIGENTES DO MÉXICO, POR TECNOLOGIA, 2018-2027 (US$ MILHÕES)
TABELA 103 TECNOLOGIA SEM FIO NO MERCADO DE CASAS INTELIGENTES DO MÉXICO, POR TIPO, 2018-2027 (US$ MILHÕES)
TABELA 104 MERCADO DE CASAS INTELIGENTES DO MÉXICO, POR SOFTWARE E SERVIÇO, 2018-2027 (US$ MILHÕES)
Lista de Figura
FIGURA 1 MERCADO DE CASAS INTELIGENTES DA AMÉRICA DO NORTE: SEGMENTAÇÃO
FIGURA 2 MERCADO DE CASAS INTELIGENTES DA AMÉRICA DO NORTE: TRIANGULAÇÃO DE DADOS
FIGURA 3 MERCADO DE CASAS INTELIGENTES DA AMÉRICA DO NORTE: ANÁLISE DROC
FIGURA 4 MERCADO DE CASAS INTELIGENTES DA AMÉRICA DO NORTE: ANÁLISE DE MERCADO REGIONAL VS AMÉRICA DO NORTE
FIGURA 5 MERCADO DE CASAS INTELIGENTES DA AMÉRICA DO NORTE: ANÁLISE DE PESQUISA DA EMPRESA
FIGURA 6 MERCADO DE CASAS INTELIGENTES DA AMÉRICA DO NORTE: DEMOGRAFIA DA ENTREVISTA
FIGURA 7 MERCADO DE CASAS INTELIGENTES DA AMÉRICA DO NORTE: GRADE DE POSIÇÃO DE MERCADO DBMR
FIGURA 8 MERCADO DE CASAS INTELIGENTES DA AMÉRICA DO NORTE: ANÁLISE DA PARTICIPAÇÃO DE FORNECEDORES
FIGURA 9 MERCADO DE CASAS INTELIGENTES DA AMÉRICA DO NORTE: SEGMENTAÇÃO
FIGURA 10 O AUMENTO DA RENDA DISPONÍVEL DEVE IMPULSIONAR O MERCADO DE CASAS INTELIGENTES DA AMÉRICA DO NORTE NO PERÍODO PREVISTO DE 2020 A 2027
FIGURA 11 CONTROLES DE ENTRETENIMENTO DEVEM SER REPRESENTANTES DA MAIOR PARCIALIDADE DO MERCADO DE CASAS INTELIGENTES DA AMÉRICA DO NORTE EM 2020 E 2027
FIGURA 12 A AMÉRICA DO NORTE DEVE DOMINAR O MERCADO, ENQUANTO A ÁSIA-PACÍFICO É A REGIÃO DE CRESCIMENTO MAIS RÁPIDO NO MERCADO DE CASAS INTELIGENTES DA AMÉRICA DO NORTE NO PERÍODO DE PREVISÃO DE 2020 A 2027
FIGURA 13 MOTIVADORES, RESTRIÇÕES, OPORTUNIDADES E DESAFIOS DO MERCADO DE CASAS INTELIGENTES DA AMÉRICA DO NORTE
FIGURA 14 MERCADO DE CASAS INTELIGENTES DA AMÉRICA DO NORTE: POR TIPO DE PRODUTO, 2019
FIGURA 15 MERCADO DE CASAS INTELIGENTES DA AMÉRICA DO NORTE: POR TECNOLOGIA, 2019
FIGURA 16 MERCADO DE CASAS INTELIGENTES DA AMÉRICA DO NORTE: POR SOFTWARE E SERVIÇO, 2019
FIGURA 17 MERCADO DE CASAS INTELIGENTES DA AMÉRICA DO NORTE: INSTANTÂNEO (2019)
FIGURA 18 MERCADO DE CASAS INTELIGENTES DA AMÉRICA DO NORTE: POR PAÍS (2019)
FIGURA 19 MERCADO DE CASAS INTELIGENTES DA AMÉRICA DO NORTE: POR PAÍS (2020 E 2027)
FIGURA 20 MERCADO DE CASAS INTELIGENTES DA AMÉRICA DO NORTE: POR PAÍS (2019 E 2027)
FIGURA 21 MERCADO DE CASAS INTELIGENTES DA AMÉRICA DO NORTE: POR TIPO DE PRODUTO (2020-2027)
FIGURA 22 MERCADO DE CASAS INTELIGENTES DA AMÉRICA DO NORTE: PARTICIPAÇÃO DA EMPRESA EM 2019 (%)
Metodologia de Investigação
A recolha de dados e a análise do ano base são feitas através de módulos de recolha de dados com amostras grandes. A etapa inclui a obtenção de informações de mercado ou dados relacionados através de diversas fontes e estratégias. Inclui examinar e planear antecipadamente todos os dados adquiridos no passado. Da mesma forma, envolve o exame de inconsistências de informação observadas em diferentes fontes de informação. Os dados de mercado são analisados e estimados utilizando modelos estatísticos e coerentes de mercado. Além disso, a análise da quota de mercado e a análise das principais tendências são os principais fatores de sucesso no relatório de mercado. Para saber mais, solicite uma chamada de analista ou abra a sua consulta.
A principal metodologia de investigação utilizada pela equipa de investigação do DBMR é a triangulação de dados que envolve a mineração de dados, a análise do impacto das variáveis de dados no mercado e a validação primária (especialista do setor). Os modelos de dados incluem grelha de posicionamento de fornecedores, análise da linha de tempo do mercado, visão geral e guia de mercado, grelha de posicionamento da empresa, análise de patentes, análise de preços, análise da quota de mercado da empresa, normas de medição, análise global versus regional e de participação dos fornecedores. Para saber mais sobre a metodologia de investigação, faça uma consulta para falar com os nossos especialistas do setor.
Personalização disponível
A Data Bridge Market Research é líder em investigação formativa avançada. Orgulhamo-nos de servir os nossos clientes novos e existentes com dados e análises que correspondem e atendem aos seus objetivos. O relatório pode ser personalizado para incluir análise de tendências de preços de marcas-alvo, compreensão do mercado para países adicionais (solicite a lista de países), dados de resultados de ensaios clínicos, revisão de literatura, mercado remodelado e análise de base de produtos . A análise de mercado dos concorrentes-alvo pode ser analisada desde análises baseadas em tecnologia até estratégias de carteira de mercado. Podemos adicionar quantos concorrentes necessitar de dados no formato e estilo de dados que procura. A nossa equipa de analistas também pode fornecer dados em tabelas dinâmicas de ficheiros Excel em bruto (livro de factos) ou pode ajudá-lo a criar apresentações a partir dos conjuntos de dados disponíveis no relatório.

