North America Virtual Reality Market, By Component (Hardware and Software), Device Type (Head-Mounted Displays, Projectors & Display Walls and Gesture-Tracking Devices), Technology (Fully Immersive, Non-Immersive and Semi Immersive), Vertical (Entertainment & Media, Healthcare, Industrial, Commercial, Aerospace & Defense, Automotive, Education and Others) - Industry Trends and Forecast to 2029.
North America Virtual Reality Market Analysis and Size
Virtual reality has brought a new change to digitalization. It has become easier to experience the real world by setting different environmental conditions. Augmented reality & mixed reality has a wide range of applications. The market's growth increased as the use of augmented reality, and mixed reality became popular in driving simulators. The augmented reality and mixed reality provide the driver with a real sense of the road, driving conditions, car manuals, and road traffic that helps avoid accidents at an initial stage of learning and prepares the drivers for various situations. These attributes have also led to an increased usage of virtual reality in defense and aerospace. The army personnel used it for training in various conditions such as parachute jumping, submarine, combat situations, and driving in various environmental conditions.
The growing demand for HMD in the gaming and entertainment industry is expected to act as a major driver for the North America virtual reality market. The lack of effective user experience design may restrain the market. Also, the increased deployment of VR technology in the aerospace & defense and architecture & planning sector may act as a major opportunity that helps in the market's growth. However, emerging risks and threats to data integrity may challenge the North America virtual reality market.
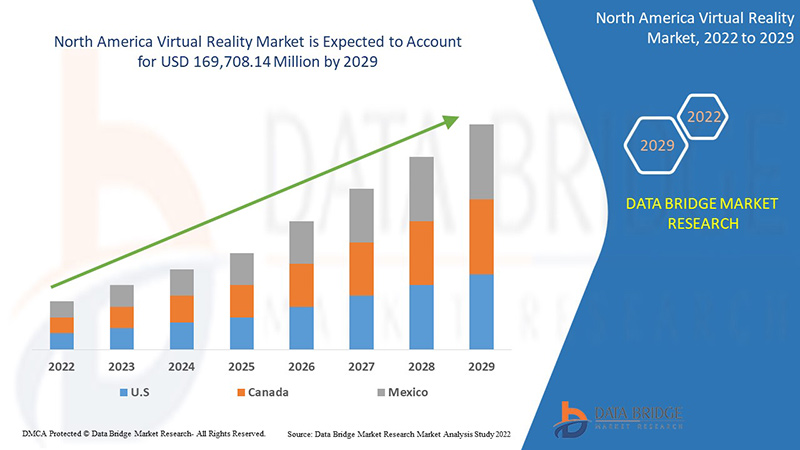
Data Bridge Market Research analyses that the North America virtual reality market is expected to reach the value of USD 169,708.14 million by 2029, at a CAGR of 48.7% during the forecast period. The hardware segment accounts for the largest component segment in the North America virtual reality market. The North America virtual reality market report also covers pricing analysis, patent analysis, and technological advancements in depth.
|
Report Metric |
Details |
|
Forecast Period |
2022 to 2029 |
|
Base Year |
2021 |
|
Historic Years |
2020 (Customizable to 2019-2014) |
|
Quantitative Units |
Revenue in USD Million, Pricing in USD |
|
Segments Covered |
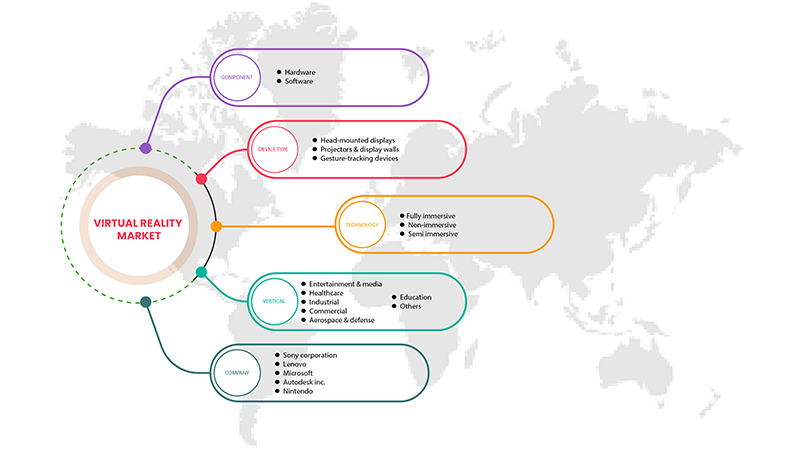
By Component (Hardware and Software), Device Type (Head-Mounted Displays, Projectors & Display Walls and Gesture-Tracking Devices), Technology (Fully Immersive, Non-Immersive and Semi Immersive), Vertical (Entertainment & Media, Healthcare, Industrial, Commercial, Aerospace & Defense, Automotive, Education and Others) |
|
Countries Covered |
U.S., Canada and Mexico |
|
Market Players Covered |
Sony Corporation, Lenovo, Autodesk Inc., Nintendo, WorldViz, Inc., Firsthand Technology Inc., Sixense Enterprises Inc., HTC Corporation, FOVE, Inc., Ultraleap, LG Electronics, Google (A Subsidiary of Alphabet Inc.), Qualcomm Technologies, Inc., Barco, HP Development Company, L.P., Microsoft, FXGear Inc., SAMSUNG ELECTRONICS CO., LTD., Virtuix, among others |
Market Definition
Virtual reality can be defined as a technology that creates a simulated environment through computer technology. Virtual reality provides an immersed 3D environment to the user by simulating various senses such as vision, touch, hearing, and even smell. Virtual reality uses devices such as head-mounted displays, projectors, and display walls to generate realistic visuals and sounds to provide a real-world experience in the virtual environment. The person using virtual reality can view the artificial world 360 degrees and even sense the virtual environment with highly advanced gears. This technology is being widely used in various industrial applications, especially for training and research purposes. The defense and aerospace industry uses it for training the army personnel by providing various environmental conditions, this aids in reducing the overall cost of the training. The gaming sector provides virtual reality directly to the users by enhancing their gaming experience; people are getting more accustomed to virtual reality through their experience in the gaming and entertainment industry. Virtual reality has also aided in driving simulators by providing a real-life experience in an artificial environment helping the users to adapt to the driving conditions and know how to react in various situations without actually taking the driving lessons directly on the road.
Market Dynamics
This section deals with understanding the market drivers, advantages, opportunities, restraints and challenges. All of this is discussed in detail as below:
Drivers
- Growing demand for HMD in the gaming and entertainment industry
Head-mounted displays (HMDs) have been high in the gaming and entertainment sector. The gaming industry has had a technological evolution with the emergence of VR and 3D technology. The use of HMDs has helped achieve a fully immersive experience for users and has taken the gaming experience to the next level. The flawless transition conducted with VR HMDs has helped bring in a unique and enhanced user experience. HMDs have a high penetration rate in the video gaming sector, and video game users prefer them for enriching experiences and entertainment. HMDs project digital images, enabling a 3D view, which enhances the user experience. Therefore, the growing gaming sector would drive the market for HMDs and, in turn, virtual reality.
- Increasing demand for VR technology due to the COVID-19 pandemic
The world is going through different phases of physical lockdown, and social get-togethers are still not allowed in most countries. Hence, AR and VR Technology during COVID-19 are emerging as superheroes by enabling people to feel connected to each other. Augmented reality adds digital elements to the physical world, and Virtual Reality gives an immersive experience to the viewers. VR devices such as Google Cardboard, HTC Vive, or Oculus Rift transport users to experience several real-world and imaginary environments.
Opportunity
- Increased deployment of VR technology in aerospace & defense and architecture & planning sector
The 3D design has enabled significant gains in the aerospace and defense equipment manufacturing processes. This has also positively impacted both performances of the aircraft as well as the manufacturing processes. The advancements in new 3D technologies bring new market opportunities to optimize production time and cost in the aerospace and defense industry. 3D technology has been a continuous trend, specifically in the aerospace industry. Recent developments in virtual reality technology have promised new applications in the aerospace and defense domain, impacting the growth of virtual reality in the aerospace and defense market. 3D visualization abilities incorporated with digital mock-ups of physical objects, virtual assembly lines, tighter integration, and a seamless design process would drive the market shortly.
Restraint/Challenge
- Emerging risks and threats to data integrity
Virtual reality is being highly used for training and education purposes in defense and aerospace and is also used in telemedicine in the healthcare industry. Virtual reality uses computing technologies, cloud usage, and internet services to work, making it highly prone to cyber-attacks, threatening data integrity, and increasing the risk of data being leaked. Proper security and privacy are not being given much importance, posing a significant challenge for the North America virtual reality market.
COVID-19 Impact on North America Virtual Reality Market
COVID-19 significantly impacted various industries as almost every country has opted for the shutdown for every facility except those in the essential goods segment. The government has taken some strict actions such as shutting facilities and selling non-essential goods, blocking international trade, and many more to prevent the spread of COVID-19. The only business dealing in this pandemic situation is the essential services allowed to open and run the processes.
The increased usage of virtual reality-based devices has provided significant opportunities amid the covid-19 pandemic. Although consumer purchasing power has been greatly diminished due to the coronavirus-induced economic slump, resulting in the decline of profit margins in organizations. While many key marketers and leaders saw signs of improvement from past years, it remains difficult to ascertain the actual market situation as the pent-up demand may be covering up a lower intrinsic level of demand for VR-based devices. The increase in VR smartphone applications, the rise in demand for remote collaboration, and technological advancements in medical applications are some factors driving augmented reality and mixed reality market growth.
Manufacturers are making various strategic decisions to meet the growing demand in the COVID-19 period. The players were involved in strategic activities such as partnerships, collaborations, acquisitions, and others to improve the technology involved in the Virtual Reality market. The companies will bring advanced and accurate solutions to the market. In addition, the government initiatives to boost digitization across industries have led to the market's growth.
Recent Development
- In May 2019, Autodesk Inc. announced integration between InsiteVR and its construction management platform Autodesk BIM 360, allowing customers to host group model reviews in VR. Instead of screen sharing, team members can review models in an immersive 3D environment using a VR headset, including Facebook's new all-in-one Oculus Quest virtual reality system or desktop. This collaboration helped in improving the product portfolio with respect to VR technology
North America Virtual Reality Market Scope
North America virtual reality market is segmented based on component, device type, technology, and vertical. The growth amongst these segments will help you analyse meagre growth segments in the industries and provide the users with a valuable market overview and market insights to help them make strategic decisions for identifying core market applications.
Component
- Hardware
- Software
On the basis of component, the North America virtual reality market is segmented into hardware and software.
Device Type
- Head-Mounted Displays,
- Projectors & Display Walls
- Gesture-Tracking Devices
On the basis of device type, the North America virtual reality market is segmented into head-mounted displays, projectors & display walls, and gesture-tracking devices.
Technology
- Fully Immersive,
- Semi Immersive
- Non-Immersive
On the basis of technology, the North America virtual reality market is segmented into fully immersive, semi immersive, and non-immersive.
Vertical
- Automotive
- Aerospace & Defense
- Entertainment & Media
- Healthcare
- Education
- Industrial
- Commercial
- Others
On the basis of vertical, the North America virtual reality market is segmented into automotive, aerospace & defense, entertainment & media, healthcare, education, industrial, commercial, and others.
North America Virtual Reality Market Regional Analysis/Insights
North America virtual reality market is analysed, and market size insights and trends are provided by the country, component, device type, technology and vertical as referenced above.
Some countries covered in the North America virtual reality market report are the U.S., Canada and Mexico.
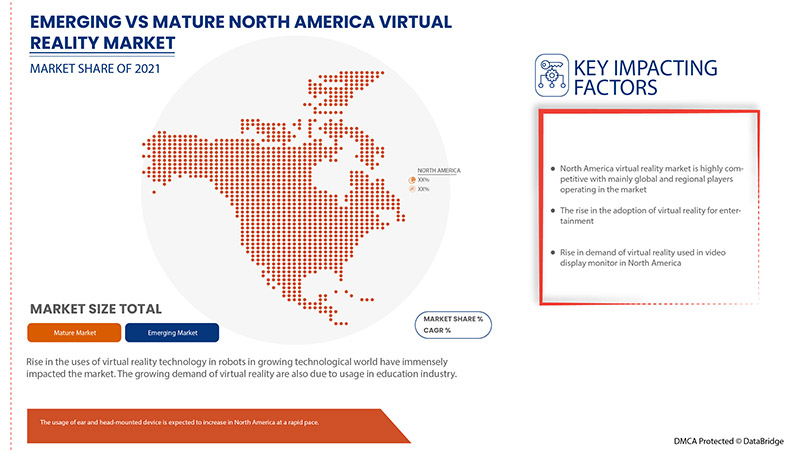
The U.S. is expected to dominate the North America virtual reality market owing to the continuously rising digital workplace and mobile workforce. Moreover, the U.S. has been extremely responsive to the adoption of virtual reality technology.
The country section of the report also provides individual market impacting factors and changes in market regulation that impact the current and future trends of the market. Data points like downstream and upstream value chain analysis, technical trends and porter's five forces analysis, and case studies are some of the pointers used to forecast the market scenario for individual countries. Also, the presence and availability of North American brands and their challenges faced due to large or scarce competition from local and domestic brands, the impact of domestic tariffs, and trade routes are considered while providing forecast analysis of the country data.
Competitive Landscape and North America Virtual Reality Market Share Analysis
North America virtual reality market competitive landscape provides details by the competitor. Details included are company overview, company financials, revenue generated, market potential, investment in research and development, new market initiatives, North America presence, production sites and facilities, production capacities, company strengths and weaknesses, product launch, product width, and breadth, application dominance. The above data points provided are only related to the companies' focus related to the North America virtual reality market.
Some of the major players operating in the North America virtual reality market are Sony Corporation, Lenovo, Autodesk Inc., Nintendo, WorldViz, Inc., Firsthand Technology Inc., Sixense Enterprises Inc., HTC Corporation, FOVE, Inc., Ultraleap, LG Electronics, Google (A Subsidiary of Alphabet Inc.), Qualcomm Technologies, Inc., Barco, HP Development Company, L.P., Microsoft, FXGear Inc., SAMSUNG ELECTRONICS CO., LTD., Virtuix, among others.
SKU-
Obtenha acesso online ao relatório sobre a primeira nuvem de inteligência de mercado do mundo

- Painel interativo de análise de dados
- Painel de análise da empresa para oportunidades de elevado potencial de crescimento
- Acesso de analista de pesquisa para personalização e customização. consultas
- Análise da concorrência com painel interativo
- Últimas notícias, atualizações e atualizações Análise de tendências
- Aproveite o poder da análise de benchmark para um rastreio abrangente da concorrência
Índice
1 INTRODUÇÃO
1.1 OBJETIVOS DO ESTUDO
1.2 DEFINIÇÃO DE MERCADO
1.3 VISÃO GERAL DO MERCADO DE REALIDADE VIRTUAL DA AMÉRICA DO NORTE
1.4 MOEDA E PREÇOS
1.5 LIMITAÇÕES
1.6 MERCADOS COBERTOS
2 SEGMENTAÇÃO DE MERCADO
2.1 MERCADOS COBERTOS
2.2 ÂMBITO GEOGRÁFICO
2,3 ANOS CONSIDERADOS PARA O ESTUDO
2.4 MODELO DE VALIDAÇÃO DE DADOS TRIPÉ DBMR
2.5 ENTREVISTAS PRINCIPAIS COM PRINCIPAIS LÍDERES DE OPINIÃO
2.6 GRADE DE POSIÇÃO DE MERCADO DBMR
2.7 ANÁLISE DA PARTICIPAÇÃO DO FORNECEDOR
2.8 MODELAGEM MULTIVARIADA
2.9 CURVA DE LINHA DO TEMPO DOS COMPONENTES
2.1 GRADE DE COBERTURA VERTICAL DE MERCADO
2.11 FONTES SECUNDÁRIAS
2.12 PREMISSAS
3 RESUMO EXECUTIVO
4 INSIGHTS PREMIUM
5 TENDÊNCIAS DE MERCADO
LISTA DOS 6 MELHORES CONCORRENTES DO MUNDO
7 REGULAMENTAÇÃO E POLÍTICA
8 RESUMO REGIONAL
9 VISÃO GERAL DO MERCADO
9.1 MOTORISTAS
9.1.1 CRESCENTE DEMANDA POR HMD NA INDÚSTRIA DE JOGOS E ENTRETENIMENTO
9.1.2 ALTO INVESTIMENTO NO MERCADO DE VR
9.1.3 AUMENTO DA DEMANDA POR TECNOLOGIA DE RV DEVIDO À PANDEMIA DE COVID-19
9.1.4 DISPONIBILIDADE DE DISPOSITIVOS DE RV ACESSÍVEIS
9.1.5 INTERESSE CRESCENTE DAS GRANDES CORPORAÇÕES DE TECNOLOGIA
9.1.6 AUMENTO DA PENETRAÇÃO DE SMARTPHONES E SERVIÇOS DE INTERNET
9.2 RESTRIÇÕES
9.2.1 FALTA DE DESIGN EFICAZ DE EXPERIÊNCIA DO USUÁRIO
9.2.2 PREOCUPAÇÕES COM A SAÚDE DOS USUÁRIOS
9.2.3 DESACELERAÇÃO ECONÔMICA DA AMÉRICA DO NORTE
9.3 OPORTUNIDADES
9.3.1 AUMENTO DA IMPLANTAÇÃO DA TECNOLOGIA DE RV NOS SETORES AEROESPACIAL E DE DEFESA E ARQUITETURA E PLANEJAMENTO
9.3.2 AUMENTO DA PENETRAÇÃO DA RV NA INDÚSTRIA DA SAÚDE
9.3.3 AUMENTO DE VÁRIAS DECISÕES ESTRATÉGICAS, COMO PARCERIAS E AQUISIÇÕES
9.3.4 DESENVOLVIMENTO DE HARDWARE COM VELOCIDADES DE PROCESSAMENTO MAIS RÁPIDAS
9.4 DESAFIOS
9.4.1 RISCOS E AMEAÇAS EMERGENTES À INTEGRIDADE DE DADOS
9.4.2 DESENVOLVENDO UM SISTEMA DE RV FÁCIL DE USAR
10 MERCADO DE REALIDADE VIRTUAL DA AMÉRICA DO NORTE, POR COMPONENTE
10.1 VISÃO GERAL
10.2 HARDWARE
10.2.1 VISORES E PROJETORES
10.2.2 CONTROLADOR E PROCESSADOR
10.2.3 RASTREADORES DE POSIÇÃO
10.2.4 CÂMERAS
10.2.5 OUTROS
10.3 SOFTWARE
10.3.1 CRIAÇÃO DE CONTEÚDO DE RV
10.3.2 KITS DE DESENVOLVIMENTO DE SOFTWARE
10.3.3 SERVIÇOS BASEADOS EM NUVEM
11 MERCADO DE REALIDADE VIRTUAL DA AMÉRICA DO NORTE, POR TIPO DE DISPOSITIVO
11.1 VISÃO GERAL
11.2 DISPLAYS MONTADOS NA CABEÇA
11.3 PROJETORES E PAREDES DE EXIBIÇÃO
11.4 DISPOSITIVOS DE RASTREAMENTO DE GESTOS
12 MERCADO DE REALIDADE VIRTUAL DA AMÉRICA DO NORTE, POR TECNOLOGIA
12.1 VISÃO GERAL
12.2 TOTALMENTE IMERSIVO
12.3 NÃO IMERSIVO
12.4 SEMI IMERSIVOS
13 MERCADO DE REALIDADE VIRTUAL DA AMÉRICA DO NORTE, POR VERTICAL
13.1 VISÃO GERAL
13.2 ENTRETENIMENTO E MÍDIA
13.2.1 ENTRETENIMENTO E MÍDIA, POR TECNOLOGIA
13.2.1.1 TOTALMENTE IMERSIVO
13.2.1.2 NÃO IMERSIVO
13.2.1.3 SEMI IMERSIVOS
13.2.2 ENTRETENIMENTO E MÍDIA, POR APLICAÇÃO
13.2.2.1 JOGO
13.2.2.2 TRANSMISSÃO
13.2.2.3 ANIMAÇÃO
13.2.2.4 CARÁTER
13.2.2.5 DESENHO ANIMADO
13.2.2.6 MÚSICA
13.2.2.7 MODA
13.3 SAÚDE
13.3.1 ASSISTÊNCIA MÉDICA, POR TIPO
13.3.1.1 CIRURGIA
13.3.1.2 GESTÃO DO CUIDADO AO PACIENTE
13.3.1.3 GESTÃO DE APTIDÃO
13.3.1.4 GESTÃO DE FARMÁCIAS
13.3.2 SAÚDE, POR TECNOLOGIA
13.3.2.1 TOTALMENTE IMERSIVO
13.3.2.2 NÃO IMERSIVO
13.3.2.3 SEMI IMERSIVOS
13.4 INDUSTRIAIS
13.4.1 TOTALMENTE IMERSIVA
13.4.2 NÃO IMERSIVO
13.4.3 SEMI IMERSIVOS
13.5 COMERCIAL
13.5.1 COMERCIAL, POR TIPO
13.5.1.1 VAREJO E COMÉRCIO ELETRÔNICO
13.5.1.2 VIAGENS E TURISMO
13.5.1.3 PUBLICIDADE
13.5.2 COMERCIAL, POR TECNOLOGIA
13.5.2.1 TOTALMENTE IMERSIVO
13.5.2.2 NÃO IMERSIVO
13.5.2.3 SEMI IMERSIVOS
13.6 AEROESPACIAL E DEFESA
13.6.1 SEMI IMERSIVOS
13.6.2 TOTALMENTE IMERSIVO
13.6.3 NÃO IMERSIVO
13.7 AUTOMOTIVO
13.7.1 SEMI IMERSIVOS
13.7.2 TOTALMENTE IMERSIVO
13.7.3 NÃO IMERSIVO
13.8 EDUCAÇÃO
13.8.1 TOTALMENTE IMERSIVA
13.8.2 NÃO IMERSIVO
13.8.3 SEMI IMERSIVOS
13.9 OUTROS
14 MERCADO DE REALIDADE VIRTUAL DA AMÉRICA DO NORTE, POR REGIÃO
14.1 AMÉRICA DO NORTE
14.1.1 EUA
14.1.2 CANADÁ
14.1.3 MÉXICO
15 MERCADO DE REALIDADE VIRTUAL DA AMÉRICA DO NORTE, PANORAMA DA EMPRESA
15.1 ANÁLISE DAS AÇÕES DA EMPRESA: AMÉRICA DO NORTE
16 ANÁLISE SWOT
17 PERFIL DA EMPRESA
17.1 SONY CORPORATION
17.1.1 PERFIL DA EMPRESA
17.1.2 ANÁLISE DE RECEITA
17.1.3 ANÁLISE DAS AÇÕES DA EMPRESA
17.1.4 PORTFÓLIO DE PRODUTOS
17.1.5 DESENVOLVIMENTOS RECENTES
17.2 SAMSUNG ELECTRONICS CO., LTD.
17.2.1 PERFIL DA EMPRESA
17.2.2 ANÁLISE DE RECEITA
17.2.3 ANÁLISE DE AÇÕES DA EMPRESA
17.2.4 PORTFÓLIO DE PRODUTOS
17.2.5 DESENVOLVIMENTOS RECENTES
17.3 NINTENDO
17.3.1 PERFIL DA EMPRESA
17.3.2 ANÁLISE DE RECEITA
17.3.3 ANÁLISE DE AÇÕES DA EMPRESA
17.3.4 PORTFÓLIO DE PRODUTOS
17.3.5 DESENVOLVIMENTOS RECENTES
17.4 QUALCOMM TECHNOLOGIES, INC.
17.4.1 PERFIL DA EMPRESA
17.4.2 ANÁLISE DE RECEITA
17.4.3 ANÁLISE DAS AÇÕES DA EMPRESA
17.4.4 PORTFÓLIO DE PRODUTOS
17.4.5 DESENVOLVIMENTO RECENTE
17.5 MICROSOFT
17.5.1 PERFIL DA EMPRESA
17.5.2 ANÁLISE DE RECEITA
17.5.3 ANÁLISE DE AÇÕES DA EMPRESA
17.5.4 PORTFÓLIO DE PRODUTOS
17.5.5 DESENVOLVIMENTOS RECENTES
17.6 AUTODESK INC.
17.6.1 PERFIL DA EMPRESA
17.6.2 ANÁLISE DE RECEITA
17.6.3 PORTFÓLIO DE PRODUTOS
17.6.4 DESENVOLVIMENTOS RECENTES
17.7 BARCO
17.7.1 PERFIL DA EMPRESA
17.7.2 ANÁLISE DE RECEITA
17.7.3 PORTFÓLIO DE PRODUTOS
17.7.4 DESENVOLVIMENTOS RECENTES
17.8 BHAPTICS INC.
17.8.1 PERFIL DA EMPRESA
17.8.2 PORTFÓLIO DE PRODUTOS
17.8.3 DESENVOLVIMENTO RECENTE
17.9 TECNOLOGIA DE PRIMEIRA MÃO INC.
17.9.1 PERFIL DA EMPRESA
17.9.2 PORTFÓLIO DE PRODUTOS
17.9.3 DESENVOLVIMENTOS RECENTES
17.1 FOVE, INC.
17.10.1 PERFIL DA EMPRESA
17.10.2 PORTFÓLIO DE PRODUTOS
17.10.3 DESENVOLVIMENTOS RECENTES
17.11 FXGEAR INC.
17.11.1 PERFIL DA EMPRESA
17.11.2 PORTFÓLIO DE PRODUTOS
17.11.3 DESENVOLVIMENTO RECENTE
17.12 GOOGLE (UMA SUBSIDIÁRIA DA ALPHABET INC.)
17.12.1 PERFIL DA EMPRESA
17.12.2 ANÁLISE DE RECEITA
17.12.3 PORTFÓLIO DE PRODUTOS
17.12.4 DESENVOLVIMENTO RECENTE
17.13 HP DEVELOPMENT COMPANY, LP
17.13.1 PERFIL DA EMPRESA
17.13.2 ANÁLISE DE RECEITA
17.13.3 PORTFÓLIO DE PRODUTOS
17.13.4 DESENVOLVIMENTOS RECENTES
17.14 HTC CORPORAÇÃO
17.14.1 PERFIL DA EMPRESA
17.14.2 ANÁLISE DE RECEITA
17.14.3 PORTFÓLIO DE PRODUTOS
17.14.4 DESENVOLVIMENTOS RECENTES
17.15 INNOSIMULAÇÃO
17.15.1 PERFIL DA EMPRESA
17.15.2 PORTFÓLIO DE PRODUTOS
17.15.3 DESENVOLVIMENTO RECENTE
17.16 LENOVO
17.16.1 PERFIL DA EMPRESA
17.16.2 ANÁLISE DE RECEITA
17.16.3 PORTFÓLIO DE PRODUTOS
17.16.4 DESENVOLVIMENTO RECENTE
17.17 LG ELETRÔNICA
17.17.1 PERFIL DA EMPRESA
17.17.2 ANÁLISE DE RECEITA
17.17.3 PORTFÓLIO DE PRODUTOS
17.17.4 DESENVOLVIMENTOS RECENTES
17.18 NOVINT
17.18.1 PERFIL DA EMPRESA
17.18.2 PORTFÓLIO DE PRODUTOS
17.18.3 DESENVOLVIMENTO RECENTE
17.19 PSICO SMART APPS, SL
17.19.1 PERFIL DA EMPRESA
17.19.2 PORTFÓLIO DE PRODUTOS
17.19.3 DESENVOLVIMENTOS RECENTES
17.2 SIXENSE ENTERPRISES INC.
17.20.1 PERFIL DA EMPRESA
17.20.2 PORTFÓLIO DE PRODUTOS
17.20.3 DESENVOLVIMENTOS RECENTES
17.21 SKONEC ENTERTAINMENT CO., LTD.
17.21.1 PERFIL DA EMPRESA
17.21.2 PORTFÓLIO DE PRODUTOS
17.21.3 DESENVOLVIMENTOS RECENTES
17.22 STARVR CORP
17.22.1 PERFIL DA EMPRESA
17.22.2 PORTFÓLIO DE PRODUTOS
17.22.3 DESENVOLVIMENTOS RECENTES
17.23 ULTRALEAP LIMITADA
17.23.1 PERFIL DA EMPRESA
17.23.2 PORTFÓLIO DE PRODUTOS
17.23.3 DESENVOLVIMENTOS RECENTES
17.24 VIRTUIX
17.24.1 PERFIL DA EMPRESA
17.24.2 PORTFÓLIO DE PRODUTOS
17.24.3 DESENVOLVIMENTO RECENTE
17.25 WORLDVIZ, INC.
17.25.1 PERFIL DA EMPRESA
17.25.2 PORTFÓLIO DE PRODUTOS
17.25.3 DESENVOLVIMENTOS RECENTES
18 QUESTIONÁRIO
19 RELATÓRIOS RELACIONADOS
Lista de Tabela
TABELA 1 MERCADO DE REALIDADE VIRTUAL DA AMÉRICA DO NORTE, POR COMPONENTE, 2020-2029 (US$ MILHÕES)
TABELA 2 HARDWARE DA AMÉRICA DO NORTE NO MERCADO DE REALIDADE VIRTUAL, POR REGIÃO, 2020-2029 (US$ MILHÕES)
TABELA 3 HARDWARE DA AMÉRICA DO NORTE NO MERCADO DE REALIDADE VIRTUAL, POR COMPONENTE, 2020-2029 (US$ MILHÕES)
TABELA 4 SOFTWARE DA AMÉRICA DO NORTE NO MERCADO DE REALIDADE VIRTUAL, POR REGIÃO, 2020-2029 (US$ MILHÕES)
TABELA 5 SOFTWARE DA AMÉRICA DO NORTE NO MERCADO DE REALIDADE VIRTUAL, POR COMPONENTE, 2020-2029 (US$ MILHÕES)
TABELA 6 MERCADO DE REALIDADE VIRTUAL DA AMÉRICA DO NORTE, POR TIPO DE DISPOSITIVO, 2020-2029 (US$ MILHÕES)
TABELA 7: DISPLAYS DE CABEÇA MONTADOS NA AMÉRICA DO NORTE NO MERCADO DE REALIDADE VIRTUAL, POR REGIÃO, 2020-2029 (US$ MILHÕES)
TABELA 8 PROJETORES E PAREDES DE EXIBIÇÃO DA AMÉRICA DO NORTE NO MERCADO DE REALIDADE VIRTUAL, POR REGIÃO, 2020-2029 (US$ MILHÕES)
TABELA 9 DISPOSITIVOS DE RASTREAMENTO DE GESTOS DA AMÉRICA DO NORTE NO MERCADO DE REALIDADE VIRTUAL, POR REGIÃO, 2020-2029 (US$ MILHÕES)
TABELA 10 MERCADO DE REALIDADE VIRTUAL DA AMÉRICA DO NORTE, POR TECNOLOGIA, 2020-2029 (US$ MILHÕES)
TABELA 11 MERCADO DA AMÉRICA DO NORTE TOTALMENTE IMERSIVO EM REALIDADE VIRTUAL, POR REGIÃO, 2020-2029 (US$ MILHÕES)
TABELA 12 MERCADO DE REALIDADE VIRTUAL NÃO IMERSIVA DA AMÉRICA DO NORTE, POR REGIÃO, 2020-2029 (US$ MILHÕES)
TABELA 13 MERCADO DE REALIDADE VIRTUAL SEMIIMERSIVA DA AMÉRICA DO NORTE, POR REGIÃO, 2020-2029 (US$ MILHÕES)
TABELA 14 MERCADO DE REALIDADE VIRTUAL DA AMÉRICA DO NORTE, POR VERTICAL, 2020-2029 (US$ MILHÕES)
TABELA 15 ENTRETENIMENTO E MÍDIA DA AMÉRICA DO NORTE NO MERCADO DE REALIDADE VIRTUAL, POR REGIÃO, 2020-2029 (US$ MILHÕES)
TABELA 16 ENTRETENIMENTO E MÍDIA DA AMÉRICA DO NORTE NO MERCADO DE REALIDADE VIRTUAL, POR TECNOLOGIA, 2020-2029 (US$ MILHÕES)
TABELA 17 MERCADO DE ENTRETENIMENTO E MÍDIA DA AMÉRICA DO NORTE EM REALIDADE VIRTUAL, POR APLICAÇÃO, 2020-2029 (US$ MILHÕES)
TABELA 18: MERCADO DE SAÚDE EM REALIDADE VIRTUAL DA AMÉRICA DO NORTE, POR REGIÃO, 2020-2029 (US$ MILHÕES)
TABELA 19: MERCADO DE SAÚDE NA AMÉRICA DO NORTE EM REALIDADE VIRTUAL, POR TIPO, 2020-2029 (US$ MILHÕES)
TABELA 20: MERCADO DE SAÚDE NA AMÉRICA DO NORTE EM REALIDADE VIRTUAL, POR TECNOLOGIA, 2020-2029 (US$ MILHÕES)
TABELA 21 MERCADO INDUSTRIAL DE REALIDADE VIRTUAL DA AMÉRICA DO NORTE, POR REGIÃO, 2020-2029 (US$ MILHÕES)
TABELA 22 MERCADO INDUSTRIAL DE REALIDADE VIRTUAL DA AMÉRICA DO NORTE, POR TECNOLOGIA, 2020-2029 (US$ MILHÕES)
TABELA 23 MERCADO DE REALIDADE VIRTUAL COMERCIAL DA AMÉRICA DO NORTE, POR REGIÃO, 2020-2029 (US$ MILHÕES)
TABELA 24 MERCADO DE REALIDADE VIRTUAL COMERCIAL DA AMÉRICA DO NORTE, POR TIPO, 2020-2029 (US$ MILHÕES)
TABELA 25 MERCADO DE REALIDADE VIRTUAL COMERCIAL DA AMÉRICA DO NORTE, POR TECNOLOGIA, 2020-2029 (US$ MILHÕES)
TABELA 26 MERCADO DE REALIDADE VIRTUAL DA AMÉRICA DO NORTE, AEROESPACIAL E DEFESA, POR REGIÃO, 2020-2029 (US$ MILHÕES)
TABELA 27 MERCADO DE REALIDADE VIRTUAL DA AMÉRICA DO NORTE, AEROESPACIAL E DEFESA, POR TECNOLOGIA, 2020-2029 (US$ MILHÕES)
TABELA 28 MERCADO AUTOMOTIVO DA AMÉRICA DO NORTE EM REALIDADE VIRTUAL, POR REGIÃO, 2020-2029 (US$ MILHÕES)
TABELA 29 MERCADO AUTOMOTIVO DA AMÉRICA DO NORTE EM REALIDADE VIRTUAL, POR TECNOLOGIA, 2020-2029 (US$ MILHÕES)
TABELA 30 MERCADO DE EDUCAÇÃO EM REALIDADE VIRTUAL NA AMÉRICA DO NORTE, POR REGIÃO, 2020-2029 (US$ MILHÕES)
TABELA 31 MERCADO DE EDUCAÇÃO EM REALIDADE VIRTUAL NA AMÉRICA DO NORTE, POR TECNOLOGIA, 2020-2029 (US$ MILHÕES)
TABELA 32 AMÉRICA DO NORTE: OUTROS INGRESSOS NO MERCADO DE REALIDADE VIRTUAL, POR REGIÃO, 2020-2029 (US$ MILHÕES)
TABELA 33 MERCADO DE REALIDADE VIRTUAL DA AMÉRICA DO NORTE, POR PAÍS, 2020-2029 (US$ MILHÕES)
TABELA 34 MERCADO DE REALIDADE VIRTUAL DA AMÉRICA DO NORTE, POR COMPONENTE, 2020-2029 (US$ MILHÕES)
TABELA 35 HARDWARE DA AMÉRICA DO NORTE NO MERCADO DE REALIDADE VIRTUAL, POR COMPONENTE, 2020-2029 (US$ MILHÕES)
TABELA 36 SOFTWARE DA AMÉRICA DO NORTE NO MERCADO DE REALIDADE VIRTUAL, POR COMPONENTE, 2020-2029 (US$ MILHÕES)
TABELA 37 MERCADO DE REALIDADE VIRTUAL DA AMÉRICA DO NORTE, POR TIPO DE DISPOSITIVO, 2020-2029 (US$ MILHÕES)
TABELA 38 MERCADO DE REALIDADE VIRTUAL DA AMÉRICA DO NORTE, POR TECNOLOGIA, 2020-2029 (US$ MILHÕES)
TABELA 39 MERCADO DE REALIDADE VIRTUAL DA AMÉRICA DO NORTE, POR VERTICAL, 2020-2029 (US$ MILHÕES)
TABELA 40 MERCADO DE ENTRETENIMENTO E MÍDIA DA AMÉRICA DO NORTE NO MERCADO DE REALIDADE VIRTUAL, POR APLICAÇÃO, 2020-2029 (US$ MILHÕES)
TABELA 41 ENTRETENIMENTO E MÍDIA DA AMÉRICA DO NORTE NO MERCADO DE REALIDADE VIRTUAL, POR TECNOLOGIA, 2020-2029 (US$ MILHÕES)
TABELA 42 MERCADO DE SAÚDE NA AMÉRICA DO NORTE EM REALIDADE VIRTUAL, POR TIPO, 2020-2029 (US$ MILHÕES)
TABELA 43: MERCADO DE SAÚDE DA AMÉRICA DO NORTE EM REALIDADE VIRTUAL, POR TECNOLOGIA, 2020-2029 (US$ MILHÕES)
TABELA 44 MERCADO INDUSTRIAL DA AMÉRICA DO NORTE EM REALIDADE VIRTUAL, POR TECNOLOGIA, 2020-2029 (US$ MILHÕES)
TABELA 45 MERCADO DE REALIDADE VIRTUAL COMERCIAL DA AMÉRICA DO NORTE, POR TIPO, 2020-2029 (US$ MILHÕES)
TABELA 46 MERCADO DE REALIDADE VIRTUAL COMERCIAL DA AMÉRICA DO NORTE, POR TECNOLOGIA, 2022-2029 (US$ MILHÕES)
TABELA 47 MERCADO DE REALIDADE VIRTUAL DA AMÉRICA DO NORTE, AEROESPACIAL E DEFESA, POR TECNOLOGIA, 2020-2029 (US$ MILHÕES)
TABELA 48 MERCADO AUTOMOTIVO DA AMÉRICA DO NORTE EM REALIDADE VIRTUAL, POR TECNOLOGIA, 2020-2029 (US$ MILHÕES)
TABELA 49 MERCADO DE EDUCAÇÃO EM REALIDADE VIRTUAL NA AMÉRICA DO NORTE, POR TECNOLOGIA, 2020-2029 (US$ MILHÕES)
TABELA 50 MERCADO DE REALIDADE VIRTUAL DOS EUA, POR COMPONENTE, 2020-2029 (US$ MILHÕES)
TABELA 51 HARDWARE NO MERCADO DE REALIDADE VIRTUAL DOS EUA, POR COMPONENTE, 2020-2029 (US$ MILHÕES)
TABELA 52 SOFTWARE NO MERCADO DE REALIDADE VIRTUAL DOS EUA, POR COMPONENTE, 2020-2029 (US$ MILHÕES)
TABELA 53 MERCADO DE REALIDADE VIRTUAL DOS EUA, POR TIPO DE DISPOSITIVO, 2020-2029 (US$ MILHÕES)
TABELA 54 MERCADO DE REALIDADE VIRTUAL DOS EUA, POR TECNOLOGIA, 2020-2029 (US$ MILHÕES)
TABELA 55 MERCADO DE REALIDADE VIRTUAL DOS EUA, POR VERTICAL, 2020-2029 (US$ MILHÕES)
TABELA 56 MERCADO DE ENTRETENIMENTO E MÍDIA DOS EUA EM REALIDADE VIRTUAL, POR APLICAÇÃO, 2020-2029 (US$ MILHÕES)
TABELA 57 ENTRETENIMENTO E MÍDIA NOS EUA NO MERCADO DE REALIDADE VIRTUAL, POR TECNOLOGIA, 2020-2029 (US$ MILHÕES)
TABELA 58 MERCADO DE SAÚDE EM REALIDADE VIRTUAL NOS EUA, POR TIPO, 2020-2029 (US$ MILHÕES)
TABELA 59: MERCADO DE SAÚDE EM REALIDADE VIRTUAL NOS EUA, POR TECNOLOGIA, 2020-2029 (US$ MILHÕES)
TABELA 60 MERCADO INDUSTRIAL DE REALIDADE VIRTUAL DOS EUA, POR TECNOLOGIA, 2020-2029 (US$ MILHÕES)
TABELA 61 MERCADO COMERCIAL DE REALIDADE VIRTUAL DOS EUA, POR TIPO, 2020-2029 (US$ MILHÕES)
TABELA 62 MERCADO COMERCIAL DE REALIDADE VIRTUAL DOS EUA, POR TECNOLOGIA, 2022-2029 (US$ MILHÕES)
TABELA 63 MERCADO AEROESPACIAL E DEFESA DOS EUA EM REALIDADE VIRTUAL, POR TECNOLOGIA, 2020-2029 (US$ MILHÕES)
TABELA 64 MERCADO AUTOMOTIVO DOS EUA EM REALIDADE VIRTUAL, POR TECNOLOGIA, 2020-2029 (US$ MILHÕES)
TABELA 65 MERCADO DE EDUCAÇÃO EM REALIDADE VIRTUAL NOS EUA, POR TECNOLOGIA, 2020-2029 (US$ MILHÕES)
TABELA 66 MERCADO DE REALIDADE VIRTUAL DO CANADÁ, POR COMPONENTE, 2020-2029 (US$ MILHÕES)
TABELA 67 HARDWARE DO CANADÁ NO MERCADO DE REALIDADE VIRTUAL, POR COMPONENTE, 2020-2029 (US$ MILHÕES)
TABELA 68 SOFTWARE NO MERCADO DE REALIDADE VIRTUAL DO CANADÁ, POR COMPONENTE, 2020-2029 (US$ MILHÕES)
TABELA 69 MERCADO DE REALIDADE VIRTUAL DO CANADÁ, POR TIPO DE DISPOSITIVO, 2020-2029 (US$ MILHÕES)
TABELA 70 MERCADO DE REALIDADE VIRTUAL DO CANADÁ, POR TECNOLOGIA, 2020-2029 (US$ MILHÕES)
TABELA 71 MERCADO DE REALIDADE VIRTUAL DO CANADÁ, POR VERTICAL, 2020-2029 (US$ MILHÕES)
TABELA 72 MERCADO DE ENTRETENIMENTO E MÍDIA DO CANADÁ EM REALIDADE VIRTUAL, POR APLICAÇÃO, 2020-2029 (US$ MILHÕES)
TABELA 73 ENTRETENIMENTO E MÍDIA DO CANADÁ NO MERCADO DE REALIDADE VIRTUAL, POR TECNOLOGIA, 2020-2029 (US$ MILHÕES)
TABELA 74: MERCADO DE SAÚDE EM REALIDADE VIRTUAL DO CANADÁ, POR TIPO, 2020-2029 (US$ MILHÕES)
TABELA 75: SAÚDE NO CANADÁ NO MERCADO DE REALIDADE VIRTUAL, POR TECNOLOGIA, 2020-2029 (US$ MILHÕES)
TABELA 76 MERCADO INDUSTRIAL DE REALIDADE VIRTUAL DO CANADÁ, POR TECNOLOGIA, 2020-2029 (US$ MILHÕES)
TABELA 77 MERCADO COMERCIAL DE REALIDADE VIRTUAL DO CANADÁ, POR TIPO, 2020-2029 (US$ MILHÕES)
TABELA 78 MERCADO COMERCIAL DE REALIDADE VIRTUAL DO CANADÁ, POR TECNOLOGIA, 2022-2029 (US$ MILHÕES)
TABELA 79: MERCADO AEROESPACIAL E DEFESA DO CANADÁ NO MERCADO DE REALIDADE VIRTUAL, POR TECNOLOGIA, 2020-2029 (US$ MILHÕES)
TABELA 80 MERCADO AUTOMOTIVO DO CANADÁ EM REALIDADE VIRTUAL, POR TECNOLOGIA, 2020-2029 (US$ MILHÕES)
TABELA 81 MERCADO DE EDUCAÇÃO EM REALIDADE VIRTUAL NO CANADÁ, POR TECNOLOGIA, 2020-2029 (US$ MILHÕES)
TABELA 82 MERCADO DE REALIDADE VIRTUAL DO MÉXICO, POR COMPONENTE, 2020-2029 (US$ MILHÕES)
TABELA 83 HARDWARE NO MERCADO DE REALIDADE VIRTUAL DO MÉXICO, POR COMPONENTE, 2020-2029 (US$ MILHÕES)
TABELA 84 SOFTWARE NO MERCADO DE REALIDADE VIRTUAL DO MÉXICO, POR COMPONENTE, 2020-2029 (US$ MILHÕES)
TABELA 85 MERCADO DE REALIDADE VIRTUAL DO MÉXICO, POR TIPO DE DISPOSITIVO, 2020-2029 (US$ MILHÕES)
TABELA 86 MERCADO DE REALIDADE VIRTUAL DO MÉXICO, POR TECNOLOGIA, 2020-2029 (US$ MILHÕES)
TABELA 87 MERCADO DE REALIDADE VIRTUAL DO MÉXICO, POR VERTICAL, 2020-2029 (US$ MILHÕES)
TABELA 88 MERCADO DE ENTRETENIMENTO E MÍDIA NO MÉXICO EM REALIDADE VIRTUAL, POR APLICAÇÃO, 2020-2029 (US$ MILHÕES)
TABELA 89 ENTRETENIMENTO E MÍDIA NO MÉXICO NO MERCADO DE REALIDADE VIRTUAL, POR TECNOLOGIA, 2020-2029 (US$ MILHÕES)
TABELA 90 MERCADO DE SAÚDE NO MÉXICO EM REALIDADE VIRTUAL, POR TIPO, 2020-2029 (US$ MILHÕES)
TABELA 91: MERCADO DE SAÚDE NO MÉXICO EM REALIDADE VIRTUAL, POR TECNOLOGIA, 2020-2029 (US$ MILHÕES)
TABELA 92 MERCADO INDUSTRIAL DE REALIDADE VIRTUAL DO MÉXICO, POR TECNOLOGIA, 2020-2029 (US$ MILHÕES)
TABELA 93 MERCADO COMERCIAL DE REALIDADE VIRTUAL DO MÉXICO, POR TIPO, 2020-2029 (US$ MILHÕES)
TABELA 94 MERCADO COMERCIAL DE REALIDADE VIRTUAL DO MÉXICO, POR TECNOLOGIA, 2022-2029 (US$ MILHÕES)
TABELA 95 MERCADO DE REALIDADE VIRTUAL DO MÉXICO AEROESPACIAL E DEFESA, POR TECNOLOGIA, 2020-2029 (US$ MILHÕES)
TABELA 96 MERCADO AUTOMOTIVO DO MÉXICO EM REALIDADE VIRTUAL, POR TECNOLOGIA, 2020-2029 (US$ MILHÕES)
TABELA 97 MERCADO DE EDUCAÇÃO EM REALIDADE VIRTUAL NO MÉXICO, POR TECNOLOGIA, 2020-2029 (US$ MILHÕES)
Lista de Figura
FIGURA 1 MERCADO DE REALIDADE VIRTUAL DA AMÉRICA DO NORTE: SEGMENTAÇÃO
FIGURA 2 MERCADO DE REALIDADE VIRTUAL DA AMÉRICA DO NORTE: TRIANGULAÇÃO DE DADOS
FIGURA 3 MERCADO DE REALIDADE VIRTUAL DA AMÉRICA DO NORTE: ANÁLISE DROC
FIGURA 4 MERCADO DE REALIDADE VIRTUAL DA AMÉRICA DO NORTE: ANÁLISE DE MERCADO REGIONAL VS AMÉRICA DO NORTE
FIGURA 5 MERCADO DE REALIDADE VIRTUAL DA AMÉRICA DO NORTE: ANÁLISE DE PESQUISA DA EMPRESA
FIGURA 6 MERCADO DE REALIDADE VIRTUAL DA AMÉRICA DO NORTE: DEMOGRAFIA DA ENTREVISTA
FIGURA 7 MERCADO DE REALIDADE VIRTUAL DA AMÉRICA DO NORTE: GRADE DE POSIÇÃO DE MERCADO DBMR
FIGURA 8 MERCADO DE REALIDADE VIRTUAL DA AMÉRICA DO NORTE: ANÁLISE DA PARTICIPAÇÃO DE FORNECEDORES
FIGURA 9 MERCADO DE REALIDADE VIRTUAL DA AMÉRICA DO NORTE: GRADE DE COBERTURA VERTICAL DO MERCADO
FIGURA 10 MERCADO DE REALIDADE VIRTUAL DA AMÉRICA DO NORTE: SEGMENTAÇÃO
FIGURA 11 A CRESCENTE DEMANDA POR HMD NA INDÚSTRIA DE JOGOS E ENTRETENIMENTO DEVE IMPULSIONAR O CRESCIMENTO DO MERCADO DE REALIDADE VIRTUAL DA AMÉRICA DO NORTE NO PERÍODO PREVISTO DE 2022 A 2029
FIGURA 12 O SEGMENTO DE HARDWARE DEVE SER REPRESENTANTE DA MAIOR PARCIALIDADE DO MERCADO DE REALIDADE VIRTUAL DA AMÉRICA DO NORTE EM 2022 E 2029
FIGURA 13 ESPERA-SE QUE A ÁSIA-PACÍFICO DOMINE O MERCADO DE REALIDADE VIRTUAL E CRESÇA COM A MAIOR TAXA DE CRESCIMENTO NO PERÍODO PREVISTO DE 2022 A 2029
FIGURA 14 A FIGURA ACIMA MOSTRA O POTENCIAL DAS APLICAÇÕES DE REALIDADE VIRTUAL POR CATEGORIA.
FIGURA 15 MOTIVADORES, RESTRIÇÕES, OPORTUNIDADES E DESAFIOS DO MERCADO DE REALIDADE VIRTUAL DA AMÉRICA DO NORTE
FIGURA 16 ESTIMATIVA DO MERCADO DE REALIDADE VIRTUAL DA AMÉRICA DO NORTE (2016-2021)
FIGURA 17 MERCADO DE REALIDADE VIRTUAL DA AMÉRICA DO NORTE: POR COMPONENTE, 2021
FIGURA 18 MERCADO DE REALIDADE VIRTUAL DA AMÉRICA DO NORTE: POR TIPO DE DISPOSITIVO, 2021
FIGURA 19 MERCADO DE REALIDADE VIRTUAL DA AMÉRICA DO NORTE: POR TECNOLOGIA, 2021
FIGURA 20 MERCADO DE REALIDADE VIRTUAL DA AMÉRICA DO NORTE: POR VERTICAL, 2021
FIGURA 21 MERCADO DE REALIDADE VIRTUAL DA AMÉRICA DO NORTE: INSTANTÂNEO (2021)
FIGURA 22 MERCADO DE REALIDADE VIRTUAL DA AMÉRICA DO NORTE: POR PAÍS (2021)
FIGURA 23 MERCADO DE REALIDADE VIRTUAL DA AMÉRICA DO NORTE: POR PAÍS (2022 E 2029)
FIGURA 24 MERCADO DE REALIDADE VIRTUAL DA AMÉRICA DO NORTE: POR PAÍS (2021 E 2029)
FIGURA 25 MERCADO DE REALIDADE VIRTUAL DA AMÉRICA DO NORTE: POR COMPONENTE (2022-2029)
FIGURA 26 MERCADO DE REALIDADE VIRTUAL DA AMÉRICA DO NORTE: PARTICIPAÇÃO DA EMPRESA EM 2021 (%)
Metodologia de Investigação
A recolha de dados e a análise do ano base são feitas através de módulos de recolha de dados com amostras grandes. A etapa inclui a obtenção de informações de mercado ou dados relacionados através de diversas fontes e estratégias. Inclui examinar e planear antecipadamente todos os dados adquiridos no passado. Da mesma forma, envolve o exame de inconsistências de informação observadas em diferentes fontes de informação. Os dados de mercado são analisados e estimados utilizando modelos estatísticos e coerentes de mercado. Além disso, a análise da quota de mercado e a análise das principais tendências são os principais fatores de sucesso no relatório de mercado. Para saber mais, solicite uma chamada de analista ou abra a sua consulta.
A principal metodologia de investigação utilizada pela equipa de investigação do DBMR é a triangulação de dados que envolve a mineração de dados, a análise do impacto das variáveis de dados no mercado e a validação primária (especialista do setor). Os modelos de dados incluem grelha de posicionamento de fornecedores, análise da linha de tempo do mercado, visão geral e guia de mercado, grelha de posicionamento da empresa, análise de patentes, análise de preços, análise da quota de mercado da empresa, normas de medição, análise global versus regional e de participação dos fornecedores. Para saber mais sobre a metodologia de investigação, faça uma consulta para falar com os nossos especialistas do setor.
Personalização disponível
A Data Bridge Market Research é líder em investigação formativa avançada. Orgulhamo-nos de servir os nossos clientes novos e existentes com dados e análises que correspondem e atendem aos seus objetivos. O relatório pode ser personalizado para incluir análise de tendências de preços de marcas-alvo, compreensão do mercado para países adicionais (solicite a lista de países), dados de resultados de ensaios clínicos, revisão de literatura, mercado remodelado e análise de base de produtos . A análise de mercado dos concorrentes-alvo pode ser analisada desde análises baseadas em tecnologia até estratégias de carteira de mercado. Podemos adicionar quantos concorrentes necessitar de dados no formato e estilo de dados que procura. A nossa equipa de analistas também pode fornecer dados em tabelas dinâmicas de ficheiros Excel em bruto (livro de factos) ou pode ajudá-lo a criar apresentações a partir dos conjuntos de dados disponíveis no relatório.

