U.S Hotel Market from B2B Corporate Spending, By Chain (Luxury, Upper Upscale, Upscale, Upper Midscale, Midscale and Economy), Domain (International and Domestic), Sector (BFSI, Manufacturing, Healthcare, IT Services, Government and Others), Booking Channel (Direct Bookings, Online Travel Agencies (OTAS) and Travel Management Companies (TMC)) - Industry Trends and Forecast to 2029.
U.S. Hotel Market from B2B Corporate Spending Analysis and Insights
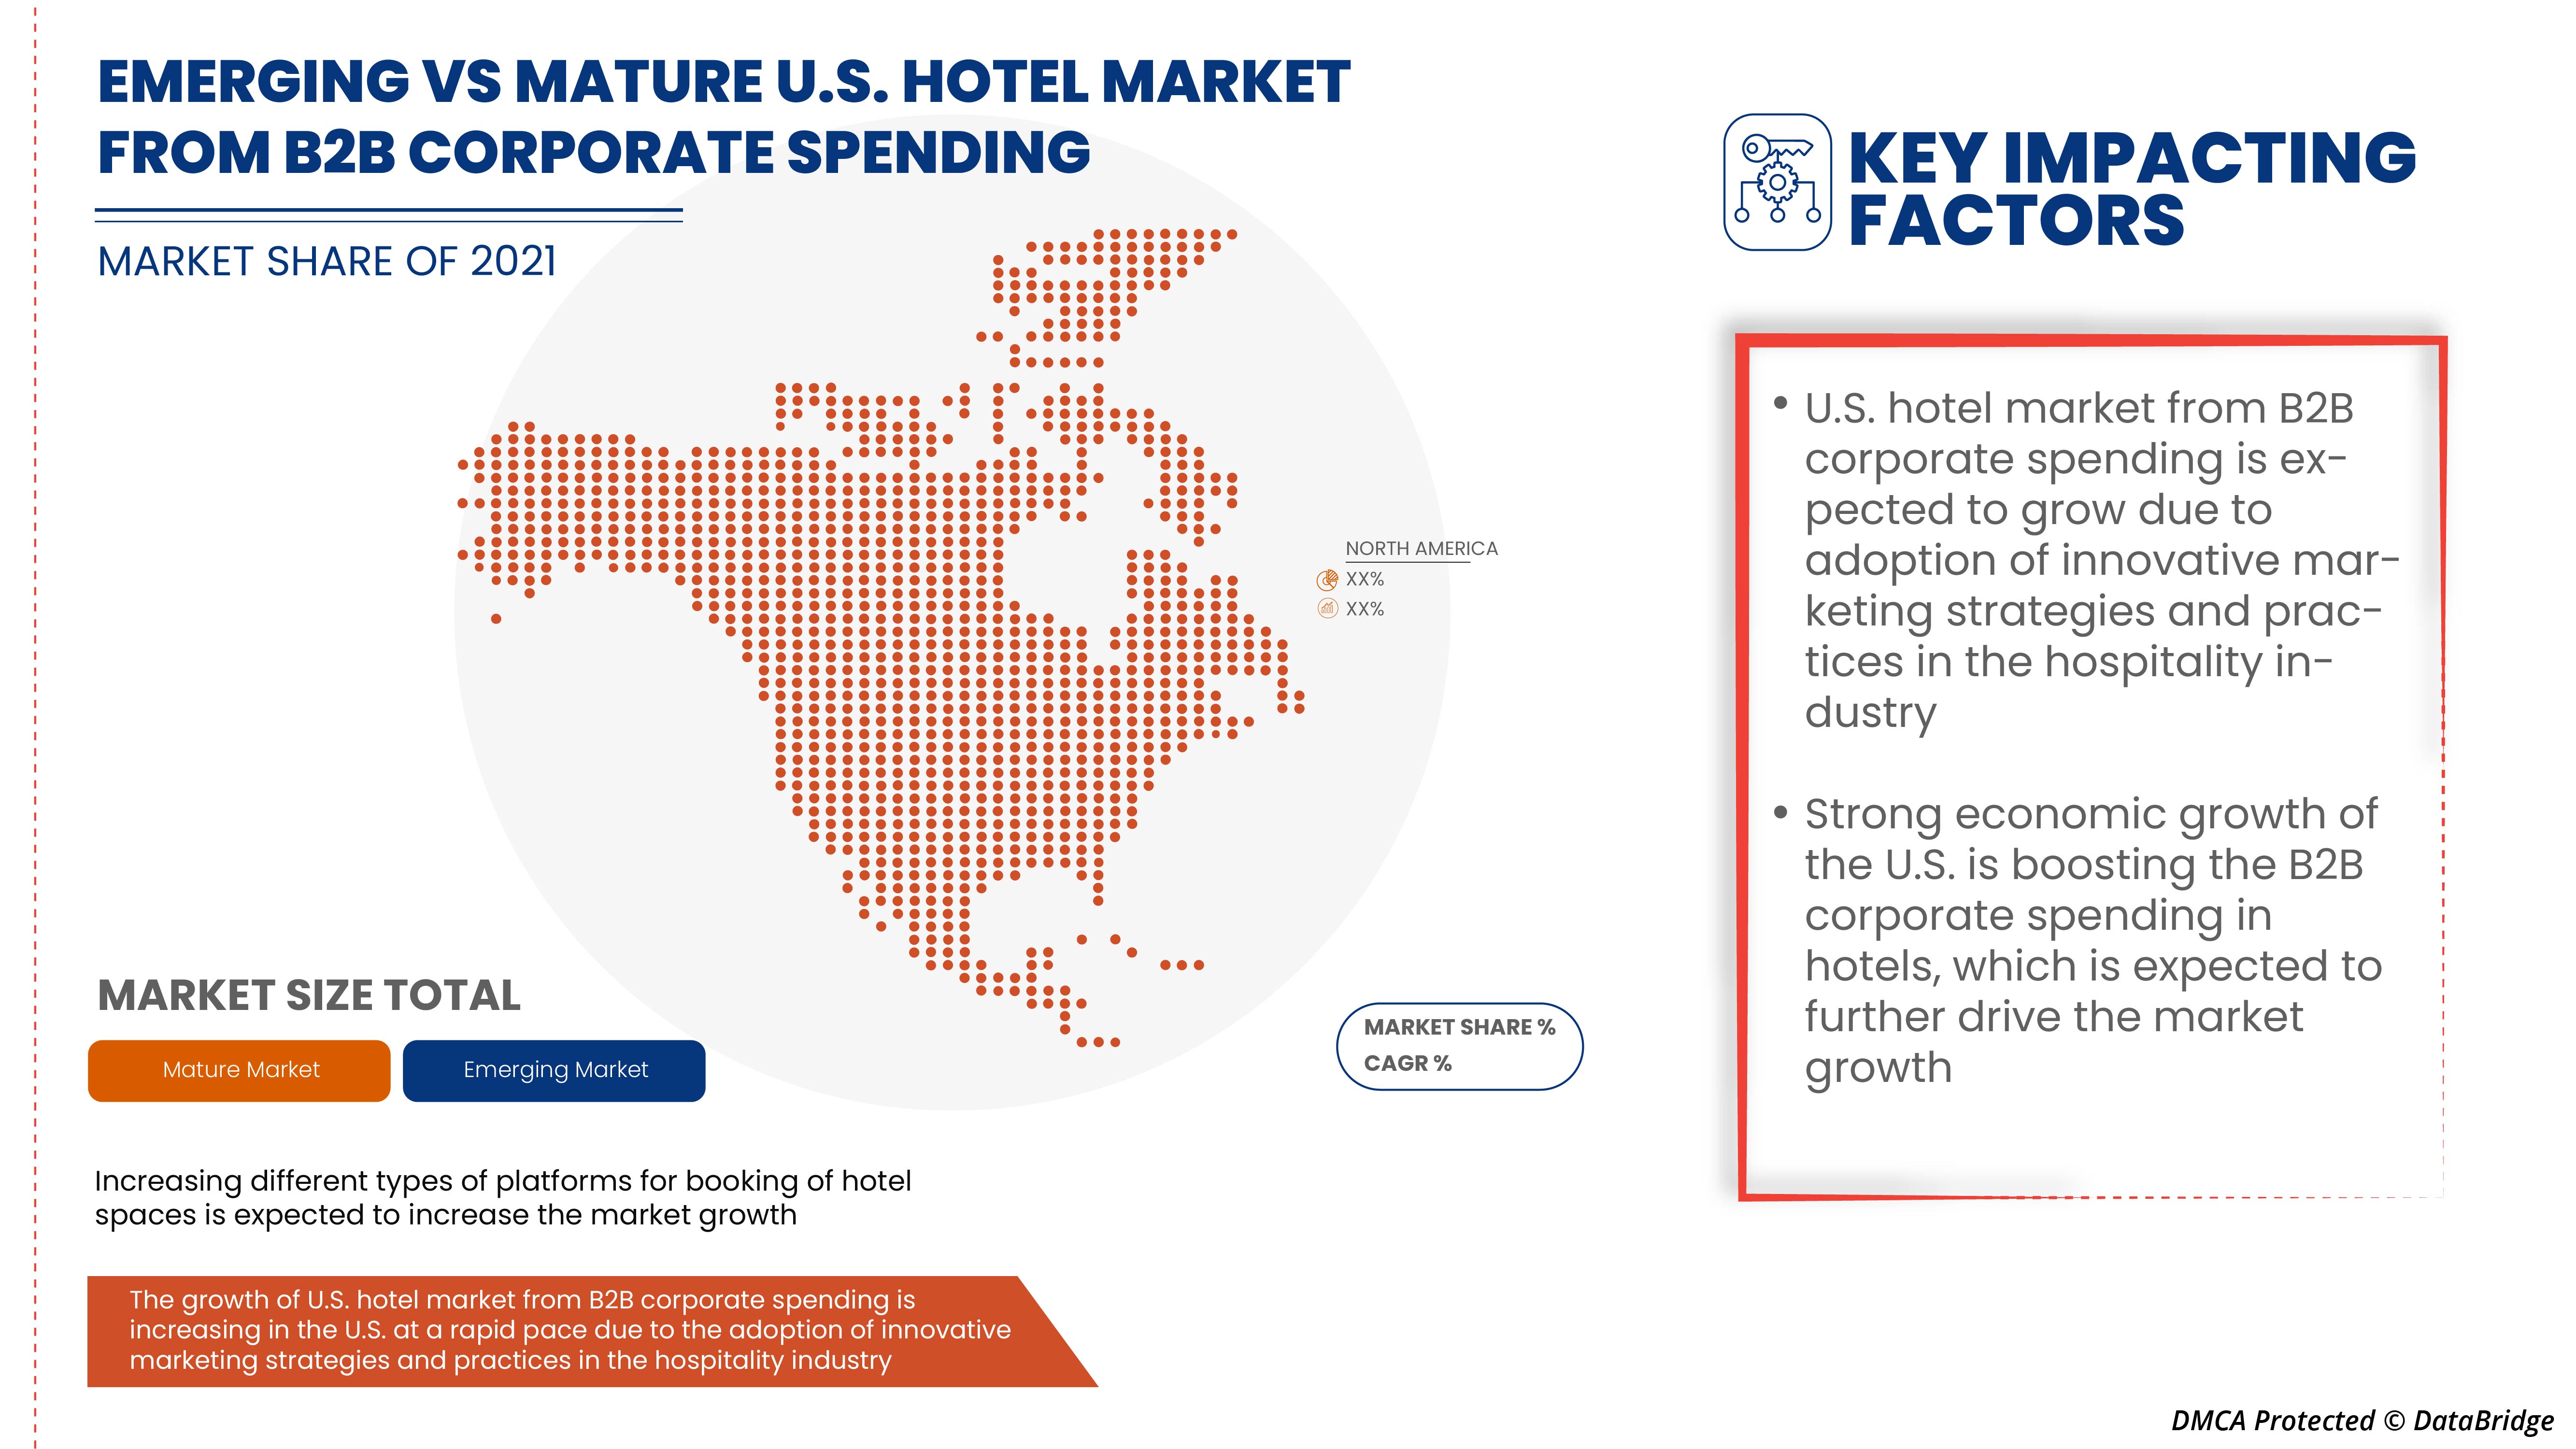
The U.S. hotel market from B2B corporate spending is expected to gain significant growth in the forecast period of 2022 to 2029. Data Bridge Market Research analyzes that the market is growing with a CAGR of 3.7% in the forecast period of 2022 to 2029 and is expected to reach USD 22,640.46 million by 2029. The major factor driving the growth of the market is the adoption of innovative marketing strategies and practices in the hospitality industry in the forecast period. The shifting preference of corporates to online events and digitalization is expected to restrain market growth.
Increase in different types of platforms for booking hotel spaces is expected to provide the market with great opportunities. However, the outbreak of COVID-19 pandemic has resulted in the cancellation of various corporate events and B2B spending is projected to challenge the market growth.
The U.S. hotel market from B2B corporate spending report provides details of market share, new developments, the impact of domestic and localized market players, analysis of opportunities in terms of emerging revenue pockets, changes in market regulations, products approvals, strategic decisions, product launches, geographic expansions and technological innovations in the market. To understand the analysis and the market scenario contact us for an Analyst Brief, our team will help you create a revenue impact solution to achieve your desired goal.
|
Report Metric |
Details |
|
Forecast Period |
2022 to 2029 |
|
Base Year |
2021 |
|
Historic Year |
2020 (Customizable to 2019 - 2014) |
|
Quantitative Units |
Revenue in USD Million |
|
Segments Covered |
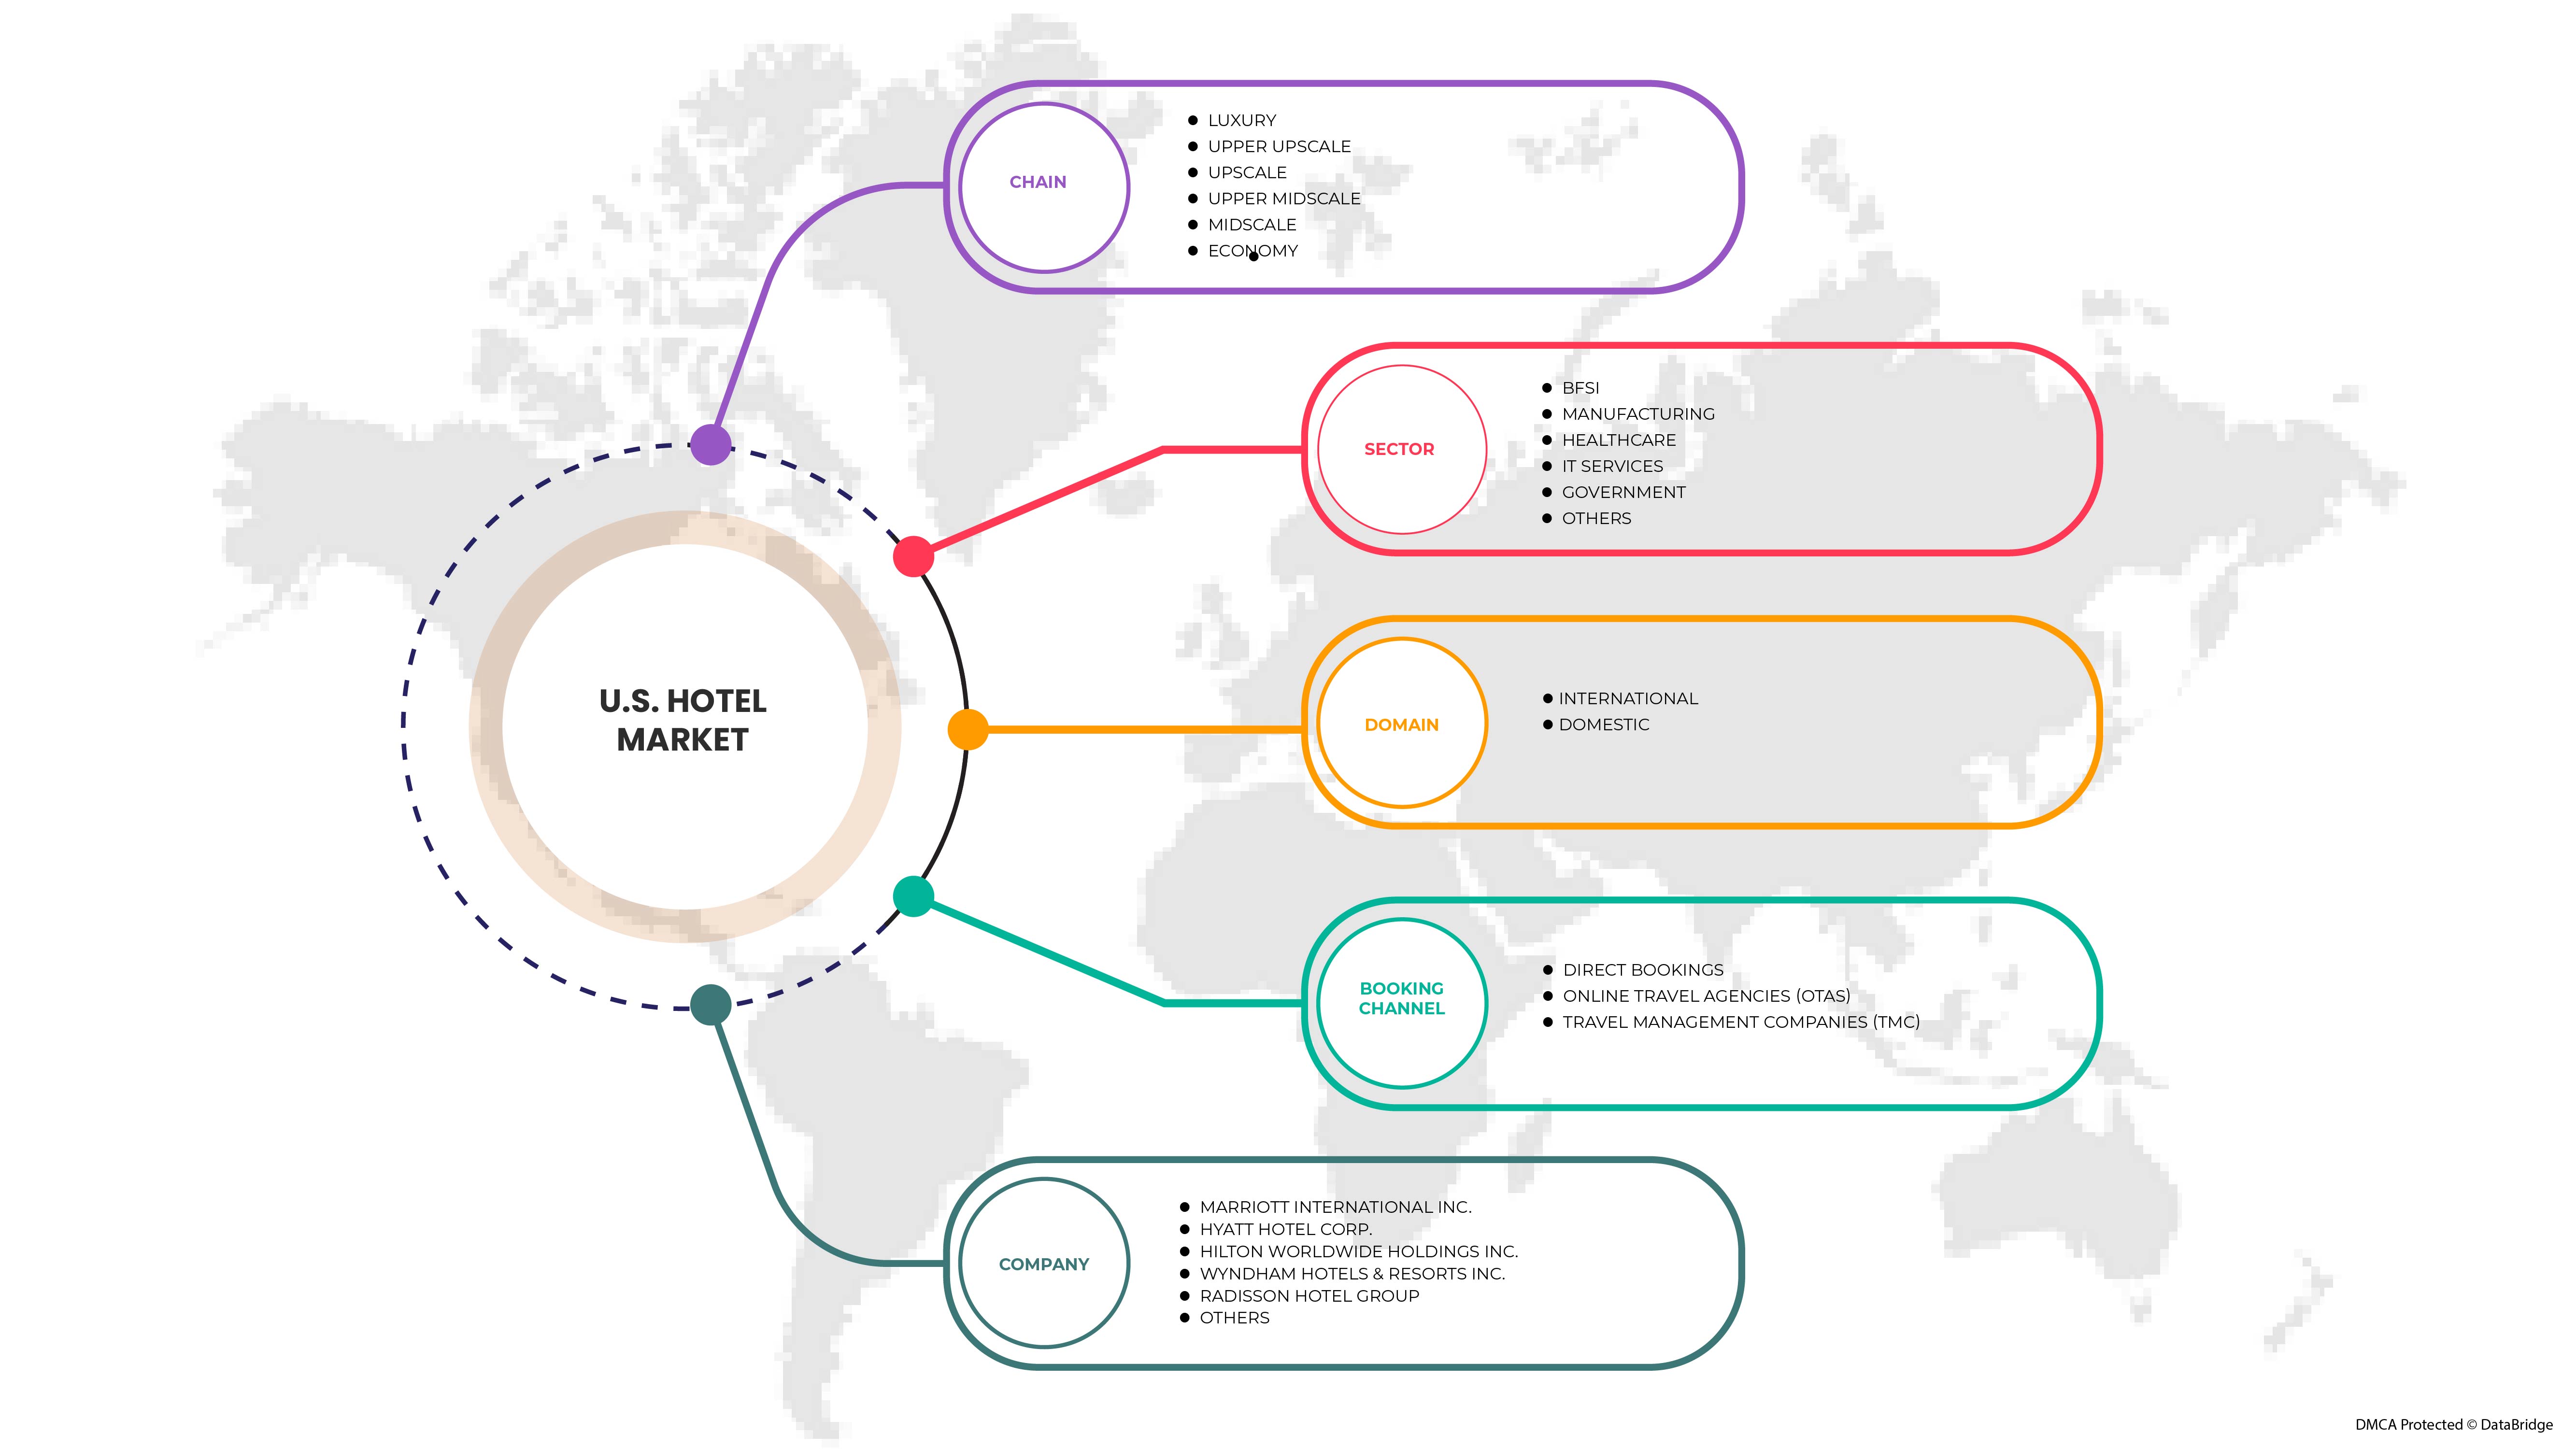
By Chain (Luxury, Upper Upscale, Upscale, Upper Midscale, Midscale and Economy), Domain (International and Domestic), Sector (BFSI, Manufacturing, Healthcare, IT Services, Government and Others), Booking Channel (Direct Bookings, Online Travel Agencies (OTAS) and Travel Management Companies (TMC)) |
|
Countries Covered |
U.S. |
|
Market Players Covered |
Marriott International Inc., Hyatt Hotel Corp., Hilton Worldwide Holdings Inc., Wyndham Hotels & Resorts Inc., Radisson Hotel Group MARRIOTT, Rosewood Hotel Group |
Market Definition
B2B corporate spending in hotels can be defined as spending on events such as gatherings organized by business owners in hotels to focus on employees and customers and further strengthen the clientele, as well as stays for company employees in various events. Various businesses and corporates organize events for many reasons. They may want to educate, reward, motivate, celebrate, mark key milestones, manage organizational change or encourage collaboration.
U.S. Hotel Market from B2B Corporate Spending Market Dynamics
Drivers
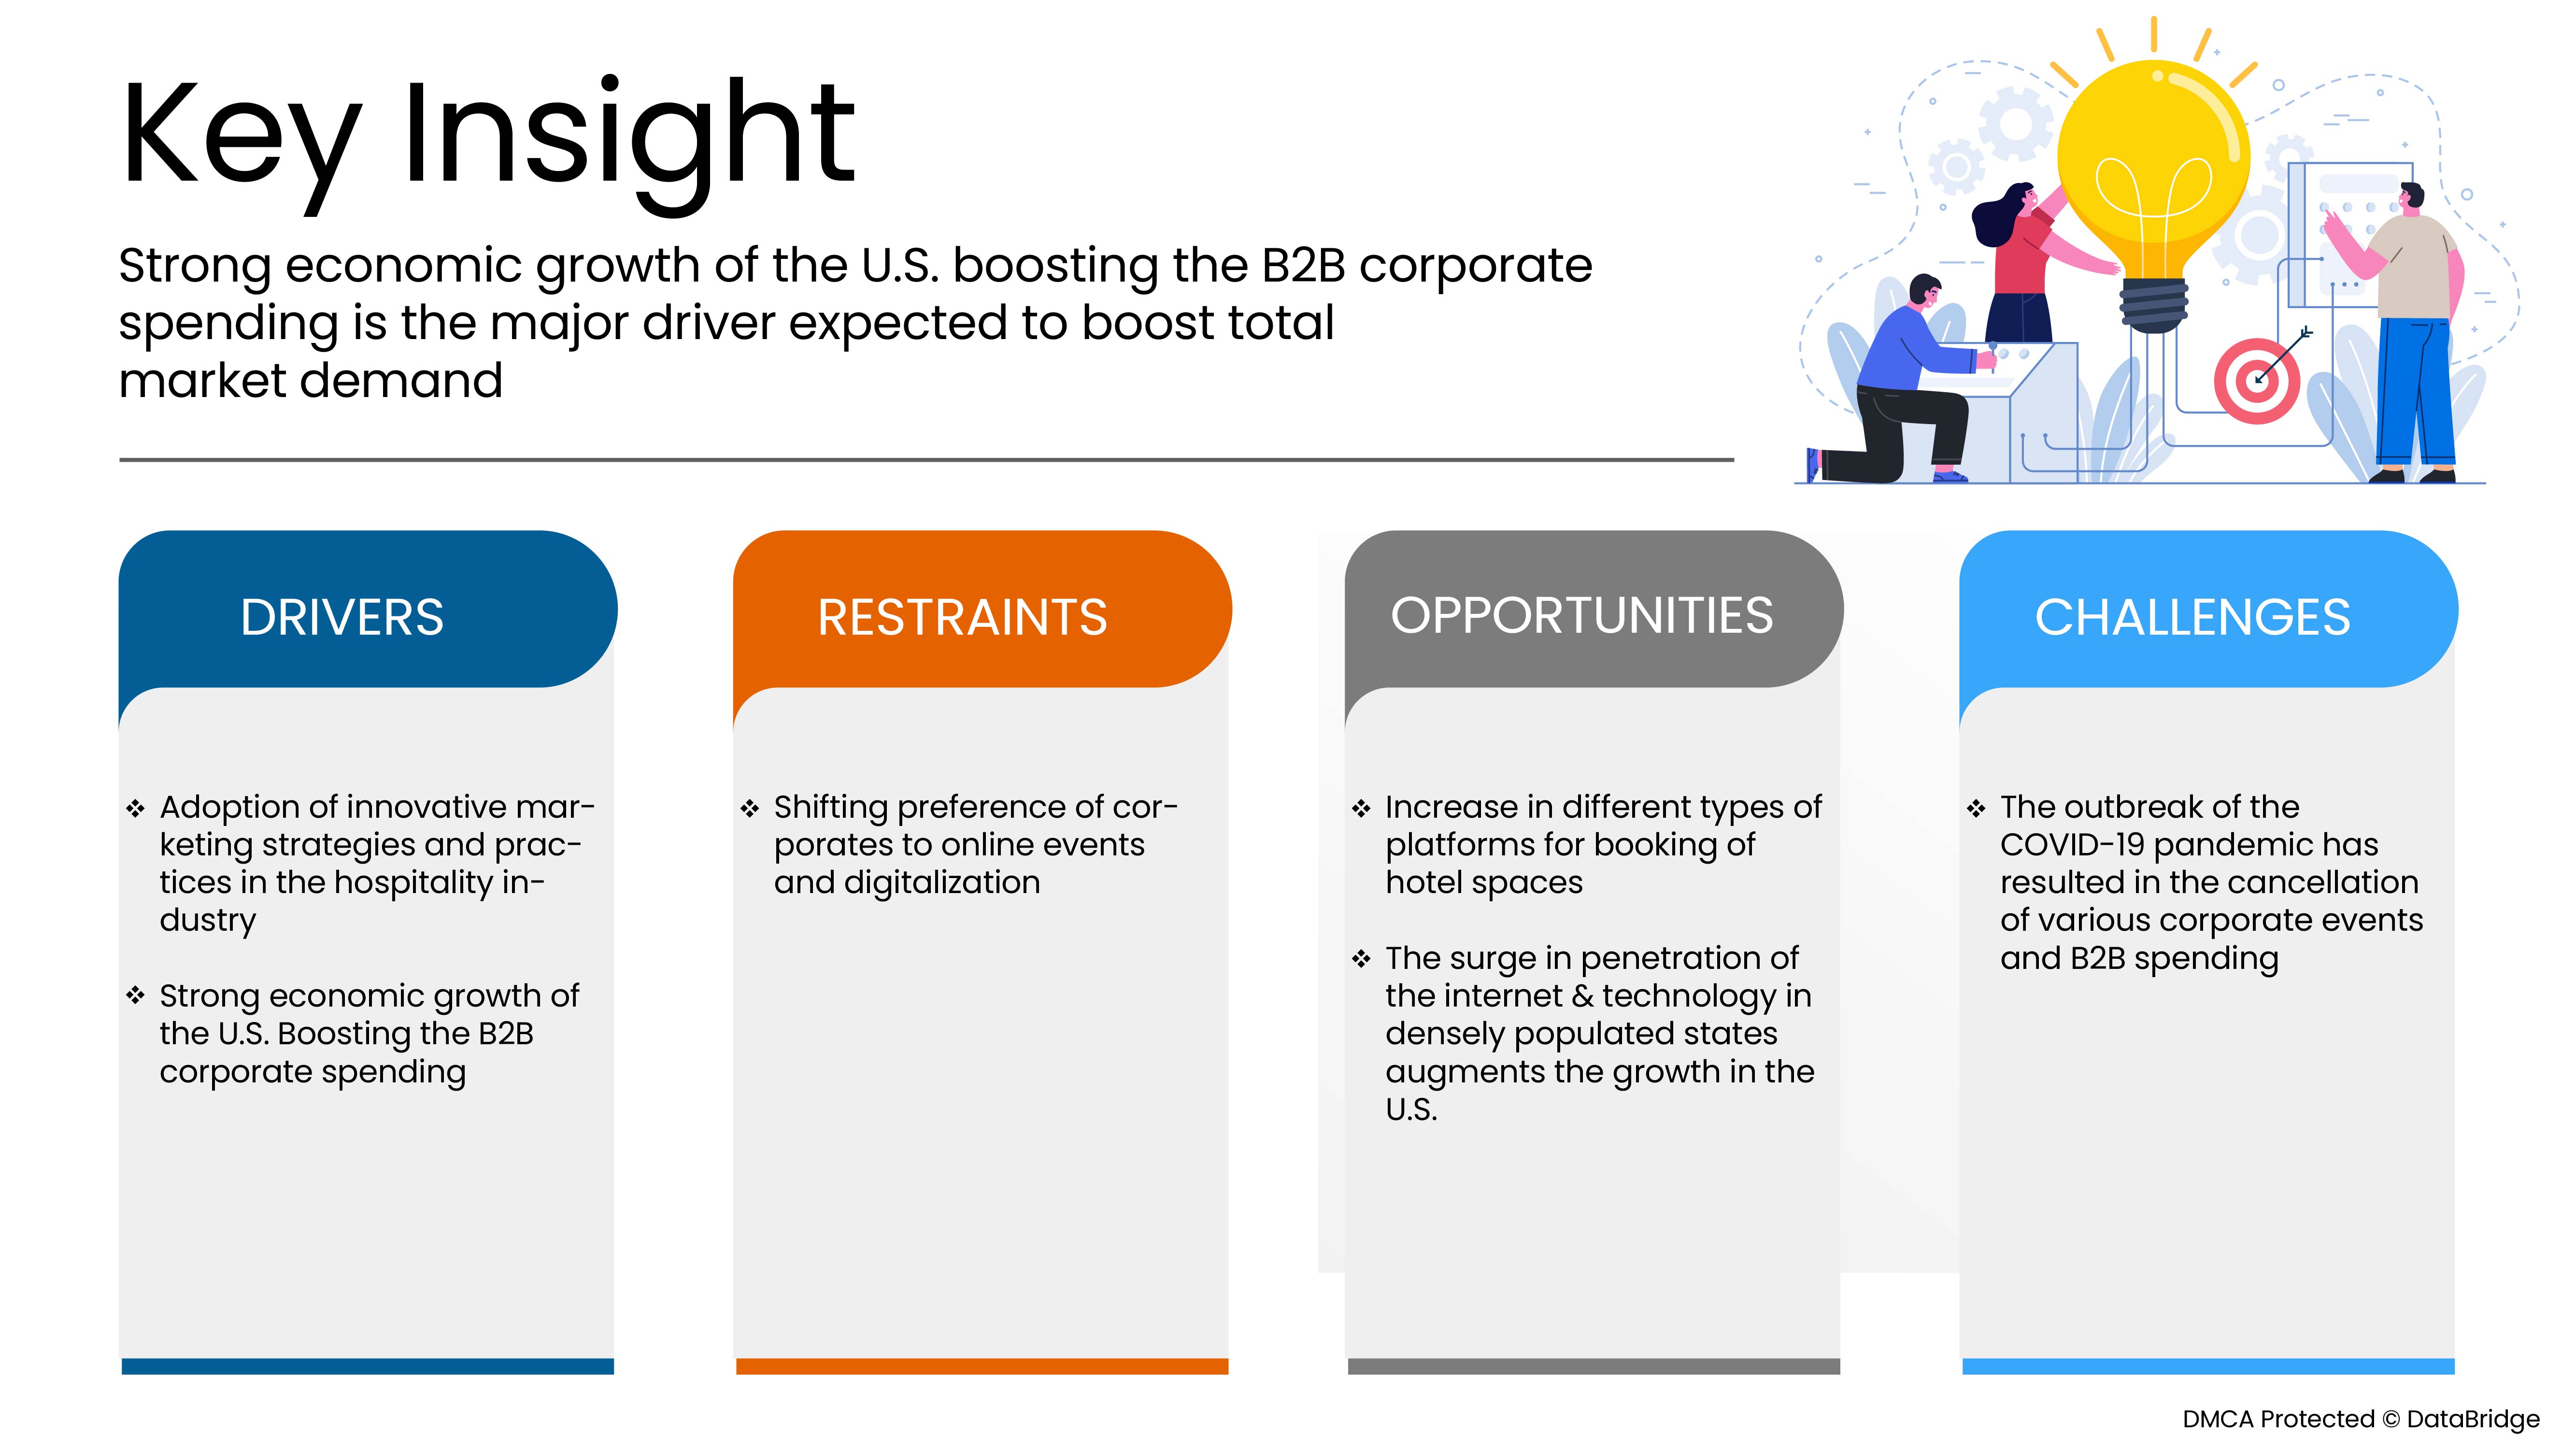
- Adoption of innovative marketing strategies and practices in the hospitality industry
Virtual Reality (VR) has become one of the biggest emerging hospitality technology and marketing trends of recent times. VR tours of the space and hotels provide the ultimate means of experiencing a location from afar, recreating the environment in a way that allows for some degree of exploration and immersion. For corporate event customers, it means the chance to explore event venues without needing to travel there for viewing physically. This is especially valuable at a time when travel is restricted. In addition, various hotel groups and brands are advertising their brands and hotel chains through videos on social media platforms, using hashtags and brand engagement campaigns implemented on digital platforms are considered the best practice in the hospitality sector. Therefore, with such innovative practices by the hospitality sector, B2B spending for corporates is expected to increase, which will drive market growth.
- Strong economic growth of the U.S. boosting the B2B corporate spending
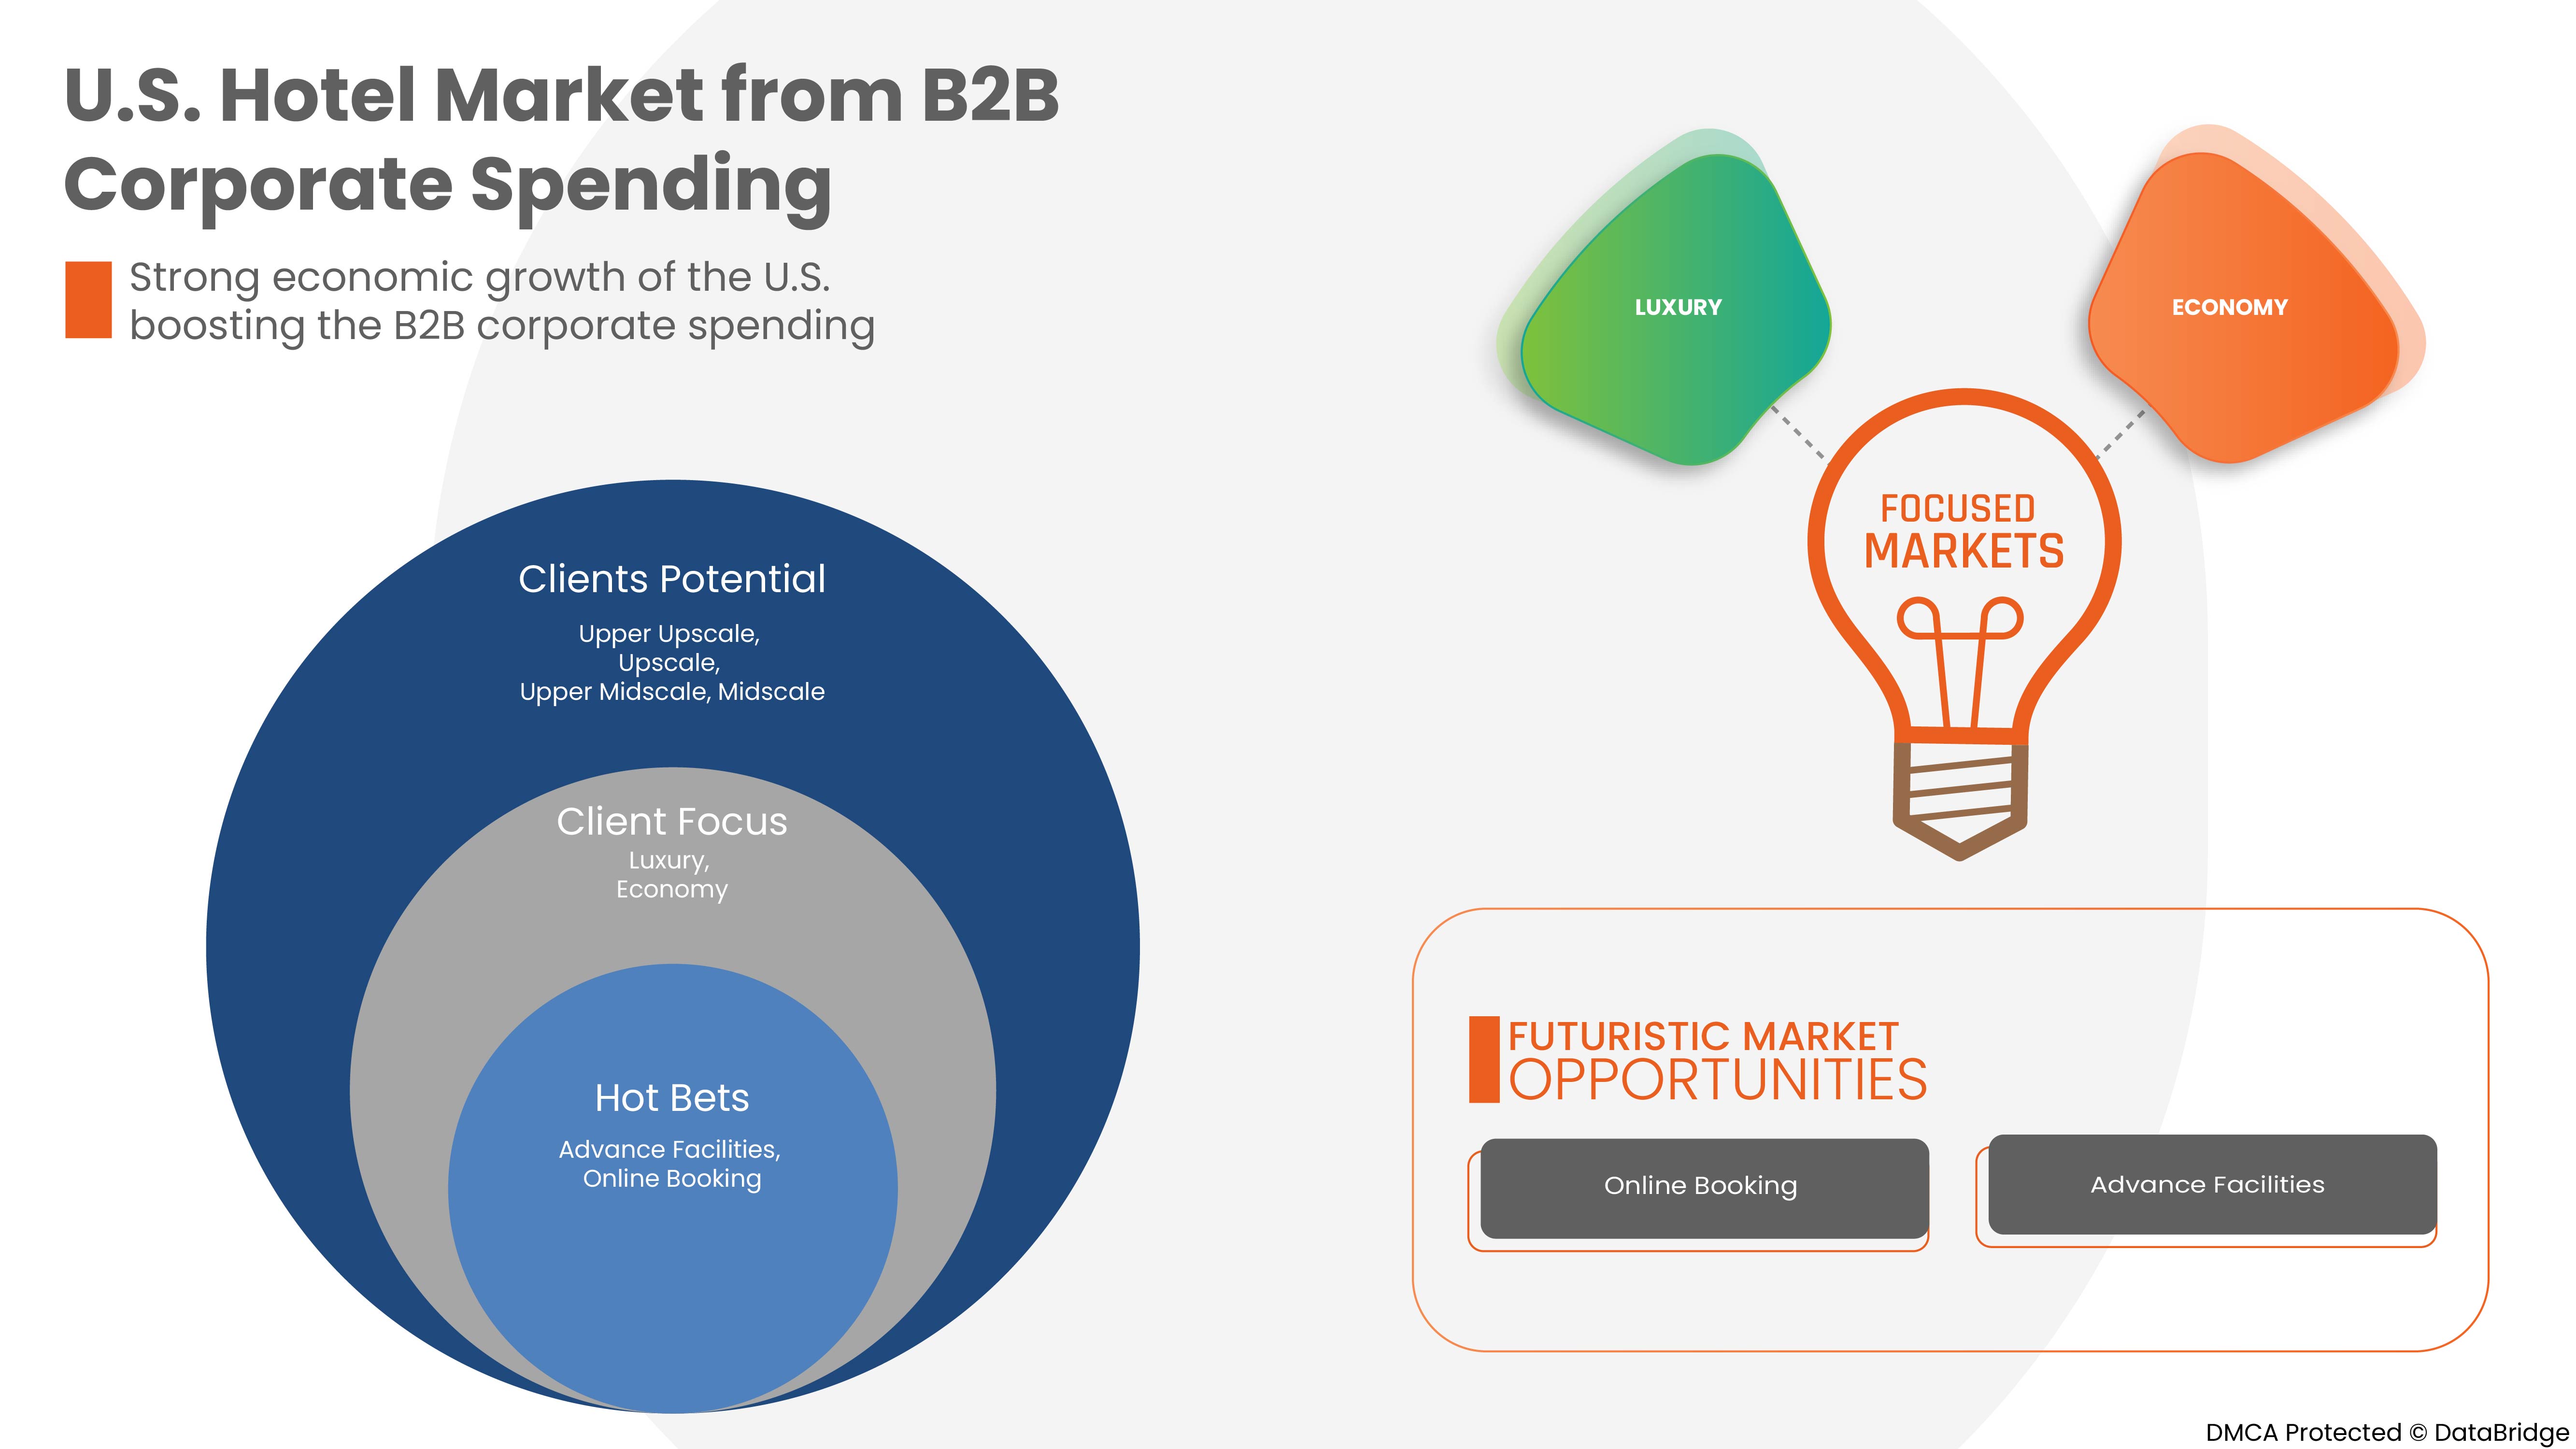
With the growth in country's economy, every business and startup needs branding and promotion. Therefore, B2B corporate spending in hotels in terms of events is the best platform for them to market their business by sponsoring some entertainment event shows like live music events, sports events and many more. Companies across the region are increasingly looking to introduce new products and technology to the market to gain a higher competitive edge. This results in various trade shows, new product launch events, product exhibitions and others on a large scale to facilitate the interaction of potential customers and investors. Due to this, the B2B corporate spending in the hotel industry is experiencing strong growth.
Apart from this, the increasing number of corporate companies in healthcare and IT sector and rising spending on trade shows, conferences and seminars by corporate companies are boosting the market growth.
Opportunity
- Increase in different types of platforms for booking hotel spaces
Travel agencies are one of the most vital distribution channels within hospitality marketing. In recent years, the number of travel agencies has increased enormously. This enables customers to search for travel products or services online rather than going to individual company websites. Therefore, it is of utmost importance to partner up with travel agencies. The presence of a huge variety of booking channels for bookings in the hospitality industry offers a lucrative opportunity for the growth and development of the market.
Restraint/Challenge
- Shifting preference of corporates to online events and digitalization
Hopin has now become a popular platform for conducting events and conferences. Many such companies focus on bridging the gap between live and online events. All such initiatives are estimated to generate huge growth potential in the events industry. However, such initiatives are estimated to limit B2B corporate spending on hotels and negatively affect the market growth as COVID-19 restrictions have forced corporate companies to rely on technology to connect with people to conduct seminars and corporate events. Zoom, a communications platform, has become quite popular in achieving this.
- The outbreak of COVID-19 pandemic has resulted in the cancellation of various corporate events and B2B spending
Given the widespread reduction in corporate and business group spending across the U.S., the hotel industry has been one of the hardest-hit sectors by COVID-19 pandemic. Moreover, chain-managed hotels are the most affected by the COVID-19 pandemic compared to the franchise and independent hotels. The challenges created by COVID-19 impacted almost every part of a hotel's operations, from room occupancy levels and staffing plans to food and beverage provisioning. The pandemic has the potential to have far-reaching effects on the industry, creating a challenge for market growth.
Post COVID-19 Impact on U.S. Hotel Market from B2B Corporate Spending
COVID-19 pandemic badly affected the hospitality industry due to community lockdowns, social distancing, stay-at-home orders, travel and mobility restrictions that resulted in temporary closure of many hospitality businesses and significantly decreased the demand for businesses that were allowed to shut down. Restrictions placed on travel and stay-at-home orders issued by the authorities led to a sharp decline in hotel occupancies and revenues while the hospitality industry is slowly recovering which will increase the market growth.
Recent Development
- In September 2022, Hyatt Hotels Corporation’s Mark Hoplamazian, President and Chief Executive Officer, presented at the Bank of America Securities 2022 Gaming & Lodging Conference in New York, on Thursday, September 8, 2022
U.S. Hotel Market from B2B Corporate Spending Market Scope
The U.S. hotel market from B2B corporate spending is categorized into four notable segments based on chain, domain, sector and booking channel.
The growth amongst these segments will help you analyze major growth segments in the industries and provide the users with a valuable market overview and market insights to make strategic decisions to identify core market applications.
Chain
- Luxury
- Upper Upscale
- Upscale
- Upper Midscale
- Midscale
- Economy
Based on chain, the market is segmented into luxury, upper upscale, upscale, upper midscale, midscale and economy
Domain
- International
- Domestic
Based on domain, the market is segmented into international and domestic
Sector
- BFSI
- Manufacturing
- Healthcare
- ITServices
- Government
- Others
Based on sector, the market is segmented into BFSI, manufacturing, healthcare, IT services, government and others
Booking Channel
- Direct Bookings
- Online Travel Agencies (OTAS)
- Travel Management Companies (TMC)
Based on booking channel, the market is segmented into direct bookings, Online Travel Agencies (OTAS) and Travel Management Companies (TMC)
U.S. Hotel Market from B2B Corporate Spending Country Regional Analysis/Insights
The U.S. hotel market from B2B corporate spending is analyzed and market size insights and trends are provided based on chain, domain, sector and booking channel.
The states covered in this market report are California, Florida, New York, Texas, Illinois, Georgia, Pennsylvania, Ohio and rest of U.S. In 2022, California State is expected to dominate the U.S. hotel market from B2B corporate spending.
The country section of the report also provides individual market impacting factors and changes in market regulation that impact the current and future trends of the market. Data point’s downstream and upstream value chain analysis, technical trends and porter's five forces analysis and case studies are some of the pointers used to forecast the market scenario for individual countries. Also, the presence and availability of U.S. brands and their challenges faced due to large or scarce competition from local and domestic brands, impact of domestic tariffs and trade routes are considered while providing forecast analysis of the country data.
Competitive Landscape and U.S. Hotel Market from B2B Corporate Spending Share Analysis
U.S. hotel market from B2B corporate spending competitive landscape provides details by competitors. Details included are company overview, company financials, revenue generated, market potential, investment in research and development, new market initiatives, production sites and facilities, company strengths and weaknesses, product launch, product trials pipelines, product approvals, patents, product width and breadth, application dominance, technology lifeline curve. The above data points provided are only related to the companies’ focus related to the market.
Some of the prominent participants operating in the market are Marriott International Inc., Hyatt Hotel Corp., Hilton Worldwide Holdings Inc., Wyndham Hotels & Resorts Inc., Radisson Hotel Group MARRIOTT and Rosewood Hotel Group.
Research Methodology
Data collection and base year analysis are done using data collection modules with large sample sizes. The market data is analyzed and estimated using market statistical and coherent models. In addition, market share analysis and key trend analysis are the major success factors in the market report. The key research methodology used by the DBMR research team is data triangulation which involves data mining, analysis of the impact of data variables on the market and primary (industry expert) validation. Apart from this, data models include Vendor Positioning grids, Market Time Line Analysis, Market Overview and Guide, Company Positioning grids, Company Market Share Analysis, Standards of Measurement, U.S. Vs Regional and Vendor Share Analysis. Please request an analyst call in case of further inquiry.
SKU-
Obtenha acesso online ao relatório sobre a primeira nuvem de inteligência de mercado do mundo

- Painel interativo de análise de dados
- Painel de análise da empresa para oportunidades de elevado potencial de crescimento
- Acesso de analista de pesquisa para personalização e customização. consultas
- Análise da concorrência com painel interativo
- Últimas notícias, atualizações e atualizações Análise de tendências
- Aproveite o poder da análise de benchmark para um rastreio abrangente da concorrência
Índice
1 INTRODUÇÃO
1.1 OBJETIVOS DO ESTUDO
1.2 DEFINIÇÃO DE MERCADO
1.3 PANORAMA DO MERCADO HOTELEIRO DOS EUA A PARTIR DOS GASTOS CORPORATIVOS B2B
1.4 LIMITAÇÃO
1,5 MERCADOS COBERTOS
2 SEGMENTAÇÃO DE MERCADO
2.1 MERCADOS COBERTOS
2.2 ÂMBITO GEOGRÁFICO
2,3 ANOS CONSIDERADOS PARA O ESTUDO
2.4 MOEDA E PREÇOS
2.5 MODELO DE VALIDAÇÃO DE DADOS TRIPÉ DBMR
2.6 CURVA DA LINHA DE VIDA DA CORRENTE
2.7 MODELAÇÃO MULTIVARIADA
2.8 ENTREVISTAS PRINCIPAIS COM PRINCIPAIS LÍDERES DE OPINIÃO
2.9 MATRIZ DE DESAFIOS DE MERCADO DE DBMR
2.1 FONTES SECUNDÁRIAS
2.11 PREMISSAS
3 RESUMO EXECUTIVO
4 INSIGHTS PREMIUM
4.1 PANORAMA GERAL: GASTOS DE LAZER NOS EUA PELOS CONSUMIDORES
4.2 COBERTURA REGULAMENTAR
4.3 MERCADO HOTELEIRO DOS EUA A PARTIR DOS GASTOS CORPORATIVOS B2B: CENÁRIO DA EMPRESA
4.3.1 ANÁLISE DAS AÇÕES DA EMPRESA: EUA
4.4 ANÁLISE DA PARTICIPAÇÃO DA MARCA NO MERCADO HOTÉLICO DOS EUA, 2021, (%)
4.4.1 MARRIOTT
4.4.2 HYATT
4.4.3 HILTON
4.4.4 WYNDHAM
4.4.5 RADISSON
4.4.6 JACARANDÁ
4.5 DESENVOLVIMENTO RECENTE E ESTRATÉGIAS DE MARCA
4.5.1 HYATT
4.5.2 RADDISON
4.5.3 MARRIOTT
4.5.4 HOTÉIS E RESORTS FOUR SEASONS
4.5.5 HILTON
4.5.6 HOTÉIS WYNDHAM
4.6 TENDÊNCIAS/RESPOSTAS DOS CONSUMIDORES
4.7 MERCADO HOTÉLICO DOS EUA, ANÁLISE DE MERCADO
5 MERCADO HOTELEIRO DOS EUA: SEGMENTO DE LUXO, ANÁLISE DE PARTICIPAÇÃO DA MARCA, 2021, (%)
6 MERCADO DE HOTÉIS DOS EUA EM GASTOS CORPORATIVOS B2B, POR REDE
6.1 VISÃO GERAL
6.2 DE ALTO NÍVEL
6.3 SUPERIOR DE ALTO NÍVEL
6.4 ESCALA MÉDIA SUPERIOR
6.5 MIDSCALE
6.6 ECONOMIA
6.7 LUXO
6.7.1 INTERNACIONAL
6.7.2 DOMÉSTICO
6.7.2.1 SERVIÇOS DE INFORMÁTICA
6.7.2.2 BFSI
6.7.2.3 FABRICAÇÃO
6.7.2.4 ASSISTÊNCIA MÉDICA
6.7.2.5 GOVERNO
6.7.2.6 OUTROS
6.7.2.6.1 RESERVAS DIRETAS
6.7.2.6.2 AGÊNCIAS DE VIAGENS ONLINE (OTAS)
6.7.2.6.3 EMPRESAS DE GESTÃO DE VIAGENS (TMC)
7 MERCADO HOTÉLICO DOS EUA EM GASTOS CORPORATIVOS B2B, POR DOMÍNIO
7.1 VISÃO GERAL
7.2 INTERNACIONAL
7.3 DOMÉSTICO
8 MERCADO HOTÉLICO DOS EUA EM DESPESAS CORPORATIVAS B2B, POR SETOR
8.1 VISÃO GERAL
8.2 SERVIÇOS DE INFORMÁTICA
8.3 BFSI
8.4 FABRICAÇÃO
8.5 SAÚDE
8.6 GOVERNO
8.7 OUTROS
9 MERCADO HOTÉLICO DOS EUA EM GASTOS CORPORATIVOS B2B, POR CANAL DE RESERVAS
9.1 VISÃO GERAL
9.2 RESERVAS DIRETAS
9.3 AGÊNCIAS DE VIAGENS ONLINE (OTAS)
9.4 EMPRESAS DE GESTÃO DE VIAGENS (TMC)
10 MERCADOS HOTÉIS DOS EUA EM GASTOS CORPORATIVOS B2B, POR ESTADO
10.1 CALIFÓRNIA
10.2 FLÓRIDA
10.3 NOVA IORQUE
10.4 TEXAS
10,5 ILLINOIS
10.6 GEÓRGIA
10.7 PENSILVÂNIA
10,8 OHIO
10.9 RESTO DE NÓS
11 Análise SWOT
12 QUESTIONÁRIO
13 RELATÓRIOS RELACIONADOS
Lista de Tabela
QUADRO 1 QUADRO REGULAMENTAR
QUADRO 2 MERCADO HOTÉLICO DOS EUA EM RELAÇÃO AOS DESPESAS CORPORATIVOS B2B, POR REDE, 2018-2029 (US$ MILHÕES)
QUADRO 3 MERCADO HOTÉLICO DOS EUA EM RELAÇÃO AOS GASTOS CORPORATIVOS B2B, POR DOMÍNIO, 2018-2029 (US$ MILHÕES)
QUADRO 4 MERCADO HOTELEIRO DOS EUA EM DESPESAS CORPORATIVAS B2B, POR SETOR, 2018-2029 (US$ MILHÕES)
QUADRO 5 MERCADO HOTELEIRO DOS EUA EM DESPESAS CORPORATIVAS B2B, POR CANAL DE RESERVAS, 2018-2029 (US$ MILHÕES)
QUADRO 6 MERCADO HOTELEIRO DOS EUA EM RELAÇÃO AOS GASTOS CORPORATIVOS B2B, POR DOMÍNIO, 2018-2029 (US$ MILHÕES)
QUADRO 7 MERCADO HOTELEIRO DOS EUA EM DESPESAS CORPORATIVAS B2B, POR SETOR, 2018-2029 (US$ MILHÕES)
QUADRO 8 MERCADO HOTELEIRO DOS EUA EM DESPESAS CORPORATIVAS B2B, POR CANAL DE RESERVAS, 2018-2029 (US$ MILHÕES)
QUADRO 9 MERCADO HOTELEIRO DOS EUA A PARTIR DOS GASTOS CORPORATIVOS B2B, POR ESTADO, 2018-2029 (US$ MILHÕES)
QUADRO 10 MERCADO HOTÉLICO DA CALIFÓRNIA EM DESPESAS CORPORATIVAS B2B, POR REDE, 2018-2029 (US$ MILHÕES)
QUADRO 11 LUXO DA CALIFÓRNIA NO MERCADO HOTELEIRO A PARTIR DOS GASTOS CORPORATIVOS B2B, POR DOMÍNIO, 2018-2029 (US$ MILHÕES)
QUADRO 12 LUXO DA CALIFÓRNIA NO MERCADO HOTELEIRO A PARTIR DOS GASTOS CORPORATIVOS B2B, POR SETOR, 2018-2029 (US$ MILHÕES)
QUADRO 13 LUXO DA CALIFÓRNIA NO MERCADO HOTELEIRO A PARTIR DOS GASTOS CORPORATIVOS B2B, POR CANAL DE RESERVAS, 2018-2029 (US$ MILHÕES)
QUADRO 14 MERCADO HOTÉLICO DA CALIFÓRNIA EM DESPESAS CORPORATIVAS B2B, POR DOMÍNIO, 2018-2029 (US$ MILHÕES)
QUADRO 15 MERCADO HOTÉLICO DA CALIFÓRNIA A PARTIR DOS GASTOS CORPORATIVOS B2B, POR SETOR, 2018-2029 (US$ MILHÕES)
QUADRO 16 MERCADO HOTÉLICO DA CALIFÓRNIA EM GASTOS CORPORATIVOS B2B, POR CANAL DE RESERVAS, 2018-2029 (US$ MILHÕES)
QUADRO 17 MERCADO HOTÉLICO DA FLORIDA EM DESPESAS CORPORATIVAS B2B, POR REDE, 2018-2029 (US$ MILHÕES)
QUADRO 18 LUXO DA FLORIDA NO MERCADO HOTELEIRO, SEGUNDO OS GASTOS CORPORATIVOS B2B, POR DOMÍNIO, 2018-2029 (US$ MILHÕES)
QUADRO 19 LUXO DA FLORIDA NO MERCADO HOTELEIRO A PARTIR DOS GASTOS CORPORATIVOS B2B, POR SETOR, 2018-2029 (US$ MILHÕES)
QUADRO 20 LUXO DA FLORIDA NO MERCADO HOTELEIRO, SEGUNDO OS GASTOS CORPORATIVOS B2B, POR CANAL DE RESERVAS, 2018-2029 (US$ MILHÕES)
QUADRO 21 MERCADO HOTÉLICO DA FLORIDA EM GASTOS CORPORATIVOS B2B, POR DOMÍNIO, 2018-2029 (US$ MILHÕES)
QUADRO 22 MERCADO HOTÉLICO DA FLORIDA EM GASTOS CORPORATIVOS B2B, POR SETOR, 2018-2029 (US$ MILHÕES)
QUADRO 23 MERCADO HOTELEIRO DA FLORIDA EM DESPESAS CORPORATIVAS B2B, POR CANAL DE RESERVAS, 2018-2029 (US$ MILHÕES)
QUADRO 24 MERCADO HOTÉLICO DE NOVA IORQUE EM RELAÇÃO AOS GASTOS CORPORATIVOS B2B, POR REDE, 2018-2029 (US$ MILHÕES)
QUADRO 25 LUXO EM NOVA IORQUE NO MERCADO HOTELEIRO, SEGUNDO OS GASTOS CORPORATIVOS B2B, POR DOMÍNIO, 2018-2029 (US$ MILHÕES)
QUADRO 26 LUXO EM NOVA IORQUE NO MERCADO HOTELEIRO A PARTIR DOS GASTOS CORPORATIVOS B2B, POR SETOR, 2018-2029 (US$ MILHÕES)
QUADRO 27 LUXO EM NOVA IORQUE NO MERCADO HOTELEIRO A PARTIR DOS GASTOS CORPORATIVOS B2B, POR CANAL DE RESERVAS, 2018-2029 (US$ MILHÕES)
QUADRO 28 MERCADO HOTÉLICO DE NOVA IORQUE, SEGUNDO OS GASTOS CORPORATIVOS B2B, POR DOMÍNIO, 2018-2029 (US$ MILHÕES)
QUADRO 29 MERCADO HOTÉLICO DE NOVA IORQUE EM GASTOS CORPORATIVOS B2B, POR SETOR, 2018-2029 (US$ MILHÕES)
QUADRO 30 MERCADO HOTÉLICO DE NOVA IORQUE EM DESPESAS CORPORATIVAS B2B, POR CANAL DE RESERVAS, 2018-2029 (US$ MILHÕES)
QUADRO 31 MERCADO HOTÉLICO DO TEXAS EM DESPESAS CORPORATIVAS B2B, POR REDE, 2018-2029 (US$ MILHÕES)
QUADRO 32 LUXO NO TEXAS NO MERCADO HOTELEIRO A PARTIR DOS GASTOS CORPORATIVOS B2B, POR DOMÍNIO, 2018-2029 (US$ MILHÕES)
QUADRO 33 LUXO NO TEXAS NO MERCADO HOTELEIRO A PARTIR DOS GASTOS CORPORATIVOS B2B, POR SETOR, 2018-2029 (US$ MILHÕES)
QUADRO 34 LUXO NO TEXAS NO MERCADO HOTELEIRO A PARTIR DOS GASTOS CORPORATIVOS B2B, POR CANAL DE RESERVAS, 2018-2029 (US$ MILHÕES)
QUADRO 35 MERCADO HOTÉLICO DO TEXAS EM GASTOS CORPORATIVOS B2B, POR DOMÍNIO, 2018-2029 (US$ MILHÕES)
QUADRO 36 MERCADO HOTÉLICO DO TEXAS EM GASTOS CORPORATIVOS B2B, POR SETOR, 2018-2029 (US$ MILHÕES)
QUADRO 37 MERCADO HOTELEIRO DO TEXAS EM GASTOS CORPORATIVOS B2B, POR CANAL DE RESERVAS, 2018-2029 (US$ MILHÕES)
QUADRO 38 MERCADO HOTÉLICO DE ILLINOIS EM GASTOS CORPORATIVOS B2B, POR REDE, 2018-2029 (US$ MILHÕES)
QUADRO 39 LUXO DE ILLINOIS NO MERCADO HOTELARIA A PARTIR DOS GASTOS CORPORATIVOS B2B, POR DOMÍNIO, 2018-2029 (US$ MILHÕES)
QUADRO 40 LUXO DE ILLINOIS NO MERCADO HOTELEIRO A PARTIR DOS GASTOS CORPORATIVOS B2B, POR SETOR, 2018-2029 (US$ MILHÕES)
QUADRO 41 LUXO EM ILLINOIS NO MERCADO HOTELEIRO A PARTIR DOS GASTOS CORPORATIVOS B2B, POR CANAL DE RESERVAS, 2018-2029 (US$ MILHÕES)
QUADRO 42 MERCADO HOTÉLICO DE ILLINOIS, SEGUNDO OS GASTOS CORPORATIVOS B2B, POR DOMÍNIO, 2018-2029 (US$ MILHÕES)
QUADRO 43 MERCADO HOTÉLICO DE ILLINOIS EM GASTOS CORPORATIVOS B2B, POR SETOR, 2018-2029 (US$ MILHÕES)
QUADRO 44 MERCADO HOTELEIRO DE ILLINOIS EM DESPESAS CORPORATIVAS B2B, POR CANAL DE RESERVAS, 2018-2029 (US$ MILHÕES)
QUADRO 45 MERCADO HOTÉLICO DA GEÓRGIA EM GASTOS CORPORATIVOS B2B, POR REDE, 2018-2029 (US$ MILHÕES)
QUADRO 46 LUXO NA GEÓRGIA NO MERCADO HOTELEIRO A PARTIR DOS GASTOS CORPORATIVOS B2B, POR DOMÍNIO, 2018-2029 (US$ MILHÕES)
QUADRO 47 LUXO NA GEÓRGIA NO MERCADO HOTELEIRO A PARTIR DOS GASTOS CORPORATIVOS B2B, POR SETOR, 2018-2029 (US$ MILHÕES)
QUADRO 48: LUXO NA GEÓRGIA NO MERCADO HOTELEIRO, A PARTIR DOS GASTOS CORPORATIVOS B2B, POR CANAL DE RESERVAS, 2018-2029 (US$ MILHÕES)
QUADRO 49 MERCADO HOTÉLICO DA GEÓRGIA EM GASTOS CORPORATIVOS B2B, POR DOMÍNIO, 2018-2029 (US$ MILHÕES)
QUADRO 50 MERCADO HOTELEIRO DA GEÓRGIA EM DESPESAS CORPORATIVAS B2B, POR SETOR, 2018-2029 (US$ MILHÕES)
QUADRO 51 MERCADO HOTELEIRO DA GEÓRGIA EM DESPESAS CORPORATIVAS B2B, POR CANAL DE RESERVAS, 2018-2029 (US$ MILHÕES)
QUADRO 52 MERCADO HOTÉLICO DA PENSILVÂNIA EM GASTOS CORPORATIVOS B2B, POR REDE, 2018-2029 (US$ MILHÕES)
QUADRO 53 LUXO NA PENSILVÂNIA NO MERCADO HOTELEIRO A PARTIR DOS GASTOS CORPORATIVOS B2B, POR DOMÍNIO, 2018-2029 (US$ MILHÕES)
QUADRO 54 LUXO NA PENSILVÂNIA NO MERCADO HOTELEIRO A PARTIR DOS GASTOS CORPORATIVOS B2B, POR SETOR, 2018-2029 (US$ MILHÕES)
QUADRO 55 LUXO DA PENSILVÂNIA NO MERCADO HOTELEIRO A PARTIR DOS GASTOS CORPORATIVOS B2B, POR CANAL DE RESERVAS, 2018-2029 (US$ MILHÕES)
QUADRO 56 MERCADO HOTÉLICO DA PENSILVÂNIA EM RELAÇÃO AOS DESPESAS CORPORATIVOS B2B, POR DOMÍNIO, 2018-2029 (US$ MILHÕES)
QUADRO 57 MERCADO HOTÉLICO DA PENSILVÂNIA, SEGUNDO OS GASTOS CORPORATIVOS B2B, POR SETOR, 2018-2029 (US$ MILHÕES)
QUADRO 58 MERCADO HOTÉLICO DA PENSILVÂNIA EM RELAÇÃO À DESPESA CORPORATIVA B2B, POR CANAL DE RESERVAS, 2018-2029 (US$ MILHÕES)
QUADRO 59 MERCADO HOTÉLICO DE OHIO EM DESPESAS CORPORATIVAS B2B, POR REDE, 2018-2029 (US$ MILHÕES)
QUADRO 60 LUXO DE OHIO NO MERCADO HOTELEIRO A PARTIR DOS GASTOS CORPORATIVOS B2B, POR DOMÍNIO, 2018-2029 (US$ MILHÕES)
QUADRO 61 LUXO DE OHIO NO MERCADO HOTELEIRO A PARTIR DOS GASTOS CORPORATIVOS B2B, POR SETOR, 2018-2029 (US$ MILHÕES)
QUADRO 62 LUXO DE OHIO NO MERCADO HOTELEIRO A PARTIR DOS GASTOS CORPORATIVOS B2B, POR CANAL DE RESERVAS, 2018-2029 (US$ MILHÕES)
QUADRO 63 MERCADO HOTÉLICO DE OHIO, SEGUNDO OS GASTOS CORPORATIVOS B2B, POR DOMÍNIO, 2018-2029 (US$ MILHÕES)
QUADRO 64 MERCADO HOTÉLICO DE OHIO, SEGUNDO OS GASTOS CORPORATIVOS B2B, POR SETOR, 2018-2029 (US$ MILHÕES)
QUADRO 65 MERCADO HOTELEIRO DE OHIO EM DESPESAS CORPORATIVAS B2B, POR CANAL DE RESERVAS, 2018-2029 (US$ MILHÕES)
QUADRO 66 RESTANTE DO MERCADO HOTELEIRO DOS EUA, SEGUNDO OS GASTOS CORPORATIVOS B2B, POR REDE, 2018-2029 (US$ MILHÕES)
Lista de Figura
FIGURA 1 MERCADO HOTÉLICO DOS EUA EM RELAÇÃO AOS GASTOS CORPORATIVOS B2B: SEGMENTAÇÃO
FIGURA 2 MERCADO HOTELEIRO DOS EUA A PARTIR DOS GASTOS CORPORATIVOS B2B: TRIANGULAÇÃO DE DADOS
FIGURA 3 MERCADO HOTÉLICO DOS EUA A PARTIR DOS GASTOS CORPORATIVOS B2B: ANÁLISE DROC
FIGURA 4 MERCADO HOTÉLICO DOS EUA A PARTIR DOS GASTOS CORPORATIVOS B2B: ANÁLISE DO MERCADO DOS EUA
FIGURA 5 MERCADO HOTÉLICO DOS EUA A PARTIR DOS GASTOS CORPORATIVOS B2B: ANÁLISE DE PESQUISA DA EMPRESA
FIGURA 6 MERCADO HOTÉLICO DOS EUA A PARTIR DOS GASTOS CORPORATIVOS B2B: A CURVA DA LINHA DE VIDA DA CADEIA
FIGURA 7 MERCADO HOTÉLICO DOS EUA A PARTIR DOS GASTOS CORPORATIVOS B2B: MODELAÇÃO MULTIVARIADA
FIGURA 8 MERCADO HOTELEIRO DOS EUA EM RELAÇÃO AOS GASTOS CORPORATIVOS B2B: DEMOGRAFIA DA ENTREVISTA
FIGURA 9 MERCADO HOTELEIRO DOS EUA A PARTIR DOS GASTOS CORPORATIVOS B2B: A MATRIZ DO DESAFIO DO MERCADO
FIGURA 10 MERCADO HOTÉLICO DOS EUA EM RELAÇÃO AOS GASTOS CORPORATIVOS B2B: SEGMENTAÇÃO
FIGURA 11 FORTE CRESCIMENTO ECONÓMICO NOS EUA, IMPULSIONANDO OS GASTOS CORPORATIVOS B2B, DEVE IMPULSIONAR O MERCADO HOTÉLICO NOS EUA A PARTIR DOS GASTOS CORPORATIVOS B2B NO PERÍODO PREVISTO
FIGURA 12 O SEGMENTO DE ALTO NÍVEL DEVE SER REPRESENTADO PELA MAIOR PARCIALIDADE DO MERCADO HOTELEIRO DOS EUA EM FUNÇÕES DOS GASTOS CORPORATIVOS B2B EM 2022 E 2029
FIGURA 13 MERCADO HOTÉLICO DOS EUA EM GASTOS CORPORATIVOS B2B: PARTICIPAÇÃO DA EMPRESA EM 2021 (%)
FIGURA 14 MARRIOTT: ANÁLISE DA MARCA
FIGURA 15 MARRIOTT: SELECIONE O SEGMENTO
FIGURA 16 MARRIOTT: SEGMENTO PREMIUM
FIGURA 17 MARRIOTT: SEGMENTO DE LUXO
FIGURA 18 HYATT: ANÁLISE DA MARCA
FIGURA 19 HYATT: ALTO-ALTO
FIGURA 20 HYATT: SOFISTICADO
FIGURA 21 HYATT: LUXO
FIGURA 22 HILTON: ANÁLISE DE MARCA
FIGURA 23 HILTON: ALTO-ALTO
FIGURA 24 HILTON: DE ALTO NÍVEL
FIGURA 25 HILTON: LUXO
FIGURA 26 WYNDHAM: ANÁLISE DE MARCA
FIGURA 27 WYNDHAM: ECONOMIA
FIGURA 28 WYNDHAM: ESCALA MÉDIA
FIGURA 29 WYNDHAM: SOFISTICADO
FIGURA 30 WYNDHAM: ESTILO DE VIDA
FIGURA 31 WYNDHAM: ESTADIA PROLONGADA
FIGURA 32 RADISSON: ANÁLISE DE MARCA
FIGURA 33 RADISSON: SUPERIOR DE ALTO NÍVEL
FIGURA 34 RADISSON: DE ALTO NÍVEL
FIGURA 35 RADISSON: ESCALA MÉDIA
FIGURA 36 RADISSON: LUXO
FIGURA 37 ROSEWOOD: ANÁLISE DA MARCA
FIGURA 38 MERCADO HOTELEIRO DOS EUA (USD MIL MILHÕES)
FIGURA 39 HOTÉIS DE LUXO: ANÁLISE DE MARCA
FIGURA 40 MERCADO HOTÉLICO DOS EUA EM RELAÇÃO AOS GASTOS CORPORATIVOS B2B: POR REDE, 2021
FIGURA 41 MERCADO HOTÉLICO DOS EUA A PARTIR DOS GASTOS CORPORATIVOS B2B: POR DOMÍNIO, 2021
FIGURA 42 MERCADO HOTELEIRO DOS EUA A PARTIR DOS GASTOS CORPORATIVOS B2B: POR SETOR, 2021
FIGURA 43 MERCADO HOTELEIRO DOS EUA A PARTIR DOS GASTOS CORPORATIVOS B2B: POR CANAL DE RESERVAS, 2021
FIGURA 44 MERCADO HOTELEIRO DOS EUA A PARTIR DOS GASTOS CORPORATIVOS B2B: RESUMO (2021)
FIGURA 45 MERCADO HOTELEIRO DOS EUA A PARTIR DOS GASTOS CORPORATIVOS B2B: POR ESTADO (2021)
FIGURA 46 MERCADO HOTELEIRO DOS EUA A PARTIR DOS GASTOS CORPORATIVOS B2B: POR ESTADO (2022 E 2029)
FIGURA 47 MERCADO HOTÉLICO DOS EUA A PARTIR DOS GASTOS CORPORATIVOS B2B: POR ESTADO (2021 E 2029)
FIGURA 48 MERCADO HOTELEIRO DOS EUA EM RELAÇÃO AOS GASTOS CORPORATIVOS B2B: POR REDE (2022-2029)
Metodologia de Investigação
A recolha de dados e a análise do ano base são feitas através de módulos de recolha de dados com amostras grandes. A etapa inclui a obtenção de informações de mercado ou dados relacionados através de diversas fontes e estratégias. Inclui examinar e planear antecipadamente todos os dados adquiridos no passado. Da mesma forma, envolve o exame de inconsistências de informação observadas em diferentes fontes de informação. Os dados de mercado são analisados e estimados utilizando modelos estatísticos e coerentes de mercado. Além disso, a análise da quota de mercado e a análise das principais tendências são os principais fatores de sucesso no relatório de mercado. Para saber mais, solicite uma chamada de analista ou abra a sua consulta.
A principal metodologia de investigação utilizada pela equipa de investigação do DBMR é a triangulação de dados que envolve a mineração de dados, a análise do impacto das variáveis de dados no mercado e a validação primária (especialista do setor). Os modelos de dados incluem grelha de posicionamento de fornecedores, análise da linha de tempo do mercado, visão geral e guia de mercado, grelha de posicionamento da empresa, análise de patentes, análise de preços, análise da quota de mercado da empresa, normas de medição, análise global versus regional e de participação dos fornecedores. Para saber mais sobre a metodologia de investigação, faça uma consulta para falar com os nossos especialistas do setor.
Personalização disponível
A Data Bridge Market Research é líder em investigação formativa avançada. Orgulhamo-nos de servir os nossos clientes novos e existentes com dados e análises que correspondem e atendem aos seus objetivos. O relatório pode ser personalizado para incluir análise de tendências de preços de marcas-alvo, compreensão do mercado para países adicionais (solicite a lista de países), dados de resultados de ensaios clínicos, revisão de literatura, mercado remodelado e análise de base de produtos . A análise de mercado dos concorrentes-alvo pode ser analisada desde análises baseadas em tecnologia até estratégias de carteira de mercado. Podemos adicionar quantos concorrentes necessitar de dados no formato e estilo de dados que procura. A nossa equipa de analistas também pode fornecer dados em tabelas dinâmicas de ficheiros Excel em bruto (livro de factos) ou pode ajudá-lo a criar apresentações a partir dos conjuntos de dados disponíveis no relatório.

