U.S. Leather Furniture Market, By Category (Full Grain, Top Grain, Genuine, Bicast, Bonded and Synthetic), Finish (Aniline, Semi-Aniline, Brush-Colored, Degrained, Die-Cut, Embossed, Handworked, Metallic, Nappa, Nubuck, Oily, Patent, Suede, Waxy and Others), Product (Sofa, Chair, Bean Bags, Corner Sofa, Recliner, Stool, Ottoman, Pouf, Table, Foot Stools and Others), Distribution Channel (E-Commerce, B2B, Third Party Distributors and Others), Application (Residential and Commercial) -Industry Trends and Forecast to 2029
Market Analysis and Size
Leather is the most durable type and is used in the majority of furniture upholstery. Leather furniture is widely used to bring aesthetics to the space. It is considered as luxurious goods and display people class and standard. Leather furniture is more robust than cotton or fabrics furniture and can last for years. The leather furniture can be cleaned quickly with a wipe and dusting, which increases its demand in the market.
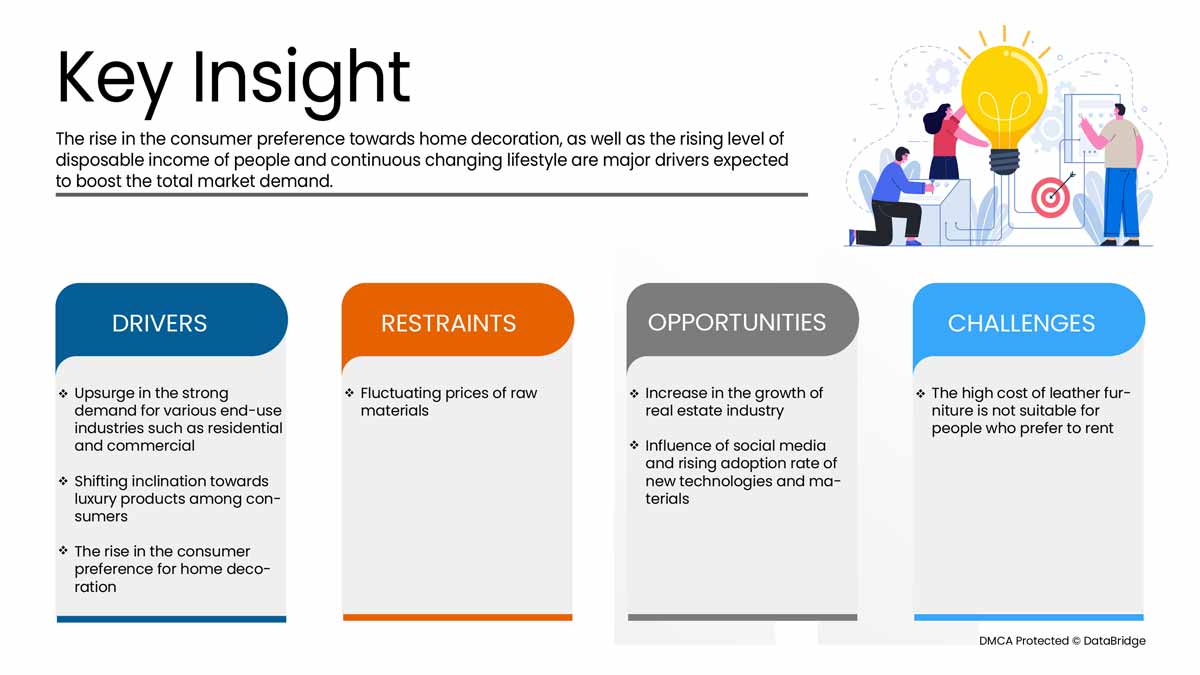
The rise in the consumer preference for home decoration, the increasing disposable income of people, and the continuously changing lifestyle are expected to drive the demand for the U.S. leather furniture market. However, the fluctuating prices of raw materials may further restrict the market's growth.
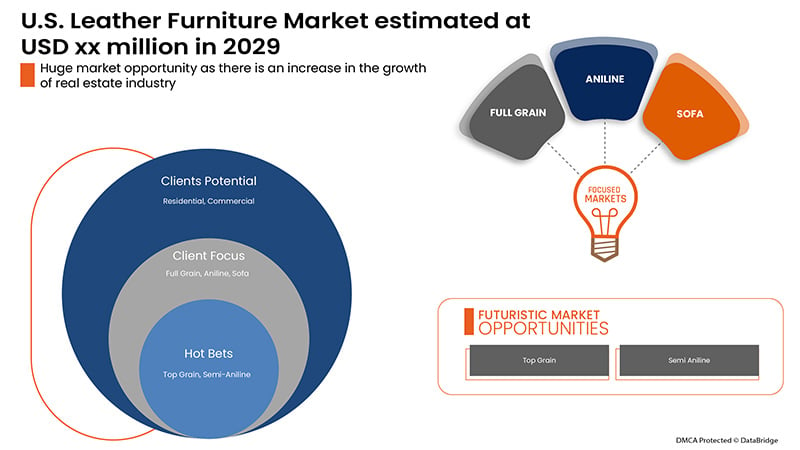
Several boosters, such as an increase in the growth of the real estate industry, the influence of social media, and the rising adoption rate of new technologies and materials, are expected to create opportunities for the U.S. leather furniture market. However, the high cost of leather furniture is unsuitable for people who prefer to rent and is likely to challenge the market's growth during the forecast period.
Data Bridge Market Research analyses that the U.S. leather furniture market is expected to reach USD 13,383.68 million by 2029, at a CAGR of 7.3% during the forecast period. “Residential" accounts for the most prominent application segment in the respective market, owing to the rise in the real estate industry. The market report curated by the Data Bridge Market Research team includes in-depth expert analysis, import/export analysis, pricing analysis, production consumption analysis, and climate chain scenario.
|
Report Metric |
Details |
|
Forecast Period |
2022 to 2029 |
|
Base Year |
2021 |
|
Historic Years |
2020 (Customizable to 2019 - 2014) |
|
Quantitative Units |
Revenue in USD Million, Volume in Units, Pricing in USD |
|
Segments Covered |
By Category (Full Grain, Top Grain, Genuine, Bicast, Bonded and Synthetic), Finish (Aniline, Semi-Aniline, Brush-Colored, Degrained, Die-Cut, Embossed, Handworked, Metallic, Nappa, Nubuck, Oily, Patent, Suede, Waxy and Others), Product (Sofa, Chair, Bean Bags, Corner Sofa, Recliner, Stool, Ottoman, Pouf, Table, Foot Stools and Others), Distribution Channel (E-Commerce, B2B, Third Party Distributors and Others), Application (Residential and Commercial) |
|
Country Covered |
U.S. |
|
Market Players Covered |
Norwalk, Rowe Furniture, NELLA VETRINA, DOMICILE FURNITURE, among others |
Market Definition
Leather furniture is synthetic furniture that involves chairs, sofas, bean bags, recliners, tables, poufs, and stools, among others. They are in high demand due to increasing consumer preference for home decoration with the proper furniture. They are considered luxury furniture. Luxury furniture comprises moveable parts that display the best of exceptional craftsmanship and design from a specific era. High-quality leather furniture retains its shape and appearance for many years.
Regulatory Framework
- According to Federal Trade Commission 16 CFR Part 24, the leather guides address misrepresentations about the composition and characteristics of certain leather and imitation leather products and state that disclosure of non-leather content should be made for material that appears to be, but is not, leather.
Market Dynamics of the U.S. Leather Furniture Market Include:
Drivers/Opportunities
- The rise in the consumer preference for home decoration
People believe that home décor increases their values, aspirations, and tastes. Bringing aesthetics to the home or office makes it personally, mentally, and aesthetically pleasing. Improving aesthetics for homes, offices, and other areas includes renovations; adding mirrors, furniture, and more can add life to the space or area and is soothing to the eyes and mind. It helps to change the bad mood and give a sense of calmness and relaxation, which is considered one of the key reasons for being practically healthy and as an add-on for aesthetic purposes. Therefore, growing awareness regarding home décor and home furnishing is expected to boost the market over the coming years.
- The rising level of disposable income of people and continuous changing lifestyle
The increased consumer disposable income and urbanization have resulted in a high cost of living in megacities. Thus, the concept of sharing living spaces came to light, increasing the demand for space-saving ideas such as leather furniture. Thus, the increased standard of living owing to increased consumer disposable income and urbanization is projected to augment the U.S. leather furniture market.
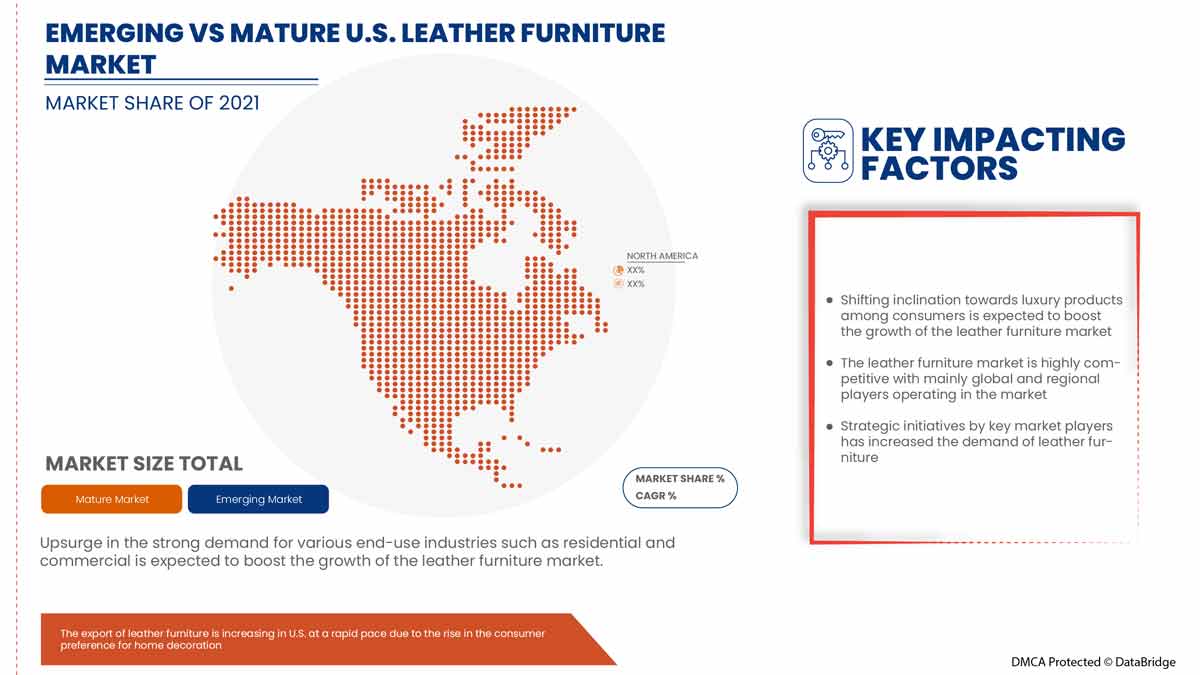
- Shifting inclination towards luxury products among consumers
People are very conscious when buying luxurious products or furniture for their homes. They tend to go for quality and comfort irrespective of their saving and income. Due to several benefits of buying luxurious furniture, people purchasing decision improves. People give utmost importance to the color, shape, fabric, and finishing of the furniture for their living room, kitchen, bedroom, or even the backyard. High-end luxury furnishings give timeless appeal to the home. With the help of professional advice, people get better advice regarding the furniture suitable for their space.
- Upsurge in the strong demand for various end-use industries such as residential and commercial
The residential and commercial industries strategically use leather furniture to provide improved decor. In most cases, leather furniture or moving leather furniture is disguised as a stylish cabinet in a small meeting room, which can be pulled down when needed resulting in increased space for several purposes. Increased construction activities in various end-use industries, such as residential and commercial, will give growth opportunities to the furniture industry. The increase in the installation of leather furniture in these industries is expected to boost the market.
Restraints/Challenges
- Fluctuating prices of raw materials
Companies find it difficult to correctly judge the risk of large fluctuations in raw material costs. If they only minimally, delay, or too conservatively transfer the increase in cost, or if the increase in raw material costs and the decrease in sales prices occur at the same time, then the decline in profitability is inevitable. Highly fluctuating raw material costs and ineffective price management can seriously jeopardize the success of enterprises. Moreover, increased global trade, urbanization, transportation needs, and fluctuating market trends put further pressure on the cost of the intermediaries required for furniture manufacturing. Therefore, changes in the costs of producing raw materials may act as restraining factors for the market.
- High cost of leather furniture is not suitable for people who are renting
Some people prefer shifting their leather furniture when they shift houses, but the process is tedious and may require a team of workers, costing them a good amount. In addition, customized leather furniture is made according to the space available in the apartment. Not every apartment will have the same space and height, which may make it harder to shift leather furniture. Therefore, most of the people who live on rent do not prefer buying leather furniture as it is not easy to shift leather furniture without paying extra shifting, dismantling, and installing costs. Thus, leather furniture is not suitable for people who are renting. Considering the high living cost, the majority of the people prefer to live in rented or shared apartments to split costs. Hence, this acts as a challenge for the market.
COVID-19 had a Minimal Impact on U.S. Leather Furniture Market
COVID-19 impacted various manufacturing industries in the year 2020-2021 as it led to the closure of workplaces, disruption of supply chains, and restrictions on transportation. However, no significant impact was noticed on their leather furniture U.S. operations and supply chain, as the import and export of vaccines and essential goods led to the increasing demand for leather furniture. This growing demand from consumers increases the growth of the U.S. leather furniture market.
Recent Development
- In September 2021, Norwalk introduced six highly durable and stylish leather upholstery collections at the upcoming Las Vegas market. This will help the company to increase its brand value and customers across Las Vegas.
U.S. Leather Furniture Market Scope
The U.S. leather furniture market is segmented based on category, finish, product, distribution channel and application. The growth amongst these segments will help you analyze meager growth segments in the industries and provide the users with a valuable market overview and market insights to help them make strategic decisions for identifying core market applications.
Category
- Full Grain
- Top Grain
- Genuine
- Bicast
- Bonded
- Synthetic
On the basis of category, the U.S. leather furniture market is segmented into full grain, top grain, genuine, bicast, bonded and synthetic.
Finish
- Aniline
- Semi-Aniline
- Brush-Colored
- Degrained
- Die-Cut
- Embossed
- Handworked
- Metallic
- Nappa
- Nubuck
- Oily
- Patent
- Suede
- Waxy
- Others
On the basis of finish, the U.S. leather furniture market is segmented into aniline, semi-aniline, brush-colored, degrained, die-cut, embossed, handworked, metallic, nappa, nubuck, oily, patent, suede, waxy and others.
Product
- Sofa
- Chair
- Bean Bags
- Corner Sofa
- Recliner
- Stool
- Ottoman
- Pouf
- Table
- Foot Stools
- Others
On the basis of product, the U.S. leather furniture market is segmented into sofa, chair, bean bags, corner sofa, recliner, stool, ottoman, pouf, table, foot stools and others.
Distribution Channel
- E-Commerce
- B2B
- Third Party Distributors
- Others
On the basis of distribution channel, the U.S. leather furniture market is segmented into e-commerce, B2B, third party distributors and others.
Application
- Residential
- Commercial
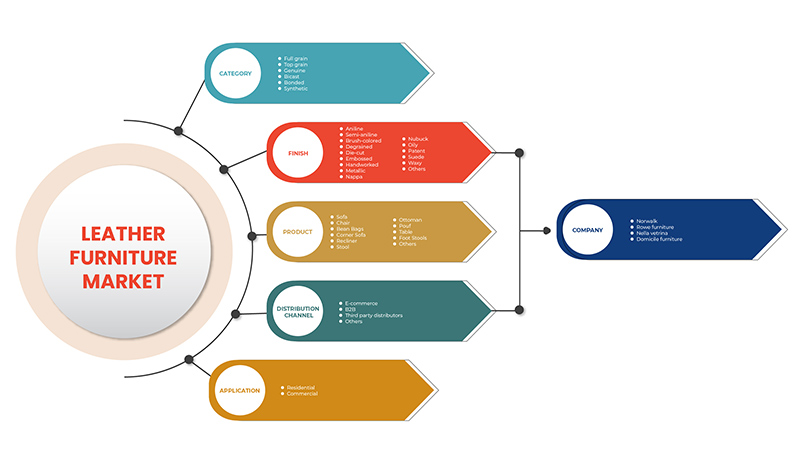
On the basis of application, the U.S. leather furniture market is segmented into residential and commercial.
Competitive Landscape and U.S. Leather Furniture Market Share Analysis
The U.S. leather furniture market's competitive landscape provides competitors' details. Details include company overview, company financials, revenue generated, market potential, investment in research and development, new market initiatives, U.S. presence, production sites and facilities, production capacities, company strengths and weaknesses, product launch, product width and breadth, application dominance. The above data points provided are only related to the companies focus on the U.S. leather furniture market.
Some major players operating in the U.S. leather furniture market are Norwalk, Rowe Furniture, NELLA VETRINA, DOMICILE FURNITURE, among others.
SKU-
Obtenha acesso online ao relatório sobre a primeira nuvem de inteligência de mercado do mundo

- Painel interativo de análise de dados
- Painel de análise da empresa para oportunidades de elevado potencial de crescimento
- Acesso de analista de pesquisa para personalização e customização. consultas
- Análise da concorrência com painel interativo
- Últimas notícias, atualizações e atualizações Análise de tendências
- Aproveite o poder da análise de benchmark para um rastreio abrangente da concorrência
Metodologia de Investigação
A recolha de dados e a análise do ano base são feitas através de módulos de recolha de dados com amostras grandes. A etapa inclui a obtenção de informações de mercado ou dados relacionados através de diversas fontes e estratégias. Inclui examinar e planear antecipadamente todos os dados adquiridos no passado. Da mesma forma, envolve o exame de inconsistências de informação observadas em diferentes fontes de informação. Os dados de mercado são analisados e estimados utilizando modelos estatísticos e coerentes de mercado. Além disso, a análise da quota de mercado e a análise das principais tendências são os principais fatores de sucesso no relatório de mercado. Para saber mais, solicite uma chamada de analista ou abra a sua consulta.
A principal metodologia de investigação utilizada pela equipa de investigação do DBMR é a triangulação de dados que envolve a mineração de dados, a análise do impacto das variáveis de dados no mercado e a validação primária (especialista do setor). Os modelos de dados incluem grelha de posicionamento de fornecedores, análise da linha de tempo do mercado, visão geral e guia de mercado, grelha de posicionamento da empresa, análise de patentes, análise de preços, análise da quota de mercado da empresa, normas de medição, análise global versus regional e de participação dos fornecedores. Para saber mais sobre a metodologia de investigação, faça uma consulta para falar com os nossos especialistas do setor.
Personalização disponível
A Data Bridge Market Research é líder em investigação formativa avançada. Orgulhamo-nos de servir os nossos clientes novos e existentes com dados e análises que correspondem e atendem aos seus objetivos. O relatório pode ser personalizado para incluir análise de tendências de preços de marcas-alvo, compreensão do mercado para países adicionais (solicite a lista de países), dados de resultados de ensaios clínicos, revisão de literatura, mercado remodelado e análise de base de produtos . A análise de mercado dos concorrentes-alvo pode ser analisada desde análises baseadas em tecnologia até estratégias de carteira de mercado. Podemos adicionar quantos concorrentes necessitar de dados no formato e estilo de dados que procura. A nossa equipa de analistas também pode fornecer dados em tabelas dinâmicas de ficheiros Excel em bruto (livro de factos) ou pode ajudá-lo a criar apresentações a partir dos conjuntos de dados disponíveis no relatório.

