亞太地區靜電除塵器市場規模、份額和趨勢分析報告-產業概況和2032年預測

请求目录 请求目录 与分析师交谈 与分析师交谈 免费样本报告 免费样本报告 购买前请咨询 提前咨询 立即购买 立即购买

亞太地區靜電除塵器市場規模、份額和趨勢分析報告-產業概況和2032年預測

  • Semiconductors and Electronics
  • Upcoming Report
  • Jan 2024
  • Asia-Pacific
  • 350 页面
  • 桌子數: 220
  • 图号: 60

通过敏捷供应链咨询解决关税挑战

供应链生态系统分析现已成为 DBMR 报告的一部分

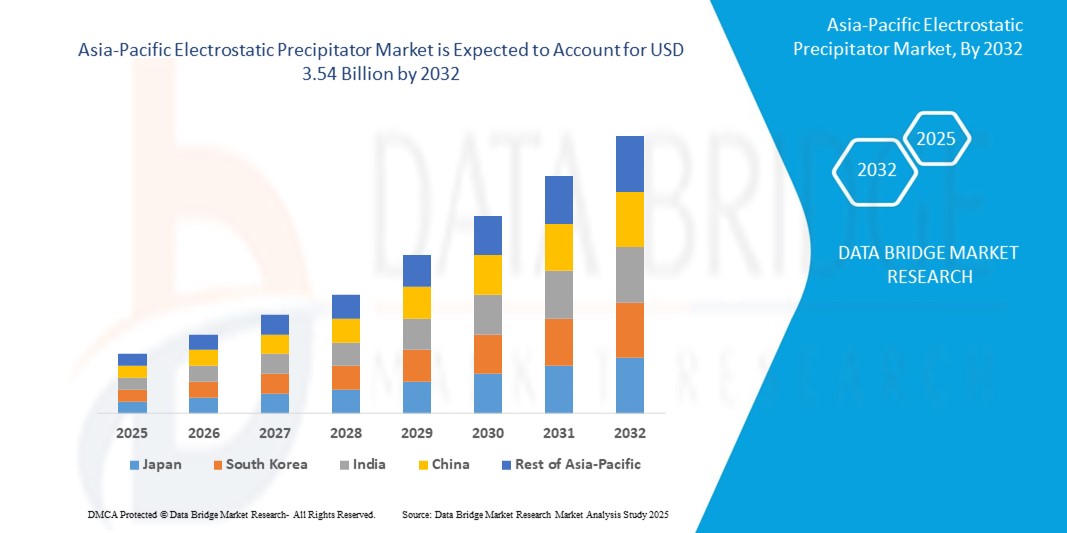
Asia Pacific Electrostatic Precipitator Market

市场规模(十亿美元)

CAGR :  % Diagram

Chart Image USD 2.29 Billion USD 3.54 Billion 2024 2032
Diagram Forecast Period
2025 –2032
Diagram Market Size (Base Year)
USD 2.29 Billion
Diagram Market Size (Forecast Year)
USD 3.54 Billion
Diagram CAGR
%
Diagram Major Markets Players
  • General Electric
  • S.A HAMON
  • Thermax Limited
  • Sumitomo Heavy IndustriesLtd
  • Fujian Longking Co.Ltd.

亞太靜電集塵器市場細分,按類型(乾式 ESP 和濕式 ESP)、產品(硬體、軟體和服務)、應用(燃煤發電、電弧爐、燃氣渦輪機、固體廢棄物焚化爐、工業電力等)、最終用戶(發電、金屬加工、水泥、製造、化學、石油化工、船舶等)- 產業趨勢和預測至 2032 年 2032 年

靜電集塵器市場

亞太地區靜電除塵器市場規模

  • 2024 年亞太地區靜電除塵器市場規模為22.9 億美元 ,預計 到 2032 年將達到 35.4 億美元,預測期內 複合年增長率為 5.60%。
  • 市場成長主要得益於各主要經濟體加強空氣污染控制法規、發電和水泥製造等工業基礎設施的擴張,以及政府更加重視減少顆粒物排放,以改善整個地區的公共衛生和環境質量
  • 此外,民眾對空氣污染對健康影響的認識不斷提高,以及印度、中國和東南亞等新興經濟體越來越多地採用先進的排放控制技術,大大加速了市場的成長軌跡

亞太地區靜電除塵器市場分析

  • 由於發電和水泥製造等工業領域對先進空氣過濾的需求不斷增加,亞太地區靜電除塵器市場正在穩步成長
  • 各製造部門對污染控制系統現代化的投資正在推動該地區靜電除塵器的持續採用
  • 受中國大規模工業運營、不斷增長的能源需求以及嚴格的空氣品質控制政策的推動,中國將在 2024 年佔據亞太靜電除塵器市場的最大市場收入份額
  • 由於日本擁有嚴格的環境法規、高度重視清潔技術,並持續推出採用節能低排放設備對工業設施進行現代化改造的舉措,預計日本將成為亞太地區靜電除塵器市場中複合年增長率 (CAGR) 最高的國家。
  • 乾式靜電集塵器 (ESP) 細分市場佔據市場主導地位,2024 年收入份額最高,達到 68.5%,這得益於其在發電廠、水泥窯和鋼廠等高溫工業應用中的廣泛應用。乾式靜電集塵器無需用水即可有效去除煙氣中的細顆粒物,從而最大限度地減少了廢物處理問題並降低了維護成本。煤炭能源生產對高效能顆粒物控制的強勁需求將持續支撐該細分市場的成長。

報告範圍和亞太靜電除塵器市場細分       

屬性

亞太靜電集塵器關鍵市場洞察

涵蓋的領域

  • 依類型:乾式靜電集塵器和濕式靜電集塵器
  • 依產品:硬體、軟體和服務
  • 依應用:燃煤發電、電弧爐、燃氣渦輪機、固體廢棄物焚化爐、工業電力等
  • 依最終用戶分類:發電、金屬加工、水泥、製造、化學、石油化學、船舶等

覆蓋國家

亞太

  • 中國
  • 日本
  • 印度
  • 韓國
  • 新加坡
  • 馬來西亞
  • 澳洲
  • 泰國
  • 印尼
  • 菲律賓
  • 亞太其他地區 

主要市場參與者

市場機會

• 為滿足排放標準,船舶和鐵路部門的使用量不斷增加
• 電力和工業基礎設施的投資不斷增加

加值資料資訊集

除了對市場價值、成長率、細分、地理覆蓋範圍和主要參與者等市場情景的洞察之外,Data Bridge Market Research 策劃的市場報告還包括深入的專家分析、按地理位置表示的公司生產和產能、分銷商和合作夥伴的網絡佈局、詳細和更新的價格趨勢分析以及供應鏈和需求的缺口分析。

亞太地區靜電除塵器市場趨勢

“工業應用日益轉向混合靜電除塵器”

  • 混合靜電除塵器 (ESP) 整合了靜電和機械過濾方法,因其能夠有效去除超細顆粒而越來越受到人們的採用
    • 例如,印度發電廠安裝的混合靜電除塵器在 PM2.5 捕集方面表現出顯著改善
  • 由於排放量龐大,水泥和火力發電等產業對混合型靜電除塵器的需求正在激增。東南亞的主要水泥製造商已開始升級為混合型靜電除塵器,以符合新的排放限值。
  • 即使工廠產量波動,混合系統也能提供更一致的顆粒去除效果,使其成為運作負載可變的設施的理想選擇
  • 中國和印度等國家製定了更嚴格的空氣品質法規,促使各行業採用混合 ESP 等先進解決方案,以維持合規
  • 該地區的各行各業都在投資採用混合動力技術來改造舊式靜電除塵器,以提高效率並滿足不斷變化的環境標準

亞太靜電集塵器市場動態

司機

“加大監管壓力,遏止工業空氣污染”

  • 亞太地區靜電除塵器市場主要受到中國、印度和印尼等快速發展中國家加大工業空氣污染控制力道的推動
  • 中國的「藍天保衛戰」和印度的國家清潔空氣計畫(NCAP)等監管框架要求高污染產業安裝包括靜電除塵器在內的先進排放控制技術
  • 發電、水泥、金屬加工和化學等行業面臨越來越大的壓力,需要升級過濾系統以滿足排放標準並避免監管處罰
  • 對能夠捕獲超細顆粒物(PM2.5 及更小)的系統的需求不斷增長,正在加速在公共和私人設施中部署高效 ESP
  • 環境永續承諾和 ESG 目標正在促使企業投資清潔技術,而國內 ESP 製造商正在擴大產品範圍以滿足區域需求並降低成本障礙

克制/挑戰

“高昂的資本和維護成本阻礙了採用”

  • 靜電集塵器 (ESP) 系統的高資本成本仍然是亞太市場面臨的關鍵挑戰,特別是對於成本敏感型和中小型產業
  • ESP,尤其是先進或混合型號,需要在高壓電源裝置、放電電極和複雜的控制系統等組件上進行大量投資,這會增加初始採購成本
  • 儘管有環保要求,發展中經濟體的中小企業往往難以證明這些費用的合理性,從而導致抵製或推遲採用
  • 由於需要熟練的勞動力、定期的系統維護以及更換電極等關鍵零件,營運成本進一步上升,尤其是在鋼鐵或水泥製造等高粉塵應用中
  • 在電力基礎設施不穩定的地區,不穩定的電力供應可能會影響 ESP 的性能和使用壽命,這促使一些行業選擇更便宜的替代品,例如袋式除塵器,這些替代品更易於維護,但隨著時間的推移,其顆粒去除效率較低

亞太靜電集塵器市場範圍

亞太地區靜電集塵器市場根據類型、產品、應用和最終用戶進行細分。

  • 按類型

根據類型,亞太地區靜電除塵器市場分為乾式靜電集塵器和濕式靜電集塵器。乾式靜電集塵器佔據市場主導地位,2024年其收入份額最高,達到68.5%,這得益於其在發電廠、水泥窯和鋼廠等高溫工業應用中的廣泛應用。乾式靜電集塵器無需用水即可有效去除煙氣中的細顆粒物,從而最大限度地減少了廢物處理問題並降低了維護成本。煤炭能源生產對高效能顆粒物控制的強勁需求將持續支撐該細分市場的成長。

預計濕式靜電集塵器 (ESP) 市場將在 2025 年至 2032 年間實現最快增長,這得益於其適用於垃圾焚燒、金屬精煉和化學品製造等行業處理粘性或潮濕顆粒。濕式靜電集塵器在捕捉亞微米顆粒、酸霧和煙霧方面性能卓越,從而滿足該地區嚴格的排放法規要求。

  • 透過提供

根據產品類型,亞太地區靜電除塵器市場細分為硬體、軟體和服務。 2024年,硬體市場佔據了最大的收入份額,這得益於能源和工業領域靜電除塵器裝置的持續部署。使用先進的硬體解決方案替換老化的ESP基礎設施的需求日益增長,這進一步加速了市場的成長。

預計服務業將在 2025 年至 2032 年間實現最快的成長率,這得益於定期維護、改造和性能優化的需求不斷增長,以確保符合排放標準並延長設備使用壽命。

  • 按應用

根據應用領域,亞太地區靜電除塵器市場細分為燃煤發電、電弧爐、燃氣渦輪機、固體廢棄物焚化爐、工業電力及其他。由於中國和印度等國家擁有大量營運的火力發電廠,燃煤發電領域在2024年佔據主導地位。靜電除塵器在減少這些電廠的粒狀物排放方面發揮著至關重要的作用,符合區域污染控制法規。

預計固體廢棄物焚化爐領域將在2025年至2032年期間實現最快成長,這得益於都市化進程加快以及對高效能廢棄物能源解決方案日益增長的需求。隨著各國政府加強對清潔焚化技術的投資,對高性能靜電除塵器系統的需求正穩定成長。

  • 按最終用戶

根據最終用戶,亞太地區靜電除塵器市場細分為發電、金屬加工、水泥、製造、化學、石化、船舶及其他。 2024年,發電業佔據了最大的市場份額,因為該行業依賴靜電除塵器來減少燃煤能源生產設施的顆粒物排放。嚴格的排放監管框架正在鼓勵公用事業公司升級或安裝高效的靜電除塵器系統。

預計2025年至2032年,化學工業將迎來最快的成長速度,這得益於對清潔生產方法和污染控制的日益重視。化工廠正在採用靜電除塵器(ESP)來控制細懸浮微粒、酸霧和製程蒸汽的排放,以配合該地區不斷變化的環境政策。

亞太地區靜電除塵器市場區域分析

  • 受中國大規模工業運營、不斷增長的能源需求以及嚴格的空氣品質控制政策的推動,中國將在 2024 年佔據亞太靜電除塵器市場的最大市場收入份額
  • 中國政府大力推動清潔空氣計劃,減少工業排放,推動了靜電除塵器在水泥、金屬和發電行業的廣泛應用
  • 國內主要製造商的入駐以及正在進行的基礎設施建設項目進一步擴大了需求。此外,人們對空氣污染健康影響的認識不斷提高,也促使公私部門加快採用。

日本靜電集塵器市場洞察

由於日本嚴格的環保合規標準以及對節能清潔工業實踐的重視,預計日本靜電除塵器市場將在2025年至2032年間實現最快成長。作為一個技術驅動型國家,日本正致力於透過先進的排放控制系統實現工業基礎設施的現代化。該國正轉向環保生產,尤其是在發電和製造業領域,這為市場擴張提供了支持。此外,政府支持的減少顆粒物排放的舉措以及對現有發電廠改造的投資,也對日本市場靜電除塵器的採用產生了積極影響。

亞太地區靜電除塵器市場佔有率

亞太地區靜電除塵器產業主要由知名公司主導,其中包括:

  • Thermax有限公司(印度)
  • 住友重工業株式會社(日本)
  • 福建龍淨環保股份有限公司 (中國)
  • 三菱動力有限公司(日本)
  • KC Cottrell(韓國)
  • KLEAN(韓國)
  • 印度重型電器有限公司(印度)
  • Pennar Industries Limited(印度)


SKU-

Get online access to the report on the World's First Market Intelligence Cloud

  • Interactive Data Analysis Dashboard
  • Company Analysis Dashboard for high growth potential opportunities
  • Research Analyst Access for customization & queries
  • Competitor Analysis with Interactive dashboard
  • Latest News, Updates & Trend analysis
  • Harness the Power of Benchmark Analysis for Comprehensive Competitor Tracking
Request for Demo

目录

  1. introduction
    1. OBJECTIVES OF THE STUDY
    2. MARKET DEFINITION
    3. OVERVIEW OF Asia-Pacific electrostatic precipitator market
    4. Currency and Pricing
    5. LIMITATIONS
    6. MARKETS COVERED
  2. MARKET SEGMENTATION
    1. MARKETS COVERED
    2. geographicAL scope
    3. years considered for the study
    4. DBMR TRIPOD DATA VALIDATION MODEL
    5. primary interviews with key opinion leaders
    6. DBMR MARKET POSITION GRID
    7. vendor share analysis
    8. MARKET type COVERAGE GRID
    9. Multivariate Modeling
    10. type timeline curve
    11. secondary sourcEs
    12. assumptions
  3. EXECUTIVE SUMMARY
  4. premium insights
  5. market overview
    1. DRIVERS
      1. Increasing Construction activities across the globe
      2. TECHNOLOGICAL ADVANCEMENTS IN EMISSION CONTROL SOLUTIONS
      3. INCREASING ELECTRICITY DEMAND ACROSS EMERGING NATIONS ON ACCOUNT OF RAPID URBANIZATION
    2. RESTRAINTS
      1. Stringent government regulations
      2. HIGH INSTALLATION COST OF ESP
    3. OPPORTUNITIES
      1. STRATEGIC ALLIANCES And PARTNERSHIPS BETWEEN ORGANIZATIONS
      2. RISE IN INITIATIVES OF POLLUTION CONTROL PROGRAMS BY GOVERNMENT
      3. EXTENSIVE R&D INVESTMENT BY THE GOVERNMENT
    4. CHALLENGES
      1. LACK OF AWARENESS ABOUT THE EMISSION CONTROL SYSTEM
      2. Operational challenges and Malfunction of the device
      3. unfavorable economic conditions and the advent of alternate energy sources
  6. IMPACT ANALYSIS OF COVID-19 ON THE MARKET
    1. AFTERMATH OF ELECTROSTATIC PRECIPITATOR MARKET
    2. OPPORTUNITIES FOR THE MARKET AFTER COVID-19 PANDEMIC
    3. IMPACT ON SUPPLY, DEMAND, AND PRICE
    4. CONCLUSION
  7. ASIA-PACIFIC ELECTROSTATIC PRECIPITATOR MARKET, BY TYPE
    1. overview
    2. DRY ESP
    3. wet esp
  8. ASIA-PACIFIC ELECTROSTATIC PRECIPITATOR MARKET, BY OFFERING
    1. overview
    2. HARDWARE & SOFTWARE
      1. DISCHARGE ELECTRODES
      2. HIGH VOLTAGE ELECTRICAL SYSTEMS
      3. COLLECTION ELECTRODES
      4. RAPPERS
      5. HoPPERS
      6. SHELL
      7. Others
    3. SERVICES
  9. ASIA-PACIFIC ELECTROSTATIC PRECIPITATOR MARKET, BY APPLICATION
    1. overview
    2. COAL FIRED GENERATION
    3. Electric Arc Furnaces
    4. GAS TURBINES
    5. INDUSTRIAL POWER
    6. Solid-Waste Incinerators
    7. OTHERS
  10. ASIA-PACIFIC ELECTROSTATIC PRECIPITATOR MARKET, BY END USER
    1. overview
    2. POWER GENERATION
      1. BY Type
        1. COAL POWER PLANT
        2. PETROLEUM REFINERIES AND POWER PLANTS
      2. BY ESP Type
        1. DRY ESP
        2. WET ESP
    3. METAL PROCESSING
      1. BY Type
        1. IRON & STEEL MANUFACTURING
        2. NONFERROUS METAL PRODUCTION AND PROCESSING
        3. FOUNDRIES
        4. ALUMINIUM SMELTING
      2. BY ESP Type
        1. DRY ESP
        2. WET ESP
    4. CEMENT
      1. BY ESP Type
        1. DRY ESP
        2. WET ESP
    5. chemical & petrochemical
      1. BY Type
        1. BASIC CHEMICAL MANUFACTURES
        2. SPECIALITY CHEMICAL MANUFACTURERS
        3. CONSUMER CHEMICAL MANUFACTURERS
      2. BY ESP Type
        1. DRY ESP
        2. WET ESP
    6. MANUFACTURING
      1. BY ESP Type
        1. DRY ESP
        2. WET ESP
    7. MARINE
      1. BY ESP Type
        1. DRY ESP
        2. WET ESP
    8. OTHERS
  11. ASIA-PACIFIC electrostatic precipitator market, BY Country
    1. China
    2. india
    3. Japan
    4. South Korea
    5. INDONESIA
    6. Australia
    7. Thailand
    8. Malaysia
    9. Philippines
    10. Singapore
    11. Rest of Asia-Pacific
  12. Asia-pacific ELECTROSTATIC PRECIPITATOR market: COMPANY landscape
    1. company share analysis: Asia-pacific
  13. swot analysis
  14. company profile
    1. FUJIAN LONGKING CO., LTD.
      1. COMPANY SNAPSHOT
      2. BUSINESS PORTFOLIO
      3. RECENT DEVELOPMENT
    2. MITSUBISHI POWER, LTD. (A SUBSIDIARY OF MITSUBISHI HEAVY INDUSTRIES, LTD.)
      1. COMPANY SNAPSHOT
      2. REVENUE ANALYSIS
      3. PRODUCT PORTFOLIO
      4. RECENT DEVELOPMENTS
    3. BHARAT HEAVY ELECTRICALS LIMITED
      1. COMPANY SNAPSHOT
      2. REVENUE ANALYSIS
      3. PRODUCT PORTFOLIO
      4. RECENT DEVELOPMENTS
    4. SUMITOMO HEAVY INDUSTRIES, LTD.
      1. COMPANY SNAPSHOT
      2. REVENUE ANALYSIS
      3. PRODUCT PORTFOLIO
      4. RECENT DEVELOPMENTS
    5. GENERAL ELECTRIC
      1. COMPANY SNAPSHOT
      2. REVENUE ANALYSIS
      3. PRODUCT PORTFOLIO
      4. RECENT DEVELOPMENT
    6. BABCOCK & WILCOX ENTERPRISES, INC.
      1. COMPANY SNAPSHOT
      2. REVENUE ANALYSIS
      3. PRODUCT PORTFOLIO
      4. RECENT DEVELOPMENTS
    7. FLSMIDTH
      1. COMPANY SNAPSHOT
      2. REVENUE ANALYSIS
      3. PRODUCT PORTFOLIO
      4. RECENT DEVELOPMENTS
    8. GEA GROUP AKTIENGESELLSCHAFT
      1. COMPANY SNAPSHOT
      2. REVENUE ANALYSIS
      3. PRODUCT PORTFOLIO
      4. RECENT DEVELOPMENT
    9. JOHN WOOD GROUP PLC
      1. COMPANY SNAPSHOT
      2. REVENUE ANALYSIS
      3. PRODUCT PORTFOLIO
      4. RECENT DEVELOPMENT
    10. KC CORTTREL
      1. COMPANY SNAPSHOT
      2. REVENUE ANALYSIS
      3. PRODUCT PORTFOLIO
      4. RECENT DEVELOPMENT
    11. KLEAN
      1. COMPANY SNAPSHOT
      2. PRDOUCT PORTFOLIO
      3. RECENT DEVELOPMENT
    12. PENNAR INDUSTRIES LIMITED
      1. COMPANY SNAPSHOT
      2. REVENUE ANALYSIS
      3. PRODUCT PORTFOLIO
      4. RECENT DEVELOPMENT
    13. SIEMENS ENERGY
      1. COMPANY SNAPSHOT
      2. REVENUE ANALYSIS
      3. PRODUCT PORTFOLIO
      4. RECENT DEVELOPMENTS
    14. S.A HAMON
      1. COMPANY SNAPSHOT
      2. REVENUE ANALYSIS
      3. PRODUCT PORTFOLIO
      4. RECENT DEVELOPMENTS
    15. THERMAX LIMITED
      1. COMPANY SNAPSHOT
      2. REVENUE ANALYSIS
      3. PRODUCT PORTFOLIO
      4. RECENT DEVELOPMENT
  15. questionnaire
  16. related reports

表格列表

TABLE 1 EMISSION STANDARDS FOR COAL-FIRED POWER PLANTS

TABLE 2 Average Cost of The Electrostatic Precipitator In A Power Plant

TABLE 3 Asia-Pacific Electrostatic Precipitator Market, By Type, 2019-2028 (USD THOUSAND)

TABLE 4 ASIA-PACIFIC ELECTROSTATIC PRECIPITATOR MARKET, BY OFFERING, 2019-2028 (USD THOUSAND)

TABLE 5 Asia-Pacific Hardware & Software in Electrostatic Precipitator Market, By Type, 2019-2028 (USD THOUSAND)

TABLE 6 ASIA-PACIFIC ELECTROSTATIC PRECIPITATOR MARKET, BY APPLICATION, 2019-2028 (USD THOUSAND)

TABLE 7 ASIA-PACIFIC ELECTROSTATIC PRECIPITATOR MARKET, BY END USER, 2019-2028 (USD THOUSAND)

TABLE 8 Asia-Pacific Power Generation in Electrostatic Precipitator Market, By Type, 2019-2028 (USD THOUSAND)

TABLE 9 Asia-Pacific Power Generation in Electrostatic Precipitator Market, By ESP Type, 2019-2028 (USD THOUSAND)

TABLE 10 Asia-Pacific METAL PROCESSING in Electrostatic Precipitator Market, By Type, 2019-2028 (USD THOUSAND)

TABLE 11 Asia-Pacific METAL PROCESSING in Electrostatic Precipitator Market, By ESP Type, 2019-2028 (USD THOUSAND)

TABLE 12 Asia-Pacific cement in Electrostatic Precipitator Market, By ESP Type, 2019-2028 (USD THOUSAND)

TABLE 13 Asia-Pacific CHEMICAL & PETROCHEMICAL in Electrostatic Precipitator Market, By Type, 2019-2028 (USD THOUSAND)

TABLE 14 Asia-Pacific CHEMICAL & PETROCHEMICAL in Electrostatic Precipitator Market, By ESP Type, 2019-2028 (USD THOUSAND)

TABLE 15 Asia-Pacific MANUFACTURING in Electrostatic Precipitator Market, By ESP Type, 2019-2028 (USD THOUSAND)

TABLE 16 Asia-Pacific Marine in Electrostatic Precipitator Market, By ESP Type, 2019-2028 (USD THOUSAND)

TABLE 17 Asia-Pacific Electrostatic precipitator Market, By Country, 2019-2028 (USD Thousand)

TABLE 18 CHINA Electrostatic precipitator Market, BY Type, 2019-2028 (USD Thousand)

TABLE 19 CHINA Electrostatic precipitator Market, By Offering, 2019-2028 (USD Thousand)

TABLE 20 China Hardware & Software in Electrostatic Precipitator Market, By Type, 2019-2028 (USD Thousand)

TABLE 21 China Electrostatic Precipitator Market, By Application, 2019-2028 (USD Thousand)

TABLE 22 China Electrostatic Precipitator Market, By End User, 2019-2028 (USD Thousand)

TABLE 23 China Power Generation in Electrostatic Precipitator Market, By Type, 2019-2028 (USD Thousand)

TABLE 24 China Power Generation in Electrostatic Precipitator Market, By ESP Type, 2019-2028 (USD Thousand)

TABLE 25 China Metal Processing in Electrostatic Precipitator Market, By Type, 2019-2028 (USD Thousand)

TABLE 26 China Metal Processing in Electrostatic Precipitator Market, By ESP Type, 2019-2028 (USD Thousand)

TABLE 27 China Cement in Electrostatic Precipitator Market, By ESP Type, 2019-2028 (USD Thousand)

TABLE 28 China Chemical and Petrochemical in Electrostatic Precipitator Market, By Type, 2019-2028 (USD Thousand)

TABLE 29 China Chemical and Petrochemical in Electrostatic Precipitator Market, By ESP Type, 2019-2028 (USD Thousand)

TABLE 30 China Manufacturing in Electrostatic Precipitator Market, By ESP Type, 2019-2028 (USD Thousand)

TABLE 31 China Marine in Electrostatic Precipitator Market, By ESP Type, 2019-2028 (USD Thousand)

TABLE 32 India Electrostatic precipitator Market, BY Type, 2019-2028 (USD Thousand)

TABLE 33 India Electrostatic precipitator Market, By Offering, 2019-2028 (USD Thousand)

TABLE 34 India Hardware & Software in Electrostatic Precipitator Market, By Type, 2019-2028 (USD Thousand)

TABLE 35 India Electrostatic Precipitator Market, By Application, 2019-2028 (USD Thousand)

TABLE 36 India Electrostatic Precipitator Market, By End User, 2019-2028 (USD Thousand)

TABLE 37 India Power Generation in Electrostatic Precipitator Market, By Type, 2019-2028 (USD Thousand)

TABLE 38 India Power Generation in Electrostatic Precipitator Market, By ESP Type, 2019-2028 (USD Thousand)

TABLE 39 India Metal Processing in Electrostatic Precipitator Market, By Type, 2019-2028 (USD Thousand)

TABLE 40 India Metal Processing in Electrostatic Precipitator Market, By ESP Type, 2019-2028 (USD Thousand)

TABLE 41 India Cement in Electrostatic Precipitator Market, By ESP Type, 2019-2028 (USD Thousand)

TABLE 42 India Chemical and Petrochemical in Electrostatic Precipitator Market, By Type, 2019-2028 (USD Thousand)

TABLE 43 India Chemical and Petrochemical in Electrostatic Precipitator Market, By ESP Type, 2019-2028 (USD Thousand)

TABLE 44 India Manufacturing in Electrostatic Precipitator Market, By ESP Type, 2019-2028 (USD Thousand)

TABLE 45 India Marine in Electrostatic Precipitator Market, By ESP Type, 2019-2028 (USD Thousand)

TABLE 46 Japan Electrostatic precipitator Market, BY Type, 2019-2028 (USD Thousand)

TABLE 47 JAPAN Electrostatic precipitator Market, By Offering, 2019-2028 (USD Thousand)

TABLE 48 Japan Hardware & Software in Electrostatic Precipitator Market, By Type, 2019-2028 (USD Thousand)

TABLE 49 Japan Electrostatic Precipitator Market, By Application, 2019-2028 (USD Thousand)

TABLE 50 Japan Electrostatic Precipitator Market, By End User, 2019-2028 (USD Thousand)

TABLE 51 Japan Power Generation in Electrostatic Precipitator Market, By Type, 2019-2028 (USD Thousand)

TABLE 52 Japan Power Generation in Electrostatic Precipitator Market, By ESP Type, 2019-2028 (USD Thousand)

TABLE 53 Japan Metal Processing in Electrostatic Precipitator Market, By Type, 2019-2028 (USD Thousand)

TABLE 54 Japan Metal Processing in Electrostatic Precipitator Market, By ESP Type, 2019-2028 (USD Thousand)

TABLE 55 Japan Cement in Electrostatic Precipitator Market, By ESP Type, 2019-2028 (USD Thousand)

TABLE 56 Japan Chemical and Petrochemical in Electrostatic Precipitator Market, By Type, 2019-2028 (USD Thousand)

TABLE 57 Japan Chemical and Petrochemical in Electrostatic Precipitator Market, By ESP Type, 2019-2028 (USD Thousand)

TABLE 58 Japan Manufacturing in Electrostatic Precipitator Market, By ESP Type, 2019-2028 (USD Thousand)

TABLE 59 Japan Marine in Electrostatic Precipitator Market, By ESP Type, 2019-2028 (USD Thousand)

TABLE 60 SOUTH KOREA Electrostatic precipitator Market, BY Type, 2019-2028 (USD Thousand)

TABLE 61 SOUTH KOREA Electrostatic precipitator Market, By Offering, 2019-2028 (USD Thousand)

TABLE 62 South Korea Hardware & Software in Electrostatic Precipitator Market, By Type, 2019-2028 (USD Thousand)

TABLE 63 South Korea Electrostatic Precipitator Market, By Application, 2019-2028 (USD Thousand)

TABLE 64 South Korea Electrostatic Precipitator Market, By End User, 2019-2028 (USD Thousand)

TABLE 65 South Korea Power Generation in Electrostatic Precipitator Market, By Type, 2019-2028 (USD Thousand)

TABLE 66 South Korea Power Generation in Electrostatic Precipitator Market, By ESP Type, 2019-2028 (USD Thousand)

TABLE 67 South Korea Metal Processing in Electrostatic Precipitator Market, By Type, 2019-2028 (USD Thousand)

TABLE 68 South Korea Metal Processing in Electrostatic Precipitator Market, By ESP Type, 2019-2028 (USD Thousand)

TABLE 69 South Korea Cement in Electrostatic Precipitator Market, By ESP Type, 2019-2028 (USD Thousand)

TABLE 70 South Korea Chemical and Petrochemical in Electrostatic Precipitator Market, By Type, 2019-2028 (USD Thousand)

TABLE 71 South Korea Chemical and Petrochemical in Electrostatic Precipitator Market, By ESP Type, 2019-2028 (USD Thousand)

TABLE 72 South Korea Manufacturing in Electrostatic Precipitator Market, By ESP Type, 2019-2028 (USD Thousand)

TABLE 73 South Korea Marine in Electrostatic Precipitator Market, By ESP Type, 2019-2028 (USD Thousand)

TABLE 74 INDONESIA Electrostatic precipitator Market, BY Type, 2019-2028 (USD Thousand)

TABLE 75 INDONESIA Electrostatic precipitator Market, By Offering, 2019-2028 (USD Thousand)

TABLE 76 Indonesia Hardware & Software in Electrostatic Precipitator Market, By Type, 2019-2028 (USD Thousand)

TABLE 77 Indonesia Electrostatic Precipitator Market, By Application, 2019-2028 (USD Thousand)

TABLE 78 Indonesia Electrostatic Precipitator Market, By End User, 2019-2028 (USD Thousand)

TABLE 79 Indonesia Power Generation in Electrostatic Precipitator Market, By Type, 2019-2028 (USD Thousand)

TABLE 80 Indonesia Power Generation in Electrostatic Precipitator Market, By ESP Type, 2019-2028 (USD Thousand)

TABLE 81 Indonesia Metal Processing in Electrostatic Precipitator Market, By Type, 2019-2028 (USD Thousand)

TABLE 82 Indonesia Metal Processing in Electrostatic Precipitator Market, By ESP Type, 2019-2028 (USD Thousand)

TABLE 83 Indonesia Cement in Electrostatic Precipitator Market, By ESP Type, 2019-2028 (USD Thousand)

TABLE 84 Indonesia Chemical and Petrochemical in Electrostatic Precipitator Market, By Type, 2019-2028 (USD Thousand)

TABLE 85 Indonesia Chemical and Petrochemical in Electrostatic Precipitator Market, By ESP Type, 2019-2028 (USD Thousand)

TABLE 86 Indonesia Manufacturing in Electrostatic Precipitator Market, By ESP Type, 2019-2028 (USD Thousand)

TABLE 87 Indonesia Marine in Electrostatic Precipitator Market, By ESP Type, 2019-2028 (USD Thousand)

TABLE 88 AUSTRALIA Electrostatic precipitator Market, BY Type, 2019-2028 (USD Thousand)

TABLE 89 AUSTRALIA Electrostatic precipitator Market, By Offering, 2019-2028 (USD Thousand)

TABLE 90 Australia Hardware & Software in Electrostatic Precipitator Market, By Type, 2019-2028 (USD Thousand)

TABLE 91 Australia Electrostatic Precipitator Market, By Application, 2019-2028 (USD Thousand)

TABLE 92 Australia Electrostatic Precipitator Market, By End User, 2019-2028 (USD Thousand)

TABLE 93 Australia Power Generation in Electrostatic Precipitator Market, By Type, 2019-2028 (USD Thousand)

TABLE 94 Australia Power Generation in Electrostatic Precipitator Market, By ESP Type, 2019-2028 (USD Thousand)

TABLE 95 Australia Metal Processing in Electrostatic Precipitator Market, By Type, 2019-2028 (USD Thousand)

TABLE 96 Australia Metal Processing in Electrostatic Precipitator Market, By ESP Type, 2019-2028 (USD Thousand)

TABLE 97 Australia Cement in Electrostatic Precipitator Market, By ESP Type, 2019-2028 (USD Thousand)

TABLE 98 Australia Chemical and Petrochemical in Electrostatic Precipitator Market, By Type, 2019-2028 (USD Thousand)

TABLE 99 Australia Chemical and Petrochemical in Electrostatic Precipitator Market, By ESP Type, 2019-2028 (USD Thousand)

TABLE 100 Australia Manufacturing in Electrostatic Precipitator Market, By ESP Type, 2019-2028 (USD Thousand)

TABLE 101 Australia Marine in Electrostatic Precipitator Market, By ESP Type, 2019-2028 (USD Thousand)

TABLE 102 Thailand Electrostatic precipitator Market, BY Type, 2019-2028 (USD Thousand)

TABLE 103 THAILAND Electrostatic precipitator Market, By Offering, 2019-2028 (USD Thousand)

TABLE 104 Thailand Hardware & Software in Electrostatic Precipitator Market, By Type, 2019-2028 (USD Thousand)

TABLE 105 Thailand Electrostatic Precipitator Market, By Application, 2019-2028 (USD Thousand)

TABLE 106 Thailand Electrostatic Precipitator Market, By End User, 2019-2028 (USD Thousand)

TABLE 107 Thailand Power Generation in Electrostatic Precipitator Market, By Type, 2019-2028 (USD Thousand)

TABLE 108 Thailand Power Generation in Electrostatic Precipitator Market, By ESP Type, 2019-2028 (USD Thousand)

TABLE 109 Thailand Metal Processing in Electrostatic Precipitator Market, By Type, 2019-2028 (USD Thousand)

TABLE 110 Thailand Metal Processing in Electrostatic Precipitator Market, By ESP Type, 2019-2028 (USD Thousand)

TABLE 111 Thailand Cement in Electrostatic Precipitator Market, By ESP Type, 2019-2028 (USD Thousand)

TABLE 112 Thailand Chemical and Petrochemical in Electrostatic Precipitator Market, By Type, 2019-2028 (USD Thousand)

TABLE 113 Thailand Chemical and Petrochemical in Electrostatic Precipitator Market, By ESP Type, 2019-2028 (USD Thousand)

TABLE 114 Thailand Manufacturing in Electrostatic Precipitator Market, By ESP Type, 2019-2028 (USD Thousand)

TABLE 115 Thailand Marine in Electrostatic Precipitator Market, By ESP Type, 2019-2028 (USD Thousand)

TABLE 116 Malaysia Electrostatic precipitator Market, BY Type, 2019-2028 (USD Thousand)

TABLE 117 MALAYSIA Electrostatic precipitator Market, By Offering, 2019-2028 (USD Thousand)

TABLE 118 Malaysia Hardware & Software in Electrostatic Precipitator Market, By Type, 2019-2028 (USD Thousand)

TABLE 119 Malaysia Electrostatic Precipitator Market, By Application, 2019-2028 (USD Thousand)

TABLE 120 Malaysia Electrostatic Precipitator Market, By End User, 2019-2028 (USD Thousand)

TABLE 121 Malaysia Power Generation in Electrostatic Precipitator Market, By Type, 2019-2028 (USD Thousand)

TABLE 122 Malaysia Power Generation in Electrostatic Precipitator Market, By ESP Type, 2019-2028 (USD Thousand)

TABLE 123 Malaysia Metal Processing in Electrostatic Precipitator Market, By Type, 2019-2028 (USD Thousand)

TABLE 124 Malaysia Metal Processing in Electrostatic Precipitator Market, By ESP Type, 2019-2028 (USD Thousand)

TABLE 125 Malaysia Cement in Electrostatic Precipitator Market, By ESP Type, 2019-2028 (USD Thousand)

TABLE 126 Malaysia Chemical and Petrochemical in Electrostatic Precipitator Market, By Type, 2019-2028 (USD Thousand)

TABLE 127 Malaysia Chemical and Petrochemical in Electrostatic Precipitator Market, By ESP Type, 2019-2028 (USD Thousand)

TABLE 128 Malaysia Manufacturing in Electrostatic Precipitator Market, By ESP Type, 2019-2028 (USD Thousand)

TABLE 129 Malaysia Marine in Electrostatic Precipitator Market, By ESP Type, 2019-2028 (USD Thousand)

TABLE 130 Philippines Electrostatic precipitator Market, BY Type, 2019-2028 (USD Thousand)

TABLE 131 PHILIPPINES Electrostatic precipitator Market, By Offering, 2019-2028 (USD Thousand)

TABLE 132 Philippines Hardware & Software in Electrostatic Precipitator Market, By Type, 2019-2028 (USD Thousand)

TABLE 133 Philippines Electrostatic Precipitator Market, By Application, 2019-2028 (USD Thousand)

TABLE 134 Philippines Electrostatic Precipitator Market, By End User, 2019-2028 (USD Thousand)

TABLE 135 Philippines Power Generation in Electrostatic Precipitator Market, By Type, 2019-2028 (USD Thousand)

TABLE 136 Philippines Power Generation in Electrostatic Precipitator Market, By ESP Type, 2019-2028 (USD Thousand)

TABLE 137 Philippines Metal Processing in Electrostatic Precipitator Market, By Type, 2019-2028 (USD Thousand)

TABLE 138 Philippines Metal Processing in Electrostatic Precipitator Market, By ESP Type, 2019-2028 (USD Thousand)

TABLE 139 Philippines Cement in Electrostatic Precipitator Market, By ESP Type, 2019-2028 (USD Thousand)

TABLE 140 Philippines Chemical and Petrochemical in Electrostatic Precipitator Market, By Type, 2019-2028 (USD Thousand)

TABLE 141 Philippines Chemical and Petrochemical in Electrostatic Precipitator Market, By ESP Type, 2019-2028 (USD Thousand)

TABLE 142 Philippines Manufacturing in Electrostatic Precipitator Market, By ESP Type, 2019-2028 (USD Thousand)

TABLE 143 Philippines Marine in Electrostatic Precipitator Market, By ESP Type, 2019-2028 (USD Thousand)

TABLE 144 Singapore Electrostatic precipitator Market, BY Type, 2019-2028 (USD Thousand)

TABLE 145 SINGAPORE Electrostatic precipitator Market, By Offering, 2019-2028 (USD Thousand)

TABLE 146 Singapore Hardware & Software in Electrostatic Precipitator Market, By Type, 2019-2028 (USD Thousand)

TABLE 147 Singapore Electrostatic Precipitator Market, By Application, 2019-2028 (USD Thousand)

TABLE 148 Singapore Electrostatic Precipitator Market, By End User, 2019-2028 (USD Thousand)

TABLE 149 Singapore Power Generation in Electrostatic Precipitator Market, By Type, 2019-2028 (USD Thousand)

TABLE 150 Singapore Power Generation in Electrostatic Precipitator Market, By ESP Type, 2019-2028 (USD Thousand)

TABLE 151 Singapore Metal Processing in Electrostatic Precipitator Market, By Type, 2019-2028 (USD Thousand)

TABLE 152 Singapore Metal Processing in Electrostatic Precipitator Market, By ESP Type, 2019-2028 (USD Thousand)

TABLE 153 Singapore Cement in Electrostatic Precipitator Market, By ESP Type, 2019-2028 (USD Thousand)

TABLE 154 Singapore Chemical and Petrochemical in Electrostatic Precipitator Market, By Type, 2019-2028 (USD Thousand)

TABLE 155 Singapore Chemical and Petrochemical in Electrostatic Precipitator Market, By ESP Type, 2019-2028 (USD Thousand)

TABLE 156 Singapore Manufacturing in Electrostatic Precipitator Market, By ESP Type, 2019-2028 (USD Thousand)

TABLE 157 Singapore Marine in Electrostatic Precipitator Market, By ESP Type, 2019-2028 (USD Thousand)

TABLE 158 Rest of Asia-Pacific Electrostatic precipitator Market, BY Type, 2019-2028 (USD Thousand)

图片列表

FIGURE 1 ASIA-PACIFIC ELECTROSTATIC PRECIPItatoR MARKET segmentation

FIGURE 2 Asia-Pacific electrostatic precipitator market: data triangulation

FIGURE 3 Asia-Pacific electrostatic precipitator market: DROC ANALYSIS

FIGURE 4 Asia-Pacific electrostatic precipitator market: REGIONAL vs Country MARKET ANALYSIS

FIGURE 5 Asia-Pacific electrostatic precipitator market: COMPANY RESEARCH ANALYSIS

FIGURE 6 Asia-Pacific electrostatic precipitator market: INTERVIEW DEMOGRAPHICS

FIGURE 7 Asia-Pacific electrostatic precipitator market: DBMR MARKET POSITION GRID

FIGURE 8 Asia-Pacific electrostatic precipitator market: vendor share analysis

FIGURE 9 Asia-Pacific electrostatic precipitator market: TYPE COVERAGE GRID

FIGURE 10 Asia-Pacific electrostatic precipitator market segmentation

FIGURE 11 Increasing construction activities across the globe is EXPECTED TO DRIVE THE Asia-Pacific electrostatic precipitator market THE FORECAST PERIOD OF 2021 TO 2028

FIGURE 12 DRY ESP segment is expected to account for the largest share of THE Asia-Pacific electrostatic precipitator market 2021 & 2028

FIGURE 13 DRIVERS, RESTRAINTs, OPPORTUNITIES, and CHALLENGES FOR ASIA-PACIFIC ELECTROSTATIC PRECIPITATOR MARKET

FIGURE 14 ENERGY-RELATED CARBON DIOXIDE EMISSIONS FROM VARIOUS INDUSTRY (in percentage), 2020

FIGURE 15 KEY COAL CAPACITY CONTRIBUTORS IN ASIA-PACIFIC REGION, 2018

FIGURE 16 Asia-Pacific Electrostatic Precipitator Market, By Type, 2020

FIGURE 17 Asia-Pacific Electrostatic Precipitator Market, By OFFERING, 2020

FIGURE 18 Asia-Pacific Electrostatic Precipitator Market, By APPLICATION, 2020

FIGURE 19 Asia-Pacific Electrostatic Precipitator Market, By END-USER, 2020

FIGURE 20 ASIA-PACIFIC Electrostatic precipitator Market: SNAPSHOT (2020)

FIGURE 21 ASIA-PACIFIC Electrostatic precipitator Market: by Country (2020)

FIGURE 22 ASIA-PACIFIC Electrostatic precipitator Market: by Country (2021 & 2028)

FIGURE 23 ASIA-PACIFIC Electrostatic precipitator Market: by Country (2020 & 2028)

FIGURE 24 ASIA-PACIFIC Electrostatic precipitator Market: by Type (2021-2028)

FIGURE 25 Asia-Pacific ELECTROSTATIC PRECIPITATOR market: company share 2020 (%)

查看详细信息 Right Arrow

研究方法

数据收集和基准年分析是使用具有大样本量的数据收集模块完成的。该阶段包括通过各种来源和策略获取市场信息或相关数据。它包括提前检查和规划从过去获得的所有数据。它同样包括检查不同信息源中出现的信息不一致。使用市场统计和连贯模型分析和估计市场数据。此外,市场份额分析和关键趋势分析是市场报告中的主要成功因素。要了解更多信息,请请求分析师致电或下拉您的询问。

DBMR 研究团队使用的关键研究方法是数据三角测量,其中包括数据挖掘、数据变量对市场影响的分析和主要(行业专家)验证。数据模型包括供应商定位网格、市场时间线分析、市场概览和指南、公司定位网格、专利分析、定价分析、公司市场份额分析、测量标准、全球与区域和供应商份额分析。要了解有关研究方法的更多信息,请向我们的行业专家咨询。

可定制

Data Bridge Market Research 是高级形成性研究领域的领导者。我们为向现有和新客户提供符合其目标的数据和分析而感到自豪。报告可定制,包括目标品牌的价格趋势分析、了解其他国家的市场(索取国家列表)、临床试验结果数据、文献综述、翻新市场和产品基础分析。目标竞争对手的市场分析可以从基于技术的分析到市场组合策略进行分析。我们可以按照您所需的格式和数据样式添加您需要的任意数量的竞争对手数据。我们的分析师团队还可以为您提供原始 Excel 文件数据透视表(事实手册)中的数据,或者可以帮助您根据报告中的数据集创建演示文稿。

Frequently Asked Questions

市场是基于 亞太靜電集塵器市場細分,按類型(乾式 ESP 和濕式 ESP)、產品(硬體、軟體和服務)、應用(燃煤發電、電弧爐、燃氣渦輪機、固體廢棄物焚化爐、工業電力等)、最終用戶(發電、金屬加工、水泥、製造、化學、石油化工、船舶等)- 產業趨勢和預測至 2032 年 2032 年 进行细分的。
在2024年,亞太地區靜電除塵器市場的规模估计为2.29 USD Billion美元。
亞太地區靜電除塵器市場预计将在2025年至2032年的预测期内以CAGR 5.6%的速度增长。
市场上的主要参与者包括General Electric , S.A HAMON , Thermax Limited , Sumitomo Heavy IndustriesLtd , Fujian Longking Co.Ltd. , FLSmidth , Babcock &amp, Wilcox EnterprisesInc. , Mitsubishi PowerLtd. , KC Cottrell , KLEAN , John Wood Group PLC , Bharat Heavy Electricals Limited , Pennar Industries Limited , GEA Group Aktiengesellschaft , Siemens Energy 。
Testimonial