Europe Biostimulants Market
市场规模(十亿美元)
CAGR :
% 
 USD
2,105.07 Million
USD
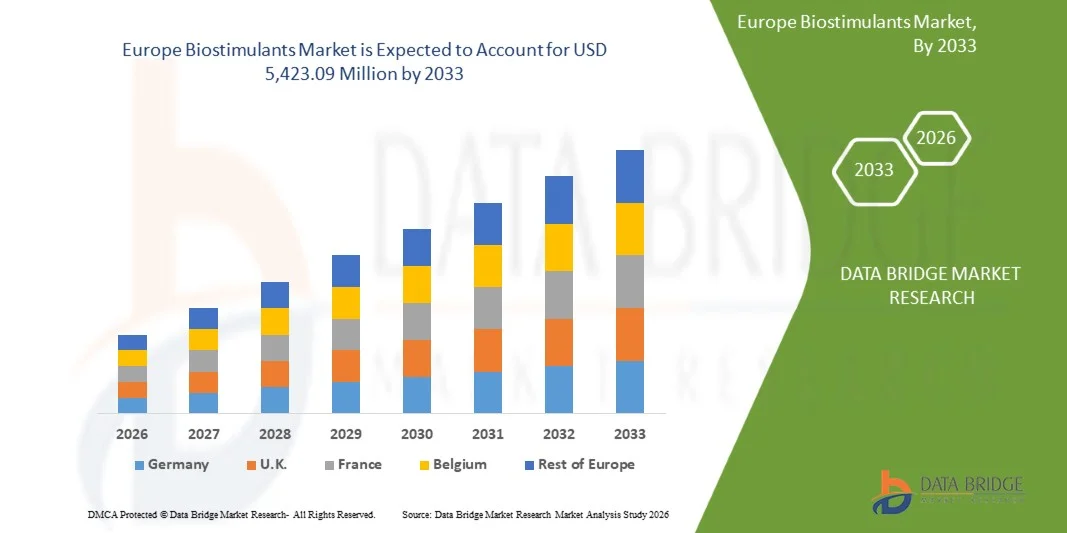
5,423.09 Million
2025
2033
USD
2,105.07 Million
USD
5,423.09 Million
2025
2033
| 2026 –2033 | |
| USD 2,105.07 Million | |
| USD 5,423.09 Million | |
| % | |
|
歐洲生物刺激劑市場細分,依來源(合成生物刺激劑、天然生物刺激劑)、形態(液體、固體)、活性成分(B群維生素、殼聚醣、幾丁質、微生物改良劑、蛋白質水解物、萃取物、酸基、其他)、應用方法(種子處理、土壤處理、葉面處理)、作物(藥劑、植物、油籽、其他植物)
欧洲生物刺激市场规模和增长率是什么
- 根据数据桥市场研究分析, 欧洲生物刺激剂2025年21.0507亿美元并可望达到5.42309亿美元, 以美元计CAGR为12.3%.预测期间
- 市场增长主要是由于食品和饮料、皮革、药品和动物饲料等关键行业对自然和可持续添加剂的需求不断增加所驱动的。 提取和加工技术的进步正在提高生物兴奋剂生产的效率和质量,同时支持该行业内更大的数字化和创新。
- 消费者对植物和生态友好产品的更偏好正在加强生物刺激剂作为合成化学品有吸引力的替代品的地位。 这些因素加在一起,正在加速采用以生物兴奋剂为基础的解决办法,并极大地促进了欧洲生物刺激剂市场的欧洲扩张。
市场大小和预测
- 市场价值(2025年):2,105.07万美元
- 预期市场价值(2033年): 542.309亿美元
- CAGR预测(2026-2033): 12.3%
欧洲生物刺激剂市场分析
- 生物刺激剂是各种植物中自然出现的多酚类化合物,在多个行业中越来越重要——包括食品和饮料、皮革加工,药品, 动物饲料水处理——由于其多功能特性,如耐受性、抗氧化活性、抗微生物效应和生态友好性。
- 对生物刺激剂的需求不断上升,这主要是由于欧洲转向自然、可持续和以生物为基础的产品,提高环境意识,以及提高监管压力以减少工业和消费品中合成添加剂和化学品的使用。
- 西班牙是欧洲生物刺激市场的主要力量,占2025年该区域份额的19.78%,预计将在2026年至2033年以14.8%的强劲CAGR扩张。 这种增长的动力是精密农业和数字农具的高采用率,有机和再生农用地的继续扩大,以及主要的生物兴奋剂制造商和研究机构的强大存在。 此外,对优质作物产出——特别是水果、蔬菜、玉米、大豆和特产作物——的需求不断增长,以促进市场吸收。
- 自然生物刺激剂部分预计将在2026年占71.41%的市场份额,因为它广泛适用于药品、动物饲料和水的净化,同时越来越多的研发工作侧重于其药用、抗氧化剂和功能特性。
范围和欧洲生物刺激产品市场分割报告
|
属性 |
欧洲生物刺激关键市场观察 |
|
覆盖部分 |
|
|
涵盖国家 |
欧洲
|
|
关键市场玩家 |
|
|
市场机会 |
|
|
添加数据信息集的值 |
除了对市场价值、增长率、分块化、地域覆盖和主要参与者等市场假设的深刻见解外,数据桥市场研究编写的市场报告还包括进口出口分析、生产能力概览、生产消费分析、价格趋势分析、气候变化假设、供应链分析、价值链分析、原材料/可消耗品概览、供应商选择标准、PESTLE分析、波特分析以及监管框架。 |
欧洲生物刺激市场的主要趋势是什么
“......将微生物和纳米生物刺激剂结合起来,以提高作物的收效“
- 欧洲生物刺激市场的一个显著和快速增长的趋势是,微生物和纳米生物刺激技术日益融合,以提高作物生产力、营养使用效率和抵御非生物压力的能力。 这一趋势由农业生物技术的迅速发展以及欧洲向高效、低投入和可持续农业解决方案的推进所驱动。
- UPL、Valagro和Novozymes等主要公司正在对微生物联合体和纳米配制进行大量投资,这些配制可提供有针对性的惠益,例如改善固氮、加强根基殖民化、更快地吸收养分,以及在干旱、发热和盐度下加强耐受压力。 这些创新正在帮助农民提高产量,同时减少对合成肥料的依赖。
- 微生物活性刺激剂——特别是植物生长促进活性菌(PGPR)、菌菌(mycorrhizal fungi)和以杆菌为基础的解决办法——由于它们有能力加强根部结构、提高土壤肥力并刺激自然植物防御路径,因此正在得到推动。 公司还在开发下一代菌株,在不同的土壤和气候条件下,生存和兼容性得到加强。
- 纳米生物刺激剂,包括纳米硅、纳米氨基酸和纳米分层微量元素,正在成为常规制剂的高效替代品。 它们的纳米尺度结构提高了渗透性,流动性和营养素的生物利用率,从而导致植物反应更快并减少了应用剂量.
- 在精密农业中,这些先进的生物刺激剂正被配以数字工具,如土壤微生素绘图、遥感和人工智能驱动的作物监测,以便能够制定有针对性的应用战略并优化实地绩效。
- 这种向下一代微生物和纳米生物刺激剂的转变正在重新确定工业标准,使市场从基本有机投入过渡到科学设计的高性能生物解决方案。
欧洲生物刺激市场动态
驱动程序
“干旱、洪水和热浪等与气候有关的作物压力的频率增加正迫使农民采用生物刺激剂来维持作物产量和质量”。
- 干旱、洪水和热浪等与气候有关的压力日益频繁,已成为欧洲农业所关注的关键问题,直接影响了作物生产力和粮食安全。
- 这些极端条件扰乱了植物的新陈代谢,损害了营养素的吸收并降低了总的产量潜力。 因此,农民越来越多地转向生物刺激剂——即加强植物生理过程的天然物质——以加强作物抵御环境压力的能力。
- 生物刺激剂的采用使生产者能够在不可预测的气候情况下维持产量和质量,同时支持土壤和生态系统的长期健康。
- 实例 2025年7月MDPI研究文章指出,在缺水条件下对大豆作物应用海藻提取物提高了光合作用效率和生物量积累,表明生物刺激剂在提高抗旱能力方面的作用
- 正如2024年10月《BASF》和《合法植物》联合发布所指出,对向日葵作物的实地试验表明,海藻衍生生物刺激剂提高了抗旱能力,在受水限制的条件下维持了产量,增强了对减轻生物压力产品的信心。
- 极端气候事件不断增多继续扰乱了欧洲的农业生产力,迫使农民寻求可持续的解决办法来增强作物的抗御能力。 生物刺激剂已成为通过提高植物压力耐受性和恢复能力来减轻干旱、洪水和热浪影响的重要组成部分。
- 在加强实地验证和产品创新的支持下,随着种植者在面临气候不确定性的情况下优先考虑产量的稳定性和质量,其采用可望进一步加快
限制/挑战
“......与常规化肥相比,生物兴奋剂产品成本高,限制了小规模和受资源限制的农民的采用“
- 与常规化学肥料相比,生物兴奋剂产品的成本相对较高,大大限制了市场的增长,特别是在小农和资源受限的农民中。
- 虽然生物刺激剂在土壤健康、产量稳定性和可持续性方面提供了长期利益,但其前期成本和有限的价格竞争力往往不利于在对成本敏感的农业地区采用。 这种价格差异,加上对长期经济回报的认识较低,继续阻碍发展中和低收入农业社区广泛使用生物刺激剂
- 实例 如KNN India于2025年9月所报告,化肥部门强调,在正式化肥控制下处理生物兴奋剂的新条例提高了遵守和生产成本,威胁到许多小型中小企业制造商,间接地增加了农民的终端产品成本。
- 2025年,Khoulati等在“利用生物刺激剂促进可持续农业”一文中指出,主要挑战之一是“经济制约”,包括相对于传统投入而言产品成本高,限制了资源受限环境的吸收。
- 与常规肥料相比,生物兴奋剂产品的成本相对较高,这仍然是广泛采用这些产品的主要障碍,特别是在小农和资源受限的农民中。
- 尽管事实证明它们有利于土壤健康、作物抗御力和长期可持续性,但前期开支较高、政府补贴有限以及缺乏负担得起的配方,使得对价格敏感的种植者更难获得生物刺激剂。 除非通过政策支持、技术创新和地方化生产来克服成本障碍,否则在许多发展中国家,它们改造可持续农业的潜力仍将没有得到充分利用。
机会
“随着农业现代化的加强和对可持续做法的认识而进入新兴市场,具有巨大的增长潜力”
- 将生物兴奋剂的使用扩大到新兴市场,为加快农业现代化和提高对可持续耕作做法的认识提供了巨大的增长机会。 随着亚太、拉丁美洲和非洲国家越来越多地采用先进的作物管理技术来提高生产力和资源效率,生物刺激剂正作为改善土壤健康和作物抗御力的生态友好型解决方案而得到人们的注意。 支持性政府倡议、增加农业研发投资和农民教育方案正在进一步促进市场渗透,将新兴经济体定位为今后几年全球生物刺激工业的关键增长中心。
- 例如,2025年8月,《今日GK》的一篇文章报告说,印度向可持续和有气候抗御力的耕作转变,以及对作物健康的认识得到提高,正在促进该国生物兴奋剂的吸收。
- 例如,2025年7月,Agrithority发表文章称,在拉丁美洲,人们日益认识到生物刺激剂和生物投入是热带耕作系统的可持续替代品,这正在加速巴西、阿根廷和秘鲁的投资和吸收。
- 虽然生物刺激剂部分通过增强植物抗御力、改善土壤健康和减少对传统农用化学品的依赖,向可持续农业转变很有希望,但其前进的道路并非没有挑战。 关键问题包括监管格局仍在演变,以确保产品的功效和质量,农民教育和实地保障方面的广泛差距,以及未经核实的配方在市场上占主导地位。 在通过标准化测试、提高透明度和以农民为中心的推广服务来克服这些障碍之前,生物刺激剂的全部潜力将受到限制。
欧洲生物刺激市场范围
欧洲生物刺激剂市场按来源、形式、活性成分、应用方法、作物、最终用户分为六个显著部分。
- 按来源
基于Origin,全球欧洲生物刺激剂市场被分入合成生物刺激剂,天然生物刺激剂. 干燥分出分出分出分出分出分出分出分出分出分出分出分出分出分出分出分出分出分出分出分出分出分出分出分出分出分出分出分出分出分出分出分出分出分出分出分出分出分出分出分出分出分出分出分出分出分出分出分出分出分出分出分出分出分出分出分出分出分出分出分出分出分出分出分出分出分出分出分出分出分出分出分出分出分出分出分出分出分出分出分出分出分出分出分出分出分出分出分出分出分出分出分出分出分出分出分出分出分出分出分出分出分出分出分出分出分出分出分出分出分出分出分出分出分出分出分出分出分出分出分出分出分出分出分出分出分出分 自然生物刺激剂在形式基础上被进一步分解为干燥和外包加工. 干燥分入可分出水,干颗粒,可湿性粉末. 2026年,自然生物刺激剂部分预计将以71.94%的市场份额为主.
自然生物刺激剂部分的CAGR比例预计最高,为12.6%,因为寻求可持续和无害环境的作物管理解决方案的农民越来越多地采用这一方法。 天然生物刺激剂取自于海藻提取物、蛋白水解和有益微生物等有机来源,能增强植物生长、养分吸收和应激耐受力,而不会对合成化学品造成环境影响。
- 按表单
根据"形态","全球欧洲生物刺激品市场"被分割成液态,干燥. 干燥被进一步分解为可分水,干颗粒,可湿性粉末. 液体被进一步分解为悬浮精,乳油,可溶液精. 2026年,液体部分预计将以65.45%的股权支配市场.
液体部分由于易于施用、迅速吸收以及与现代灌溉和喷洒系统相容,预计其登记率最高,为12.5%。 液态生物刺激剂可以统一分配活性成分,确保有效吸收养分并增强植物生长,特别是在大规模耕作作业中。
- 根据活性成分
在活化成份的基础上,全球欧洲生物刺激剂市场被分化成b-活化胺,基多桑活化胺,基多桑活化胺,基多丁活化胺,微生物分化酶活化酶,蛋白水解酶活化酶等. 在取出物中,市场被进一步分解为真菌取出物,植物取出物,海藻取出物. 在以酸为基的中,市场被进一步分解为hum酸fulvic酸,氨基酸. 2026年,以酸为原料的部分预计将以53.32%的股权支配市场.
以酸为基的分层还预计将登记最高的CAGR为12.7%,原因是在提高作物生产力和抗压力能力方面迅速采用氨基酸,hum酸和富维酸. 这些以酸为原料的生物刺激剂改善了营养素的吸收,刺激了根基的发育,提高了植物抗干旱、盐分和极端温度等非生物压力的能力。 它们在各种作物中的效力,加上农民对可持续和有利于生态的农业做法的认识的提高,促使农民越来越受欢迎。
- 通过申请
根据应用方法,全球欧洲生物刺激剂市场分为种子处理,土壤处理,花果处理. 2026年,福利亚尔治疗部分预计将以74.39%的比重主导市场.
由于Folar治疗部分向作物直接和高效地提供营养和活性化合物,预计该部分的CAGR比例最高,为12.4%。 叶片应用允许通过叶子快速吸收,导致生长反应更快,承受力更强,与土壤应用相比产量也有所改善. 精密农业技术日益被采用,劳动效率要求不断提高,各种作物的叶片治疗多用途进一步支持了市场增长。
- 按作物分列
在 " 作物 " 的基础上,全球欧洲生物刺激剂市场被划分为地皮装饰品、油籽和豆类、谷物和谷物、水果和蔬菜等。 油菜籽和豆类市场被进一步分化成大豆、向日葵、被强奸的种子/卡诺拉、花生(花生)、芝麻等。 在谷物和谷物方面,市场被进一步分割成小麦、大米、玉米、大麦、燕麦、高粱等。 2026年,预计水果和蔬菜部分以58.87%的比重占据了市场主导地位.
由于对高质量、营养丰富的和具有视觉吸引力的产品的需求日益增加,预计水果和蔬菜部分的CAGR将达到最高的12.6%。 生物刺激剂可提高作物产量,改善水果大小、颜色、口味和保质期,并增强抗干旱、发热和盐分等非生物压力的能力,使它们在水果和蔬菜种植中受到高度重视。 消费者越来越偏好新鲜和有机产品,加上对化肥和杀虫剂的更严格管制,正在促使农民采用生物刺激剂。
- 最终用户
在终端用户的基础上,全球欧洲生物刺激剂市场被划分为研究机构,农民. 2026年,农民部分预计将以85.34%的市场份额来主导市场.
由于人们日益认识到生物刺激剂是可持续和高产农业的基本工具,农民部分的CAGR将达到最高的12.6%。 农民越来越多地采用这些产品来改善作物生长、提高营养效率并增强对干旱、盐分和极端温度等环境压力的抵抗力。 对有机和高质量产品的需求不断增加,加上对合成肥料和化学投入的更严格管理,正在鼓励农民将生物刺激剂纳入其作物管理做法。
欧洲生物刺激剂市场区域分析
欧洲生物刺激剂市场正在稳步而强劲地增长,其动力是越来越多地采用可持续农业投入、精准耕作技术以及日益转向有机和无残留的粮食生产。 该区域继续大量投资于提高生物作物产量的解决方案,以提高营养效率、耐受压力性和总体植物生产力。
SPAIN 欧洲生物刺激产品市场
SPAIN是欧洲生物刺激剂市场的主导力量. 这种增长的动力是精密农业和数字农具的高采用率,有机和再生农用地的继续扩大,以及主要的生物兴奋剂制造商和研究机构的强大存在。 此外,对优质作物产出——特别是水果、蔬菜、玉米、大豆和特产作物——的需求不断增长,以促进市场吸收。
英国:生物刺激市场洞察
英国在2026年的欧洲生物刺激品市场中占有相当大的份额. 这一扩大的动力是有机和低化学投入的农业迅速增长,消费者对清洁标签和生物食品的需求增加,以及政府对环保农业做法的大力支持。 不同关键作物类别(包括谷物、油籽、地皮和园艺作物)越来越多地采用生物刺激剂,进一步加快了市场吸收。 此外,英国对土壤健康改善方案的投资不断增加,这正在强化向生物作物增殖解决方案的转变,支持持续的长期市场增长。
哪些是欧洲顶级公司
欧洲生物刺激剂行业主要由历史悠久的公司领导,包括:
- Ajinomoto股份有限公司(日本)
- 合成生物(瑞士)
- 科罗曼德尔国际有限公司(印度)
- BASF(德国)
- 拜尔集团(德国)
- UPL (印度)
- Biostadt India有限公司(印度)
- 诺沃齐姆斯(丹麦)
- 阿格里森 (美国).
- FMC公司(美国)
- T. Stanes & Company Limited (TSTANES) (印度)
- (荷兰)
- 阿特兰蒂卡·阿格里科拉(西班牙)
- 海发内盖夫科技有限公司.(以色列)
- ILSA S.p.A.(意大利)
- AG Biotech, Inc.(美国)
欧洲生物刺激市场最新动态
- 2023年2月,黎巴嫩航天局在可再生的蔬菜来源——黄油和藻类——的基础上推出了新的生物刺激剂。 以大豆为原料的产品中含有氨基酸,β素和三甲contanol,而以藻类为原料的活性兴奋剂则采用可持续,非侵入性的方法取出. 这两种产品都增强了植物生长、承受力和水果质量。
- 2月2025日,Horticoop投资了由克珀特公司专门进行再生土壤改良的副产品REKA Group BV. 投资支持REKA的使命,即开发并分配生物刺激剂、养分和摄入剂,以提高土壤健康、养分效率和植物复原力。 这一伙伴关系的目的是在欧洲加强可持续农业和园艺。
- 2024年10月,T.Stanes推出并推广了以维生素为原料的活性兴奋剂Fytovita,突出其在加强植物生长,减轻非生素压力,提高作物产量和质量等方面的作用.
- 3月2025日,Ajinomoto Co.公司宣布,它将作为一个伙伴,参加在日本-巴西绿色伙伴关系倡议下在巴西开展的 " 恢复退化的草原核查研究 " 项目,提供其氨基酸生物兴奋剂产品(如AJIFOL和AMINO Arginine等),用于耕地,以核实退化牧场的恢复情况。
- 2025年11月,BASF宣布,它“继续承诺为2026年种植季节提供低息种植者融资”,为购买参与的作物保护、种子处理和种子品牌提供0%的农业收益融资,以支持农民投资于可持续农业。
SKU-

目录
1 引言
1.1 研究目標
1.2 市場定義
1.3 歐洲生物刺激劑市場概覽
1.4 貨幣與定價
1.5 局限性
1.6 覆蓋市場
2 市場區隔
2.1 覆蓋市場
2.2 地理範圍
本研究考慮的時間段為2.3年
2.4 DBMR 三腳架資料驗證模型
2.5 對關鍵意見領袖進行初步訪談
2.6 DBMR 市場定位矩陣
2.7 供應商份額分析
2.8 多元建模
2.9 起源時間軸曲線
2.1 市場終端用戶覆蓋率表
2.11 二手資料
2.12 假設
3 執行摘要
4 項高級洞察
4.1 波特五力分析
4.1.1 新進入者的威脅
4.1.2 供應商的議價能力
4.1.3 買方的議價能力
4.1.4 替代產品的威脅
4.1.5 產業競爭
4.2 定價分析
4.3 公司產能前景
4.3.1 概述
4.3.2 結論
4.4 產業生態系分析
4.4.1 概述
4.4.2 主要公司
4.4.2.1 歐洲的規模與戰略優勢
4.4.2.2 關鍵職能與價值鏈角色
4.4.3 中小企業
4.4.3.1 創新驅動型中小企業
4.4.3.2 商業模式與競爭角色
4.4.4 最終用戶
4.4.4.1 最終用戶細分
4.4.4.2 採納驅動因素、障礙與價值創造
4.4.4.3 按作物段劃分的最終使用者表格
4.4.5 結論
4.5 專利分析-歐洲生物刺激劑市場
4.5.1 專利品質和強度
4.5.2 專利族
4.5.3 許可和合作
4.5.4 區域專利格局
4.5.5 智慧財產權策略與管理
4.6 原料採購
4.6.1 海藻萃取物
4.6.2 腐植酸和富裡酸
4.6.3 胺基酸和蛋白質水解物
4.6.4 微生物菌株(細菌、真菌和酵母菌)
4.6.5 有機酸和多醣
4.6.6 無機營養素和螯合劑
4.6.7 載體和配方添加劑
4.7 影響歐洲生物刺激劑市場購買決策的因素
4.7.1 引言:
4.7.2 已驗證的技術有效性和已證明的性能
4.7.3 作物、土壤和環境的適應性
4.7.4 經濟可行性與投資報酬率 (ROI)
4.7.5 信任、透明度和品牌聲譽
4.7.6 監理合規性和永續性資質
4.7.7 知識、意識與風險感知
4.7.8 結論
4.8 生產消耗分析
4.8.1 生產資料集
4.8.2 消費資料集
4.9 進出口場景
4.9.1 導入資料集
4.9.2 導出資料集
4.1 創新追蹤與策略分析
4.10.1 重大交易與策略聯盟分析
4.10.1.1 合資企業
4.10.1.2 併購
4.10.1.3 許可和合作協議
4.10.1.4 技術合作
4.10.1.5 策略性資產剝離/投資組合重組
4.10.2 在研產品數量
4.10.3 發展階段
4.10.4 時間表和里程碑
4.10.5 創新策略和方法
4.10.6 風險評估與緩解
4.11 歐洲生物刺激劑市場的產品採納情景
4.11.1 引言
4.11.2 目前採用階段
4.11.3 區域和作物特定採用模式
4.11.4 採納驅動因素
4.11.5 採納障礙
4.11.6 採用曲線和前景
4.11.7 以農民為中心的視角
4.11.8 對利害關係人的影響
4.11.9 結論
4.12 公司評估象限
4.13 成本分析細分
4.13.1 概述
4.13.2 資本投資與生產規模
4.13.2.1 工廠規模、基礎設施和自動化
4.13.2.2 設備和製程複雜性
4.13.3 原料、配方和營運成本
4.13.3.1 原料採購及變異性
4.13.3.2 加工強度與配方複雜性
4.13.3.3 變動性和風險溢酬
4.13.4 監理、合規和註冊成本
4.13.4.1 監理環境及相關成本
4.13.4.2 對製造成本基礎的影響
4.13.5 物流、配送與應用成本
4.13.5.1 包裝、儲存和運輸
4.13.5.2 通路結構與最終用戶應用
4.13.6 成本效益考量與利潤率影響
4.13.6.1 種植者的投資報酬率
4.13.6.2 製造商和分銷商利潤
4.13.7 降低成本的機會和產業趨勢
4.13.7.1 農業廢棄物原料的利用與循環經濟
4.13.7.2 規模化、製程效率和標準化
4.13.7.3 監理協調與歐洲市場准入
4.13.8 結論
4.14 利潤率情景
4.14.1 概述
4.14.2 價值鏈利潤結構
4.14.2.1 製造商毛利率
4.14.2.2 分銷商/經銷商利潤
4.14.2.3 農民價值獲取與利潤實現
4.14.3 利潤率驅動因素與限制因素
4.14.3.1 新型活性成分與溢價定價
4.14.3.2 基於成本的壓力
4.14.3.3 規模和採用率
4.14.3.4 競爭壓力與替代
4.14.3.5 農民投資報酬率和支付意願
4.14.4 預計利潤率範圍
4.14.5 利潤率提升策略
4.14.5.1 基於價值的定價
4.14.5.2 成本基礎優化
4.14.5.3 高端細分市場聚焦
4.14.5.4 規模擴展
4.14.5.5 農民參與和示範
4.14.6 區域和作物細分的考慮
4.14.7 結論
4.15 經濟放緩對市場的影響
4.15.1 對價格的影響
4.15.2 對供應鏈的影響
4.15.3 對發貨的影響
4.15.4 對公司策略決策的影響
4.15.5 對需求的影響
4.15.6 對策略決策的影響
4.16 供應鏈分析
4.16.1 概述
4.16.2 物流成本方案
4.16.3 物流服務提供者的重要性
5. 關稅及其對市場的影響
5.1 現行關稅稅率
5.1.1 展望:本地生產與進口依賴
5.2 供應商選擇標準動態
5.3 對供應鏈的影響
5.3.1 原料採購
5.3.2 製造和生產
5.3.3 物流和配送
5.3.4 價格策略與市場定位
5.4 產業參與者:積極舉措
5.4.1 供應鏈優化
5.4.2 合資企業的設立
5.5 對價格的影響
5.6 監管傾向
5.6.1 地緣政治情勢
5.6.2 各國之間的貿易夥伴關係
5.6.2.1 自由貿易協定
5.6.2.2 聯盟機構
5.6.3 狀態認證(包括最惠國待遇)
5.6.4 國內糾正措施
5.6.4.1 提高生產產量的激勵機制
5.6.4.2 設立經濟特區/工業園區
6 歐洲生物刺激劑市場的監管涵蓋範圍
6.1 概述
6.2 法規定義與分類
6.3 合規和註冊要求
6.4 區域監管要點
6.5 對利害關係人的影響
6.6 監管覆蓋範圍方面的挑戰
6.7 展望
7 市場概覽
7.1 駕駛員
7.1.1 乾旱、洪水和熱浪等氣候相關作物脅迫的發生頻率不斷增加,促使農民採用生物刺激劑來維持作物產量和品質。
7.1.2 歐洲對有機和永續生產的食品的需求不斷增長,這促使人們使用生物刺激劑作為化學肥料的天然替代品。
7.1.3 由於過度使用合成肥料和集約化耕作方式導致土壤肥力下降,促使農民使用生物刺激劑來增強養分吸收和土壤微生物活性。
7.1.4 農民對長期土壤健康和永續農業的認識不斷提高,這促使人們更多地採用生物刺激劑來提高植物的適應能力和生產力。
7.2 約束
7.2.1 與傳統肥料相比,生物刺激劑產品成本高昂,限制了小農戶和資源匱乏農戶的採用。
7.2.2 不同作物、土壤和氣候條件下的表現不一致,對農民造成了不確定性,減緩了廣泛採用。
7.3 機會
7.3.1 隨著農業現代化程度的提高和人們對永續實踐意識的增強,向新興市場擴張具有巨大的成長潛力。
7.3.2 針對特定作物和脅迫條件量身定制的下一代生物刺激劑(微生物、海藻或氨基酸基)的開發為產品差異化提供了機會。
7.3.3 將生物刺激劑與精準農業技術(如基於感測器的養分管理和定向施肥)結合,可以優化功效並降低投入成本
7.4 挑戰
7.4.1 全球缺乏標準化的品質基準和法規,導致難以確保產品功效的一致性,影響農民的信任。
7.4.2 分散的分銷網絡和偏遠農業地區供應有限限制了市場滲透和持續使用
8 歐洲生物刺激劑市場(依來源劃分)
8.1 概述
8.2 天然生物刺激劑
8.2.1 液體
8.2.2 乾燥
8.3 合成生物刺激劑
8.3.1 液體
8.3.2 乾燥
9 歐洲生物刺激劑市場(依劑型劃分)
9.1 概述
9.2 液體
9.3 幹
10 歐洲生物刺激劑市場(依活性成分劃分)
10.1 概述
10.2 酸性
10.3 基於萃取物
10.4 蛋白質水解物
10.5 微生物改良
10.6 幾丁質
10.7 殼聚醣
10.8 B群維生素
10.9 其他
11 歐洲生物刺激劑市場(依作物劃分)
11.1 概述
11.2 水果和蔬菜
11.3 穀物
11.4 油籽和豆類
11.5 草坪和觀賞植物
11.6 其他作物
12 歐洲生物刺激劑市場,依應用方法劃分
12.1 概述
12.2 葉面處理
12.3 土壤處理
12.4 種子處理
13 歐洲生物刺激劑市場(按最終用戶劃分)
13.1 概述
13.2 農民
13.3 研究機構
14 歐洲生物刺激劑市場(按地區劃分)
14.1 歐洲
14.1.1 西班牙
14.1.2 義大利
14.1.3 英國
14.1.4 法國
14.1.5 德國
14.1.6 荷蘭
14.1.7 瑞士
14.1.8 俄羅斯
14.1.9 比利時
14.1.10 土耳其
14.1.11 波蘭
14.1.12 丹麥
14.1.13 瑞典
14.1.14 挪威
14.1.15 歐洲其他地區
15 全球生物刺激劑市場:公司概況
15.1 製造商公司股份分析:十億美元
16 SWOT分析
17 公司簡介
17.1 諾維信公司
17.1.1 公司概況
17.1.2 收入分析
17.1.3 公司股份分析
17.1.4 產品組合
17.1.5 最新進展
17.2 味之素株式會社
17.2.1 公司概況
17.2.2 收入分析
17.2.3 公司股份分析
17.2.4 產品組合
17.2.5 最新進展
17.3 UPL
17.3.1 公司概況
17.3.2 收入分析
17.3.3 公司股份分析
17.3.4 產品組合
17.3.5 最新進展
17.4 先正達
17.4.1 公司概況
17.4.2 公司股份分析
17.4.3 產品組合
17.4.4 最新進展
17.5 巴斯夫
17.5.1 公司概況
17.5.2 收入分析
17.5.3 公司股份分析
17.5.4 產品組合
17.5.5 最新進展
17.6 AG BIOTECH, INC.
17.6.1 公司概況
17.6.2 產品組合
17.6.3 最新進展
17.7 農業
17.7.1 公司概況
17.7.2 產品組合
17.7.3 最新進展
17.8 大西洋農業
17.8.1 公司概況
17.8.2 產品組合
17.8.3 最新進展
17.9 拜耳股份公司
17.9.1 公司概況
17.9.2 收入分析
17.9.3 產品組合
17.9.4 最新進展
17.1 BIOSTADT。
17.10.1 公司概況
17.10.2 產品組合
17.10.3 最新進展
17.11 科羅曼德爾國際有限公司
17.11.1 公司概況
17.11.2 收入分析
17.11.3 產品組合
17.11.4 最新進展
17.12 FMC公司
17.12.1 公司概況
17.12.2 收入分析
17.12.3 產品組合
17.12.4 最新進展
17.13 海法內蓋夫技術有限公司
17.13.1 公司概況
17.13.2 產品組合
17.13.3 最新進展
17.14 ILSA SPA
17.14.1 公司概況
17.14.2 產品組合
17.14.3 最新進展
17.15 REKA
17.15.1 公司概況
17.15.2 產品組合
17.15.3 最新進展
17.16 TSTANES。
17.16.1 公司概況
17.16.2 收入分析
17.16.3 產品組合
17.16.4 最新進展
18 問卷
表格列表
表1 公司生產能力
表2 歐洲生物刺激劑市場(依產地劃分),2018-2033年(千美元)
表3 歐洲生物刺激劑市場(依產地劃分),2018-2033年(噸)
表 4 歐洲天然生物刺激劑在生物刺激劑市場中的份額(按地區劃分),2018-2033 年(千美元)
表 5 歐洲天然生物刺激劑市場(以劑型劃分),2018-2033 年(千美元)
表 6 歐洲生物刺激劑液體市場(按類型劃分),2018-2033 年(千美元)
表 7 歐洲生物刺激劑市場乾散貨(按類型劃分),2018-2033 年(千美元)
表 8 歐洲合成生物刺激劑在生物刺激劑市場中的份額(按地區劃分),2018-2033 年(千美元)
表 9 歐洲合成生物刺激劑市場(以劑型劃分),2018-2033 年(千美元)
表 10 歐洲液體生物刺激劑市場(按類型劃分),2018-2033 年(千美元)
表 11 歐洲生物刺激劑市場乾散貨(按類型劃分),2018-2033 年(千美元)
表 12 歐洲生物刺激劑市場(以劑型劃分),2018-2033 年(千美元)
表 13 歐洲生物刺激劑液體市場(按地區劃分),2018-2033 年(千美元)
表 14 歐洲生物刺激劑液體市場(按類型劃分),2018-2033 年(千美元)
表 15 歐洲生物刺激劑市場乾散貨(按地區劃分),2018-2033 年(千美元)
表 16 歐洲生物刺激劑市場乾散貨(按類型劃分),2018-2033 年(千美元)
表 17 歐洲生物刺激劑市場(依產地劃分),2018-2033 年(千美元)
表 18 歐洲生物刺激劑酸基市場(按地區劃分),2018-2033 年(千美元)
表 19 歐洲生物刺激劑酸基市場(按類型劃分),2018-2033 年(千美元)
表 20 歐洲生物刺激劑市場萃取物(按地區劃分),2018-2033 年(千美元)
表 21 歐洲生物刺激劑市場萃取物(按類型劃分),2018-2033 年(千美元)
表 22 歐洲生物刺激劑市場中蛋白質水解物(按地區劃分),2018-2033 年(千美元)
表 23 歐洲生物刺激劑市場微生物添加劑用量(按地區劃分),2018-2033 年(千美元)
表 24 歐洲生物刺激劑市場幾丁質(按地區劃分),2018-2033 年(千美元)
表 25 歐洲生物刺激劑市場中殼聚醣的份額(按地區劃分),2018-2033 年(千美元)
表 26 歐洲生物刺激劑市場中 B 群維生素的市場規模(按地區劃分),2018-2033 年(千美元)
表 27 歐洲其他地區生物刺激劑市場規模(按地區劃分),2018-2033 年(千美元)
表 28 歐洲生物刺激劑市場(以作物劃分),2018-2033 年(千美元)
表 29 歐洲各地區蔬果生物刺激劑市場規模(2018-2033 年)(千美元)
表 30 歐洲蔬果生物刺激劑市場規模(依水果分類),2018-2033 年(千美元)
表 31 歐洲蔬果生物刺激劑市場規模(依蔬菜種類劃分),2018-2033 年(千美元)
表 32 歐洲穀物和穀類食品在生物刺激劑市場中的份額(按地區劃分),2018-2033 年(千美元)
表 33 歐洲穀物和穀類食品在生物刺激劑市場中的份額(按類型劃分),2018-2033 年(千美元)
表 34 歐洲油籽和豆類在生物刺激劑市場中的份額(按地區劃分),2018-2033 年(千美元)
表 35 歐洲生物刺激劑市場油籽與豆類(按類型劃分),2018-2033 年(千美元)
表36 歐洲草坪和觀賞植物生物刺激劑市場(按地區劃分),2018-2033年(千美元)
表 37 歐洲其他作物在生物刺激劑市場中的份額(按地區劃分),2018-2033 年(千美元)
表38 歐洲生物刺激劑市場(依應用方法劃分),2018-2033年(千美元)
表 39 歐洲生物刺激劑市場(按地區劃分),2018-2033 年(千美元)
表 40 歐洲生物刺激劑土壤處理市場(按地區劃分),2018-2033 年(千美元)
表 41 歐洲種子管理生物刺激劑市場(按地區劃分),2018-2033 年(千美元)
表 42 歐洲生物刺激劑市場(按最終用戶劃分),2018-2033 年(千美元)
表 43 歐洲各地區生物刺激劑市場農民收入(千美元),2018-2033 年
表 44 歐洲生物刺激劑市場研究機構(按地區劃分),2018-2033 年(千美元)
表 45 歐洲生物刺激劑市場(按國家/地區劃分),2018-2033 年(千美元)
表 46 歐洲生物刺激劑市場(按國家/地區劃分),2018-2033 年(千美元)
表 47 歐洲生物刺激劑市場(依國家劃分),2018-2033 年(噸)
表48 歐洲
表 49 歐洲生物刺激劑市場(按產地劃分),2018-2033 年(千美元)
表 50 歐洲生物刺激劑市場(依產地劃分),2018-2033 年(噸)
表 51 歐洲天然生物刺激劑市場(以劑型劃分),2018-2033 年(千美元)
表 52 歐洲液體生物刺激劑市場(按類型劃分),2018-2033 年(千美元)
表 53 歐洲生物刺激劑市場乾散貨,按類型劃分,2018-2033 年(千美元)
表 54 歐洲合成生物刺激劑市場(以劑型劃分),2018-2033 年(千美元)
表 55 歐洲生物刺激劑液體市場(按類型劃分),2018-2033 年(千美元)
表 56 歐洲生物刺激劑市場乾散貨,按類型劃分,2018-2033 年(千美元)
表 57 歐洲生物刺激劑市場(以劑型劃分),2018-2033 年(千美元)
表 58 歐洲液體生物刺激劑市場(按類型劃分),2018-2033 年(千美元)
表 59 歐洲生物刺激劑市場乾散貨,按類型劃分,2018-2033 年(千美元)
表 60 歐洲生物刺激劑市場(按活性成分劃分),2018-2033 年(千美元)
表 61 歐洲生物刺激劑酸基市場(按類型劃分),2018-2033 年(千美元)
表 62 歐洲生物刺激劑市場萃取物(按類型劃分),2018-2033 年(千美元)
表 63 歐洲生物刺激劑市場(按應用方法劃分),2018-2032 年(千美元)
表 64 歐洲生物刺激劑市場(以作物劃分),2018-2033 年(千美元)
表 65 歐洲蔬果生物刺激劑市場(依水果分類),2018-2033 年(千美元)
表 66 歐洲蔬果在生物刺激劑市場中的份額(按蔬菜種類劃分),2018-2033 年(千美元)
表 67 歐洲穀物和穀類食品在生物刺激劑市場中的份額(按類型劃分),2018-2033 年(千美元)
表 68 歐洲生物刺激劑市場油籽與豆類(按類型劃分),2018-2033 年(千美元)
表 69 歐洲生物刺激劑市場(按最終用戶劃分),2018-2033 年(千美元)
表 70 西班牙生物刺激劑市場(按產地劃分),2018-2033 年(千美元)
表 71 西班牙生物刺激劑市場(依產地劃分),2018-2033 年(噸)
表 72 西班牙天然生物刺激劑市場(以劑型劃分),2018-2033 年(千美元)
表 73 西班牙生物刺激劑市場液體產品規模(按類型劃分),2018-2033 年(千美元)
表 74 西班牙生物刺激劑市場乾散貨(按類型劃分),2018-2033 年(千美元)
表 75 西班牙合成生物刺激劑在生物刺激劑市場中的份額(按劑型劃分),2018-2033 年(千美元)
表 76 西班牙生物刺激劑市場液體產品(按類型劃分),2018-2033 年(千美元)
表 77 西班牙生物刺激劑市場(按類型劃分),2018-2033 年(千美元)
表 78 西班牙生物刺激劑市場(以劑型劃分),2018-2033 年(千美元)
表 79 西班牙生物刺激劑市場液體產品規模(按類型劃分),2018-2033 年(千美元)
表 80 西班牙生物刺激劑市場乾散貨(按類型劃分),2018-2033 年(千美元)
表 81 西班牙生物刺激劑市場(按活性成分劃分),2018-2033 年(千美元)
表 82 西班牙生物刺激劑酸基市場(按類型劃分),2018-2033 年(千美元)
表 83 西班牙生物刺激劑市場萃取物(按類型劃分),2018-2033 年(千美元)
表 84 西班牙生物刺激劑市場,依應用方法劃分,2018-2032 年(千元)
表 85 西班牙生物刺激劑市場(按作物劃分),2018-2033 年(千美元)
表 86 西班牙蔬果在生物刺激劑市場中的份額(按水果分類),2018-2033 年(千美元)
表 87 西班牙蔬果在生物刺激劑市場中的份額(按蔬菜種類劃分),2018-2033 年(千美元)
表 88 西班牙穀物及穀類食品在生物刺激劑市場中的份額(按類型劃分),2018-2033 年(千美元)
表 89 西班牙油籽和豆類在生物刺激劑市場中的份額(按類型劃分),2018-2033 年(千美元)
表 90 西班牙生物刺激劑市場(按最終用戶劃分),2018-2033 年(千美元)
表 91 義大利生物刺激劑市場(依產地劃分),2018-2033 年(千美元)
表 92 義大利生物刺激劑市場(依產地劃分),2018-2033 年(噸)
表 93 義大利天然生物刺激劑市場(按形式劃分),2018-2033 年(千美元)
表 94 義大利生物刺激劑市場液體產品(按類型劃分),2018-2033 年(千美元)
表 95 義大利生物刺激劑市場乾粉含量(按類型劃分),2018-2033 年(千美元)
表 96 義大利合成生物刺激劑在生物刺激劑市場中的份額(按劑型劃分),2018-2033 年(千美元)
表 97 義大利生物刺激劑市場液體產品(按類型劃分),2018-2033 年(千美元)
表 98 義大利生物刺激劑市場乾粉含量(按類型劃分),2018-2033 年(千美元)
表 99 義大利生物刺激劑市場(以劑型劃分),2018-2033 年(千美元)
表 100 義大利生物刺激劑市場液體產品(按類型劃分),2018-2033 年(千美元)
表 101 義大利生物刺激劑市場乾粉含量(按類型劃分),2018-2033 年(千美元)
表 102 義大利生物刺激劑市場(按活性成分劃分),2018-2033 年(千美元)
表 103 義大利生物刺激劑酸基產品市場(按類型劃分),2018-2033 年(千美元)
表 104 義大利生物刺激劑市場萃取物(按類型劃分),2018-2033 年(千美元)
表 105 義大利生物刺激劑市場,依應用方法劃分,2018-2032 年(千元)
表 106 義大利生物刺激劑市場(以作物劃分),2018-2033 年(千美元)
表 107 義大利生物刺激劑市場水果和蔬菜(按水果分類),2018-2033 年(千美元)
表 108 義大利蔬果在生物刺激劑市場中的份額(按蔬菜種類劃分),2018-2033 年(千美元)
表 109 義大利穀物及穀類食品在生物刺激劑市場中的份額(按類型劃分),2018-2033 年(千美元)
表 110 義大利油籽和豆類在生物刺激劑市場中的份額(按類型劃分),2018-2033 年(千美元)
表 111 義大利生物刺激劑市場(按最終用戶劃分),2018-2033 年(千美元)
表 112 英國生物刺激劑市場(按產地劃分),2018-2033 年(千美元)
表 113 英國生物刺激劑市場(依產地劃分),2018-2033 年(噸)
表 114 英國天然生物刺激劑市場(以劑型劃分),2018-2033 年(千美元)
表 115 英國生物刺激劑液體市場(按類型劃分),2018-2033 年(千美元)
表 116 英國生物刺激劑市場乾散貨,按類型劃分,2018-2033 年(千美元)
表 117 英國合成生物刺激劑在生物刺激劑市場中的份額(按劑型劃分),2018-2033 年(千美元)
表 118 英國生物刺激劑液體市場(按類型劃分),2018-2033 年(千美元)
表 119 英國生物刺激劑市場乾散貨,按類型劃分,2018-2033 年(千美元)
表 120 英國生物刺激劑市場(以劑型劃分),2018-2033 年(千美元)
表 121 英國生物刺激劑液體市場(按類型劃分),2018-2033 年(千美元)
表 122 英國生物刺激劑市場乾散貨,按類型劃分,2018-2033 年(千美元)
表 123 英國生物刺激劑市場(按活性成分劃分),2018-2033 年(千美元)
表 124 英國生物刺激劑酸基產品市場(按類型劃分),2018-2033 年(千美元)
表 125 英國生物刺激劑市場萃取物(按類型劃分),2018-2033 年(千美元)
表 126 英國生物刺激劑市場,依應用方法劃分,2018-2032 年(千元)
表 127 英國生物刺激劑市場(按作物劃分),2018-2033 年(千美元)
表 128 英國蔬果生物刺激劑市場(依水果分類),2018-2033 年(千美元)
表 129 英國蔬果生物刺激劑市場規模(依蔬菜種類劃分),2018-2033 年(千美元)
表 130 英國穀物和穀類食品在生物刺激劑市場中的份額(按類型劃分),2018-2033 年(千美元)
表 131 英國油籽和豆類在生物刺激劑市場中的份額(按類型劃分),2018-2033 年(千美元)
表 132 英國生物刺激劑市場(按最終用戶劃分),2018-2033 年(千美元)
表 133 法國生物刺激劑市場(依產地劃分),2018-2033 年(千美元)
表 134 法國生物刺激劑市場(依產地劃分),2018-2033 年(噸)
表 135 法國天然生物刺激劑在生物刺激劑市場中的份額(按劑型劃分),2018-2033 年(千美元)
表 136 法國生物刺激劑市場液體產品(按類型劃分),2018-2033 年(千美元)
表 137 法國生物刺激劑市場乾物質含量(按類型劃分),2018-2033 年(千美元)
表 138 法國合成生物刺激劑在生物刺激劑市場中的份額(按劑型劃分),2018-2033 年(千美元)
表 139 法國生物刺激劑市場液體產品(按類型劃分),2018-2033 年(千美元)
表 140 法國生物刺激劑市場乾粉含量(按類型劃分),2018-2033 年(千美元)
表 141 法國生物刺激劑市場(以劑型劃分),2018-2033 年(千美元)
表 142 法國生物刺激劑市場液體產品(按類型劃分),2018-2033 年(千美元)
表 143 法國生物刺激劑市場乾粉含量(按類型劃分),2018-2033 年(千美元)
表 144 法國生物刺激劑市場(以活性成分劃分),2018-2033 年(千美元)
表 145 法國生物刺激劑酸基市場(按類型劃分),2018-2033 年(千美元)
表 146 法國生物刺激劑市場萃取物(按類型劃分),2018-2033 年(千美元)
表 147 法國生物刺激劑市場,依應用方法劃分,2018-2032 年(千元)
表 148 法國生物刺激劑市場(以作物劃分),2018-2033 年(千美元)
表 149 法國蔬果在生物刺激劑市場中的份額(按水果分類),2018-2033 年(千美元)
表 150 法國蔬果在生物刺激劑市場中的份額(按蔬菜種類劃分),2018-2033 年(千美元)
表 151 法國穀物及穀類食品在生物刺激劑市場中的份額(按類型劃分),2018-2033 年(千美元)
表 152 法國油籽和豆類在生物刺激劑市場中的份額(按類型劃分),2018-2033 年(千美元)
表 153 法國生物刺激劑市場(以最終用戶劃分),2018-2033 年(千美元)
表 154 德國生物刺激劑市場(按產地劃分),2018-2033 年(千美元)
表 155 德國生物刺激劑市場(依產地劃分),2018-2033 年(噸)
表 156 德國天然生物刺激劑市場(以劑型劃分),2018-2033 年(千美元)
表 157 德國生物刺激劑市場液體產品(按類型劃分),2018-2033 年(千美元)
表 158 德國生物刺激劑市場乾粉含量(按類型劃分),2018-2033 年(千美元)
表 159 德國合成生物刺激劑在生物刺激劑市場中的份額(按劑型劃分),2018-2033 年(千美元)
表 160 德國生物刺激劑市場液體產品(按類型劃分),2018-2033 年(千美元)
表 161 德國生物刺激劑市場乾粉含量(按類型劃分),2018-2033 年(千美元)
表 162 德國生物刺激劑市場(以劑型劃分),2018-2033 年(千美元)
表 163 德國生物刺激劑市場液體產品(按類型劃分),2018-2033 年(千美元)
表 164 德國生物刺激劑市場乾粉含量(按類型劃分),2018-2033 年(千美元)
表 165 德國生物刺激劑市場(按活性成分劃分),2018-2033 年(千美元)
表 166 德國生物刺激劑酸基市場(按類型劃分),2018-2033 年(千美元)
表 167 德國生物刺激劑市場萃取物(按類型劃分),2018-2033 年(千美元)
表 168 德國生物刺激劑市場(按應用方法劃分),2018-2032 年(千美元)
表 169 德國生物刺激劑市場(以作物劃分),2018-2033 年(千美元)
表 170 德國蔬果在生物刺激劑市場中的份額(按水果分類),2018-2033 年(千美元)
表 171 德國蔬果在生物刺激劑市場中的份額(按蔬菜種類劃分),2018-2033 年(千美元)
表 172 德國穀物及穀類食品在生物刺激劑市場中的份額(按類型劃分),2018-2033 年(千美元)
表 173 德國油籽和豆類在生物刺激劑市場中的份額(按類型劃分),2018-2033 年(千美元)
表 174 德國生物刺激劑市場(以最終用戶劃分),2018-2033 年(千美元)
表 175 荷蘭生物刺激劑市場(依產地劃分),2018-2033 年(千美元)
表 176 荷蘭生物刺激劑市場(依產地劃分),2018-2033 年(噸)
表 177 荷蘭天然生物刺激劑市場(按形式劃分),2018-2033 年(千美元)
表 178 荷蘭生物刺激劑市場液體產品(按類型劃分),2018-2033 年(千美元)
表 179 荷蘭生物刺激劑市場乾粉銷售情況(按類型劃分),2018-2033 年(千美元)
表 180 荷蘭合成生物刺激劑在生物刺激劑市場中的份額(按劑型劃分),2018-2033 年(千美元)
表 181 荷蘭生物刺激劑市場液體產品(按類型劃分),2018-2033 年(千美元)
表 182 荷蘭生物刺激劑市場乾粉銷售情況(按類型劃分),2018-2033 年(千美元)
表 183 荷蘭生物刺激劑市場(以劑型劃分),2018-2033 年(千美元)
表 184 荷蘭生物刺激劑市場液體產品(按類型劃分),2018-2033 年(千美元)
表 185 荷蘭生物刺激劑市場乾粉銷售情況(按類型劃分),2018-2033 年(千美元)
表 186 荷蘭生物刺激劑市場(按活性成分劃分),2018-2033 年(千美元)
表 187 荷蘭生物刺激劑酸基市場(按類型劃分),2018-2033 年(千美元)
表 188 荷蘭生物刺激劑市場萃取物(按類型劃分),2018-2033 年(千美元)
表 189 荷蘭生物刺激劑市場,依應用方法劃分,2018-2032 年(千元)
表 190 荷蘭生物刺激劑市場(以作物劃分),2018-2033 年(千美元)
表 191 荷蘭生物刺激劑市場水果和蔬菜(按水果分類),2018-2033 年(千美元)
表 192 荷蘭蔬果生物刺激劑市場(依蔬菜種類劃分),2018-2033 年(千美元)
表 193 荷蘭穀物和穀類食品在生物刺激劑市場中的份額(按類型劃分),2018-2033 年(千美元)
表 194 荷蘭油籽和豆類在生物刺激劑市場中的份額(按類型劃分),2018-2033 年(千美元)
表 195 荷蘭生物刺激劑市場(按最終用戶劃分),2018-2033 年(千美元)
表 196 瑞士生物刺激劑市場(依產地劃分),2018-2033 年(千美元)
表 197 瑞士生物刺激劑市場(依產地劃分),2018-2033 年(噸)
表 198 瑞士天然生物刺激劑在生物刺激劑市場中的份額(按劑型劃分),2018-2033 年(千美元)
表 199 瑞士生物刺激劑液體市場(按類型劃分),2018-2033 年(千美元)
表 200 瑞士生物刺激劑市場乾粉含量(按類型劃分),2018-2033 年(千美元)
表 201 瑞士合成生物刺激劑在生物刺激劑市場中的份額(按劑型劃分),2018-2033 年(千美元)
表 202 瑞士生物刺激劑液體市場(按類型劃分),2018-2033 年(千美元)
表 203 瑞士生物刺激劑市場乾粉含量(按類型劃分),2018-2033 年(千美元)
表 204 瑞士生物刺激劑市場(以劑型劃分),2018-2033 年(千美元)
表 205 瑞士生物刺激劑液體市場(按類型劃分),2018-2033 年(千美元)
表 206 瑞士生物刺激劑市場乾粉含量(按類型劃分),2018-2033 年(千美元)
表 207 瑞士生物刺激劑市場(以活性成分劃分),2018-2033 年(千美元)
表 208 瑞士生物刺激劑酸基市場(按類型劃分),2018-2033 年(千美元)
表 209 瑞士生物刺激劑市場萃取物(按類型劃分),2018-2033 年(千美元)
表 210 瑞士生物刺激劑市場,依應用方法劃分,2018-2032 年(千美元)
表 211 瑞士生物刺激劑市場(以作物劃分),2018-2033 年(千美元)
表 212 瑞士蔬果在生物刺激劑市場中的份額(按水果分類),2018-2033 年(千美元)
表 213 瑞士蔬果在生物刺激劑市場中的份額(按蔬菜種類劃分),2018-2033 年(千美元)
表 214 瑞士穀物和穀類食品在生物刺激劑市場中的份額(按類型劃分),2018-2033 年(千美元)
表 215 瑞士油籽和豆類在生物刺激劑市場中的份額(按類型劃分),2018-2033 年(千美元)
表 216 瑞士生物刺激劑市場(按最終用戶劃分),2018-2033 年(千美元)
表 217 俄羅斯生物刺激劑市場(按產地劃分),2018-2033 年(千美元)
表 218 俄羅斯生物刺激劑市場(依產地劃分),2018-2033 年(噸)
表 219 俄羅斯天然生物刺激劑市場(以劑型劃分),2018-2033 年(千美元)
表 220 俄羅斯液體生物刺激劑市場(按類型劃分),2018-2033 年(千美元)
表 221 俄羅斯生物刺激劑市場乾粉含量(按類型劃分),2018-2033 年(千美元)
表 222 俄羅斯合成生物刺激劑在生物刺激劑市場中的份額(按劑型劃分),2018-2033 年(千美元)
表 223 俄羅斯液體生物刺激劑市場(按類型劃分),2018-2033 年(千美元)
表 224 俄羅斯生物刺激劑市場乾粉含量(按類型劃分),2018-2033 年(千美元)
表 225 俄羅斯生物刺激劑市場(以劑型劃分),2018-2033 年(千美元)
表 226 俄羅斯液體生物刺激劑市場(按類型劃分),2018-2033 年(千美元)
表 227 俄羅斯生物刺激劑市場乾粉含量(按類型劃分),2018-2033 年(千美元)
表 228 俄羅斯生物刺激劑市場(按活性成分劃分),2018-2033 年(千美元)
表 229 俄羅斯生物刺激劑酸基市場(按類型劃分),2018-2033 年(千美元)
表 230 俄羅斯生物刺激劑市場萃取物(按類型劃分),2018-2033 年(千美元)
表 231 俄羅斯生物刺激劑市場,依應用方法劃分,2018-2032 年(千美元)
表 232 俄羅斯生物刺激劑市場(以作物劃分),2018-2033 年(千美元)
表 233 俄羅斯蔬果在生物刺激劑市場中的份額(按水果分類),2018-2033 年(千美元)
表 234 俄羅斯蔬果在生物刺激劑市場中的份額(按蔬菜種類劃分),2018-2033 年(千美元)
表 235 俄羅斯穀物及穀類食品在生物刺激劑市場中的份額(按類型劃分),2018-2033 年(千美元)
表 236 俄羅斯油籽和豆類在生物刺激劑市場中的份額(按類型劃分),2018-2033 年(千美元)
表 237 俄羅斯生物刺激劑市場(按最終用戶劃分),2018-2033 年(千美元)
表 238 比利時生物刺激劑市場(按產地劃分),2018-2033 年(千美元)
表 239 比利時生物刺激劑市場(依產地劃分),2018-2033 年(噸)
表 240 比利時天然生物刺激劑市場(以劑型劃分),2018-2033 年(千美元)
表 241 比利時液體生物刺激劑市場(按類型劃分),2018-2033 年(千美元)
表 242 比利時生物刺激劑市場乾散貨,按類型劃分,2018-2033 年(千美元)
表 243 比利時合成生物刺激劑在生物刺激劑市場中的份額(按劑型劃分),2018-2033 年(千美元)
表 244 比利時液體生物刺激劑市場(按類型劃分),2018-2033 年(千美元)
表 245 比利時生物刺激劑市場乾粉含量(按類型劃分),2018-2033 年(千美元)
表 246 比利時生物刺激劑市場(以劑型劃分),2018-2033 年(千美元)
表 247 比利時液體生物刺激劑市場(按類型劃分),2018-2033 年(千美元)
表 248 比利時生物刺激劑市場乾粉含量(按類型劃分),2018-2033 年(千美元)
表 249 比利時生物刺激劑市場(按活性成分劃分),2018-2033 年(千美元)
表 250 比利時生物刺激劑酸基市場(按類型劃分),2018-2033 年(千美元)
表 251 比利時生物刺激劑市場萃取物(按類型劃分),2018-2033 年(千美元)
表 252 比利時生物刺激劑市場,依應用方法劃分,2018-2032 年(千元)
表 253 比利時生物刺激劑市場(以作物劃分),2018-2033 年(千美元)
表 254 比利時生物刺激劑市場水果和蔬菜(按水果分類),2018-2033 年(千美元)
表 255 比利時蔬果在生物刺激劑市場中的份額(按蔬菜種類劃分),2018-2033 年(千美元)
表 256 比利時穀物和穀類食品在生物刺激劑市場中的份額(按類型劃分),2018-2033 年(千美元)
表 257 比利時油籽和豆類在生物刺激劑市場中的份額(按類型劃分),2018-2033 年(千美元)
表 258 比利時生物刺激劑市場(以最終用戶劃分),2018-2033 年(千美元)
表 259 土耳其生物刺激劑市場(依產地劃分),2018-2033 年(千美元)
表 260 土耳其生物刺激劑市場(依產地劃分),2018-2033 年(噸)
表 261 土耳其天然生物刺激劑市場(以劑型劃分),2018-2033 年(千美元)
表 262 土耳其生物刺激劑市場液體產品(按類型劃分),2018-2033 年(千美元)
表 263 土耳其生物刺激劑市場乾貨(按類型劃分),2018-2033 年(千美元)
表 264 土耳其合成生物刺激劑在生物刺激劑市場中的份額(按劑型劃分),2018-2033 年(千美元)
表 265 土耳其生物刺激劑市場液體產品(按類型劃分),2018-2033 年(千美元)
表 266 土耳其生物刺激劑市場乾貨(按類型劃分),2018-2033 年(千美元)
表 267 土耳其生物刺激劑市場(以劑型劃分),2018-2033 年(千美元)
表 268 土耳其生物刺激劑市場液體產品(按類型劃分),2018-2033 年(千美元)
表 269 土耳其生物刺激劑市場乾貨(按類型劃分),2018-2033 年(千美元)
表 270 土耳其生物刺激劑市場(按活性成分劃分),2018-2033 年(千美元)
表 271 土耳其生物刺激劑酸基市場(按類型劃分),2018-2033 年(千美元)
表 272 土耳其生物刺激劑市場萃取物(按類型劃分),2018-2033 年(千美元)
表 273 土耳其生物刺激劑市場,依應用方法劃分,2018-2032 年(千元)
表 274 土耳其生物刺激劑市場(以作物劃分),2018-2033 年(千美元)
表 275 土耳其蔬果在生物刺激劑市場中的份額(按水果分類),2018-2033 年(千美元)
表 276 土耳其蔬果在生物刺激劑市場中的份額(按蔬菜種類劃分),2018-2033 年(千美元)
表 277 土耳其穀物及穀類食品在生物刺激劑市場中的份額(按類型劃分),2018-2033 年(千美元)
表 278 土耳其油籽和豆類在生物刺激劑市場中的份額(按類型劃分),2018-2033 年(千美元)
表 279 土耳其生物刺激劑市場(按最終用戶劃分),2018-2033 年(千美元)
表 280 波蘭生物刺激劑市場(依產地劃分),2018-2033 年(千美元)
表 281 波蘭生物刺激劑市場(依產地劃分),2018-2033 年(噸)
表 282 波蘭天然生物刺激劑市場(按形式劃分),2018-2033 年(千美元)
表 283 波蘭生物刺激劑液體市場(按類型劃分),2018-2033 年(千美元)
表 284 波蘭生物刺激劑市場乾粉含量(按類型劃分),2018-2033 年(千美元)
表 285 波蘭合成生物刺激劑在生物刺激劑市場中的份額(按劑型劃分),2018-2033 年(千美元)
表 286 波蘭生物刺激劑市場液體產品(按類型劃分),2018-2033 年(千美元)
表 287 波蘭生物刺激劑市場乾物質含量(按類型劃分),2018-2033 年(千美元)
表 288 波蘭生物刺激劑市場(以劑型劃分),2018-2033 年(千美元)
表 289 波蘭生物刺激劑市場液體產品(按類型劃分),2018-2033 年(千美元)
表 290 波蘭生物刺激劑市場乾物質含量(按類型劃分),2018-2033 年(千美元)
表 291 波蘭生物刺激劑市場(按活性成分劃分),2018-2033 年(千美元)
表 292 波蘭生物刺激劑酸基市場(按類型劃分),2018-2033 年(千美元)
表 293 波蘭生物刺激劑市場萃取物(按類型劃分),2018-2033 年(千美元)
表 294 波蘭生物刺激劑市場,依應用方法劃分,2018-2032 年(千元)
表 295 波蘭生物刺激劑市場(按作物劃分),2018-2033 年(千美元)
表 296 波蘭生物刺激劑市場水果和蔬菜(按水果分類),2018-2033 年(千美元)
表 297 波蘭蔬果在生物刺激劑市場中的份額(按蔬菜種類劃分),2018-2033 年(千美元)
表 298 波蘭穀物及穀類食品在生物刺激劑市場中的份額(按類型劃分),2018-2033 年(千美元)
表 299 波蘭油籽和豆類在生物刺激劑市場中的份額(按類型劃分),2018-2033 年(千美元)
表 300 波蘭生物刺激劑市場(按最終用戶劃分),2018-2033 年(千美元)
表 301 丹麥生物刺激劑市場(按產地劃分),2018-2033 年(千美元)
表 302 丹麥生物刺激劑市場(依產地劃分),2018-2033 年(噸)
表 303 丹麥天然生物刺激劑市場(以劑型劃分),2018-2033 年(千美元)
表 304 丹麥生物刺激劑液體市場(按類型劃分),2018-2033 年(千美元)
表 305 丹麥生物刺激劑市場(按類型劃分),2018-2033 年(千美元)
表 306 丹麥合成生物刺激劑在生物刺激劑市場中的份額(按劑型劃分),2018-2033 年(千美元)
表 307 丹麥生物刺激劑液體市場(按類型劃分),2018-2033 年(千美元)
表 308 丹麥生物刺激劑市場(按類型劃分),2018-2033 年(千美元)
表 309 丹麥生物刺激劑市場(以劑型劃分),2018-2033 年(千美元)
表 310 丹麥生物刺激劑液體市場(按類型劃分),2018-2033 年(千美元)
表 311 丹麥生物刺激劑市場(按類型劃分),2018-2033 年(千美元)
表 312 丹麥生物刺激劑市場(按活性成分劃分),2018-2033 年(千美元)
表 313 丹麥生物刺激劑酸基市場(按類型劃分),2018-2033 年(千美元)
表 314 丹麥生物刺激劑市場(按類型劃分)2018-2033 年(千美元)
表 315 丹麥生物刺激劑市場,依應用方法劃分,2018-2032 年(千元)
表 316 丹麥生物刺激劑市場(以作物劃分),2018-2033 年(千美元)
表 317 丹麥生物刺激劑市場水果和蔬菜(按水果分類),2018-2033 年(千美元)
表 318 丹麥蔬果在生物刺激劑市場中的份額(按蔬菜種類劃分),2018-2033 年(千美元)
表 319 丹麥穀物和穀類食品在生物刺激劑市場中的份額(按類型劃分),2018-2033 年(千美元)
表 320 丹麥油籽和豆類在生物刺激劑市場中的份額(按類型劃分),2018-2033 年(千美元)
表 321 丹麥生物刺激劑市場(以最終用戶劃分),2018-2033 年(千美元)
表 322 瑞典生物刺激劑市場(按產地劃分),2018-2033 年(千美元)
表 323 瑞典生物刺激劑市場(依產地劃分),2018-2033 年(噸)
表 324 瑞典天然生物刺激劑在生物刺激劑市場中的份額(按劑型劃分),2018-2033 年(千美元)
表 325 瑞典生物刺激劑市場液體產品(按類型劃分),2018-2033 年(千美元)
表 326 瑞典生物刺激劑市場乾粉含量(按類型劃分),2018-2033 年(千美元)
表 327 瑞典合成生物刺激劑在生物刺激劑市場中的份額(按劑型劃分),2018-2033 年(千美元)
表 328 瑞典生物刺激劑市場液體產品(按類型劃分),2018-2033 年(千美元)
表 329 瑞典生物刺激劑市場乾粉含量(按類型劃分),2018-2033 年(千美元)
表 330 瑞典生物刺激劑市場(以劑型劃分),2018-2033 年(千美元)
表 331 瑞典生物刺激劑市場液體產品(按類型劃分),2018-2033 年(千美元)
表 332 瑞典生物刺激劑市場乾粉含量(按類型劃分),2018-2033 年(千美元)
表 333 瑞典生物刺激劑市場(按活性成分劃分),2018-2033 年(千美元)
表 334 瑞典生物刺激劑酸基市場(按類型劃分),2018-2033 年(千美元)
表 335 瑞典生物刺激劑市場萃取物(按類型劃分),2018-2033 年(千美元)
表 336 瑞典生物刺激劑市場,依應用方法劃分,2018-2032 年(千元)
表 337 瑞典生物刺激劑市場(以作物劃分),2018-2033 年(千美元)
表 338 瑞典蔬果在生物刺激劑市場中的份額(按水果分類),2018-2033 年(千美元)
表 339 瑞典蔬果在生物刺激劑市場中的份額(按蔬菜種類劃分),2018-2033 年(千美元)
表 340 瑞典穀物和穀類食品在生物刺激劑市場中的份額(按類型劃分),2018-2033 年(千美元)
表 341 瑞典油籽和豆類在生物刺激劑市場中的份額(按類型劃分),2018-2033 年(千美元)
表 342 瑞典生物刺激劑市場(以最終用戶劃分),2018-2033 年(千美元)
表 343 挪威生物刺激劑市場(依產地劃分),2018-2033 年(千美元)
表 344 挪威生物刺激劑市場(依產地劃分),2018-2033 年(噸)
表 345 挪威天然生物刺激劑在生物刺激劑市場中的份額(按劑型劃分),2018-2033 年(千美元)
表 346 挪威液體生物刺激劑市場(按類型劃分),2018-2033 年(千美元)
表 347 挪威生物刺激劑市場乾粉含量(按類型劃分),2018-2033 年(千美元)
表 348 挪威合成生物刺激劑在生物刺激劑市場中的份額(按劑型劃分),2018-2033 年(千美元)
表 349 挪威液體生物刺激劑市場(按類型劃分),2018-2033 年(千美元)
表 350 挪威生物刺激劑市場乾粉含量(按類型劃分),2018-2033 年(千美元)
表 351 挪威生物刺激劑市場(以劑型劃分),2018-2033 年(千美元)
表 352 挪威液體生物刺激劑市場(按類型劃分),2018-2033 年(千美元)
表 353 挪威生物刺激劑市場乾粉含量(按類型劃分),2018-2033 年(千美元)
表 354 挪威生物刺激劑市場(以活性成分劃分),2018-2033 年(千美元)
表 355 挪威生物刺激劑酸基市場(按類型劃分),2018-2033 年(千美元)
表 356 挪威生物刺激劑市場萃取物(按類型劃分),2018-2033 年(千美元)
表 357 挪威生物刺激劑市場,依應用方法劃分,2018-2032 年(千元)
表 358 挪威生物刺激劑市場(以作物劃分),2018-2033 年(千美元)
表 359 挪威蔬果在生物刺激劑市場中的份額(按水果分類),2018-2033 年(千美元)
表 360 挪威蔬果在生物刺激劑市場中的份額(按蔬菜種類劃分),2018-2033 年(千美元)
表 361 挪威穀物和穀類食品在生物刺激劑市場中的份額(按類型劃分),2018-2033 年(千美元)
表 362 挪威油籽和豆類在生物刺激劑市場中的份額(按類型劃分),2018-2033 年(千美元)
表 363 挪威生物刺激劑市場(以最終用戶劃分),2018-2033 年(千美元)
表 364 歐洲其他地區生物刺激劑市場(按產地劃分),2018-2033 年(千美元)
表 365 歐洲其他地區生物刺激劑市場(依產地劃分),2018-2033 年(噸)
表 366 歐洲其他地區天然生物刺激劑在生物刺激劑市場中的份額(按劑型劃分),2018-2033 年(千美元)
表 367 歐洲其他地區生物刺激劑液體市場(按類型劃分),2018-2033 年(千美元)
表 368 歐洲其他地區生物刺激劑市場乾物質含量(按類型劃分),2018-2033 年(千美元)
表 369 歐洲其他地區合成生物刺激劑在生物刺激劑市場中的份額(按劑型劃分),2018-2033 年(千美元)
表 370 歐洲其他地區生物刺激劑市場液體產品(按類型劃分),2018-2033 年(千美元)
表 371 歐洲其他地區生物刺激劑市場乾物質含量(按類型劃分),2018-2033 年(千美元)
表 372 歐洲其他地區生物刺激劑市場(以劑型劃分),2018-2033 年(千美元)
表 373 歐洲其他地區生物刺激劑液體市場(按類型劃分),2018-2033 年(千美元)
表 374 歐洲其他地區生物刺激劑市場乾物質含量(按類型劃分),2018-2033 年(千美元)
表 375 歐洲其他地區生物刺激劑市場(按活性成分劃分),2018-2033 年(千美元)
表 376 歐洲其他地區生物刺激劑酸基市場(按類型劃分),2018-2033 年(千美元)
表 377 歐洲其他地區生物刺激劑市場萃取物(按類型劃分),2018-2033 年(千美元)
表 378 歐洲其他地區生物刺激劑市場(按應用方法劃分),2018-2032 年(千美元)
表 379 歐洲其他地區生物刺激劑市場(按作物劃分),2018-2033 年(千美元)
表 380 歐洲其他地區蔬果在生物刺激劑市場中的份額(按水果分類),2018-2033 年(千美元)
表 381 歐洲其他地區蔬果在生物刺激劑市場中的份額(按蔬菜種類劃分),2018-2033 年(千美元)
表 382 歐洲其他地區穀物和穀類食品在生物刺激劑市場中的份額(按類型劃分),2018-2033 年(千美元)
表 383 歐洲其他地區油籽和豆類在生物刺激劑市場中的份額(按類型劃分),2018-2033 年(千美元)
表 384 歐洲其他地區生物刺激劑市場(按最終用戶劃分),2018-2033 年(千美元)
图片列表
圖 1 歐洲生物刺激劑市場:細分
圖 2 歐洲生物刺激劑市場:數據三角驗證
圖3 歐洲生物刺激劑市場:DROC分析
圖 4 歐洲生物刺激劑市場:歐洲與區域市場分析
圖5 歐洲生物刺激劑市場:公司研究分析
圖 6 歐洲生物刺激劑市場:訪談人口統計數據
圖 7 歐洲生物刺激劑市場:DBMR 市場地位矩陣
圖 8 歐洲生物刺激劑市場:供應商份額分析
圖 9 歐洲生物刺激劑市場:多元建模
圖 10 歐洲生物刺激劑市場:類型時間線曲線
圖 11 歐洲生物刺激劑市場:終端用戶覆蓋率圖
圖 12 歐洲生物刺激劑市場:細分
圖 13 歐洲生物刺激劑市場按產地劃分為兩個部分(2025 年)
圖 14 歐洲生物刺激劑市場:執行摘要
圖 15 戰略決策
圖16顯示,乾旱、洪水和熱浪等氣候相關作物脅迫事件發生頻率的增加,正促使農民採用生物刺激劑來維持作物產量和質量,預計將推動2026年至2033年預測期內歐洲生物刺激劑市場的發展。
圖 17 預測,到 2026 年和 2033 年,原產地細分市場將佔據歐洲生物刺激劑市場的最大份額。
圖18 波特五力分析
圖 19 定價分析(2018-2033 年)
圖 20 申請人專利分析
圖 21 按國家劃分的專利分析
圖 22 按年份劃分的專利分析
圖 23 公司評估象限
圖 24 歐洲生物刺激劑市場的驅動因素、限制因素、機會與挑戰
圖 25 歐洲生物刺激劑市場:依產地劃分,2025 年
圖 26 歐洲生物刺激劑市場:以劑型劃分,2025 年
圖 27 歐洲生物刺激劑市場:依活性成分劃分,2025 年
圖 28 歐洲生物刺激劑市場:依作物劃分,2025 年
圖 29 歐洲生物刺激劑市場:依應用方法劃分,2024 年
圖 30 歐洲生物刺激劑市場:依最終用戶劃分,2025 年
圖 31 歐洲生物刺激劑市場概覽
圖 32 歐洲生物刺激劑市場:公司佔有率(2025 年預測,%)
研究方法
数据收集和基准年分析是使用具有大样本量的数据收集模块完成的。该阶段包括通过各种来源和策略获取市场信息或相关数据。它包括提前检查和规划从过去获得的所有数据。它同样包括检查不同信息源中出现的信息不一致。使用市场统计和连贯模型分析和估计市场数据。此外,市场份额分析和关键趋势分析是市场报告中的主要成功因素。要了解更多信息,请请求分析师致电或下拉您的询问。
DBMR 研究团队使用的关键研究方法是数据三角测量,其中包括数据挖掘、数据变量对市场影响的分析和主要(行业专家)验证。数据模型包括供应商定位网格、市场时间线分析、市场概览和指南、公司定位网格、专利分析、定价分析、公司市场份额分析、测量标准、全球与区域和供应商份额分析。要了解有关研究方法的更多信息,请向我们的行业专家咨询。
可定制
Data Bridge Market Research 是高级形成性研究领域的领导者。我们为向现有和新客户提供符合其目标的数据和分析而感到自豪。报告可定制,包括目标品牌的价格趋势分析、了解其他国家的市场(索取国家列表)、临床试验结果数据、文献综述、翻新市场和产品基础分析。目标竞争对手的市场分析可以从基于技术的分析到市场组合策略进行分析。我们可以按照您所需的格式和数据样式添加您需要的任意数量的竞争对手数据。我们的分析师团队还可以为您提供原始 Excel 文件数据透视表(事实手册)中的数据,或者可以帮助您根据报告中的数据集创建演示文稿。

