Europe Electronic Components Market
市场规模(十亿美元)
CAGR :
% 
 USD
51,222.00 Million
USD
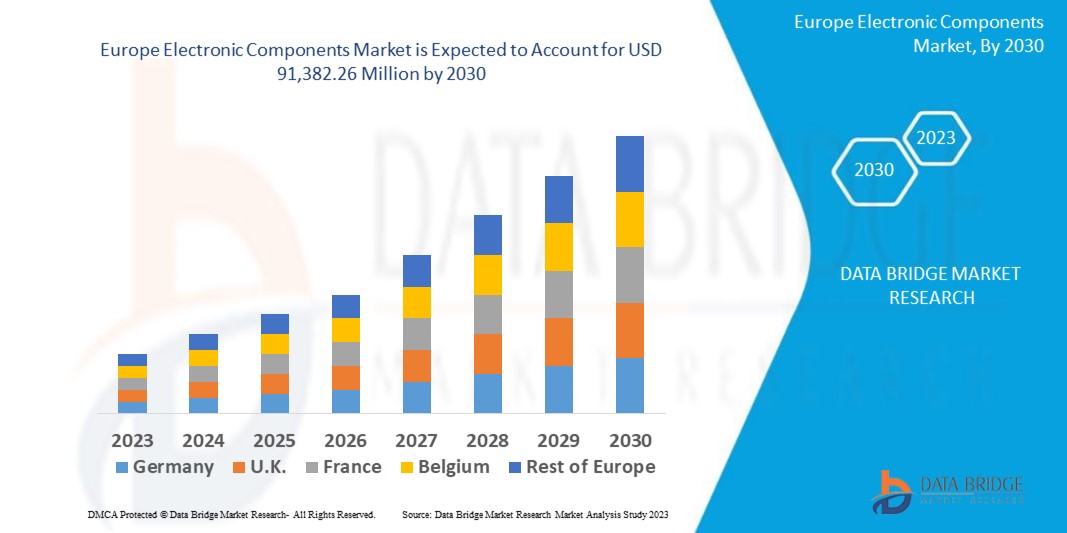
91,382.26 Million
2022
2030
USD
51,222.00 Million
USD
91,382.26 Million
2022
2030
| 2023 –2030 | |
| USD 51,222.00 Million | |
| USD 91,382.26 Million | |
| % | |
欧洲电子元件技术市场,按元件类型(处理器、电机、电池、微控制器、集成电路 (IC)、断路器、变压器、电容器、二极管、电阻器、电感器、开关、继电器、保险丝等)、商品类型(棕色家电、白色家电、小型白色家电等)、产品类型(有源、无源、机电元件等)、最终用途类型(消费电子、网络和电信、制造、汽车、航空航天和国防、医疗保健等)划分 - 行业趋势和预测到 2030 年。
欧洲电子元件技术市场分析及规模
欧洲拥有强大的汽车制造业,电子元件在现代汽车中发挥着至关重要的作用。对电动汽车(EV)、自动驾驶系统、先进安全功能和信息娱乐系统的需求不断增长,推动了汽车行业对电子元件的需求。
Data Bridge Market Research 分析,欧洲电子元件市场在 2022 年为 512.22 亿美元,预计到 2030 年将达到 913.8226 亿美元,预计在 2023-2030 年预测期内的复合年增长率为 7.7%。这表明了市场价值。“处理器”在欧洲电子元件市场类型细分市场中占据主导地位,因为它们通常被称为电子设备的“大脑”。它们是负责执行指令和管理任务的核心计算单元,使它们成为几乎所有电子设备中必不可少的组件。除了对市场价值、增长率、细分、地理覆盖范围和主要参与者等市场情景的洞察外,Data Bridge Market Research 策划的市场报告还包括深入的专家分析、按地理代表的公司生产和产能、分销商和合作伙伴的网络布局、详细和更新的价格趋势分析以及供应链和需求的缺口分析。
欧洲电子元件市场范围和细分
|
报告指标 |
细节 |
|
预测期 |
2023 至 2030 年 |
|
基准年 |
2022 |
|
历史岁月 |
2021 (可定制为 2015-2020) |
|
定量单位 |
收入(百万美元)、销量(单位)、定价(美元) |
|
涵盖的领域 |
组件类型(处理器、电机、电池、微控制器、集成电路 (IC)、断路器、变压器、电容器、二极管、电阻器、电感器、开关、继电器、保险丝等)、商品类型(棕色家电、白色家电、小型白色家电等)、产品类型(有源、无源、机电元件等)、最终用途类型(消费电子、网络和电信、制造、汽车、航空航天和国防、医疗保健等)、 |
|
覆盖国家 |
德国、法国、英国、意大利、西班牙、荷兰、瑞士、俄罗斯、土耳其、比利时和欧洲其他地区 |
|
涵盖的市场参与者 |
Schurter(英国)、英飞凌科技股份公司(英国)、恩智浦半导体公司(英国) |
|
市场机会 |
|
市场定义
电子元件或 IVR 是指允许人类与自动电话系统交互的技术。显然,它接收电话输入和键盘选择音的组合,基本上以语音、电子邮件、传真、回电和其他联系方式的形式对查询提供适当的响应。电子元件的主要目的是与呼叫者互动,收集信息并将来电转接给适当的接收者。
欧洲电子元件市场动态
驱动程序
- 汽车工业
欧洲拥有强大的汽车制造业,电子元件在现代汽车中发挥着至关重要的作用。对电动汽车 (EV)、自动驾驶系统、先进安全功能和信息娱乐系统的需求不断增长,推动了汽车行业对电子元件的需求。
- 工业自动化
工业自动化和工业 4.0 计划在欧洲兴起。电子元件对于智能工厂、机器人和过程自动化系统的发展至关重要,从而导致对传感器、微控制器和工业通信模块等元件的需求增加。
机会
- 先进的汽车电子
欧洲汽车行业正在向电动汽车 (EV)、联网汽车和自动驾驶技术转型。这一转变为电子元件制造商提供了提供先进传感器、电力电子和连接解决方案的机会。
- 工业物联网 (IIoT)
工业 4.0 和工业物联网 (IIoT) 在欧洲日益受到关注。这为传感器、执行器和通信模块等电子元件提供了实现智能制造和自动化的机会。
克制/挑战
- 供应链中断
欧洲电子元件市场严重依赖全球供应链。COVID-19 疫情等事件造成的中断凸显了供应链中的脆弱性,包括短缺、物流挑战和交货时间不确定性
本欧洲电子元件市场报告详细介绍了最新发展、贸易法规、进出口分析、生产分析、价值链优化、市场份额、国内和本地市场参与者的影响,分析了新兴收入领域的机会、市场法规的变化、战略市场增长分析、市场规模、类别市场增长、应用领域和主导地位、产品批准、产品发布、地域扩展、市场技术创新。如需获取有关运营改进和运营维护市场中的工业维护服务的更多信息,请联系数据桥市场研究部门获取分析师简报,我们的团队将帮助您做出明智的市场决策,以实现市场增长。
原材料短缺和运输延误的影响和当前市场状况
Data Bridge Market Research 提供高水平的市场分析,并通过考虑原材料短缺和运输延误的影响和当前市场环境来提供信息。这意味着评估战略可能性、制定有效的行动计划并协助企业做出重要决策。
除了标准报告外,我们还提供从预测的运输延迟、按区域划分的分销商映射、商品分析、生产分析、价格映射趋势、采购、类别绩效分析、供应链风险管理解决方案、高级基准测试等角度对采购层面的深入分析,以及其他采购和战略支持服务。
经济放缓对产品定价和供应的预期影响
当经济活动放缓时,行业开始受到影响。DBMR 提供的市场洞察报告和情报服务考虑了经济衰退对产品定价和可获得性的预测影响。借助这些,我们的客户通常可以领先竞争对手一步,预测他们的销售额和收入,并估算他们的盈亏支出。
最新动态
- 2021 年 4 月,SCHURTER 推出了 DKIV-1 系列,这是一款电流补偿扼流圈,专为电路板上的单相大电流应用而设计。这款扼流圈小巧轻便。新产品将有助于该公司扩大其产品组合并在市场上占有一席之地
- 2020 年 11 月,恩智浦半导体宣布与亚马逊网络服务 (AWS) 合作,以扩大其联网汽车的机会。通过此次合作,该公司将为其下一代汽车提供安全的边缘到云端计算解决方案。这将有助于该公司加速其数字化转型计划并扩大其客户群
欧洲电子元件范围
欧洲电子元件市场根据元件、功能和最终用户进行细分。这些细分市场之间的增长情况将帮助您分析行业中增长缓慢的细分市场,并为用户提供有价值的市场概览和市场洞察,帮助他们做出战略决策,确定核心市场应用。
组件类型
- 处理器
- 电机
- 电池
- 微控制器
- 集成电路(IC)
- 断路器
- 变压器
- 电容器
- 二极管
- 电阻器
- 电感器
- 开关
- 继电器
- 保险丝
- 其他的
商品类型
- 棕色商品
- 白色家电
- 小型白色家电
- 其他的
产品类型
- 积极的
- 被动的
- 机电元件
- 其他的
最终用途类型
- 消费电子产品
- 网络和电信
- 制造业
- 汽车
- 航空航天和国防
- 卫生保健
- 其他的
欧洲电子元件市场区域分析/见解
欧洲电子元件市场报告涵盖的国家包括德国、法国、英国、意大利、西班牙、荷兰、瑞士、俄罗斯、土耳其、比利时和欧洲其他地区。
在 2023-2030 年的预测期内,德国在欧洲电子元件市场占据主导地位,因为该地区电子元件技术的采用率很高。此外,预计在 2023-2030 年的预测期内,为改进技术而提高的研发能力将进一步加速扩张。
报告的国家部分还提供了影响单个市场因素和国内市场监管变化,这些因素和变化会影响市场的当前和未来趋势。下游和上游价值链分析、技术趋势和波特五力分析、案例研究等数据点是用于预测单个国家市场情景的一些指标。此外,在提供国家数据的预测分析时,还考虑了欧洲品牌的存在和可用性以及它们因来自本地和国内品牌的激烈或稀缺竞争而面临的挑战、国内关税和贸易路线的影响。
竞争格局和欧洲电子元件市场份额分析
The Europe electronic components market competitive landscape provides details by competitor. Details included are company overview, company financials, revenue generated, market potential, investment in research and development, new market initiatives, North America presence, production sites and facilities, production capacities, company strengths and weaknesses, product launch, product width and breadth, and application dominance. The above data points provided are only related to the companies' focus related to the Europe electronic components market.
Some of the major players operating in the Europe electronic components market are:
- Schurter (U.K)
- Infineon Technology AG (U.K.)
- NXP Semiconductors (U.K.)
SKU-

目录
- introduction
- OBJECTIVES OF THE STUDY
- MARKET DEFINITION
- OVERVIEW OF Europe Electronic Components Market
- Currency and Pricing
- LIMITATIONS
- MARKETS COVERED
- MARKET SEGMENTATION
- MARKETS COVERED
- geographicAL scope
- years considered for the study
- DBMR TRIPOD DATA VALIDATION MODEL
- primary interviews with key opinion leaders
- DBMR MARKET POSITION GRID
- vendor share analysis
- Multivariate Modeling
- component type timeline curve
- secondary sourcEs
- assumptions
- EXECUTIVE SUMMARY
- premium insights
- market overview
- drivers
- INCREASE IN DEMAND FOR Smart Electronic Devices
- rISE IN PREFERENCE FOR MINIATURIZED DESIGN COMPONENT
- RISE IN ADOPTION OF ELECTRONIC COMPONENTS IN NUMEROUS INDUSTRIES
- RISE IN DEMAND FOR THE SOFT ELECTRONIC COMPONENTS
- restraints
- RISE IN METAL PRICES HAMPERS THE OVERALL COMPONENT PRODUCTION COSTS
- CHANGE IN ECONOMIC AND POLITICAL OUTLOOK
- OPPORTUNITIES
- INCREASE IN USAGE OF IOT
- INCREASE IN VARIOUS STRATEGIC DECISIONS SUCH AS PARTNERSHIPS AND MERGERS
- RISE IN ADOPTION OF ELECTRONIC COMPONENTS IN APPLICATIONS SUCH AS SATELLITE AND SPACE TECHNOLOGY
- RISE IN AUTOMATION IN THE AUTOMOTIVE SECTOR
- ADVENT OF DIFFERENT CONNECTED TECHNOLOGIES WITH ENHANCED EFFICIENCY
- CHALLENGES
- RISE IN DEPENDENCY OF MANUFACTURER ON DIFFERENT SUPPLIERS
- SHORTAGE IN SUPPLY OF ELECTRONIC COMPONENTS
- IMPACT OF COVID-19 ON THE EUROPE ELECTRONIC COMPONENTS MARKET
- ANALYSIS ON IMPACT OF COVID-19 ON THE MARKET
- AFTERMATH OF COVID-19 AND GOVERNMENT INITIATIVE TO BOOST THE MARKET
- STRATEGIC DECISIONS FOR MANUFACTURERS AFTER COVID-19 TO GAIN COMPETITIVE MARKET SHARE
- IMPACT ON DEMAND
- IMPACT ON SUPPLY CHAIN
- CONCLUSION
- Europe Electronic Components market, BY Component Type
- overview
- Processors
- Motors
- Battery
- microcontroller
- integrated circuit (ic)
- circuit breakers
- transformers
- Capacitors
- Paper and Film
- Ceramic
- Aluminum
- Tantalum
- Supercapacitor
- others
- Diodes
- Power diode
- Zener Diode
- schottky diode
- Rectifier diode
- small signal switching diode
- rf diode
- others
- resistors
- Inductors
- switches
- Single Pole Double Throw (SPDT)
- Single Pole Single Throw (SPST)
- Double Pole Double Throw (DPDT)
- Double Pole Single Throw (DPST)
- Relays
- Fuse
- others
- Europe Electronic Components market, BY Commodities Type
- overview
- Brown Goods
- By Type
- Personal Computers
- TV
- DVD Players
- cd players
- VCRs
- others
- Electronic Components
- Processors
- Microcontrollers
- Integrated Circuits (IC)
- Battery
- motors
- vacuum tubes
- others
- By Material
- Metal
- Gold
- Palladium
- Platinum
- Copper
- Tin
- Silver
- Nickel
- Aluminum
- Cobalt
- Zinc
- Tantalum
- Neodymium
- Plastic
- By Type
- Thermoset
- Thermoplastic
- White goods
- By type
- refrigerators
- washing machines
- air conditioners
- microwave Ovens
- dishwashers
- clothes dryers
- water heaters
- freezers
- kitchen stoves
- induction cookers
- drying cabinets
- trash compactors
- By Electronic Component
- motors
- Microcontrollers
- Integrated Circuits (IC)
- processors
- battery
- vacuum tubes
- others
- By Material
- Metal
- Gold
- Palladium
- Platinum
- Copper
- Aluminum
- Tin
- Silver
- Nickel
- Tantalum
- Neodymium
- Cobalt
- Zinc
- Plastic
- Thermoset
- Thermoplastic
- small white goods
- By Type
- FOOD PROCESSORS
- Toasters
- HAIRDRYERS
- KETTLES
- OTHERS
- By ELECTRONIC COMPONENTS
- microcontrollers
- Integrated Circuits (IC)
- Motors
- processors
- battery
- vacuum tubes
- others
- BY MATERIAL
- Metal
- Gold
- Palladium
- Platinum
- Copper
- Tin
- Silver
- Nickel
- Aluminum
- Tantalum
- Cobalt
- Neodymium
- Zinc
- Plastic
- THERMOSET
- Thermoplastic
- others
- Europe Electronic Components market, BY product type
- overview
- Active
- passive
- electromechanical components
- others
- Europe Electronic Components market, BY End Use TYPE
- overview
- Consumer Electronics
- Networking & Telecommunication
- manufacturing
- Automotive
- Aerospace & Defense
- healthcare
- others
- Europe electronic components market, by REGION
- EUROPE
- GERMANY
- FRANCE
- U.K.
- ITALY
- SPAIN
- NETHERLANDS
- SWITZERLAND
- RUSSIA
- TURKEY
- BELGIUM
- REST OF EUROPE
- EUROPE Electronic components market: COMPANY landscape
- company share analysis: EUROPE
- company share analysis: NORTH AMERICA
- company share analysis: EUROPE
- company share analysis: Asia-pacific
- swot analysis
- company profile
- INTEL CORPORATION
- COMPANY SNAPSHOT
- REVENUE ANALYSIS
- company share analysis
- PRODUCT PORTFOLIO
- RECENT DEVELOPMENTS
- QUALCOMM TECHNOLOGIES, INC.
- COMPANY SNAPSHOT
- REVENUE ANALYSIS
- company share analysis
- PRODUCT PORTFOLIO
- RECENT DEVELOPMENTS
- BROADCOM
- COMPANY SNAPSHOT
- REVENUE ANALYSIS
- company share analysis
- PRODUCT PORTFOLIO
- RECENT DEVELOPMENTS
- NXP SEMICONDUCTORS
- COMPANY SNAPSHOT
- REVENUE ANALYSIS
- company share analysis
- PRODUCT PORTFOLIO
- RECENT DEVELOPMENTS
- ADVANCED MICRO DEVICES, INC.
- COMPANY SNAPSHOT
- REVENUE ANALYSIS
- PRODUCT PORTFOLIO
- RECENT DEVELOPMENTS
- ANALOG DEVICES INC.
- COMPANY SNAPSHOT
- REVENUE ANALYSIS
- PRODUCT PORTFOLIO
- RECENT DEVELOPMENTS
- HITACHI HIGH-TECH CORPORATION
- COMPANY SNAPSHOT
- REVENUE ANALYSIS
- PRODUCT PORTFOLIO
- RECENT DEVELOPMENTS
- INFINEON TECHNOLOGIES AG
- COMPANY SNAPSHOT
- REVENUE ANALYSIS
- PRODUCT PORTFOLIO
- RECENT DEVELOPMENTS
- KYOCERA CORPORATION
- COMPANY SNAPSHOT
- REVENUE ANALYSIS
- PRODUCT PORTFOLIO
- RECENT DEVELOPMENTS
- MAXIM INTEGRATED
- COMPANY SNAPSHOT
- REVENUE ANALYSIS
- PRODUCT PORTFOLIO
- RECENT DEVELOPMENTS
- MEDIATEK INC.
- COMPANY SNAPSHOT
- REVENUE ANALYSIS
- PRODUCT PORTFOLIO
- RECENT DEVELOPMENTS
- MICROCHIP TECHNOLOGY INC.
- COMPANY SNAPSHOT
- REVENUE ANALYSIS
- PRODUCT PORTFOLIO
- RECENT DEVELOPMENTS
- MONOLITHIC POWER SYSTEMS, INC.
- COMPANY SNAPSHOT
- REVENUE ANALYSIS
- PRODUCT PORTFOLIO
- RECENT DEVELOPMENTS
- REWELL INDUSTRIAL CO., LTD
- COMPANY SNAPSHOT
- PRODUCT PORTFOLIO
- RECENT DEVELOPMENTS
- SAMSUNG ELECTRONICS CO., LTD.
- COMPANY SNAPSHOT
- REVENUE ANALYSIS
- PRODUCT PORTFOLIO
- RECENT DEVELOPMENTS
- SCHURTER
- COMPANY SNAPSHOT
- PRODUCT PORTFOLIO
- RECENT DEVELOPMENTS
- SK HYNIX INC.
- COMPANY SNAPSHOT
- REVENUE ANALYSIS
- PRODUCT PORTFOLIO
- RECENT DEVELOPMENTS
- TEXAS INSTRUMENTS INCORPORATED
- COMPANY SNAPSHOT
- REVENUE ANALYSIS
- PRODUCT PORTFOLIO
- RECENT DEVELOPMENTS
- TOSHIBA CORPORATION
- COMPANY SNAPSHOT
- REVENUE ANALYSIS
- PRODUCT PORTFOLIO
- RECENT DEVELOPMENTS
- WATTS
- COMPANY SNAPSHOT
- PRODUCT PORTFOLIO
- RECENT DEVELOPMENT
- questionnaire
- related reports
表格列表
TABLE 1 Europe Electronic Components Market, BY Component TYPE, 2019-2028 (USD Million)
TABLE 2 Europe Processors in Electronic Components Market, By Region, 2019-2028 (USD Million)
TABLE 3 Europe motors in Electronic Components Market, By Region, 2019-2028 (USD Million)
TABLE 4 Europe Battery in Electronic Components Market, By Region, 2019-2028 (USD Million)
TABLE 5 Europe microcontroller in Electronic Components Market, By Region, 2019-2028 (USD MILLION)
TABLE 6 Europe Integrated Circuit (IC) in Electronic Components Market, By Region, 2019-2028 (USD MILLION)
TABLE 7 Europe Circuit breakers in Electronic Components Market, By Region, 2019-2028 (USD MILLION)
TABLE 8 Europe transformers in Electronic Components Market, By Region, 2019-2028 (USD MILLION)
TABLE 9 Europe capacitors in Electronic Components Market, By Region, 2019-2028 (USD MILLION)
TABLE 10 Europe Capacitors in Electronic Components Market, By Type, 2019-2028 (USD Million)
TABLE 11 Europe Diodes in Electronic Components Market, By Region, 2019-2028 (USD MILLION)
TABLE 12 Europe diodes in Electronic Components Market, By Type, 2019-2028 (USD Million)
TABLE 13 Europe Power diode in Electronic Components Market, By Type, 2019-2028 (USD Million)
TABLE 14 Europe resistors in Electronic Components Market, By Region, 2019-2028 (USD Million)
TABLE 15 Europe Inductors in Electronic Components Market, By Region, 2019-2028 (USD MILLION)
TABLE 16 Europe Switches in Electronic Components Market, By Region, 2019-2028 (USD MILLION)
TABLE 17 Europe diodes in Electronic Components Market, By Type, 2019-2028 (USD Million)
TABLE 18 Europe Relays in Electronic Components Market, By Region, 2019-2028 (USD MILLION)
TABLE 19 Europe Fuse in Electronic Components Market, By Region, 2019-2028 (USD MILLION)
TABLE 20 Europe Others in Electronic Components Market, By Region, 2019-2028 (USD MILLION)
TABLE 21 Europe Electronic Components Market, BY Commodities type, 2019-2028 (USD million)
TABLE 22 Europe brown goods in Electronic Components Market, By Region, 2019-2028, (USD MILLION)
TABLE 23 Europe Brown Goods in Electronic Components Market, By Type, 2019-2028 (USD MILLION)
TABLE 24 Europe Brown Goods in Electronic Components Market, By Electronic Components, 2019-2028 (USD MILLION)
TABLE 25 Europe Brown Goods in Electronic Components Market, By material, 2019-2028 (USD MILLION)
TABLE 26 Europe Metal in Electronic Components Market, By type, 2019-2028 (USD MILLION)
TABLE 27 Europe plastic in Electronic Components Market, By type, 2019-2028 (USD MILLION)
TABLE 28 Europe white goods in Electronic Components Market, By Region, 2019-2028, (USD MILLION)
TABLE 29 Europe white Goods in Electronic Components Market, By type, 2019-2028 (USD MILLION)
TABLE 30 Europe white Goods in Electronic Components Market, By Electronic Components, 2019-2028 (USD MILLION)
TABLE 31 Europe White Goods in Electronic Components Market, By Material, 2019-2028 (USD MILLION)
TABLE 32 Europe Metal in Electronic Components Market, By type, 2019-2028 (USD MILLION)
TABLE 33 Europe plastic in Electronic Components Market, By type, 2019-2028 (USD MILLION)
TABLE 34 Europe Small White Goods in Electronic Components Market, By Region, 2019-2028, (USD MILLION)
TABLE 35 Europe Small white Goods in Electronic Components Market, By type, 2019-2028 (USD MILLION)
TABLE 36 Europe small white Goods in Electronic Components Market, By Electronic Components, 2019-2028 (USD MILLION)
TABLE 37 Europe small White Goods in Electronic Components Market, By Material, 2019-2028 (USD MILLION)
TABLE 38 Europe METAL in Electronic Components Market, By type, 2019-2028 (USD MILLION)
TABLE 39 Europe plastic in Electronic Components Market, By type, 2019-2028 (USD MILLION)
TABLE 40 Europe others in Electronic Components Market, By Region, 2019-2028 (USD MILLION)
TABLE 41 Europe Electronic Components Market, BY product type, 2019-2028 (USD Million)
TABLE 42 Europe Active in Electronic Components Market, By Region, 2019-2028 (USD MILLION)
TABLE 43 Europe passive in Electronic Components Market, By Region, 2019-2028 (USD Million)
TABLE 44 Europe Electromechanical Components in Electronic Components Market, By Region, 2019-2028 (USD Million)
TABLE 45 Europe Others in Electronic Components Market, By Region, 2019-2028 (USD Million)
TABLE 46 Europe Electronic Components Market, BY End Use type, 2019-2028 (USD Million)
TABLE 47 Europe Consumer Electronics in Electronic Components Market, By Region, 2019-2028 (USD MILLION)
TABLE 48 Europe NETWORKING & TELECOMMUNICATION in Electronic Components Market, By Region, 2019-2028 (USD MILLION)
TABLE 49 Europe manufacturing in Electronic Components Market, By Region, 2019-2028 (USD MILLION)
TABLE 50 Europe automotive in Electronic Components Market, By Region, 2019-2028 (USD MILLION)
TABLE 51 Europe aerospace & DEFENSE in Electronic Components Market, By Region, 2019-2028 (USD MILLION)
TABLE 52 Europe healthcare in Electronic Components Market, By Region, 2019-2028 (USD MILLION)
TABLE 53 Europe others in Electronic Components Market, By Region, 2019-2028 (USD MILLION)
TABLE 54 Europe electronic component market, By Country, 2019-2028 (USD million)
TABLE 55 EUROPE electronic component market, By Component Type, 2019-2028 (USD million)
TABLE 56 Europe Capacitors in electronic component market, By Type, 2019-2028 (USD million)
TABLE 57 Europe Diode in electronic component market, By Type, 2019-2028 (USD million)
TABLE 58 Europe Power Diode in electronic component market, By Type, 2019-2028 (USD million)
TABLE 59 Europe Switches in electronic component market, By Type, 2019-2028 (USD million)
TABLE 60 Europe Electronic Component market, By Commodities Type, 2019-2028 (USD million)
TABLE 61 Europe Brown Goods in electronic component market, By Type, 2019-2028 (USD million)
TABLE 62 Europe Brown Goods in electronic component market, By Electronic Component, 2019-2028 (USD million)
TABLE 63 Europe Brown Goods in Electronic Component market, By Material, 2019-2028 (USD million)
TABLE 64 Europe Metal in electronic component market, By Type, 2019-2028 (USD million)
TABLE 65 Europe Plastic in electronic component market, By Type, 2019-2028 (USD million)
TABLE 66 Europe White Goods in electronic component market, By Type, 2019-2028 (USD million)
TABLE 67 Europe White Goods in electronic component market, By Electronic Component, 2019-2028 (USD million)
TABLE 68 Europe White Goods in Electronic Component market, By Material, 2019-2028 (USD million)
TABLE 69 Europe Metal in electronic component market, By Type, 2019-2028 (USD million)
TABLE 70 Europe Plastic in electronic component market, By Type, 2019-2028 (USD million)
TABLE 71 Europe Small White Goods in electronic component market, By Type, 2019-2028 (USD million)
TABLE 72 Europe Small White Goods in electronic component market, By Electronic Component, 2019-2028 (USD million)
TABLE 73 Europe Small White Goods in Electronic Component market, By Material, 2019-2028 (USD million)
TABLE 74 Europe Metal in electronic component market, By Type, 2019-2028 (USD million)
TABLE 75 Europe Plastic in electronic component market, By Type, 2019-2028 (USD million)
TABLE 76 Europe electronic component market, By Product Type, 2019-2028 (USD million)
TABLE 77 EUROPE electronic component market, By End Use Type, 2019-2028 (USD million)
TABLE 78 GERMANY electronic component market, By Component Type, 2019-2028 (USD million)
TABLE 79 Germany Capacitors in electronic component market, By Type, 2019-2028 (USD million)
TABLE 80 Germany Diode in electronic component market, By Type, 2019-2028 (USD million)
TABLE 81 Germany Power Diode in electronic component market, By Type, 2019-2028 (USD million)
TABLE 82 Germany Switches in electronic component market, By Type, 2019-2028 (USD million)
TABLE 83 Germany Electronic Component market, By Commodities Type, 2019-2028 (USD million)
TABLE 84 Germany Brown Goods in electronic component market, By Type, 2019-2028 (USD million)
TABLE 85 Germany Brown Goods in electronic component market, By Electronic Component, 2019-2028 (USD million)
TABLE 86 Germany Brown Goods in Electronic Component market, By Material, 2019-2028 (USD million)
TABLE 87 Germany Metal in electronic component market, By Type, 2019-2028 (USD million)
TABLE 88 Germany Plastic in electronic component market, By Type, 2019-2028 (USD million)
TABLE 89 Germany White Goods in electronic component market, By Type, 2019-2028 (USD million)
TABLE 90 Germany White Goods in electronic component market, By Electronic Component, 2019-2028 (USD million)
TABLE 91 Germany White Goods in Electronic Component market, By Material, 2019-2028 (USD million)
TABLE 92 Germany Metal in electronic component market, By Type, 2019-2028 (USD million)
TABLE 93 Germany Plastic in electronic component market, By Type, 2019-2028 (USD million)
TABLE 94 Germany Small White Goods in electronic component market, By Type, 2019-2028 (USD million)
TABLE 95 Germany Small White Goods in electronic component market, By Electronic Component, 2019-2028 (USD million)
TABLE 96 Germany Small White Goods in Electronic Component market, By Material, 2019-2028 (USD million)
TABLE 97 Germany Metal in electronic component market, By Type, 2019-2028 (USD million)
TABLE 98 Germany Plastic in electronic component market, By Type, 2019-2028 (USD million)
TABLE 99 Germany electronic component market, By Product Type, 2019-2028 (USD million)
TABLE 100 GERMANY electronic component market, By End Use Type, 2019-2028 (USD million)
TABLE 101 FRANCE electronic component market, By Component Type, 2019-2028 (USD million)
TABLE 102 France Capacitors in electronic component market, By Type, 2019-2028 (USD million)
TABLE 103 France Diode in electronic component market, By Type, 2019-2028 (USD million)
TABLE 104 France Power Diode in electronic component market, By Type, 2019-2028 (USD million)
TABLE 105 France Switches in electronic component market, By Type, 2019-2028 (USD million)
TABLE 106 France Electronic Component market, By Commodities Type, 2019-2028 (USD million)
TABLE 107 France Brown Goods in electronic component market, By Type, 2019-2028 (USD million)
TABLE 108 France Brown Goods in electronic component market, By Electronic Component, 2019-2028 (USD million)
TABLE 109 France Brown Goods in Electronic Component market, By Material, 2019-2028 (USD million)
TABLE 110 France Metal in electronic component market, By Type, 2019-2028 (USD million)
TABLE 111 France Plastic in electronic component market, By Type, 2019-2028 (USD million)
TABLE 112 France White Goods in electronic component market, By Type, 2019-2028 (USD million)
TABLE 113 France White Goods in electronic component market, By Electronic Component, 2019-2028 (USD million)
TABLE 114 France White Goods in Electronic Component market, By Material, 2019-2028 (USD million)
TABLE 115 France Metal in electronic component market, By Type, 2019-2028 (USD million)
TABLE 116 France Plastic in electronic component market, By Type, 2019-2028 (USD million)
TABLE 117 France Small White Goods in electronic component market, By Type, 2019-2028 (USD million)
TABLE 118 France Small White Goods in electronic component market, By Electronic Component, 2019-2028 (USD million)
TABLE 119 France Small White Goods in Electronic Component market, By Material, 2019-2028 (USD million)
TABLE 120 France Metal in electronic component market, By Type, 2019-2028 (USD million)
TABLE 121 France Plastic in electronic component market, By Type, 2019-2028 (USD million)
TABLE 122 France electronic component market, By Product Type, 2019-2028 (USD million)
TABLE 123 FRANCE electronic component market, By End Use Type, 2019-2028 (USD million)
TABLE 124 U.K. electronic component market, By Component Type, 2019-2028 (USD million)
TABLE 125 U.K. Capacitors in electronic component market, By Type, 2019-2028 (USD million)
TABLE 126 U.K. Diode in electronic component market, By Type, 2019-2028 (USD million)
TABLE 127 U.K. Power Diode in electronic component market, By Type, 2019-2028 (USD million)
TABLE 128 U.K. Switches in electronic component market, By Type, 2019-2028 (USD million)
TABLE 129 U.K. Electronic Component market, By Commodities Type, 2019-2028 (USD million)
TABLE 130 U.K. Brown Goods in electronic component market, By Type, 2019-2028 (USD million)
TABLE 131 U.K. Brown Goods in electronic component market, By Electronic Component, 2019-2028 (USD million)
TABLE 132 U.K. Brown Goods in Electronic Component market, By Material, 2019-2028 (USD million)
TABLE 133 U.K. Metal in electronic component market, By Type, 2019-2028 (USD million)
TABLE 134 U.K. Plastic in electronic component market, By Type, 2019-2028 (USD million)
TABLE 135 U.K. White Goods in electronic component market, By Type, 2019-2028 (USD million)
TABLE 136 U.K. White Goods in electronic component market, By Electronic Component, 2019-2028 (USD million)
TABLE 137 U.K. White Goods in Electronic Component market, By Material, 2019-2028 (USD million)
TABLE 138 U.K. Metal in electronic component market, By Type, 2019-2028 (USD million)
TABLE 139 U.K. Plastic in electronic component market, By Type, 2019-2028 (USD million)
TABLE 140 U.K. Small White Goods in electronic component market, By Type, 2019-2028 (USD million)
TABLE 141 U.K. Small White Goods in electronic component market, By Electronic Component, 2019-2028 (USD million)
TABLE 142 U.K. Small White Goods in Electronic Component market, By Material, 2019-2028 (USD million)
TABLE 143 U.K. Metal in electronic component market, By Type, 2019-2028 (USD million)
TABLE 144 U.K. Plastic in electronic component market, By Type, 2019-2028 (USD million)
TABLE 145 U.K. electronic component market, By Product Type, 2019-2028 (USD million)
TABLE 146 U.K. electronic component market, By End Use Type, 2019-2028 (USD million)
TABLE 147 ITALY electronic component market, By Component Type, 2019-2028 (USD million)
TABLE 148 Italy Capacitors in electronic component market, By Type, 2019-2028 (USD million)
TABLE 149 Italy Diode in electronic component market, By Type, 2019-2028 (USD million)
TABLE 150 Italy Power Diode in electronic component market, By Type, 2019-2028 (USD million)
TABLE 151 Italy Switches in electronic component market, By Type, 2019-2028 (USD million)
TABLE 152 Italy Electronic Component market, By Commodities Type, 2019-2028 (USD million)
TABLE 153 Italy Brown Goods in electronic component market, By Type, 2019-2028 (USD million)
TABLE 154 Italy Brown Goods in electronic component market, By Electronic Component, 2019-2028 (USD million)
TABLE 155 Italy Brown Goods in Electronic Component market, By Material, 2019-2028 (USD million)
TABLE 156 Italy Metal in electronic component market, By Type, 2019-2028 (USD million)
TABLE 157 Italy Plastic in electronic component market, By Type, 2019-2028 (USD million)
TABLE 158 Italy White Goods in electronic component market, By Type, 2019-2028 (USD million)
TABLE 159 Italy White Goods in electronic component market, By Electronic Component, 2019-2028 (USD million)
TABLE 160 Italy White Goods in Electronic Component market, By Material, 2019-2028 (USD million)
TABLE 161 Italy Metal in electronic component market, By Type, 2019-2028 (USD million)
TABLE 162 Italy Plastic in electronic component market, By Type, 2019-2028 (USD million)
TABLE 163 Italy Small White Goods in electronic component market, By Type, 2019-2028 (USD million)
TABLE 164 Italy Small White Goods in electronic component market, By Electronic Component, 2019-2028 (USD million)
TABLE 165 Italy Small White Goods in Electronic Component market, By Material, 2019-2028 (USD million)
TABLE 166 Italy Metal in electronic component market, By Type, 2019-2028 (USD million)
TABLE 167 Italy Plastic in electronic component market, By Type, 2019-2028 (USD million)
TABLE 168 Italy electronic component market, By Product Type, 2019-2028 (USD million)
TABLE 169 ITALY electronic component market, By End Use Type, 2019-2028 (USD million)
TABLE 170 SPAIN electronic component market, By Component Type, 2019-2028 (USD million)
TABLE 171 Spain Capacitors in electronic component market, By Type, 2019-2028 (USD million)
TABLE 172 Spain Diode in electronic component market, By Type, 2019-2028 (USD million)
TABLE 173 Spain Power Diode in electronic component market, By Type, 2019-2028 (USD million)
TABLE 174 Spain Switches in electronic component market, By Type, 2019-2028 (USD million)
TABLE 175 Spain Electronic Component market, By Commodities Type, 2019-2028 (USD million)
TABLE 176 Spain Brown Goods in electronic component market, By Type, 2019-2028 (USD million)
TABLE 177 Spain Brown Goods in electronic component market, By Electronic Component, 2019-2028 (USD million)
TABLE 178 Spain Brown Goods in Electronic Component market, By Material, 2019-2028 (USD million)
TABLE 179 Spain Metal in electronic component market, By Type, 2019-2028 (USD million)
TABLE 180 Spain Plastic in electronic component market, By Type, 2019-2028 (USD million)
TABLE 181 Spain White Goods in electronic component market, By Type, 2019-2028 (USD million)
TABLE 182 Spain White Goods in electronic component market, By Electronic Component, 2019-2028 (USD million)
TABLE 183 Spain White Goods in Electronic Component market, By Material, 2019-2028 (USD million)
TABLE 184 Spain Metal in electronic component market, By Type, 2019-2028 (USD million)
TABLE 185 Spain Plastic in electronic component market, By Type, 2019-2028 (USD million)
TABLE 186 Spain Small White Goods in electronic component market, By Type, 2019-2028 (USD million)
TABLE 187 Spain Small White Goods in electronic component market, By Electronic Component, 2019-2028 (USD million)
TABLE 188 Spain Small White Goods in Electronic Component market, By Material, 2019-2028 (USD million)
TABLE 189 Spain Metal in electronic component market, By Type, 2019-2028 (USD million)
TABLE 190 Spain Plastic in electronic component market, By Type, 2019-2028 (USD million)
TABLE 191 Spain electronic component market, By Product Type, 2019-2028 (USD million)
TABLE 192 SPAIN electronic component market, By End Use Type, 2019-2028 (USD million)
TABLE 193 NETHERLANDS electronic component market, By Component Type, 2019-2028 (USD million)
TABLE 194 Netherlands Capacitors in electronic component market, By Type, 2019-2028 (USD million)
TABLE 195 Netherlands Diode in electronic component market, By Type, 2019-2028 (USD million)
TABLE 196 Netherlands Power Diode in electronic component market, By Type, 2019-2028 (USD million)
TABLE 197 Netherlands Switches in electronic component market, By Type, 2019-2028 (USD million)
TABLE 198 Netherlands Electronic Component market, By Commodities Type, 2019-2028 (USD million)
TABLE 199 Netherlands Brown Goods in electronic component market, By Type, 2019-2028 (USD million)
TABLE 200 Netherlands Brown Goods in electronic component market, By Electronic Component, 2019-2028 (USD million)
TABLE 201 Netherlands Brown Goods in Electronic Component market, By Material, 2019-2028 (USD million)
TABLE 202 Netherlands Metal in electronic component market, By Type, 2019-2028 (USD million)
TABLE 203 Netherlands Plastic in electronic component market, By Type, 2019-2028 (USD million)
TABLE 204 Netherlands White Goods in electronic component market, By Type, 2019-2028 (USD million)
TABLE 205 Netherlands White Goods in electronic component market, By Electronic Component, 2019-2028 (USD million)
TABLE 206 Netherlands White Goods in Electronic Component market, By Material, 2019-2028 (USD million)
TABLE 207 Netherlands Metal in electronic component market, By Type, 2019-2028 (USD million)
TABLE 208 Netherlands Plastic in electronic component market, By Type, 2019-2028 (USD million)
TABLE 209 Netherlands Small White Goods in electronic component market, By Type, 2019-2028 (USD million)
TABLE 210 Netherlands Small White Goods in electronic component market, By Electronic Component, 2019-2028 (USD million)
TABLE 211 Netherlands Small White Goods in Electronic Component market, By Material, 2019-2028 (USD million)
TABLE 212 Netherlands Metal in electronic component market, By Type, 2019-2028 (USD million)
TABLE 213 Netherlands Plastic in electronic component market, By Type, 2019-2028 (USD million)
TABLE 214 Netherlands electronic component market, By Product Type, 2019-2028 (USD million)
TABLE 215 NETHERLANDS electronic component market, By End Use Type, 2019-2028 (USD million)
TABLE 216 SWITZERLAND electronic component market, By Component Type, 2019-2028 (USD million)
TABLE 217 Switzerland Capacitors in electronic component market, By Type, 2019-2028 (USD million)
TABLE 218 Switzerland Diode in electronic component market, By Type, 2019-2028 (USD million)
TABLE 219 Switzerland Power Diode in electronic component market, By Type, 2019-2028 (USD million)
TABLE 220 Switzerland Switches in electronic component market, By Type, 2019-2028 (USD million)
TABLE 221 Switzerland Electronic Component market, By Commodities Type, 2019-2028 (USD million)
TABLE 222 Switzerland Brown Goods in electronic component market, By Type, 2019-2028 (USD million)
TABLE 223 Switzerland Brown Goods in electronic component market, By Electronic Component, 2019-2028 (USD million)
TABLE 224 Switzerland Brown Goods in Electronic Component market, By Material, 2019-2028 (USD million)
TABLE 225 Switzerland Metal in electronic component market, By Type, 2019-2028 (USD million)
TABLE 226 Switzerland Plastic in electronic component market, By Type, 2019-2028 (USD million)
TABLE 227 Switzerland White Goods in electronic component market, By Type, 2019-2028 (USD million)
TABLE 228 Switzerland White Goods in electronic component market, By Electronic Component, 2019-2028 (USD million)
TABLE 229 Switzerland White Goods in Electronic Component market, By Material, 2019-2028 (USD million)
TABLE 230 Switzerland Metal in electronic component market, By Type, 2019-2028 (USD million)
TABLE 231 Switzerland Plastic in electronic component market, By Type, 2019-2028 (USD million)
TABLE 232 Switzerland Small White Goods in electronic component market, By Type, 2019-2028 (USD million)
TABLE 233 Switzerland Small White Goods in electronic component market, By Electronic Component, 2019-2028 (USD million)
TABLE 234 Switzerland Small White Goods in Electronic Component market, By Material, 2019-2028 (USD million)
TABLE 235 Switzerland Metal in electronic component market, By Type, 2019-2028 (USD million)
TABLE 236 Switzerland Plastic in electronic component market, By Type, 2019-2028 (USD million)
TABLE 237 Switzerland electronic component market, By Product Type, 2019-2028 (USD million)
TABLE 238 SWITZERLAND electronic component market, By End Use Type, 2019-2028 (USD million)
TABLE 239 RUSSIA electronic component market, By Component Type, 2019-2028 (USD million)
TABLE 240 Russia Capacitors in electronic component market, By Type, 2019-2028 (USD million)
TABLE 241 Russia Diode in electronic component market, By Type, 2019-2028 (USD million)
TABLE 242 Russia Power Diode in electronic component market, By Type, 2019-2028 (USD million)
TABLE 243 Russia Switches in electronic component market, By Type, 2019-2028 (USD million)
TABLE 244 Russia Electronic Component market, By Commodities Type, 2019-2028 (USD million)
TABLE 245 Russia Brown Goods in electronic component market, By Type, 2019-2028 (USD million)
TABLE 246 Russia Brown Goods in electronic component market, By Electronic Component, 2019-2028 (USD million)
TABLE 247 Russia Brown Goods in Electronic Component market, By Material, 2019-2028 (USD million)
TABLE 248 Russia Metal in electronic component market, By Type, 2019-2028 (USD million)
TABLE 249 Russia Plastic in electronic component market, By Type, 2019-2028 (USD million)
TABLE 250 Russia White Goods in electronic component market, By Type, 2019-2028 (USD million)
TABLE 251 Russia White Goods in electronic component market, By Electronic Component, 2019-2028 (USD million)
TABLE 252 Russia White Goods in Electronic Component market, By Material, 2019-2028 (USD million)
TABLE 253 Russia Metal in electronic component market, By Type, 2019-2028 (USD million)
TABLE 254 Russia Plastic in electronic component market, By Type, 2019-2028 (USD million)
TABLE 255 Russia Small White Goods in electronic component market, By Type, 2019-2028 (USD million)
TABLE 256 Russia Small White Goods in electronic component market, By Electronic Component, 2019-2028 (USD million)
TABLE 257 Russia Small White Goods in Electronic Component market, By Material, 2019-2028 (USD million)
TABLE 258 Russia Metal in electronic component market, By Type, 2019-2028 (USD million)
TABLE 259 Russia Plastic in electronic component market, By Type, 2019-2028 (USD million)
TABLE 260 Russia electronic component market, By Product Type, 2019-2028 (USD million)
TABLE 261 RUSSIA electronic component market, By End Use Type, 2019-2028 (USD million)
TABLE 262 TURKEY electronic component market, By Component Type, 2019-2028 (USD million)
TABLE 263 Turkey Capacitors in electronic component market, By Type, 2019-2028 (USD million)
TABLE 264 Turkey Diode in electronic component market, By Type, 2019-2028 (USD million)
TABLE 265 Turkey Power Diode in electronic component market, By Type, 2019-2028 (USD million)
TABLE 266 Turkey Switches in electronic component market, By Type, 2019-2028 (USD million)
TABLE 267 Turkey Electronic Component market, By Commodities Type, 2019-2028 (USD million)
TABLE 268 Turkey Brown Goods in electronic component market, By Type, 2019-2028 (USD million)
TABLE 269 Turkey Brown Goods in electronic component market, By Electronic Component, 2019-2028 (USD million)
TABLE 270 Turkey Brown Goods in Electronic Component market, By Material, 2019-2028 (USD million)
TABLE 271 Turkey Metal in electronic component market, By Type, 2019-2028 (USD million)
TABLE 272 Turkey Plastic in electronic component market, By Type, 2019-2028 (USD million)
TABLE 273 Turkey White Goods in electronic component market, By Type, 2019-2028 (USD million)
TABLE 274 Turkey White Goods in electronic component market, By Electronic Component, 2019-2028 (USD million)
TABLE 275 Turkey White Goods in Electronic Component market, By Material, 2019-2028 (USD million)
TABLE 276 Turkey Metal in electronic component market, By Type, 2019-2028 (USD million)
TABLE 277 Turkey Plastic in electronic component market, By Type, 2019-2028 (USD million)
TABLE 278 Turkey Small White Goods in electronic component market, By Type, 2019-2028 (USD million)
TABLE 279 Turkey Small White Goods in electronic component market, By Electronic Component, 2019-2028 (USD million)
TABLE 280 Turkey Small White Goods in Electronic Component market, By Material, 2019-2028 (USD million)
TABLE 281 Turkey Metal in electronic component market, By Type, 2019-2028 (USD million)
TABLE 282 Turkey Plastic in electronic component market, By Type, 2019-2028 (USD million)
TABLE 283 Turkey electronic component market, By Product Type, 2019-2028 (USD million)
TABLE 284 TURKEY electronic component market, By End Use Type, 2019-2028 (USD million)
TABLE 285 BELGIUM electronic component market, By Component Type, 2019-2028 (USD million)
TABLE 286 Belgium Capacitors in electronic component market, By Type, 2019-2028 (USD million)
TABLE 287 Belgium Diode in electronic component market, By Type, 2019-2028 (USD million)
TABLE 288 Belgium Power Diode in electronic component market, By Type, 2019-2028 (USD million)
TABLE 289 Belgium Switches in electronic component market, By Type, 2019-2028 (USD million)
TABLE 290 Belgium Electronic Component market, By Commodities Type, 2019-2028 (USD million)
TABLE 291 Belgium Brown Goods in electronic component market, By Type, 2019-2028 (USD million)
TABLE 292 Belgium Brown Goods in electronic component market, By Electronic Component, 2019-2028 (USD million)
TABLE 293 Belgium Brown Goods in Electronic Component market, By Material, 2019-2028 (USD million)
TABLE 294 Belgium Metal in electronic component market, By Type, 2019-2028 (USD million)
TABLE 295 Belgium Plastic in electronic component market, By Type, 2019-2028 (USD million)
TABLE 296 Belgium White Goods in electronic component market, By Type, 2019-2028 (USD million)
TABLE 297 Belgium White Goods in electronic component market, By Electronic Component, 2019-2028 (USD million)
TABLE 298 Belgium White Goods in Electronic Component market, By Material, 2019-2028 (USD million)
TABLE 299 Belgium Metal in electronic component market, By Type, 2019-2028 (USD million)
TABLE 300 Belgium Plastic in electronic component market, By Type, 2019-2028 (USD million)
TABLE 301 Belgium Small White Goods in electronic component market, By Type, 2019-2028 (USD million)
TABLE 302 Belgium Small White Goods in electronic component market, By Electronic Component, 2019-2028 (USD million)
TABLE 303 Belgium Small White Goods in Electronic Component market, By Material, 2019-2028 (USD million)
TABLE 304 Belgium Metal in electronic component market, By Type, 2019-2028 (USD million)
TABLE 305 Belgium Plastic in electronic component market, By Type, 2019-2028 (USD million)
TABLE 306 Belgium electronic component market, By Product Type, 2019-2028 (USD million)
TABLE 307 BELGIUM electronic component market, By End Use Type, 2019-2028 (USD million)
TABLE 308 REST OF EUROPE electronic component market, By Component Type, 2019-2028 (USD million)
图片列表
FIGURE 1 Europe Electronic Components Market: segmentation
FIGURE 2 Europe Electronic Components Market: data triangulation
FIGURE 3 Europe Electronic Components Market: DROC ANALYSIS
FIGURE 4 Europe Electronic Components Market: EUROPE VS REGIONAL MARKET ANALYSIS
FIGURE 5 Europe Electronic Components Market: COMPANY RESEARCH ANALYSIS
FIGURE 6 Europe Electronic Components Market: INTERVIEW DEMOGRAPHICS
FIGURE 7 Europe Electronic Components Market: DBMR MARKET POSITION GRID
FIGURE 8 Europe Electronic Components Market: vendor share analysis
FIGURE 9 Europe Electronic Components Market: SEGMENTATION
FIGURE 10 INCREASE IN DEMAND FOR SMART ELECTRONIC DEVICES is EXPECTED TO DRIVE EUROPE ELECTRONIC COMPONENTS MARKET IN THE FORECAST PERIOD OF 2021 TO 2028
FIGURE 11 Processors segment is expected to account for the largest share of Europe Electronic Components Market in 2021 & 2028
FIGURE 12 DRIVERS, RESTRAINTS, OPPORTUNITIES, AND CHALLENGES OF EUROPE Electronic Components market
FIGURE 13 COPPER PRICES (PER POUND) - 45 YEAR HISTORICAL CHART
FIGURE 14 Europe Electronic Components market: BY Component Type, 2020
FIGURE 15 Europe Electronic Components market: BY commodities type, 2020
FIGURE 16 Europe Electronic Components market: BY Product Type, 2020
FIGURE 17 Europe Electronic Components market: BY End Use type, 2020
FIGURE 18 EUROPE electronic component market: SNAPSHOT (2020)
FIGURE 19 EUROPE electronic component market: by Country (2020)
FIGURE 20 EUROPE electronic component market: by Country (2021 & 2028)
FIGURE 21 EUROPE electronic component market: by Country (2020 & 2028)
FIGURE 22 EUROPE electronic component market: by COMPONENT TYPE (2021-2028)
FIGURE 23 Europe Electronic components Market: company share 2020 (%)
FIGURE 24 NORTH AMERICA Electronic components Market: company share 2020 (%)
FIGURE 25 Europe Electronic components Market: company share 2020 (%)
FIGURE 26 Asia-Pacific Electronic components Market: company share 2020 (%)
研究方法
数据收集和基准年分析是使用具有大样本量的数据收集模块完成的。该阶段包括通过各种来源和策略获取市场信息或相关数据。它包括提前检查和规划从过去获得的所有数据。它同样包括检查不同信息源中出现的信息不一致。使用市场统计和连贯模型分析和估计市场数据。此外,市场份额分析和关键趋势分析是市场报告中的主要成功因素。要了解更多信息,请请求分析师致电或下拉您的询问。
DBMR 研究团队使用的关键研究方法是数据三角测量,其中包括数据挖掘、数据变量对市场影响的分析和主要(行业专家)验证。数据模型包括供应商定位网格、市场时间线分析、市场概览和指南、公司定位网格、专利分析、定价分析、公司市场份额分析、测量标准、全球与区域和供应商份额分析。要了解有关研究方法的更多信息,请向我们的行业专家咨询。
可定制
Data Bridge Market Research 是高级形成性研究领域的领导者。我们为向现有和新客户提供符合其目标的数据和分析而感到自豪。报告可定制,包括目标品牌的价格趋势分析、了解其他国家的市场(索取国家列表)、临床试验结果数据、文献综述、翻新市场和产品基础分析。目标竞争对手的市场分析可以从基于技术的分析到市场组合策略进行分析。我们可以按照您所需的格式和数据样式添加您需要的任意数量的竞争对手数据。我们的分析师团队还可以为您提供原始 Excel 文件数据透视表(事实手册)中的数据,或者可以帮助您根据报告中的数据集创建演示文稿。

