
Europe Electronic Components Market
Market Size in USD Million
 USD
51,222.00 Million
USD
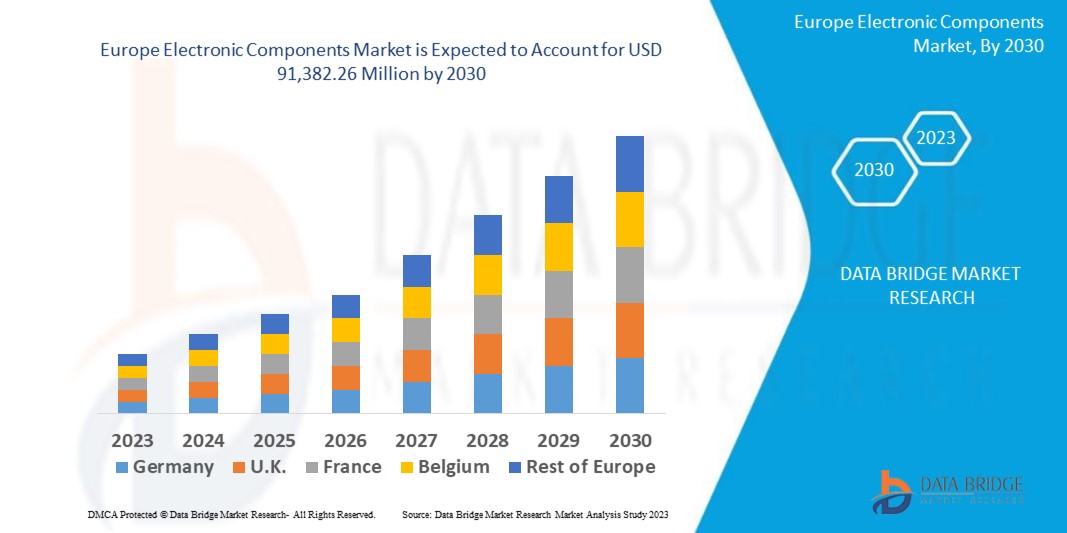
91,382.26 Million
2022
2030
USD
51,222.00 Million
USD
91,382.26 Million
2022
2030
| 2023 - 2030 | |
| USD 51,222.00 Million | |
| USD 91,382.26 Million | |
| % | |
|
Europe Electronic Components Technology Market Analysis and Size
Europe has a strong automotive manufacturing sector, and electronic components play a crucial role in modern vehicles. The increasing demand for electric vehicles (EVs), autonomous driving systems, advanced safety features, and infotainment systems is driving the demand for electronic components in the automotive sector.
Data Bridge Market Research analyses that the Europe electronic components market which was USD 51,222 million in 2022 is expected to reach USD 91,382.26 million by 2030, and is expected to undergo a CAGR of 7.7% during the forecast period 2023-2030. This indicates the market value. “Processors” dominates the type segment of the Europe electronic components market due to they are often referred to as the "brain" of electronic devices. They serve as the core computing units responsible for executing instructions and managing tasks, making them an essential component in nearly all electronic devices. In addition to the insights on market scenarios such as market value, growth rate, segmentation, geographical coverage, and major players, the market reports curated by the Data Bridge Market Research also include in-depth expert analysis, geographically represented company-wise production and capacity, network layouts of distributors and partners, detailed and updated price trend analysis and deficit analysis of supply chain and demand.
Europe Electronic Components Market Scope and Segmentation
|
Report Metric |
Details |
|
Forecast Period |
2023 to 2030 |
|
Base Year |
2022 |
|
Historic Years |
2021 (Customisable to 2015-2020) |
|
Quantitative Units |
Revenue in USD Million, Volumes in Units, Pricing in USD |
|
Segments Covered |
Component type (Processors, Motors, Battery, Microcontroller, Integrated Circuit (IC), Circuit Breakers, Transformers, Capacitors, Diode, Resistors, Inductor, Switches, Relays, Fuse and Others), Commodities Type (Brown Goods, White Goods, Small White Goods and Others), Product Type (Active, Passive, Electromechanical Components and Others), End Use Type (Consumer Electronics, Networking and Telecommunication, Manufacturing, Automotive, Aerospace and Defense, Healthcare and Others), |
|
Countries Covered |
Germany, France, U.K., Italy, Spain, Netherlands, Switzerland, Russia, Turkey, Belgium and Rest of Europe |
|
Market Players Covered |
Schurter (U.K), Infineon Technology AG (U.K.), NXP Semiconductors (U.K.) |
|
Market Opportunities |
|
Market Definition
Electronic Components or IVR refers to a technology which allows humans to interact with an automated telephone system. Apparently, it receives a combination of telephone input and keypad selection tone to basically provide appropriate responses to inquiries in the form of voice, email, fax, call back, and other contact methods. The major purpose of Electronic Components is to interact with callers, collect information and direct the incoming calls to the appropriate recipients.
Europe Electronic Components Market Dynamics
Drivers
- Automotive Industry
Europe has a strong automotive manufacturing sector, and electronic components play a crucial role in modern vehicles. The increasing demand for electric vehicles (EVs), autonomous driving systems, advanced safety features, and infotainment systems is driving the demand for electronic components in the automotive sector.
- Industrial Automation
Industrial automation and Industry 4.0 initiatives are on the rise in Europe. Electronic components are essential for the development of smart factories, robotics, and process automation systems, leading to increased demand for components such as sensors, microcontrollers, and industrial communication modules.
Opportunities
- Advanced Automotive Electronics
The automotive industry in Europe was transitioning toward electric vehicles (EVs), connected cars, and autonomous driving technologies. This shift created opportunities for electronic component manufacturers to supply advanced sensors, power electronics, and connectivity solutions.
- Industrial IoT (IIoT)
Industry 4.0 and the Industrial Internet of Things (IIoT) were gaining traction in Europe. This presented opportunities for electronic components like sensors, actuators, and communication modules to enable smart manufacturing and automation.
Restraint/Challenge
- Supply Chain Disruptions
The Europe electronic components market relies heavily on global supply chains. Disruptions, such as those caused by the COVID-19 pandemic, highlighted vulnerabilities in the supply chain, including shortages, logistics challenges, and lead time uncertainties
This Europe electronic components market, report provides details of new recent developments, trade regulations, import-export analysis, production analysis, value chain optimization, market share, impact of domestic and localized market players, analyses opportunities in terms of emerging revenue pockets, changes in market regulations, strategic market growth analysis, market size, category market growths, application niches and dominance, product approvals, product launches, geographic expansions, technological innovations in the market. To gain more info on the industrial maintenance services in operational improvement and operational maintenance market, contact data bridge market research for an analyst brief, our team will help you take an informed market decision to achieve market growth.
Impact and Current Market Scenario of Raw Material Shortage and Shipping Delays
Data Bridge Market Research offers a high-level analysis of the market and delivers information by keeping in account the impact and current market environment of raw material shortage and shipping delays. This translates into assessing strategic possibilities, creating effective action plans, and assisting businesses in making important decisions.
Apart from the standard report, we also offer in-depth analysis of the procurement level from forecasted shipping delays, distributor mapping by region, commodity analysis, production analysis, price mapping trends, sourcing, category performance analysis, supply chain risk management solutions, advanced benchmarking, and other services for procurement and strategic support.
Expected Impact of Economic Slowdown on the Pricing and Availability of Products
When economic activity slows, industries begin to suffer. The forecasted effects of the economic downturn on the pricing and accessibility of the products are taken into account in the market insight reports and intelligence services provided by DBMR. With this, our clients can typically keep one step ahead of their competitors, project their sales and revenue, and estimate their profit and loss expenditures.
Recent Developments
- In April 2021, SCHURTER launched DKIV-1 series, a current compensated choke designed for 1-phase high-current application on circuit boards. This choke is compact and lightweight. The new product would help the company to increase its product portfolio and leave its footprint in the market
- In November 2020, NXP Semiconductors has announced that they are collaborating with Amazon Web Services (AWS) to extend their opportunities for connected vehicles. With this collaboration, the company will deliver a secure, edge-to-cloud compute solution for its next-generation vehicles. This will help the company to accelerate its digital transformation initiative and expand its customer base
Europe Electronic Components Scope
The Europe electronic components market is segmented on the basis of component, function and end user. The growth amongst these segments will help you analyse meagre growth segments in the industries and provide the users with a valuable market overview and market insights to help them make strategic decisions for identifying core market applications.
Component Type
- Processors
- Motors
- Battery
- Microcontroller
- Integrated Circuit (IC)
- Circuit Breakers
- Transformers
- Capacitors
- Diode
- Resistors
- Inductor
- Switches
- Relays
- Fuse
- Others
Commodities Type
- Brown Goods
- White Goods
- Small White Goods
- Others
Product Type
- Active
- Passive
- Electromechanical Components
- Others
End Use Type
- Consumer Electronics
- Networking and Telecommunication
- Manufacturing
- Automotive
- Aerospace and Defense
- Healthcare
- Others
Europe Electronic Components Market Regional Analysis/Insights
The countries covered in the Europe electronic components market report are Germany, France, U.K., Italy, Spain, Netherlands, Switzerland, Russia, Turkey, Belgium and Rest of Europe.
Germany dominates the Europe electronic components market because of the high rate of adoption of electronic components technology within the region over the forecast period of 2023-2030. Moreover, the increased research and development proficiencies to improve the technology is further estimated to accelerate the expansion over the forecast period 2023-2030.
The country section of the report also provides individual market impacting factors and changes in regulation in the market domestically that impacts the current and future trends of the market. Data points like down-stream and upstream value chain analysis, technical trends and porter's five forces analysis, case studies are some of the pointers used to forecast the market scenario for individual countries. Also, the presence and availability of Europe brands and their challenges faced due to large or scarce competition from local and domestic brands, impact of domestic tariffs and trade routes are considered while providing forecast analysis of the country data.
Competitive Landscape and Europe Electronic Components Market Share Analysis
The Europe electronic components market competitive landscape provides details by competitor. Details included are company overview, company financials, revenue generated, market potential, investment in research and development, new market initiatives, North America presence, production sites and facilities, production capacities, company strengths and weaknesses, product launch, product width and breadth, and application dominance. The above data points provided are only related to the companies' focus related to the Europe electronic components market.
Some of the major players operating in the Europe electronic components market are:
- Schurter (U.K)
- Infineon Technology AG (U.K.)
- NXP Semiconductors (U.K.)
SKU-

- Interactive Data Analysis Dashboard
- Company Analysis Dashboard for high growth potential opportunities
- Research Analyst Access for customization & queries
- Competitor Analysis with Interactive dashboard
- Latest News, Updates & Trend analysis
- Harness the Power of Benchmark Analysis for Comprehensive Competitor Tracking
Table of Content
- introduction
- OBJECTIVES OF THE STUDY
- MARKET DEFINITION
- OVERVIEW OF Europe Electronic Components Market
- Currency and Pricing
- LIMITATIONS
- MARKETS COVERED
- MARKET SEGMENTATION
- MARKETS COVERED
- geographicAL scope
- years considered for the study
- DBMR TRIPOD DATA VALIDATION MODEL
- primary interviews with key opinion leaders
- DBMR MARKET POSITION GRID
- vendor share analysis
- Multivariate Modeling
- component type timeline curve
- secondary sourcEs
- assumptions
- EXECUTIVE SUMMARY
- premium insights
- market overview
- drivers
- INCREASE IN DEMAND FOR Smart Electronic Devices
- rISE IN PREFERENCE FOR MINIATURIZED DESIGN COMPONENT
- RISE IN ADOPTION OF ELECTRONIC COMPONENTS IN NUMEROUS INDUSTRIES
- RISE IN DEMAND FOR THE SOFT ELECTRONIC COMPONENTS
- restraints
- RISE IN METAL PRICES HAMPERS THE OVERALL COMPONENT PRODUCTION COSTS
- CHANGE IN ECONOMIC AND POLITICAL OUTLOOK
- OPPORTUNITIES
- INCREASE IN USAGE OF IOT
- INCREASE IN VARIOUS STRATEGIC DECISIONS SUCH AS PARTNERSHIPS AND MERGERS
- RISE IN ADOPTION OF ELECTRONIC COMPONENTS IN APPLICATIONS SUCH AS SATELLITE AND SPACE TECHNOLOGY
- RISE IN AUTOMATION IN THE AUTOMOTIVE SECTOR
- ADVENT OF DIFFERENT CONNECTED TECHNOLOGIES WITH ENHANCED EFFICIENCY
- CHALLENGES
- RISE IN DEPENDENCY OF MANUFACTURER ON DIFFERENT SUPPLIERS
- SHORTAGE IN SUPPLY OF ELECTRONIC COMPONENTS
- IMPACT OF COVID-19 ON THE EUROPE ELECTRONIC COMPONENTS MARKET
- ANALYSIS ON IMPACT OF COVID-19 ON THE MARKET
- AFTERMATH OF COVID-19 AND GOVERNMENT INITIATIVE TO BOOST THE MARKET
- STRATEGIC DECISIONS FOR MANUFACTURERS AFTER COVID-19 TO GAIN COMPETITIVE MARKET SHARE
- IMPACT ON DEMAND
- IMPACT ON SUPPLY CHAIN
- CONCLUSION
- Europe Electronic Components market, BY Component Type
- overview
- Processors
- Motors
- Battery
- microcontroller
- integrated circuit (ic)
- circuit breakers
- transformers
- Capacitors
- Paper and Film
- Ceramic
- Aluminum
- Tantalum
- Supercapacitor
- others
- Diodes
- Power diode
- Zener Diode
- schottky diode
- Rectifier diode
- small signal switching diode
- rf diode
- others
- resistors
- Inductors
- switches
- Single Pole Double Throw (SPDT)
- Single Pole Single Throw (SPST)
- Double Pole Double Throw (DPDT)
- Double Pole Single Throw (DPST)
- Relays
- Fuse
- others
- Europe Electronic Components market, BY Commodities Type
- overview
- Brown Goods
- By Type
- Personal Computers
- TV
- DVD Players
- cd players
- VCRs
- others
- Electronic Components
- Processors
- Microcontrollers
- Integrated Circuits (IC)
- Battery
- motors
- vacuum tubes
- others
- By Material
- Metal
- Gold
- Palladium
- Platinum
- Copper
- Tin
- Silver
- Nickel
- Aluminum
- Cobalt
- Zinc
- Tantalum
- Neodymium
- Plastic
- By Type
- Thermoset
- Thermoplastic
- White goods
- By type
- refrigerators
- washing machines
- air conditioners
- microwave Ovens
- dishwashers
- clothes dryers
- water heaters
- freezers
- kitchen stoves
- induction cookers
- drying cabinets
- trash compactors
- By Electronic Component
- motors
- Microcontrollers
- Integrated Circuits (IC)
- processors
- battery
- vacuum tubes
- others
- By Material
- Metal
- Gold
- Palladium
- Platinum
- Copper
- Aluminum
- Tin
- Silver
- Nickel
- Tantalum
- Neodymium
- Cobalt
- Zinc
- Plastic
- Thermoset
- Thermoplastic
- small white goods
- By Type
- FOOD PROCESSORS
- Toasters
- HAIRDRYERS
- KETTLES
- OTHERS
- By ELECTRONIC COMPONENTS
- microcontrollers
- Integrated Circuits (IC)
- Motors
- processors
- battery
- vacuum tubes
- others
- BY MATERIAL
- Metal
- Gold
- Palladium
- Platinum
- Copper
- Tin
- Silver
- Nickel
- Aluminum
- Tantalum
- Cobalt
- Neodymium
- Zinc
- Plastic
- THERMOSET
- Thermoplastic
- others
- Europe Electronic Components market, BY product type
- overview
- Active
- passive
- electromechanical components
- others
- Europe Electronic Components market, BY End Use TYPE
- overview
- Consumer Electronics
- Networking & Telecommunication
- manufacturing
- Automotive
- Aerospace & Defense
- healthcare
- others
- Europe electronic components market, by REGION
- EUROPE
- GERMANY
- FRANCE
- U.K.
- ITALY
- SPAIN
- NETHERLANDS
- SWITZERLAND
- RUSSIA
- TURKEY
- BELGIUM
- REST OF EUROPE
- EUROPE Electronic components market: COMPANY landscape
- company share analysis: EUROPE
- company share analysis: NORTH AMERICA
- company share analysis: EUROPE
- company share analysis: Asia-pacific
- swot analysis
- company profile
- INTEL CORPORATION
- COMPANY SNAPSHOT
- REVENUE ANALYSIS
- company share analysis
- PRODUCT PORTFOLIO
- RECENT DEVELOPMENTS
- QUALCOMM TECHNOLOGIES, INC.
- COMPANY SNAPSHOT
- REVENUE ANALYSIS
- company share analysis
- PRODUCT PORTFOLIO
- RECENT DEVELOPMENTS
- BROADCOM
- COMPANY SNAPSHOT
- REVENUE ANALYSIS
- company share analysis
- PRODUCT PORTFOLIO
- RECENT DEVELOPMENTS
- NXP SEMICONDUCTORS
- COMPANY SNAPSHOT
- REVENUE ANALYSIS
- company share analysis
- PRODUCT PORTFOLIO
- RECENT DEVELOPMENTS
- ADVANCED MICRO DEVICES, INC.
- COMPANY SNAPSHOT
- REVENUE ANALYSIS
- PRODUCT PORTFOLIO
- RECENT DEVELOPMENTS
- ANALOG DEVICES INC.
- COMPANY SNAPSHOT
- REVENUE ANALYSIS
- PRODUCT PORTFOLIO
- RECENT DEVELOPMENTS
- HITACHI HIGH-TECH CORPORATION
- COMPANY SNAPSHOT
- REVENUE ANALYSIS
- PRODUCT PORTFOLIO
- RECENT DEVELOPMENTS
- INFINEON TECHNOLOGIES AG
- COMPANY SNAPSHOT
- REVENUE ANALYSIS
- PRODUCT PORTFOLIO
- RECENT DEVELOPMENTS
- KYOCERA CORPORATION
- COMPANY SNAPSHOT
- REVENUE ANALYSIS
- PRODUCT PORTFOLIO
- RECENT DEVELOPMENTS
- MAXIM INTEGRATED
- COMPANY SNAPSHOT
- REVENUE ANALYSIS
- PRODUCT PORTFOLIO
- RECENT DEVELOPMENTS
- MEDIATEK INC.
- COMPANY SNAPSHOT
- REVENUE ANALYSIS
- PRODUCT PORTFOLIO
- RECENT DEVELOPMENTS
- MICROCHIP TECHNOLOGY INC.
- COMPANY SNAPSHOT
- REVENUE ANALYSIS
- PRODUCT PORTFOLIO
- RECENT DEVELOPMENTS
- MONOLITHIC POWER SYSTEMS, INC.
- COMPANY SNAPSHOT
- REVENUE ANALYSIS
- PRODUCT PORTFOLIO
- RECENT DEVELOPMENTS
- REWELL INDUSTRIAL CO., LTD
- COMPANY SNAPSHOT
- PRODUCT PORTFOLIO
- RECENT DEVELOPMENTS
- SAMSUNG ELECTRONICS CO., LTD.
- COMPANY SNAPSHOT
- REVENUE ANALYSIS
- PRODUCT PORTFOLIO
- RECENT DEVELOPMENTS
- SCHURTER
- COMPANY SNAPSHOT
- PRODUCT PORTFOLIO
- RECENT DEVELOPMENTS
- SK HYNIX INC.
- COMPANY SNAPSHOT
- REVENUE ANALYSIS
- PRODUCT PORTFOLIO
- RECENT DEVELOPMENTS
- TEXAS INSTRUMENTS INCORPORATED
- COMPANY SNAPSHOT
- REVENUE ANALYSIS
- PRODUCT PORTFOLIO
- RECENT DEVELOPMENTS
- TOSHIBA CORPORATION
- COMPANY SNAPSHOT
- REVENUE ANALYSIS
- PRODUCT PORTFOLIO
- RECENT DEVELOPMENTS
- WATTS
- COMPANY SNAPSHOT
- PRODUCT PORTFOLIO
- RECENT DEVELOPMENT
- questionnaire
- related reports
List of Table
TABLE 1 Europe Electronic Components Market, BY Component TYPE, 2019-2028 (USD Million)
TABLE 2 Europe Processors in Electronic Components Market, By Region, 2019-2028 (USD Million)
TABLE 3 Europe motors in Electronic Components Market, By Region, 2019-2028 (USD Million)
TABLE 4 Europe Battery in Electronic Components Market, By Region, 2019-2028 (USD Million)
TABLE 5 Europe microcontroller in Electronic Components Market, By Region, 2019-2028 (USD MILLION)
TABLE 6 Europe Integrated Circuit (IC) in Electronic Components Market, By Region, 2019-2028 (USD MILLION)
TABLE 7 Europe Circuit breakers in Electronic Components Market, By Region, 2019-2028 (USD MILLION)
TABLE 8 Europe transformers in Electronic Components Market, By Region, 2019-2028 (USD MILLION)
TABLE 9 Europe capacitors in Electronic Components Market, By Region, 2019-2028 (USD MILLION)
TABLE 10 Europe Capacitors in Electronic Components Market, By Type, 2019-2028 (USD Million)
TABLE 11 Europe Diodes in Electronic Components Market, By Region, 2019-2028 (USD MILLION)
TABLE 12 Europe diodes in Electronic Components Market, By Type, 2019-2028 (USD Million)
TABLE 13 Europe Power diode in Electronic Components Market, By Type, 2019-2028 (USD Million)
TABLE 14 Europe resistors in Electronic Components Market, By Region, 2019-2028 (USD Million)
TABLE 15 Europe Inductors in Electronic Components Market, By Region, 2019-2028 (USD MILLION)
TABLE 16 Europe Switches in Electronic Components Market, By Region, 2019-2028 (USD MILLION)
TABLE 17 Europe diodes in Electronic Components Market, By Type, 2019-2028 (USD Million)
TABLE 18 Europe Relays in Electronic Components Market, By Region, 2019-2028 (USD MILLION)
TABLE 19 Europe Fuse in Electronic Components Market, By Region, 2019-2028 (USD MILLION)
TABLE 20 Europe Others in Electronic Components Market, By Region, 2019-2028 (USD MILLION)
TABLE 21 Europe Electronic Components Market, BY Commodities type, 2019-2028 (USD million)
TABLE 22 Europe brown goods in Electronic Components Market, By Region, 2019-2028, (USD MILLION)
TABLE 23 Europe Brown Goods in Electronic Components Market, By Type, 2019-2028 (USD MILLION)
TABLE 24 Europe Brown Goods in Electronic Components Market, By Electronic Components, 2019-2028 (USD MILLION)
TABLE 25 Europe Brown Goods in Electronic Components Market, By material, 2019-2028 (USD MILLION)
TABLE 26 Europe Metal in Electronic Components Market, By type, 2019-2028 (USD MILLION)
TABLE 27 Europe plastic in Electronic Components Market, By type, 2019-2028 (USD MILLION)
TABLE 28 Europe white goods in Electronic Components Market, By Region, 2019-2028, (USD MILLION)
TABLE 29 Europe white Goods in Electronic Components Market, By type, 2019-2028 (USD MILLION)
TABLE 30 Europe white Goods in Electronic Components Market, By Electronic Components, 2019-2028 (USD MILLION)
TABLE 31 Europe White Goods in Electronic Components Market, By Material, 2019-2028 (USD MILLION)
TABLE 32 Europe Metal in Electronic Components Market, By type, 2019-2028 (USD MILLION)
TABLE 33 Europe plastic in Electronic Components Market, By type, 2019-2028 (USD MILLION)
TABLE 34 Europe Small White Goods in Electronic Components Market, By Region, 2019-2028, (USD MILLION)
TABLE 35 Europe Small white Goods in Electronic Components Market, By type, 2019-2028 (USD MILLION)
TABLE 36 Europe small white Goods in Electronic Components Market, By Electronic Components, 2019-2028 (USD MILLION)
TABLE 37 Europe small White Goods in Electronic Components Market, By Material, 2019-2028 (USD MILLION)
TABLE 38 Europe METAL in Electronic Components Market, By type, 2019-2028 (USD MILLION)
TABLE 39 Europe plastic in Electronic Components Market, By type, 2019-2028 (USD MILLION)
TABLE 40 Europe others in Electronic Components Market, By Region, 2019-2028 (USD MILLION)
TABLE 41 Europe Electronic Components Market, BY product type, 2019-2028 (USD Million)
TABLE 42 Europe Active in Electronic Components Market, By Region, 2019-2028 (USD MILLION)
TABLE 43 Europe passive in Electronic Components Market, By Region, 2019-2028 (USD Million)
TABLE 44 Europe Electromechanical Components in Electronic Components Market, By Region, 2019-2028 (USD Million)
TABLE 45 Europe Others in Electronic Components Market, By Region, 2019-2028 (USD Million)
TABLE 46 Europe Electronic Components Market, BY End Use type, 2019-2028 (USD Million)
TABLE 47 Europe Consumer Electronics in Electronic Components Market, By Region, 2019-2028 (USD MILLION)
TABLE 48 Europe NETWORKING & TELECOMMUNICATION in Electronic Components Market, By Region, 2019-2028 (USD MILLION)
TABLE 49 Europe manufacturing in Electronic Components Market, By Region, 2019-2028 (USD MILLION)
TABLE 50 Europe automotive in Electronic Components Market, By Region, 2019-2028 (USD MILLION)
TABLE 51 Europe aerospace & DEFENSE in Electronic Components Market, By Region, 2019-2028 (USD MILLION)
TABLE 52 Europe healthcare in Electronic Components Market, By Region, 2019-2028 (USD MILLION)
TABLE 53 Europe others in Electronic Components Market, By Region, 2019-2028 (USD MILLION)
TABLE 54 Europe electronic component market, By Country, 2019-2028 (USD million)
TABLE 55 EUROPE electronic component market, By Component Type, 2019-2028 (USD million)
TABLE 56 Europe Capacitors in electronic component market, By Type, 2019-2028 (USD million)
TABLE 57 Europe Diode in electronic component market, By Type, 2019-2028 (USD million)
TABLE 58 Europe Power Diode in electronic component market, By Type, 2019-2028 (USD million)
TABLE 59 Europe Switches in electronic component market, By Type, 2019-2028 (USD million)
TABLE 60 Europe Electronic Component market, By Commodities Type, 2019-2028 (USD million)
TABLE 61 Europe Brown Goods in electronic component market, By Type, 2019-2028 (USD million)
TABLE 62 Europe Brown Goods in electronic component market, By Electronic Component, 2019-2028 (USD million)
TABLE 63 Europe Brown Goods in Electronic Component market, By Material, 2019-2028 (USD million)
TABLE 64 Europe Metal in electronic component market, By Type, 2019-2028 (USD million)
TABLE 65 Europe Plastic in electronic component market, By Type, 2019-2028 (USD million)
TABLE 66 Europe White Goods in electronic component market, By Type, 2019-2028 (USD million)
TABLE 67 Europe White Goods in electronic component market, By Electronic Component, 2019-2028 (USD million)
TABLE 68 Europe White Goods in Electronic Component market, By Material, 2019-2028 (USD million)
TABLE 69 Europe Metal in electronic component market, By Type, 2019-2028 (USD million)
TABLE 70 Europe Plastic in electronic component market, By Type, 2019-2028 (USD million)
TABLE 71 Europe Small White Goods in electronic component market, By Type, 2019-2028 (USD million)
TABLE 72 Europe Small White Goods in electronic component market, By Electronic Component, 2019-2028 (USD million)
TABLE 73 Europe Small White Goods in Electronic Component market, By Material, 2019-2028 (USD million)
TABLE 74 Europe Metal in electronic component market, By Type, 2019-2028 (USD million)
TABLE 75 Europe Plastic in electronic component market, By Type, 2019-2028 (USD million)
TABLE 76 Europe electronic component market, By Product Type, 2019-2028 (USD million)
TABLE 77 EUROPE electronic component market, By End Use Type, 2019-2028 (USD million)
TABLE 78 GERMANY electronic component market, By Component Type, 2019-2028 (USD million)
TABLE 79 Germany Capacitors in electronic component market, By Type, 2019-2028 (USD million)
TABLE 80 Germany Diode in electronic component market, By Type, 2019-2028 (USD million)
TABLE 81 Germany Power Diode in electronic component market, By Type, 2019-2028 (USD million)
TABLE 82 Germany Switches in electronic component market, By Type, 2019-2028 (USD million)
TABLE 83 Germany Electronic Component market, By Commodities Type, 2019-2028 (USD million)
TABLE 84 Germany Brown Goods in electronic component market, By Type, 2019-2028 (USD million)
TABLE 85 Germany Brown Goods in electronic component market, By Electronic Component, 2019-2028 (USD million)
TABLE 86 Germany Brown Goods in Electronic Component market, By Material, 2019-2028 (USD million)
TABLE 87 Germany Metal in electronic component market, By Type, 2019-2028 (USD million)
TABLE 88 Germany Plastic in electronic component market, By Type, 2019-2028 (USD million)
TABLE 89 Germany White Goods in electronic component market, By Type, 2019-2028 (USD million)
TABLE 90 Germany White Goods in electronic component market, By Electronic Component, 2019-2028 (USD million)
TABLE 91 Germany White Goods in Electronic Component market, By Material, 2019-2028 (USD million)
TABLE 92 Germany Metal in electronic component market, By Type, 2019-2028 (USD million)
TABLE 93 Germany Plastic in electronic component market, By Type, 2019-2028 (USD million)
TABLE 94 Germany Small White Goods in electronic component market, By Type, 2019-2028 (USD million)
TABLE 95 Germany Small White Goods in electronic component market, By Electronic Component, 2019-2028 (USD million)
TABLE 96 Germany Small White Goods in Electronic Component market, By Material, 2019-2028 (USD million)
TABLE 97 Germany Metal in electronic component market, By Type, 2019-2028 (USD million)
TABLE 98 Germany Plastic in electronic component market, By Type, 2019-2028 (USD million)
TABLE 99 Germany electronic component market, By Product Type, 2019-2028 (USD million)
TABLE 100 GERMANY electronic component market, By End Use Type, 2019-2028 (USD million)
TABLE 101 FRANCE electronic component market, By Component Type, 2019-2028 (USD million)
TABLE 102 France Capacitors in electronic component market, By Type, 2019-2028 (USD million)
TABLE 103 France Diode in electronic component market, By Type, 2019-2028 (USD million)
TABLE 104 France Power Diode in electronic component market, By Type, 2019-2028 (USD million)
TABLE 105 France Switches in electronic component market, By Type, 2019-2028 (USD million)
TABLE 106 France Electronic Component market, By Commodities Type, 2019-2028 (USD million)
TABLE 107 France Brown Goods in electronic component market, By Type, 2019-2028 (USD million)
TABLE 108 France Brown Goods in electronic component market, By Electronic Component, 2019-2028 (USD million)
TABLE 109 France Brown Goods in Electronic Component market, By Material, 2019-2028 (USD million)
TABLE 110 France Metal in electronic component market, By Type, 2019-2028 (USD million)
TABLE 111 France Plastic in electronic component market, By Type, 2019-2028 (USD million)
TABLE 112 France White Goods in electronic component market, By Type, 2019-2028 (USD million)
TABLE 113 France White Goods in electronic component market, By Electronic Component, 2019-2028 (USD million)
TABLE 114 France White Goods in Electronic Component market, By Material, 2019-2028 (USD million)
TABLE 115 France Metal in electronic component market, By Type, 2019-2028 (USD million)
TABLE 116 France Plastic in electronic component market, By Type, 2019-2028 (USD million)
TABLE 117 France Small White Goods in electronic component market, By Type, 2019-2028 (USD million)
TABLE 118 France Small White Goods in electronic component market, By Electronic Component, 2019-2028 (USD million)
TABLE 119 France Small White Goods in Electronic Component market, By Material, 2019-2028 (USD million)
TABLE 120 France Metal in electronic component market, By Type, 2019-2028 (USD million)
TABLE 121 France Plastic in electronic component market, By Type, 2019-2028 (USD million)
TABLE 122 France electronic component market, By Product Type, 2019-2028 (USD million)
TABLE 123 FRANCE electronic component market, By End Use Type, 2019-2028 (USD million)
TABLE 124 U.K. electronic component market, By Component Type, 2019-2028 (USD million)
TABLE 125 U.K. Capacitors in electronic component market, By Type, 2019-2028 (USD million)
TABLE 126 U.K. Diode in electronic component market, By Type, 2019-2028 (USD million)
TABLE 127 U.K. Power Diode in electronic component market, By Type, 2019-2028 (USD million)
TABLE 128 U.K. Switches in electronic component market, By Type, 2019-2028 (USD million)
TABLE 129 U.K. Electronic Component market, By Commodities Type, 2019-2028 (USD million)
TABLE 130 U.K. Brown Goods in electronic component market, By Type, 2019-2028 (USD million)
TABLE 131 U.K. Brown Goods in electronic component market, By Electronic Component, 2019-2028 (USD million)
TABLE 132 U.K. Brown Goods in Electronic Component market, By Material, 2019-2028 (USD million)
TABLE 133 U.K. Metal in electronic component market, By Type, 2019-2028 (USD million)
TABLE 134 U.K. Plastic in electronic component market, By Type, 2019-2028 (USD million)
TABLE 135 U.K. White Goods in electronic component market, By Type, 2019-2028 (USD million)
TABLE 136 U.K. White Goods in electronic component market, By Electronic Component, 2019-2028 (USD million)
TABLE 137 U.K. White Goods in Electronic Component market, By Material, 2019-2028 (USD million)
TABLE 138 U.K. Metal in electronic component market, By Type, 2019-2028 (USD million)
TABLE 139 U.K. Plastic in electronic component market, By Type, 2019-2028 (USD million)
TABLE 140 U.K. Small White Goods in electronic component market, By Type, 2019-2028 (USD million)
TABLE 141 U.K. Small White Goods in electronic component market, By Electronic Component, 2019-2028 (USD million)
TABLE 142 U.K. Small White Goods in Electronic Component market, By Material, 2019-2028 (USD million)
TABLE 143 U.K. Metal in electronic component market, By Type, 2019-2028 (USD million)
TABLE 144 U.K. Plastic in electronic component market, By Type, 2019-2028 (USD million)
TABLE 145 U.K. electronic component market, By Product Type, 2019-2028 (USD million)
TABLE 146 U.K. electronic component market, By End Use Type, 2019-2028 (USD million)
TABLE 147 ITALY electronic component market, By Component Type, 2019-2028 (USD million)
TABLE 148 Italy Capacitors in electronic component market, By Type, 2019-2028 (USD million)
TABLE 149 Italy Diode in electronic component market, By Type, 2019-2028 (USD million)
TABLE 150 Italy Power Diode in electronic component market, By Type, 2019-2028 (USD million)
TABLE 151 Italy Switches in electronic component market, By Type, 2019-2028 (USD million)
TABLE 152 Italy Electronic Component market, By Commodities Type, 2019-2028 (USD million)
TABLE 153 Italy Brown Goods in electronic component market, By Type, 2019-2028 (USD million)
TABLE 154 Italy Brown Goods in electronic component market, By Electronic Component, 2019-2028 (USD million)
TABLE 155 Italy Brown Goods in Electronic Component market, By Material, 2019-2028 (USD million)
TABLE 156 Italy Metal in electronic component market, By Type, 2019-2028 (USD million)
TABLE 157 Italy Plastic in electronic component market, By Type, 2019-2028 (USD million)
TABLE 158 Italy White Goods in electronic component market, By Type, 2019-2028 (USD million)
TABLE 159 Italy White Goods in electronic component market, By Electronic Component, 2019-2028 (USD million)
TABLE 160 Italy White Goods in Electronic Component market, By Material, 2019-2028 (USD million)
TABLE 161 Italy Metal in electronic component market, By Type, 2019-2028 (USD million)
TABLE 162 Italy Plastic in electronic component market, By Type, 2019-2028 (USD million)
TABLE 163 Italy Small White Goods in electronic component market, By Type, 2019-2028 (USD million)
TABLE 164 Italy Small White Goods in electronic component market, By Electronic Component, 2019-2028 (USD million)
TABLE 165 Italy Small White Goods in Electronic Component market, By Material, 2019-2028 (USD million)
TABLE 166 Italy Metal in electronic component market, By Type, 2019-2028 (USD million)
TABLE 167 Italy Plastic in electronic component market, By Type, 2019-2028 (USD million)
TABLE 168 Italy electronic component market, By Product Type, 2019-2028 (USD million)
TABLE 169 ITALY electronic component market, By End Use Type, 2019-2028 (USD million)
TABLE 170 SPAIN electronic component market, By Component Type, 2019-2028 (USD million)
TABLE 171 Spain Capacitors in electronic component market, By Type, 2019-2028 (USD million)
TABLE 172 Spain Diode in electronic component market, By Type, 2019-2028 (USD million)
TABLE 173 Spain Power Diode in electronic component market, By Type, 2019-2028 (USD million)
TABLE 174 Spain Switches in electronic component market, By Type, 2019-2028 (USD million)
TABLE 175 Spain Electronic Component market, By Commodities Type, 2019-2028 (USD million)
TABLE 176 Spain Brown Goods in electronic component market, By Type, 2019-2028 (USD million)
TABLE 177 Spain Brown Goods in electronic component market, By Electronic Component, 2019-2028 (USD million)
TABLE 178 Spain Brown Goods in Electronic Component market, By Material, 2019-2028 (USD million)
TABLE 179 Spain Metal in electronic component market, By Type, 2019-2028 (USD million)
TABLE 180 Spain Plastic in electronic component market, By Type, 2019-2028 (USD million)
TABLE 181 Spain White Goods in electronic component market, By Type, 2019-2028 (USD million)
TABLE 182 Spain White Goods in electronic component market, By Electronic Component, 2019-2028 (USD million)
TABLE 183 Spain White Goods in Electronic Component market, By Material, 2019-2028 (USD million)
TABLE 184 Spain Metal in electronic component market, By Type, 2019-2028 (USD million)
TABLE 185 Spain Plastic in electronic component market, By Type, 2019-2028 (USD million)
TABLE 186 Spain Small White Goods in electronic component market, By Type, 2019-2028 (USD million)
TABLE 187 Spain Small White Goods in electronic component market, By Electronic Component, 2019-2028 (USD million)
TABLE 188 Spain Small White Goods in Electronic Component market, By Material, 2019-2028 (USD million)
TABLE 189 Spain Metal in electronic component market, By Type, 2019-2028 (USD million)
TABLE 190 Spain Plastic in electronic component market, By Type, 2019-2028 (USD million)
TABLE 191 Spain electronic component market, By Product Type, 2019-2028 (USD million)
TABLE 192 SPAIN electronic component market, By End Use Type, 2019-2028 (USD million)
TABLE 193 NETHERLANDS electronic component market, By Component Type, 2019-2028 (USD million)
TABLE 194 Netherlands Capacitors in electronic component market, By Type, 2019-2028 (USD million)
TABLE 195 Netherlands Diode in electronic component market, By Type, 2019-2028 (USD million)
TABLE 196 Netherlands Power Diode in electronic component market, By Type, 2019-2028 (USD million)
TABLE 197 Netherlands Switches in electronic component market, By Type, 2019-2028 (USD million)
TABLE 198 Netherlands Electronic Component market, By Commodities Type, 2019-2028 (USD million)
TABLE 199 Netherlands Brown Goods in electronic component market, By Type, 2019-2028 (USD million)
TABLE 200 Netherlands Brown Goods in electronic component market, By Electronic Component, 2019-2028 (USD million)
TABLE 201 Netherlands Brown Goods in Electronic Component market, By Material, 2019-2028 (USD million)
TABLE 202 Netherlands Metal in electronic component market, By Type, 2019-2028 (USD million)
TABLE 203 Netherlands Plastic in electronic component market, By Type, 2019-2028 (USD million)
TABLE 204 Netherlands White Goods in electronic component market, By Type, 2019-2028 (USD million)
TABLE 205 Netherlands White Goods in electronic component market, By Electronic Component, 2019-2028 (USD million)
TABLE 206 Netherlands White Goods in Electronic Component market, By Material, 2019-2028 (USD million)
TABLE 207 Netherlands Metal in electronic component market, By Type, 2019-2028 (USD million)
TABLE 208 Netherlands Plastic in electronic component market, By Type, 2019-2028 (USD million)
TABLE 209 Netherlands Small White Goods in electronic component market, By Type, 2019-2028 (USD million)
TABLE 210 Netherlands Small White Goods in electronic component market, By Electronic Component, 2019-2028 (USD million)
TABLE 211 Netherlands Small White Goods in Electronic Component market, By Material, 2019-2028 (USD million)
TABLE 212 Netherlands Metal in electronic component market, By Type, 2019-2028 (USD million)
TABLE 213 Netherlands Plastic in electronic component market, By Type, 2019-2028 (USD million)
TABLE 214 Netherlands electronic component market, By Product Type, 2019-2028 (USD million)
TABLE 215 NETHERLANDS electronic component market, By End Use Type, 2019-2028 (USD million)
TABLE 216 SWITZERLAND electronic component market, By Component Type, 2019-2028 (USD million)
TABLE 217 Switzerland Capacitors in electronic component market, By Type, 2019-2028 (USD million)
TABLE 218 Switzerland Diode in electronic component market, By Type, 2019-2028 (USD million)
TABLE 219 Switzerland Power Diode in electronic component market, By Type, 2019-2028 (USD million)
TABLE 220 Switzerland Switches in electronic component market, By Type, 2019-2028 (USD million)
TABLE 221 Switzerland Electronic Component market, By Commodities Type, 2019-2028 (USD million)
TABLE 222 Switzerland Brown Goods in electronic component market, By Type, 2019-2028 (USD million)
TABLE 223 Switzerland Brown Goods in electronic component market, By Electronic Component, 2019-2028 (USD million)
TABLE 224 Switzerland Brown Goods in Electronic Component market, By Material, 2019-2028 (USD million)
TABLE 225 Switzerland Metal in electronic component market, By Type, 2019-2028 (USD million)
TABLE 226 Switzerland Plastic in electronic component market, By Type, 2019-2028 (USD million)
TABLE 227 Switzerland White Goods in electronic component market, By Type, 2019-2028 (USD million)
TABLE 228 Switzerland White Goods in electronic component market, By Electronic Component, 2019-2028 (USD million)
TABLE 229 Switzerland White Goods in Electronic Component market, By Material, 2019-2028 (USD million)
TABLE 230 Switzerland Metal in electronic component market, By Type, 2019-2028 (USD million)
TABLE 231 Switzerland Plastic in electronic component market, By Type, 2019-2028 (USD million)
TABLE 232 Switzerland Small White Goods in electronic component market, By Type, 2019-2028 (USD million)
TABLE 233 Switzerland Small White Goods in electronic component market, By Electronic Component, 2019-2028 (USD million)
TABLE 234 Switzerland Small White Goods in Electronic Component market, By Material, 2019-2028 (USD million)
TABLE 235 Switzerland Metal in electronic component market, By Type, 2019-2028 (USD million)
TABLE 236 Switzerland Plastic in electronic component market, By Type, 2019-2028 (USD million)
TABLE 237 Switzerland electronic component market, By Product Type, 2019-2028 (USD million)
TABLE 238 SWITZERLAND electronic component market, By End Use Type, 2019-2028 (USD million)
TABLE 239 RUSSIA electronic component market, By Component Type, 2019-2028 (USD million)
TABLE 240 Russia Capacitors in electronic component market, By Type, 2019-2028 (USD million)
TABLE 241 Russia Diode in electronic component market, By Type, 2019-2028 (USD million)
TABLE 242 Russia Power Diode in electronic component market, By Type, 2019-2028 (USD million)
TABLE 243 Russia Switches in electronic component market, By Type, 2019-2028 (USD million)
TABLE 244 Russia Electronic Component market, By Commodities Type, 2019-2028 (USD million)
TABLE 245 Russia Brown Goods in electronic component market, By Type, 2019-2028 (USD million)
TABLE 246 Russia Brown Goods in electronic component market, By Electronic Component, 2019-2028 (USD million)
TABLE 247 Russia Brown Goods in Electronic Component market, By Material, 2019-2028 (USD million)
TABLE 248 Russia Metal in electronic component market, By Type, 2019-2028 (USD million)
TABLE 249 Russia Plastic in electronic component market, By Type, 2019-2028 (USD million)
TABLE 250 Russia White Goods in electronic component market, By Type, 2019-2028 (USD million)
TABLE 251 Russia White Goods in electronic component market, By Electronic Component, 2019-2028 (USD million)
TABLE 252 Russia White Goods in Electronic Component market, By Material, 2019-2028 (USD million)
TABLE 253 Russia Metal in electronic component market, By Type, 2019-2028 (USD million)
TABLE 254 Russia Plastic in electronic component market, By Type, 2019-2028 (USD million)
TABLE 255 Russia Small White Goods in electronic component market, By Type, 2019-2028 (USD million)
TABLE 256 Russia Small White Goods in electronic component market, By Electronic Component, 2019-2028 (USD million)
TABLE 257 Russia Small White Goods in Electronic Component market, By Material, 2019-2028 (USD million)
TABLE 258 Russia Metal in electronic component market, By Type, 2019-2028 (USD million)
TABLE 259 Russia Plastic in electronic component market, By Type, 2019-2028 (USD million)
TABLE 260 Russia electronic component market, By Product Type, 2019-2028 (USD million)
TABLE 261 RUSSIA electronic component market, By End Use Type, 2019-2028 (USD million)
TABLE 262 TURKEY electronic component market, By Component Type, 2019-2028 (USD million)
TABLE 263 Turkey Capacitors in electronic component market, By Type, 2019-2028 (USD million)
TABLE 264 Turkey Diode in electronic component market, By Type, 2019-2028 (USD million)
TABLE 265 Turkey Power Diode in electronic component market, By Type, 2019-2028 (USD million)
TABLE 266 Turkey Switches in electronic component market, By Type, 2019-2028 (USD million)
TABLE 267 Turkey Electronic Component market, By Commodities Type, 2019-2028 (USD million)
TABLE 268 Turkey Brown Goods in electronic component market, By Type, 2019-2028 (USD million)
TABLE 269 Turkey Brown Goods in electronic component market, By Electronic Component, 2019-2028 (USD million)
TABLE 270 Turkey Brown Goods in Electronic Component market, By Material, 2019-2028 (USD million)
TABLE 271 Turkey Metal in electronic component market, By Type, 2019-2028 (USD million)
TABLE 272 Turkey Plastic in electronic component market, By Type, 2019-2028 (USD million)
TABLE 273 Turkey White Goods in electronic component market, By Type, 2019-2028 (USD million)
TABLE 274 Turkey White Goods in electronic component market, By Electronic Component, 2019-2028 (USD million)
TABLE 275 Turkey White Goods in Electronic Component market, By Material, 2019-2028 (USD million)
TABLE 276 Turkey Metal in electronic component market, By Type, 2019-2028 (USD million)
TABLE 277 Turkey Plastic in electronic component market, By Type, 2019-2028 (USD million)
TABLE 278 Turkey Small White Goods in electronic component market, By Type, 2019-2028 (USD million)
TABLE 279 Turkey Small White Goods in electronic component market, By Electronic Component, 2019-2028 (USD million)
TABLE 280 Turkey Small White Goods in Electronic Component market, By Material, 2019-2028 (USD million)
TABLE 281 Turkey Metal in electronic component market, By Type, 2019-2028 (USD million)
TABLE 282 Turkey Plastic in electronic component market, By Type, 2019-2028 (USD million)
TABLE 283 Turkey electronic component market, By Product Type, 2019-2028 (USD million)
TABLE 284 TURKEY electronic component market, By End Use Type, 2019-2028 (USD million)
TABLE 285 BELGIUM electronic component market, By Component Type, 2019-2028 (USD million)
TABLE 286 Belgium Capacitors in electronic component market, By Type, 2019-2028 (USD million)
TABLE 287 Belgium Diode in electronic component market, By Type, 2019-2028 (USD million)
TABLE 288 Belgium Power Diode in electronic component market, By Type, 2019-2028 (USD million)
TABLE 289 Belgium Switches in electronic component market, By Type, 2019-2028 (USD million)
TABLE 290 Belgium Electronic Component market, By Commodities Type, 2019-2028 (USD million)
TABLE 291 Belgium Brown Goods in electronic component market, By Type, 2019-2028 (USD million)
TABLE 292 Belgium Brown Goods in electronic component market, By Electronic Component, 2019-2028 (USD million)
TABLE 293 Belgium Brown Goods in Electronic Component market, By Material, 2019-2028 (USD million)
TABLE 294 Belgium Metal in electronic component market, By Type, 2019-2028 (USD million)
TABLE 295 Belgium Plastic in electronic component market, By Type, 2019-2028 (USD million)
TABLE 296 Belgium White Goods in electronic component market, By Type, 2019-2028 (USD million)
TABLE 297 Belgium White Goods in electronic component market, By Electronic Component, 2019-2028 (USD million)
TABLE 298 Belgium White Goods in Electronic Component market, By Material, 2019-2028 (USD million)
TABLE 299 Belgium Metal in electronic component market, By Type, 2019-2028 (USD million)
TABLE 300 Belgium Plastic in electronic component market, By Type, 2019-2028 (USD million)
TABLE 301 Belgium Small White Goods in electronic component market, By Type, 2019-2028 (USD million)
TABLE 302 Belgium Small White Goods in electronic component market, By Electronic Component, 2019-2028 (USD million)
TABLE 303 Belgium Small White Goods in Electronic Component market, By Material, 2019-2028 (USD million)
TABLE 304 Belgium Metal in electronic component market, By Type, 2019-2028 (USD million)
TABLE 305 Belgium Plastic in electronic component market, By Type, 2019-2028 (USD million)
TABLE 306 Belgium electronic component market, By Product Type, 2019-2028 (USD million)
TABLE 307 BELGIUM electronic component market, By End Use Type, 2019-2028 (USD million)
TABLE 308 REST OF EUROPE electronic component market, By Component Type, 2019-2028 (USD million)
List of Figure
FIGURE 1 Europe Electronic Components Market: segmentation
FIGURE 2 Europe Electronic Components Market: data triangulation
FIGURE 3 Europe Electronic Components Market: DROC ANALYSIS
FIGURE 4 Europe Electronic Components Market: EUROPE VS REGIONAL MARKET ANALYSIS
FIGURE 5 Europe Electronic Components Market: COMPANY RESEARCH ANALYSIS
FIGURE 6 Europe Electronic Components Market: INTERVIEW DEMOGRAPHICS
FIGURE 7 Europe Electronic Components Market: DBMR MARKET POSITION GRID
FIGURE 8 Europe Electronic Components Market: vendor share analysis
FIGURE 9 Europe Electronic Components Market: SEGMENTATION
FIGURE 10 INCREASE IN DEMAND FOR SMART ELECTRONIC DEVICES is EXPECTED TO DRIVE EUROPE ELECTRONIC COMPONENTS MARKET IN THE FORECAST PERIOD OF 2021 TO 2028
FIGURE 11 Processors segment is expected to account for the largest share of Europe Electronic Components Market in 2021 & 2028
FIGURE 12 DRIVERS, RESTRAINTS, OPPORTUNITIES, AND CHALLENGES OF EUROPE Electronic Components market
FIGURE 13 COPPER PRICES (PER POUND) - 45 YEAR HISTORICAL CHART
FIGURE 14 Europe Electronic Components market: BY Component Type, 2020
FIGURE 15 Europe Electronic Components market: BY commodities type, 2020
FIGURE 16 Europe Electronic Components market: BY Product Type, 2020
FIGURE 17 Europe Electronic Components market: BY End Use type, 2020
FIGURE 18 EUROPE electronic component market: SNAPSHOT (2020)
FIGURE 19 EUROPE electronic component market: by Country (2020)
FIGURE 20 EUROPE electronic component market: by Country (2021 & 2028)
FIGURE 21 EUROPE electronic component market: by Country (2020 & 2028)
FIGURE 22 EUROPE electronic component market: by COMPONENT TYPE (2021-2028)
FIGURE 23 Europe Electronic components Market: company share 2020 (%)
FIGURE 24 NORTH AMERICA Electronic components Market: company share 2020 (%)
FIGURE 25 Europe Electronic components Market: company share 2020 (%)
FIGURE 26 Asia-Pacific Electronic components Market: company share 2020 (%)
Europe Electronic Components Market, Supply Chain Analysis and Ecosystem Framework
To support market growth and help clients navigate the impact of geopolitical shifts, DBMR has integrated in-depth supply chain analysis into its Europe Electronic Components Market research reports. This addition empowers clients to respond effectively to global changes affecting their industries. The supply chain analysis section includes detailed insights such as Europe Electronic Components Market consumption and production by country, price trend analysis, the impact of tariffs and geopolitical developments, and import and export trends by country and HSN code. It also highlights major suppliers with data on production capacity and company profiles, as well as key importers and exporters. In addition to research, DBMR offers specialized supply chain consulting services backed by over a decade of experience, providing solutions like supplier discovery, supplier risk assessment, price trend analysis, impact evaluation of inflation and trade route changes, and comprehensive market trend analysis.
Data collection and base year analysis are done using data collection modules with large sample sizes. The stage includes obtaining market information or related data through various sources and strategies. It includes examining and planning all the data acquired from the past in advance. It likewise envelops the examination of information inconsistencies seen across different information sources. The market data is analysed and estimated using market statistical and coherent models. Also, market share analysis and key trend analysis are the major success factors in the market report. To know more, please request an analyst call or drop down your inquiry.
The key research methodology used by DBMR research team is data triangulation which involves data mining, analysis of the impact of data variables on the market and primary (industry expert) validation. Data models include Vendor Positioning Grid, Market Time Line Analysis, Market Overview and Guide, Company Positioning Grid, Patent Analysis, Pricing Analysis, Company Market Share Analysis, Standards of Measurement, Global versus Regional and Vendor Share Analysis. To know more about the research methodology, drop in an inquiry to speak to our industry experts.
Data Bridge Market Research is a leader in advanced formative research. We take pride in servicing our existing and new customers with data and analysis that match and suits their goal. The report can be customized to include price trend analysis of target brands understanding the market for additional countries (ask for the list of countries), clinical trial results data, literature review, refurbished market and product base analysis. Market analysis of target competitors can be analyzed from technology-based analysis to market portfolio strategies. We can add as many competitors that you require data about in the format and data style you are looking for. Our team of analysts can also provide you data in crude raw excel files pivot tables (Fact book) or can assist you in creating presentations from the data sets available in the report.


