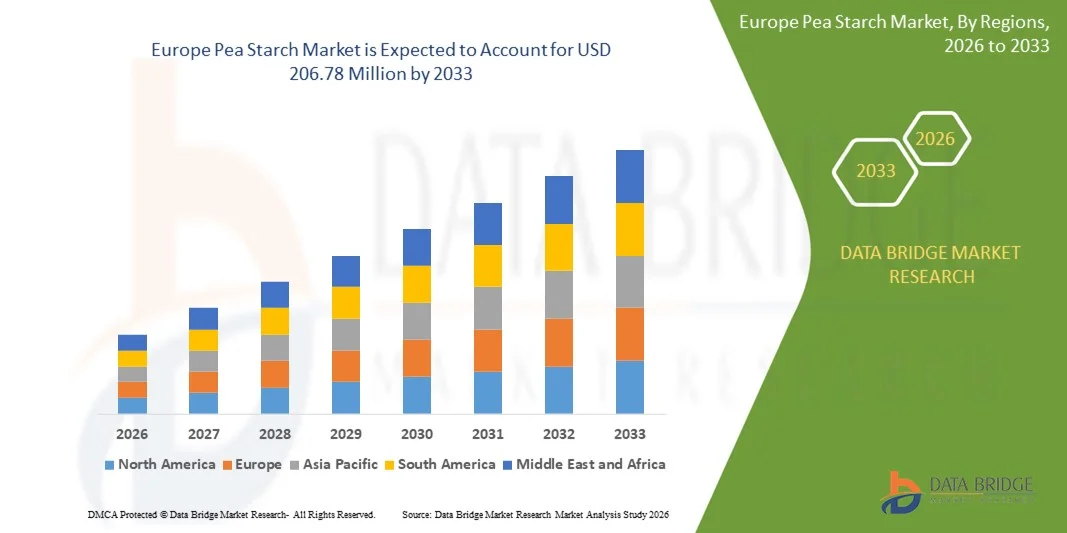
Europe Pea Starch Market
市场规模(十亿美元)
CAGR :
% 
 USD
128.70 Million
USD
206.78 Million
2025
2033
USD
128.70 Million
USD
206.78 Million
2025
2033
| 2026 –2033 | |
| USD 128.70 Million | |
| USD 206.78 Million | |
| % | |
|
歐洲豌豆澱粉市場細分,按改質方法(化學改質和物理改質)、來源(無機/基因改造和有機/非基因改造)、產品(天然豌豆澱粉和改性豌豆澱粉)、形態(粉末和液體)、等級(食品級、飼料級及工業級)、功能(黏合增稠、凝膠形成、質地改良、成膜、包衣溶脹和溶解、酵素解和酸解等)、應用(食品飲料、醫藥保健品、工業、飼料等)劃分-產業趨勢及至2033年的預測
歐洲豌豆澱粉市場規模
- 2025年歐洲豌豆澱粉市場規模為1.287億美元 ,預計 到2033年將達到2.0678億美元,預測期內 複合年增長率為6.10%。
- 市場成長主要受食品和飲料產品中對植物基和清潔標籤成分的需求不斷增長的推動。
- 烘焙、糖果、乳製品和肉類替代品等領域的應用日益廣泛,正在推動市場擴張。
歐洲豌豆澱粉市場分析
- 豌豆澱粉在食品和飲料行業中越來越多地被用作天然增稠劑、穩定劑和質地改良劑。
- 其功能特性,例如高保水性和凝膠形成能力,有助於提高產品品質和延長保質期。
- 預計到2025年,德國將佔據歐洲豌豆澱粉市場主導地位,擁有最大的收入份額,這主要得益於食品飲料、營養保健品和工業領域對植物蛋白和功能性成分的強勁需求。
- 由於消費者對天然、非基因改造和清潔標籤成分的偏好日益增長,以及植物基和功能性食品的普及,預計英國將成為歐洲豌豆澱粉市場複合年增長率(CAGR)最高的國家。產品配方創新以及人們對健康和永續發展意識的提高預計將加速市場成長。
- 預計到2025年,有機/非基因改造產品將佔據最大的市場份額,這主要得益於消費者對食品、飲料和營養保健品中天然、可持續和非基因改造成分日益增長的需求。有機/非基因改造豌豆澱粉因其安全性和健康益處而廣泛應用,從而支持清潔標籤和功能性產品配方。
報告範圍及歐洲豌豆澱粉市場細分
|
屬性 |
歐洲豌豆澱粉關鍵市場洞察 |
|
涵蓋部分 |
|
|
覆蓋國家/地區 |
歐洲
|
|
主要市場參與者 |
• Roquette Frères(法國) |
|
市場機遇 |
|
|
加值資料資訊集 |
除了對市場狀況(如市場價值、成長率、細分、地理覆蓋範圍和主要參與者)的洞察之外,Data Bridge Market Research 精心編制的市場報告還包括深入的專家分析、定價分析、品牌份額分析、消費者調查、人口統計分析、供應鏈分析、價值鏈分析、原材料/消耗品概述、供應商選擇標準、PESTLE 分析、波特五力分析和監管框架。 |
歐洲豌豆澱粉市場趨勢
對植物基和清潔標籤成分的需求不斷增長
- 消費者對天然、少加工和植物性產品的日益關注正在顯著影響豌豆澱粉市場。豌豆澱粉因其能夠改善食品配方的質地、穩定性和功能性,同時又不影響其清潔標籤定位而備受青睞。這一趨勢正促使製造商在烘焙、乳製品、肉類替代品和飲料等領域開發創新的豌豆澱粉應用。
- 人們對健康、保健和永續發展的日益關注,加速了無麩質、富含蛋白質和植物性產品對豌豆澱粉的需求。注重健康的消費者積極尋找採用天然原料配製的產品,促使品牌更重視環保的原料採購和生產流程。這也促進了原料供應商和食品生產商之間的合作,以增強產品的功能性和營養價值。
- 清潔標籤和永續性考量正在影響消費者的購買決策,製造商優先考慮透明的採購流程、環保的加工方式和相關認證。這些因素有助於品牌在競爭激烈的市場中脫穎而出,建立消費者信任,並推動有機和永續標籤的普及。行銷活動也越來越多地用於突顯這些優勢,從而增強品牌忠誠度和消費者偏好。
- 例如,2024年,領先的製造商將豌豆澱粉添加到烘焙食品、零食和植物蛋白產品中,拓展了產品線。這些新品的推出得益於消費者對天然、功能性和清潔標籤成分日益增長的需求,並透過零售、線上和專賣管道進行分銷。產品被宣傳為可持續和健康的替代品,從而提升了品牌知名度和復購率。
- 儘管豌豆澱粉的需求不斷增長,但其長期市場成長取決於持續的研發、成本效益高的生產以及保持與其他澱粉相當的功能性能。製造商也正致力於提高生產規模、供應鏈效率以及創新配方,以平衡成本、品質和永續性,從而滿足日益增長的全球需求。
歐洲豌豆澱粉市場動態
司機
消費者對植物基和清潔標籤成分的偏好日益增長
- 消費者對天然植物性成分的需求不斷增長,是豌豆澱粉市場的主要驅動力。為了滿足清潔標籤的要求、提升產品吸引力並符合監管標準,製造商正越來越多地用豌豆澱粉取代合成或改性澱粉。這一趨勢也推動了對豌豆澱粉在各種食品中的新型應用的研究,從而促進了產品多樣化。
- 豌豆澱粉在烘焙、乳製品、肉類替代品、零食和飲料等領域的應用不斷拓展,推動了市場成長。豌豆澱粉能夠改善產品的質地、保水性和保質期,同時保持天然和清潔標籤的定位,使製造商能夠滿足消費者對高品質和功能性產品的需求。
- 食品飲料生產商正透過產品創新、行銷活動和認證來推廣豌豆澱粉配方。消費者對健康和永續產品的日益增長的需求,為這些努力提供了支持,同時也促進了供應商和品牌之間的合作,以提高產品性能並減少對環境的影響。
- 例如,2023年,主要產業參與者增加了豌豆澱粉在烘焙食品和植物蛋白產品中的使用量,以滿足消費者對清潔標籤、非基因改造和功能性成分日益增長的需求。行銷活動強調永續性、可追溯性和天然來源,有助於增強消費者信任、忠誠度和產品差異化。
- 儘管清潔標籤和植物基產品趨勢推動了市場成長,但更廣泛的應用取決於成本效益、原材料供應和可擴展的生產流程。投資供應鏈優化、永續採購和先進配方技術對於滿足全球需求和保持競爭優勢至關重要。
克制/挑戰
與傳統澱粉相比,成本更高且功能受限
- 與傳統的玉米澱粉、小麥澱粉或馬鈴薯澱粉相比,豌豆澱粉成本相對較高,這限制了價格敏感型生產商的採用。複雜的加工方法和原料供應的波動也進一步推高了其價格。
- 人們對豌豆澱粉功能性益處的認知和了解有限,限制了其在某些產品類別中的應用,尤其是在新興市場。這也導致植物基成分教育推廣力道不足,減緩了創新成果的吸收速度。
- 供應鏈和分銷方面的挑戰會影響市場成長,因為豌豆澱粉需要可靠的貨源、穩定的品質以及嚴格的安全標準。物流的複雜性和儲存條件會增加營運成本,因此需要投資於妥善的處理和高效率的運輸。
- 例如,2024年,向烘焙食品、植物性食品和零食製造商供貨的分銷商報告稱,由於價格較高且人們對豌豆澱粉相對於傳統澱粉的優勢了解有限,豌豆澱粉的銷售增長速度放緩。儲存要求和認證合規性也構成了額外的障礙,影響了產品的可見度和銷售量。
- 克服這些挑戰需要提高生產效率、拓展分銷網絡,並進行針對生產者和消費者的教育活動。與零售商、餐飲服務商和認證機構的合作能夠釋放全球豌豆澱粉市場的長期成長潛力。開發具有成本競爭力的配方,並強調其功能性和可持續性優勢,對於豌豆澱粉的廣泛應用至關重要。
歐洲豌豆澱粉市場範圍
市場按改質方法、來源、產品、形態、等級、功能和應用進行細分。
- 按來源
根據來源,歐洲豌豆澱粉市場可分為無機/基因改造和有機/非基因改造兩大類。預計到2025年,有機/非基因改造豌豆澱粉將佔據最大的市場份額,這主要得益於消費者對食品、飲料和營養保健品中天然、可持續和非基因改造成分的需求日益增長。有機/非基因改造豌豆澱粉因其安全性和健康益處而廣泛應用,有助於打造清潔標籤和功能性產品配方。
預計2026年至2033年間,無機/基因改造澱粉領域將迎來最快成長,這主要得益於工業、飼料和加工食品產業對高性價比、高產澱粉應用的需求。基因改造豌豆澱粉品質穩定,功能性能優異,因此備受大型生產商青睞。
- 副產品
根據產品類型,歐洲豌豆澱粉市場可分為天然豌豆澱粉和改性豌豆澱粉。改性豌豆澱粉憑藉其在烘焙、乳製品和植物性產品中增強的增稠、黏合和質地改善等功能特性,預計在2025年將佔據最大的市場份額。改性豌豆澱粉因其用途廣泛和性能優異而被廣泛應用。
受健康食品中對加工最少、成分純淨的原料需求不斷增長的推動,預計2026年至2033年間,天然豌豆澱粉市場將迎來最快的增長。天然豌豆澱粉保留了其天然成分,同時又具有多種功能性益處,因此深受注重天然配方的生產商的青睞。
- 按表格
根據形態,歐洲豌豆澱粉市場可分為粉狀和液體狀。粉狀豌豆澱粉因其易於儲存、保質期長以及在烘焙、糖果和工業產品中的廣泛應用,預計在2025年將佔據最大的市場份額。粉狀豌豆澱粉因其在各種加工條件下的便利性和穩定性而備受青睞。
預計2026年至2033年間,液態豌豆澱粉市場將迎來最快成長,這主要得益於其更佳的溶解性、更快的分散性以及更易於添加到飲料、醬料和功能性食品配方中。液態豌豆澱粉正日益受到尋求提高製程效率和產品性能的製造商的青睞。
- 按年級
依等級劃分,歐洲豌豆澱粉市場可分為食品級、飼料級及工業級三大板塊。預計到2025年,食品級豌豆澱粉將佔據最大的市場份額,這主要得益於烘焙食品、休閒食品、植物性蛋白質和功能性食品領域的高需求。食品級豌豆澱粉因其安全性、功能性和與清潔標籤配方的兼容性而被廣泛應用。
預計2026年至2033年間,工業級豌豆澱粉市場將呈現最快的成長速度,這主要得益於黏合劑、造紙、紡織以及其他非食品產業對特殊功能特性的應用需求。工業級豌豆澱粉能夠為大規模工業生產提供可靠的性能和穩定性。
- 按功能
根據功能,歐洲豌豆澱粉市場可細分為黏合增稠、凝膠形成、質地改良、成膜、塗層、溶脹增溶、酶解和酸解以及其他用途。黏合增稠類產品在食品和工業應用中,因其能夠改善產品的質地、黏度和穩定性,預計將在2025年佔據最大的市場份額。
預計從2026年到2033年,凝膠形成劑細分市場將迎來最快的成長,這主要得益於植物性乳製品替代品、功能性食品以及需要凝膠狀質地的加工產品的需求不斷增長。凝膠形成型豌豆澱粉能夠助力新產品開發,提升其質地和感官特性。
- 透過申請
根據應用領域,歐洲豌豆澱粉市場可細分為食品飲料、醫藥保健品、工業、飼料及其他。受消費者對清潔標籤、功能性和植物性產品需求不斷增長的推動,食品飲料領域在2025年佔據最大的市場份額。豌豆澱粉廣泛應用於食品中,以改善食品的質地、穩定性和營養成分。
預計2026年至2033年間,醫藥及營養保健品領域將迎來最快成長,這主要得益於其在膳食補充品、膠囊劑、控釋製劑及其他健康相關產品的應用。豌豆澱粉在醫藥及營養保健品生產上具有功能性和工藝優勢。
歐洲豌豆澱粉市場區域分析
- 預計到2025年,德國將佔據歐洲豌豆澱粉市場主導地位,擁有最大的收入份額,這主要得益於食品飲料、營養保健品和工業領域對植物蛋白和功能性成分的強勁需求。
- 德國的消費者和製造商優先考慮天然、非基因改造和清潔標籤的成分,這有利於烘焙、零食和加工食品領域的創新。
- 強有力的監管支持,旨在促進可持續和安全食品配料的普及,進一步推動了豌豆澱粉在多種應用中的使用。
英國豌豆澱粉市場洞察
受消費者健康意識、養生理念和植物性飲食日益增強的推動,英國豌豆澱粉市場預計將在2026年至2033年間實現最快成長。消費者對功能性、非基因改造和清潔標籤成分的需求不斷增長,促使生產商拓展豌豆澱粉在食品、飲料和營養保健品中的應用。對永續採購和先進加工技術的投資進一步鞏固了市場成長,並推動了產品多元化,以滿足不斷變化的消費者偏好。
歐洲豌豆澱粉市場份額
歐洲豌豆澱粉產業主要由一些老牌企業主導,其中包括:
• Roquette Frères(法國)
• Emsland Group(德國)
• Cosucra Groupe Warcoing SA(比利時)
• Avebe UA(荷蘭)
• Südzucker AG(德國)
• Tereos SA(法國)
• Lyckeby Starch AB(
瑞典) • Agrana Stärke
GmbH(奧地利)
• CSM Oqut)
• CSM 德國)(荷蘭)
:德國 Gk Avebe Deutschland GmbH(德國)
• TST-Group GmbH(德國)
• Lyckeby Starch AB(瑞典)
• Südzucker Deutschland GmbH(德國)
歐洲豌豆澱粉市場最新動態
- 2021年9月,Cosucra集團獲得了來自SRIW、歐洲投資銀行(EIB)以及Avril集團旗下Sofiproteol的投資。這項策略性融資旨在增強Cosucra的生產能力,支持植物性配料的創新,並擴大其市場份額。該投資提升了公司為食品、飲料和工業應用開發可持續、高品質解決方案的能力,鞏固了其作為歐洲豌豆澱粉和植物基配料市場關鍵參與者的地位。
- 2021年3月,羅蓋特兄弟公司(Roquette Frères)與德爾法姆埃夫勒公司(Delpharm Evreux)達成合作,共同開發外殼完全由植物成分製成的新型軟膠囊。此次合作旨在滿足市場對植物性、清潔標章和永續營養保健品日益增長的需求。透過整合雙方在植物性原料和合約生產方面的專業知識,此次合作可望加速創新,拓展產品線,並增強功能性食品和營養保健品領域的市場競爭力。
SKU-

研究方法
数据收集和基准年分析是使用具有大样本量的数据收集模块完成的。该阶段包括通过各种来源和策略获取市场信息或相关数据。它包括提前检查和规划从过去获得的所有数据。它同样包括检查不同信息源中出现的信息不一致。使用市场统计和连贯模型分析和估计市场数据。此外,市场份额分析和关键趋势分析是市场报告中的主要成功因素。要了解更多信息,请请求分析师致电或下拉您的询问。
DBMR 研究团队使用的关键研究方法是数据三角测量,其中包括数据挖掘、数据变量对市场影响的分析和主要(行业专家)验证。数据模型包括供应商定位网格、市场时间线分析、市场概览和指南、公司定位网格、专利分析、定价分析、公司市场份额分析、测量标准、全球与区域和供应商份额分析。要了解有关研究方法的更多信息,请向我们的行业专家咨询。
可定制
Data Bridge Market Research 是高级形成性研究领域的领导者。我们为向现有和新客户提供符合其目标的数据和分析而感到自豪。报告可定制,包括目标品牌的价格趋势分析、了解其他国家的市场(索取国家列表)、临床试验结果数据、文献综述、翻新市场和产品基础分析。目标竞争对手的市场分析可以从基于技术的分析到市场组合策略进行分析。我们可以按照您所需的格式和数据样式添加您需要的任意数量的竞争对手数据。我们的分析师团队还可以为您提供原始 Excel 文件数据透视表(事实手册)中的数据,或者可以帮助您根据报告中的数据集创建演示文稿。

