Global Effervescent Tablet Market
市场规模(十亿美元)
CAGR :
% 
 USD
9.78 Billion
USD
19.06 Billion
2023
2031
USD
9.78 Billion
USD
19.06 Billion
2023
2031
| 2024 –2031 | |
| USD 9.78 Billion | |
| USD 19.06 Billion | |
| % | |
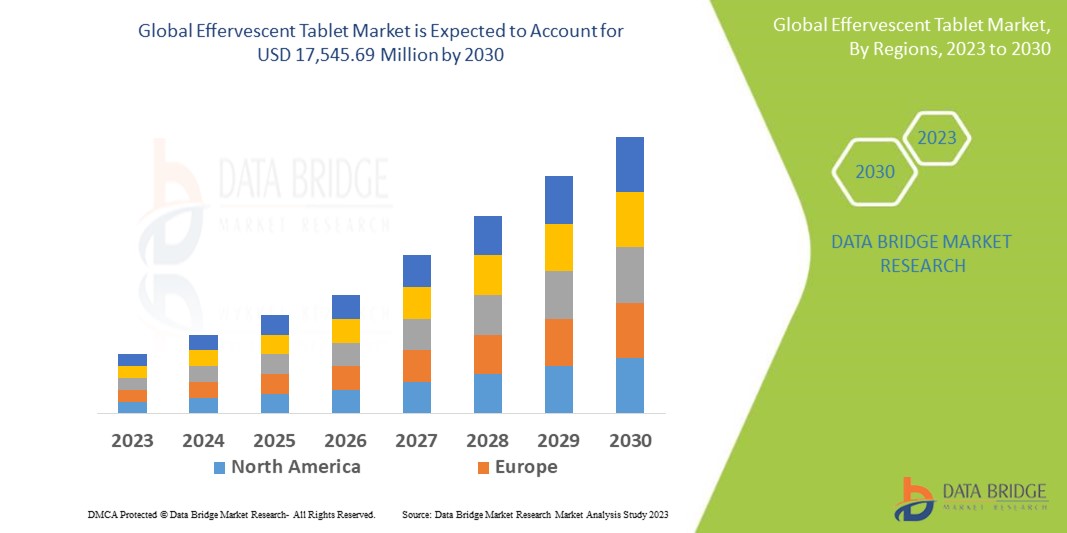
全球泡腾片市场,按产品(药物和补充剂)、方法(干法和湿法制粒)、类型(处方药和非处方药)、适应症(利尿剂、疼痛管理、胃病、呼吸系统疾病等)、人群类型(儿童和成人)、应用(牙科产品、膳食补充剂、药品等)、最终用户(医院、家庭护理、专科诊所等)、分销渠道(医院药房、网上药房和零售药房)划分——行业趋势和预测到 2031 年。
泡腾片市场分析及规模
泡腾片市场正在经历显著增长,这主要得益于几个关键因素。其中一个主要驱动因素是消费者对方便剂型的偏好日益增加,因为泡腾片是一种便携且易于使用的传统药片或胶囊替代品。泡腾片的宜人口感和泡沫特性使其对消费者,尤其是儿童和老年人更具吸引力。推动市场增长的另一个因素是人们对膳食补充剂和维生素的需求不断增长。泡腾片因其快速溶解的特性和高生物利用度而广受欢迎,可用于提供这些营养素。健康意识的增强和对预防性医疗保健的重视也促进了对泡腾片的需求不断增长。
2023 年全球泡腾片市场规模价值 97.8 亿美元,预计到 2031 年将达到 190.6 亿美元,2024 年至 2031 年预测期内的复合年增长率为 8.7%。除了对市场价值、增长率、细分、地理覆盖范围和主要参与者等市场情景的见解外,Data Bridge Market Research 策划的市场报告还包括深度专家分析、患者流行病学、管道分析、定价分析和监管框架。
报告范围和市场细分
|
报告指标 |
细节 |
|
预测期 |
2024 至 2031 年 |
|
基准年 |
2023 |
|
历史岁月 |
2022(可定制为 2016 - 2021) |
|
定量单位 |
收入(单位:十亿美元)、销量(单位:台)、定价(美元) |
|
涵盖的领域 |
产品(药物和补充剂)、方法(干法和湿法制粒)、类型(处方药和非处方药)、适应症(利尿剂、疼痛管理、胃病、呼吸系统疾病等)、人群类型(儿童和成人)、应用(牙科产品、膳食补充剂、药品等)、最终用户(医院、家庭护理、专科诊所等)、分销渠道(医院药房、网上药房和零售药房) |
|
覆盖国家 |
美国、加拿大、墨西哥、德国、法国、英国、荷兰、瑞士、比利时、俄罗斯、意大利、西班牙、土耳其、欧洲其他地区、中国、日本、印度、韩国、新加坡、马来西亚、澳大利亚、泰国、印度尼西亚、菲律宾、亚太其他地区、沙特阿拉伯、阿联酋、南非、埃及、以色列、中东和非洲其他地区、巴西、阿根廷和南美洲其他地区 |
|
涵盖的市场参与者 |
辉瑞公司(美国)、葛兰素史克公司(英国)、诺华公司(瑞士)、拜耳公司(德国)、百利高公司(爱尔兰)、利洁时集团(英国)、百时美施贵宝公司(美国)、CHIESI SAS(法国)、Hermes Pharma(奥地利)、SG Biopharm Pvt. Ltd(印度)、Bliss GVS Pharma Limited(印度)、SCITECH(印度)、Alpex Solar(瑞士)、Vovantis Laboratories(印度)、康宝莱国际(美国)、Swisse Wellness PTY LTD(澳大利亚)、Nuun(美国)、Natur Produkt Zdrovit Sp ZOO(波兰)、Vitabiotics Ltd(英国)、Amerilab Technologies Inc.(美国)和 HERMES ARZNEIMITTEL(德国) |
|
市场机会 |
|
市场定义
泡腾片的配方可快速溶解于水中,释放二氧化碳气体。这会产生起泡或发泡的溶液,通常用于医疗目的或作为膳食补充剂。泡腾片通常用于提供维生素、矿物质和其他活性成分,因其口感宜人且易于服用而广受欢迎。
泡腾片市场动态
驱动程序
- 对便捷剂型的需求不断增长
随着消费者寻求易于使用和便携的选择,对泡腾片等方便剂型的需求正在上升。泡腾片提供了一种方便的服用药物和补充剂的方式,因为它们可以溶解在水中并作为清凉饮料饮用。这种易用性使泡腾片在寻求便捷解决方案以满足其医疗保健需求的忙碌人士中特别受欢迎。此外,泡腾片的便携性使其成为随时随地服用的理想选择,使消费者可以方便地在旅途中服用药物或补充剂,而无需喝水或其他饮料。因此,泡腾片市场预计将继续增长。
- 健康意识不断增强
人们对健康和保健的日益关注推动了对膳食补充剂和维生素的需求,这些产品通常以泡腾片的形式提供。消费者越来越意识到保持健康生活方式的重要性,并积极寻求改善整体健康状况的方法。这一趋势在老龄化人口中尤为明显,他们寻求在年老时保持健康和活力的方法。泡腾片提供了一种方便有效的提供必需营养素的方法,使其在注重健康的消费者中广受欢迎。此外,泡腾片的口感和起泡特性使其对消费者更具吸引力,进一步推动了其在市场上的受欢迎程度。
机会
- 城市化进程加快
城市化正在改变人们的生活方式和饮食选择。随着人们移居到城市地区,他们的生活节奏越来越快,压力也越来越大,这促使他们更加关注健康和幸福。泡腾片是一种快速简便的补充必需营养素的方法,对于希望在繁忙日程中保持健康的城市居民来说,泡腾片是一种有吸引力的选择,这为市场增长创造了机会。
- 老年人口不断增加
泡腾片非常适合老年人,因为它们易于使用和消化。随着年龄的增长,许多人吞咽药丸或胶囊时会遇到困难,因此泡腾片是更合适的选择。此外,泡腾片可以配制以解决老年人面临的常见健康问题,例如骨骼健康、关节疼痛和认知功能。随着老年人口的增长,对泡腾片等易于使用且有效的剂型的需求预计将增加。
限制/挑战
- 其他剂型的竞争
泡腾片具有独特的优势,例如溶解迅速、口感宜人。传统剂型在市场上已广为人知,消费者往往更青睐这种剂型,因为熟悉且效果显著。此外,传统片剂和胶囊的保质期可能更长,生产成本也更低,因此对制造商而言是一种更具吸引力的选择。泡腾片制造商必须不断创新,使其产品与众不同,并让消费者相信其独特剂型的好处。这些片剂面临着来自传统片剂、胶囊和其他剂型的激烈竞争,阻碍了市场增长。
- 环境问题
泡腾片的包装和生产可能会引发环境问题,这可能会引起环保意识强的消费者的担忧。泡腾片的生产通常涉及使用塑料和其他不易回收的材料,从而产生废物。此外,泡腾片的包装(例如单独的铝箔包或管)可能会导致过多的包装废物。随着消费者对环境问题的认识不断提高,他们可能会寻找对环境影响最小的产品,这可能会导致消费者不再购买泡腾片,这对市场来说可能是一个挑战。
本市场报告详细介绍了最新发展、贸易法规、进出口分析、生产分析、价值链优化、市场份额、国内和本地市场参与者的影响,分析了新兴收入来源、市场法规变化、战略市场增长分析、市场规模、类别市场增长、应用领域和主导地位、产品批准、产品发布、地域扩展、市场技术创新等方面的机会。如需了解有关泡腾片市场的更多信息,请联系 Data Bridge Market Research 获取分析师简报,我们的团队将帮助您做出明智的市场决策,实现市场增长。
最新动态
- 2023 年 7 月,百时美施贵宝公司 (NYSE: BMY) 宣布,欧洲药品管理局 (EMA) 人用药品委员会 (CHMP) 建议批准 Opdivo (nivolumab) 作为单药疗法,用于完全切除 IIB 期或 IIC 期黑色素瘤的成人和 12 岁及以上青少年患者的辅助治疗。如果获得批准,Opdivo 将成为两项批准中唯一一种用于辅助治疗 IIB 期、IIC 期、III 期和 IV 期黑色素瘤患者的 PD-1 抑制剂
- 2023 年 7 月,拜耳与瑞士热带和公共卫生研究所 (Swiss TPH) 宣布合作,临床开发用于治疗感染土源性蠕虫的人类的复方艾莫德普赛。此次合作是在瑞士热带和公共卫生研究所及其合作伙伴在坦桑尼亚进行的 II 期研究取得良好结果之后进行的。这项研究于 2023 年 5 月 18 日发表在《新英格兰医学杂志》上,证明了艾莫德普赛对鞭虫 (Trichuris trichiura) 和钩虫 (Ancylostoma duodenale 和 Necator americanus) 感染患者的疗效
泡腾片市场范围
市场根据产品、方法、类型、适应症、应用、人口类型、最终用户、分销渠道进行细分。这些细分市场之间的增长将帮助您分析行业中增长缓慢的细分市场,并为用户提供有价值的市场概览和市场洞察,帮助他们做出战略决策,确定核心市场应用。
产品
- 药物
- 补充剂
方法
- 干法
- 湿法制粒
类型
- 处方
- 在柜台
指征
- 利尿剂
- 疼痛管理
- 胃病
- 呼吸系统疾病
- 其他的
人口类型
- 孩子们
- 成年人
应用
- 牙科产品
- 膳食补充剂
- 制药
- 其他的
最终用户
- 医院
- 家庭护理
- 专科诊所
- 其他的
分销渠道
- 医院药房
- 网上药店
- 零售药店
泡腾片市场区域分析/见解
对市场进行分析,并按上述国家、产品、方法、类型、适应症、应用、人口类型、最终用户和分销渠道提供市场规模洞察和趋势。
市场覆盖的国家包括美国、加拿大、墨西哥、德国、法国、英国、荷兰、瑞士、比利时、俄罗斯、意大利、西班牙、土耳其、欧洲其他地区、中国、日本、印度、韩国、新加坡、马来西亚、澳大利亚、泰国、印度尼西亚、菲律宾、亚太其他地区、沙特阿拉伯、阿联酋、南非、埃及、以色列、中东和非洲其他地区、巴西、阿根廷和南美洲其他地区。
由于可支配收入不断增加,欧洲预计将主导市场。此外,该地区医疗基础设施的发展和政府举措的增加预计将进一步加速市场增长。
预计北美将在预测期内实现显著增长,这是由于研发活动增加和医疗保健支出增加,这将有助于市场增长。此外,该地区的主要市场参与者将进一步刺激市场扩张。
报告的国家部分还提供了影响单个市场因素和国内市场监管变化,这些因素和变化会影响市场的当前和未来趋势。下游和上游价值链分析、技术趋势和波特五力分析、案例研究等数据点是用于预测单个国家市场情景的一些指标。此外,在提供国家数据的预测分析时,还考虑了全球品牌的存在和可用性以及它们因来自本地和国内品牌的大量或稀缺竞争而面临的挑战、国内关税和贸易路线的影响。
医疗保健基础设施增长安装基础和新技术渗透
泡腾片市场还为您提供每个国家/地区资本设备医疗保健支出增长、泡腾片市场不同类型产品的安装基数、使用生命线曲线的技术影响以及医疗保健监管情景的变化及其对泡腾片市场的影响的详细市场分析。数据适用于 2011-2021 年的历史时期。
竞争格局和泡腾片市场份额分析
The market competitive landscape provides details by competitor. Details included are company overview, company financials, revenue generated, market potential, investment in research and development, new market initiatives, global presence, production sites and facilities, production capacities, company strengths and weaknesses, product launch, product width and breadth, application dominance. The above data points provided are only related to the companies' focus related to the market.
Some of the major players operating in the market are:
- Pfizer Inc. (U.S.)
- GSK plc (U.K.)
- Novartis AG (Switzerland)
- Bayer AG (Germany)
- Perrigo Company plc (Ireland)
- Reckitt Benckiser Group PLC (U.K.)
- Bristol-Myers Squibb Company (U.S.)
- CHIESI SAS (France)
- Hermes Pharma (Austria)
- S. G. Biopharm Pvt. Ltd (India)
- Bliss GVS Pharma Limited (India)
- Scitech (India)
- Alpex Solar (Switzerland)
- Vovantis Laboratories (India)
- Herbalife International of America, Inc. (U.S.)
- Swisse Wellness PTY LTD (Australia)
- Nuun (U.S.
- Natur Produkt Zdrovit Sp Z O O (Poland)
- Vitabiotics Ltd (U.K.)
- Amerilab Technologies Inc. (U.S.)
- HERMES ARZNEIMITTEL (Germany)
SKU-

目录
- introduction
- OBJECTIVES OF THE STUDY
- MARKET DEFINITION
- OVERVIEW of Global Effervescent tablet market
- LIMITATIONs
- MARKETS COVERED
- MARKET SEGMENTATION
- MARKETS COVERED
- geographical scope
- years considered for the study
- currency and pricing
- DBMR TRIPOD DATA VALIDATION MODEL
- MULTIVARIATE MODELLING
- Products LIFELINE CURVE
- primary interviews with key opinion leaders
- DBMR MARKET POSITION GRID
- market application coverage grid
- vendor share analysis
- secondary sourcEs
- assumptions
- EXECUTIVE SUMMARY
- premium insights
- global Effervescent tablet market: regulationS
- REGULATIONS IN THE U.S.:
- REGULATIONS IN EUROPE
- REGULATIONS IN AUSTRALIA
- REGULATIONS IN JAPAN
- REGULATIONS IN CHINA
- CONSUMER BEHAVIOUR ANALYSIS- GLOBAL EFFERVESCENT TABLETS
- 消費者對其他藥物形式的偏好
- 消費者選擇泡騰片的原因
- 市場概覽
- 司機
- 慢性病增多
- 醫療保健產業研發的成長
- 泡騰片產品的優勢
- 患有慢性疾病的老年人口增加
- 維持更健康生活方式的需求上升
- 限制
- 泡騰片的缺點
- 泡騰片產品回收數量增加
- 複雜的生產工藝
- 與傳統平板電腦相比,產品價格昂貴
- 機會
- 可支配所得增加
- 主要市場參與者的策略性舉措
- 泡騰片需求上升
- 挑戰
- 偏遠及欠發達地區泡騰片產品供應短缺
- 與高鈉含量相關的限制
- COVID-19 對全球泡騰片市場的影響
- 對價格的影響
- 對需求的影響
- 對供應鏈的影響
- 製造商的策略決策
- 結論
- 全球泡騰片市場(依產品劃分)
- 概述
- 補充品
- 維生素
- 礦物質
- 藥物
- 止痛藥
- 抗酸藥
- 全球泡騰片市場(依方法)
- 概述
- 濕式製粒
- 流體化床噴霧造粒
- 有機溶劑
- 水
- 乾法
- 全球泡騰片市場(按類型)
- 概述
- 在櫃檯
- 處方
- 全球泡騰片市場(依適應症劃分)
- 概述
- 疼痛管理
- 胃病
- 呼吸系統疾病
- 利尿劑
- 其他的
- 全球泡騰片市場(依人口類型劃分)
- 概述
- 成年人
- 孩子們
- 全球泡騰片市場(按應用)
- 概述
- 製藥
- 膳食補充劑
- 牙科產品
- 其他的
- 全球泡騰片市場(依最終用戶劃分)
- 概述
- 醫院
- 專科診所
- 家庭醫療保健
- 其他的
- 全球泡騰片市場(依通路)
- 概述
- 零售藥局
- 藥局
- 電子商務
- 大型超市和超市
- 其他的
- 全球泡騰片市場(按地區)
- 概述
- 北美洲
- 我們
- 加拿大
- 墨西哥
- 南美洲
- 巴西
- 阿根廷
- 秘魯
- 南美洲其他地區
- 中東和非洲
- 南非
- 沙烏地阿拉伯
- 阿聯酋
- 埃及
- 科威特
- 以色列
- 中東和非洲其他地區
- 亞太
- 日本
- 中國
- 印度
- 韓國
- 澳洲
- 新加坡
- 泰國
- 馬來西亞
- 印尼
- 菲律賓
- 越南
- 亞太其他地區
- 歐洲
- 德國
- 義大利
- 法國
- 英國
- 西班牙
- 荷蘭
- 俄羅斯
- 瑞士
- 火雞
- 奧地利
- 挪威
- 匈牙利
- 立陶宛
- 愛爾蘭
- 波蘭
- 歐洲其他地區
- 全球泡騰片市場:公司概況
- 公司份額分析:全球
- 公司份額分析:北美
- 公司份額分析:歐洲
- 公司份額分析:亞太地區
- swot
- 公司簡介
- 葛蘭素史克公司
- 公司概況
- 收入分析
- 產品組合
- 近期發展
- 拜耳公司
- 公司概況
- 收入分析
- 產品組合
- 近期發展
- 利潔時集團
- 公司概況
- 收入分析
- 產品組合
- 近期發展
- 百利高公司
- 公司概況
- 收入分析
- 產品組合
- 近期發展
- 美國康寶萊國際公司
- 公司概況
- 收入分析
- 產品組合
- 近期發展
- 瑞士健康有限公司
- 公司概況
- 產品組合
- 近期發展
- 阿爾佩克斯
- 公司概況
- 產品組合
- 近期發展
- BLISS GVS 製藥有限公司
- 公司概況
- 收入分析
- 產品組合
- 近期發展
- 基耶西公司
- 公司概況
- 產品組合
- 近期發展
- 飲食農場
- 公司概況
- 產品組合
- 近期發展
- 愛馬仕公司
- 公司概況
- 產品組合
- 近期發展
- 努恩
- 公司概況
- 產品組合
- 近期發展
- 天然產品 ZDROVIT SP.動物園
- 公司概況
- 產品組合
- 近期發展
- 賽特
- 公司概況
- 產品組合
- 近期發展
- SG 生物製藥私人有限公司
- 公司概況
- 產品組合
- 近期發展
- 維他生物有限公司
- 公司概況
- 產品組合
- 近期發展
- Vovantis實驗室
- 公司概況
- 產品組合
- 近期發展
- 問卷
- 相關報道
表格列表
TABLE 1 global effervescent tablet MARKET, By PRODUCTS, 2019-2028 (USD Million)
TABLE 2 global supplements in effervescent tablet Market, By Region, 2019-2028 (USD Million)
TABLE 3 global supplements in effervescent tablet MARKET, By PRODUCTS, 2019-2028 (USD Million)
TABLE 4 global medication in effervescent tablet Market, By Region, 2019-2028 (USD Million)
TABLE 5 global medication in effervescent tablet MARKET, By PRODUCTS, 2019-2028 (USD Million)
TABLE 6 global effervescent tablet MARKET, By METHOD, 2019-2028 (USD Million)
TABLE 7 global wet granulation in effervescent tablet Market, By Region, 2019-2028 (USD Million)
TABLE 8 global wet granulation in effervescent tablet Market, By method, 2019-2028 (USD Million)
TABLE 9 global dry method in effervescent tablet Market, By Region, 2019-2028 (USD Million)
TABLE 10 global effervescent tablet MARKET, By TYPE, 2019-2028 (USD Million)
TABLE 11 global over the counter in effervescent tablet Market, By Region, 2019-2028 (USD Million)
TABLE 12 global prescription in effervescent tablet Market, By Region, 2019-2028 (USD Million)
TABLE 13 global effervescent tablet MARKET, By INDICATION, 2019-2028 (USD Million)
TABLE 14 global pain management in effervescent tablet Market, By Region, 2019-2028 (USD Million)
TABLE 15 global gastric disorder in effervescent tablet Market, By Region, 2019-2028 (USD Million)
TABLE 16 global respiratory diseases in effervescent tablet Market, By Region, 2019-2028 (USD Million)
TABLE 17 global diuretics in effervescent tablet Market, By Region, 2019-2028 (USD Million)
TABLE 18 global others in effervescent tablet Market, By Region, 2019-2028 (USD Million)
TABLE 19 global effervescent tablet MARKET, By POPULATION TYPE, 2019-2028 (USD Million)
TABLE 20 global adults in effervescent tablet Market, By Region, 2019-2028 (USD Million)
TABLE 21 global children in effervescent tablet Market, By Region, 2019-2028 (USD Million)
TABLE 22 global effervescent tablet MARKET, By APPLICATION, 2019-2028 (USD Million)
TABLE 23 global pharmaceutical in effervescent tablet Market, By Region, 2019-2028 (USD Million)
TABLE 24 global dietary supplements in effervescent tablet Market, By Region, 2019-2028 (USD Million)
TABLE 25 global dental productsts in effervescent tablet Market, By Region, 2019-2028 (USD Million)
TABLE 26 global others in effervescent tablet Market, By Region, 2019-2028 (USD Million)
TABLE 27 global effervescent tablet MARKET, By END USER, 2019-2028 (USD Million)
TABLE 28 global HOSPITALS in effervescent tablet Market, By Region, 2019-2028 (USD Million)
TABLE 29 global specialty clinics in effervescent tablet Market, By Region, 2019-2028 (USD Million)
TABLE 30 global home healthcare in effervescent tablet Market, By Region, 2019-2028 (USD Million)
TABLE 31 global others in effervescent tablet Market, By Region, 2019-2028 (USD Million)
TABLE 32 global effervescent tablet MARKET, By DISTRIBUTION CHANNEL, 2019-2028 (USD Million)
TABLE 33 global retail pharmacies in effervescent tablet Market, By Region, 2019-2028 (USD Million)
TABLE 34 global drug store in effervescent tablet Market, By Region, 2019-2028 (USD Million)
TABLE 35 global e-commerce in effervescent tablet Market, By Region, 2019-2028 (USD Million)
TABLE 36 global hypermarket & supermarkets in effervescent tablet Market, By Region, 2019-2028 (USD Million)
TABLE 37 global others in effervescent tablet Market, By Region, 2019-2028 (USD Million)
TABLE 38 GLOBAL Effervescent tablet market, BY REGION, 2019-2028 (USD MILLION)
TABLE 39 North America effervescent tablet market, By country, 2019-2028 (USD Million)
TABLE 40 North America effervescent tablet market, By Products, 2019-2028 (USD Million)
TABLE 41 North America Supplements in effervescent tablet market, By Products, 2019-2028 (USD Million)
TABLE 42 North America Medication in effervescent tablet market, By Products, 2019-2028 (USD Million)
TABLE 43 North America effervescent tablet market, By Method, 2019-2028 (USD Million)
TABLE 44 North America Wet Granulation in effervescent tablet market, By Method, 2019-2028 (USD Million)
TABLE 45 North America effervescent tablet market, By Type, 2019-2028 (USD Million)
TABLE 46 North America effervescent tablet market, By Indication, 2019-2028 (USD Million)
TABLE 47 North America effervescent tablet market, By Population Type, 2019-2028 (USD Million)
TABLE 48 North America effervescent tablet market, By Application, 2019-2028 (USD Million)
TABLE 49 North America effervescent tablet market, By End User, 2019-2028 (USD Million)
TABLE 50 North America effervescent tablet market, By Distribution Channel, 2019-2028 (USD Million)
TABLE 51 U.S. effervescent tablet market, By Products, 2019-2028 (USD Million)
TABLE 52 U.S. Supplements in effervescent tablet market, By Products, 2019-2028 (USD Million)
TABLE 53 U.S. Medication in effervescent tablet market, By Products, 2019-2028 (USD Million)
TABLE 54 U.S. effervescent tablet market, By Method, 2019-2028 (USD Million)
TABLE 55 U.S. Wet Granulation in effervescent tablet market, By Method, 2019-2028 (USD Million)
TABLE 56 U.S. effervescent tablet market, By Type, 2019-2028 (USD Million)
TABLE 57 U.S. effervescent tablet market, By Indication, 2019-2028 (USD Million)
TABLE 58 U.S. effervescent tablet market, By Population Type, 2019-2028 (USD Million)
TABLE 59 U.S. effervescent tablet market, By Application, 2019-2028 (USD Million)
TABLE 60 U.S. effervescent tablet market, By End User, 2019-2028 (USD Million)
TABLE 61 U.S. effervescent tablet market, By Distribution Channel, 2019-2028 (USD Million)
TABLE 62 Canada effervescent tablet market, By Products, 2019-2028 (USD Million)
TABLE 63 Canada Supplements in effervescent tablet market, By Products, 2019-2028 (USD Million)
TABLE 64 Canada Medication in effervescent tablet market, By Products, 2019-2028 (USD Million)
TABLE 65 Canada effervescent tablet market, By Method, 2019-2028 (USD Million)
TABLE 66 Canada Wet Granulation in effervescent tablet market, By Method, 2019-2028 (USD Million)
TABLE 67 Canada effervescent tablet market, By Type, 2019-2028 (USD Million)
TABLE 68 Canada effervescent tablet market, By Indication, 2019-2028 (USD Million)
TABLE 69 Canada effervescent tablet market, By Population Type, 2019-2028 (USD Million)
TABLE 70 Canada effervescent tablet market, By Application, 2019-2028 (USD Million)
TABLE 71 Canada effervescent tablet market, By End User, 2019-2028 (USD Million)
TABLE 72 Canada effervescent tablet market, By Distribution Channel, 2019-2028 (USD Million)
TABLE 73 Mexico effervescent tablet market, By Products, 2019-2028 (USD Million)
TABLE 74 Mexico Supplements in effervescent tablet market, By Products, 2019-2028 (USD Million)
TABLE 75 Mexico Medication in effervescent tablet market, By Products, 2019-2028 (USD Million)
TABLE 76 Mexico effervescent tablet market, By Method, 2019-2028 (USD Million)
TABLE 77 Mexico Wet Granulation in effervescent tablet market, By Method, 2019-2028 (USD Million)
TABLE 78 Mexico effervescent tablet market, By Type, 2019-2028 (USD Million)
TABLE 79 Mexico effervescent tablet market, By Indication, 2019-2028 (USD Million)
TABLE 80 Mexico effervescent tablet market, By Population Type, 2019-2028 (USD Million)
TABLE 81 Mexico effervescent tablet market, By Application, 2019-2028 (USD Million)
TABLE 82 Mexico effervescent tablet market, By End User, 2019-2028 (USD Million)
TABLE 83 Mexico effervescent tablet market, By Distribution Channel, 2019-2028 (USD Million)
TABLE 84 South America effervescent tablet market, By country, 2019-2028 (USD Million)
TABLE 85 South America effervescent tablet market, By Products, 2019-2028 (USD Million)
TABLE 86 South America Supplements in effervescent tablet market, By Products, 2019-2028 (USD Million)
TABLE 87 South America Medication in effervescent tablet market, By Products, 2019-2028 (USD Million)
TABLE 88 South America effervescent tablet market, By Method, 2019-2028 (USD Million)
TABLE 89 South America Wet Granulation in effervescent tablet market, By Method, 2019-2028 (USD Million)
TABLE 90 South America effervescent tablet market, By Type, 2019-2028 (USD Million)
TABLE 91 South America effervescent tablet market, By Indication, 2019-2028 (USD Million)
TABLE 92 South America effervescent tablet market, By Population Type, 2019-2028 (USD Million)
TABLE 93 South America effervescent tablet market, By Application, 2019-2028 (USD Million)
TABLE 94 South America effervescent tablet market, By End User, 2019-2028 (USD Million)
TABLE 95 South America effervescent tablet market, By Distribution Channel, 2019-2028 (USD Million)
TABLE 96 Brazil effervescent tablet market, By Products, 2019-2028 (USD Million)
TABLE 97 Brazil Supplements in effervescent tablet market, By Products, 2019-2028 (USD Million)
TABLE 98 Brazil Medication in effervescent tablet market, By Products, 2019-2028 (USD Million)
TABLE 99 Brazil effervescent tablet market, By Method, 2019-2028 (USD Million)
TABLE 100 Brazil Wet Granulation in effervescent tablet market, By Method, 2019-2028 (USD Million)
TABLE 101 Brazil effervescent tablet market, By Type, 2019-2028 (USD Million)
TABLE 102 Brazil effervescent tablet market, By Indication, 2019-2028 (USD Million)
TABLE 103 Brazil effervescent tablet market, By Population Type, 2019-2028 (USD Million)
TABLE 104 Brazil effervescent tablet market, By Application, 2019-2028 (USD Million)
TABLE 105 Brazil effervescent tablet market, By End User, 2019-2028 (USD Million)
TABLE 106 Brazil effervescent tablet market, By Distribution Channel, 2019-2028 (USD Million)
TABLE 107 Argentina effervescent tablet market, By Products, 2019-2028 (USD Million)
TABLE 108 Argentina Supplements in effervescent tablet market, By Products, 2019-2028 (USD Million)
TABLE 109 Argentina Medication in effervescent tablet market, By Products, 2019-2028 (USD Million)
TABLE 110 Argentina effervescent tablet market, By Method, 2019-2028 (USD Million)
TABLE 111 Argentina Wet Granulation in effervescent tablet market, By Method, 2019-2028 (USD Million)
TABLE 112 Argentina effervescent tablet market, By Type, 2019-2028 (USD Million)
TABLE 113 Argentina effervescent tablet market, By Indication, 2019-2028 (USD Million)
TABLE 114 Argentina effervescent tablet market, By Population Type, 2019-2028 (USD Million)
TABLE 115 Argentina effervescent tablet market, By Application, 2019-2028 (USD Million)
TABLE 116 Argentina effervescent tablet market, By End User, 2019-2028 (USD Million)
TABLE 117 Argentina effervescent tablet market, By Distribution Channel, 2019-2028 (USD Million)
TABLE 118 Peru effervescent tablet market, By Products, 2019-2028 (USD Million)
TABLE 119 Peru Supplements in effervescent tablet market, By Products, 2019-2028 (USD Million)
TABLE 120 Peru Medication in effervescent tablet market, By Products, 2019-2028 (USD Million)
TABLE 121 Peru effervescent tablet market, By Method, 2019-2028 (USD Million)
TABLE 122 Peru Wet Granulation in effervescent tablet market, By Method, 2019-2028 (USD Million)
TABLE 123 Peru effervescent tablet market, By Type, 2019-2028 (USD Million)
TABLE 124 Peru effervescent tablet market, By Indication, 2019-2028 (USD Million)
TABLE 125 Peru effervescent tablet market, By Population Type, 2019-2028 (USD Million)
TABLE 126 Peru effervescent tablet market, By Application, 2019-2028 (USD Million)
TABLE 127 Peru effervescent tablet market, By End User, 2019-2028 (USD Million)
TABLE 128 Peru effervescent tablet market, By Distribution Channel, 2019-2028 (USD Million)
TABLE 129 Rest of South America effervescent tablet market, By Products, 2019-2028 (USD Million)
TABLE 130 Middle East & Africa Effervescent tablet market, By country, 2019-2028 (USD Million)
TABLE 131 Middle East & Africa Effervescent tablet market, By Products, 2019-2028 (USD Million)
TABLE 132 Middle East & Africa Supplements in Effervescent tablet market, By Products, 2019-2028 (USD Million)
TABLE 133 Middle East & Africa Medication in Effervescent tablet market, By Products, 2019-2028 (USD Million)
TABLE 134 Middle East & Africa Effervescent tablet market, By Method, 2019-2028 (USD Million)
TABLE 135 Middle East & Africa Wet Granulation in Effervescent tablet market, By Method, 2019-2028 (USD Million)
TABLE 136 Middle East & Africa Effervescent tablet market, By Type, 2019-2028 (USD Million)
TABLE 137 Middle East & Africa Effervescent tablet market, By Indication, 2019-2028 (USD Million)
TABLE 138 Middle East & Africa Effervescent tablet market, By Population Type, 2019-2028 (USD Million)
TABLE 139 Middle East & Africa Effervescent tablet market, By Application, 2019-2028 (USD Million)
TABLE 140 Middle East & Africa Effervescent tablet market, By End User, 2019-2028 (USD Million)
TABLE 141 Middle East & Africa Effervescent tablet market, By Distribution Channel, 2019-2028 (USD Million)
TABLE 142 South Africa Effervescent tablet market, By Products, 2019-2028 (USD Million)
TABLE 143 South Africa Supplements in Effervescent tablet market, By Products, 2019-2028 (USD Million)
TABLE 144 South Africa Medication in Effervescent tablet market, By Products, 2019-2028 (USD Million)
TABLE 145 South Africa Effervescent tablet market, By Method, 2019-2028 (USD Million)
TABLE 146 South Africa Wet Granulation in Effervescent tablet market, By Method, 2019-2028 (USD Million)
TABLE 147 South Africa Effervescent tablet market, By Type, 2019-2028 (USD Million)
TABLE 148 South Africa Effervescent tablet market, By Indication, 2019-2028 (USD Million)
TABLE 149 South Africa Effervescent tablet market, By Population Type, 2019-2028 (USD Million)
TABLE 150 South Africa Effervescent tablet market, By Application, 2019-2028 (USD Million)
TABLE 151 South Africa Effervescent tablet market, By End User, 2019-2028 (USD Million)
TABLE 152 South Africa Effervescent tablet market, By Distribution Channel, 2019-2028 (USD Million)
TABLE 153 Saudi Arabia Effervescent tablet market, By Products, 2019-2028 (USD Million)
TABLE 154 Saudi Arabia Supplements in Effervescent tablet market, By Products, 2019-2028 (USD Million)
TABLE 155 Saudi Arabia Medication in Effervescent tablet market, By Products, 2019-2028 (USD Million)
TABLE 156 Saudi Arabia Effervescent tablet market, By Method, 2019-2028 (USD Million)
TABLE 157 Saudi Arabia Wet Granulation in Effervescent tablet market, By Method, 2019-2028 (USD Million)
TABLE 158 Saudi Arabia Effervescent tablet market, By Type, 2019-2028 (USD Million)
TABLE 159 Saudi Arabia Effervescent tablet market, By Indication, 2019-2028 (USD Million)
TABLE 160 Saudi Arabia Effervescent tablet market, By Population Type, 2019-2028 (USD Million)
TABLE 161 Saudi Arabia Effervescent tablet market, By Application, 2019-2028 (USD Million)
TABLE 162 Saudi Arabia Effervescent tablet market, By End User, 2019-2028 (USD Million)
TABLE 163 Saudi Arabia Effervescent tablet market, By Distribution Channel, 2019-2028 (USD Million)
表 164 阿聯酋泡騰片市場,依產品分類,2019-2028 年(百萬美元)
表 165 阿聯酋泡騰片市場補充劑,依產品分類,2019-2028 年(百萬美元)
表 166 阿聯酋泡騰片市場藥物,依產品分類,2019-2028 年(百萬美元)
表 167 阿聯酋泡騰片市場,依方法,2019-2028 年(百萬美元)
表 168 阿聯酋泡騰片市場濕式製粒情況,依方法分類,2019-2028 年(百萬美元)
表 169 阿聯酋泡騰片市場,依類型,2019-2028(百萬美元)
表 170 阿聯酋泡騰片市場,依適應症,2019-2028 年(百萬美元)
表 171 阿聯酋泡騰片市場,依人口類型,2019-2028 年(百萬美元)
表 172 阿聯酋泡騰片市場,依應用劃分,2019-2028(百萬美元)
表 173 阿聯酋泡騰片市場,依最終用戶劃分,2019-2028 年(百萬美元)
表 174 阿聯酋泡騰片市場,依通路劃分,2019-2028 年(百萬美元)
表 175 埃及泡騰片市場,依產品分類,2019-2028 年(百萬美元)
表 176 埃及泡騰片市場補充劑,依產品分類,2019-2028 年(百萬美元)
表 177 埃及泡騰片市場藥物,依產品分類,2019-2028 年(百萬美元)
表 178 埃及泡騰片市場,依方法,2019-2028(百萬美元)
表 179 埃及泡騰片市場濕式製粒狀況,依方法分類,2019-2028 年(百萬美元)
表 180 埃及泡騰片市場,依類型,2019-2028(百萬美元)
表 181 埃及泡騰片市場,依適應症,2019-2028 年(百萬美元)
表 182 埃及泡騰片市場,依人口類型,2019-2028 年(百萬美元)
表 183 埃及泡騰片市場,依應用劃分,2019-2028(百萬美元)
表 184 埃及泡騰片市場,依最終用戶劃分,2019-2028 年(百萬美元)
表 185 埃及泡騰片市場,依通路劃分,2019-2028 年(百萬美元)
表 186 科威特泡騰片市場,依產品分類,2019-2028 年(百萬美元)
表 187 科威特泡騰片市場補充劑,依產品分類,2019-2028 年(百萬美元)
表 188 科威特泡騰片市場藥物,依產品分類,2019-2028 年(百萬美元)
表 189 科威特泡騰片市場,依方法,2019-2028(百萬美元)
表 190 科威特泡騰片市場濕式製粒狀況,依方法分類,2019-2028 年(百萬美元)
表 191 科威特泡騰片市場,依類型,2019-2028(百萬美元)
表 192 科威特泡騰片市場,依適應症,2019-2028(百萬美元)
表 193 科威特泡騰片市場,依人口類型,2019-2028(百萬美元)
表 194 科威特泡騰片市場,依應用劃分,2019-2028(百萬美元)
表 195 科威特泡騰片市場,依最終使用者劃分,2019-2028 年(百萬美元)
表 196 科威特泡騰片市場,依通路劃分,2019-2028 年(百萬美元)
表 197 以色列泡騰片市場,依產品分類,2019-2028 年(百萬美元)
表 198:2019-2028 年以色列泡騰片市場補充品(按產品劃分)(百萬美元)
表 199 以色列泡騰片市場藥物,依產品分類,2019-2028 年(百萬美元)
表 200 以色列泡騰片市場(依方法劃分),2019-2028 年(百萬美元)
表 201 以色列泡騰片市場濕式製粒情況,依方法分類,2019-2028 年(百萬美元)
表 202 以色列泡騰片市場,依類型,2019-2028 年(百萬美元)
表 203 以色列泡騰片市場,依適應症,2019-2028 年(百萬美元)
表 204 以色列泡騰片市場,依人口類型,2019-2028 年(百萬美元)
表 205 以色列泡騰片市場,依應用劃分,2019-2028 年(百萬美元)
表 206 以色列泡騰片市場,依最終用戶劃分,2019-2028 年(百萬美元)
表 207 以色列泡騰片市場,依通路劃分,2019-2028 年(百萬美元)
表 208 中東和非洲其他地區泡騰片市場,依產品分類,2019-2028 年(百萬美元)
表 209 亞太泡騰片市場,依國家/地區,2019-2028 年(百萬美元)
表 210 亞太泡騰片市場,依產品分類,2019-2028 年(百萬美元)
表 211 亞太地區泡騰片補充劑市場,依產品分類,2019-2028 年(百萬美元)
表 212 亞太地區泡騰片市場藥物,依產品分類,2019-2028 年(百萬美元)
表 213 亞太泡騰片市場,依方法劃分,2019-2028 年(百萬美元)
表 214 亞太地區泡騰片濕式製粒市場,依方法分類,2019-2028 年(百萬美元)
表 215 亞太泡騰片市場,依類型,2019-2028 年(百萬美元)
表 216 亞太泡騰片市場,依適應症,2019-2028 年(百萬美元)
表 217 亞太泡騰片市場,依人口類型,2019-2028 年(百萬美元)
表 218 亞太泡騰片市場,依應用劃分,2019-2028 年(百萬美元)
表 219 亞太泡騰片市場,依最終使用者劃分,2019-2028 年(百萬美元)
表 220 亞太泡騰片市場,依通路劃分,2019-2028 年(百萬美元)
表 221 日本泡騰片市場,依產品分類,2019-2028 年(百萬美元)
表 222 日本泡騰片市場補充劑,依產品分類,2019-2028 年(百萬美元)
表 223 日本泡騰片市場藥物,依產品分類,2019-2028 年(百萬美元)
表 224 日本泡騰片市場,依方法,2019-2028 年(百萬美元)
表 225 日本泡騰片市場濕式製粒狀況,依方法分類,2019-2028 年(百萬美元)
表 226 日本泡騰片市場,依類型,2019-2028(百萬美元)
表 227 日本泡騰片市場,依適應症,2019-2028 年(百萬美元)
表 228 日本泡騰片市場,依人口類型,2019-2028 年(百萬美元)
表 229 日本泡騰片市場,依應用劃分,2019-2028(百萬美元)
表 230 日本泡騰片市場,依最終用戶劃分,2019-2028 年(百萬美元)
表 231 日本泡騰片市場,依通路劃分,2019-2028 年(百萬美元)
表 232 中國泡騰片市場,依產品分類,2019-2028 年(百萬美元)
表 233 中國泡騰片市場補充劑,依產品分類,2019-2028 年(百萬美元)
表234 中國泡騰片市場藥物,依產品分類,2019-2028年(百萬美元)
表 235 中國泡騰片市場,依方法,2019-2028(百萬美元)
表 236 中國泡騰片市場濕式製粒狀況,依方法分類,2019-2028 年(百萬美元)
表 237 中國泡騰片市場,依類型,2019-2028(百萬美元)
表 238 中國泡騰片市場,依適應症,2019-2028 年(百萬美元)
表 239 中國泡騰片市場,依人口類型,2019-2028 年(百萬美元)
表 240 中國泡騰片市場,依應用劃分,2019-2028 年(百萬美元)
表 241 中國泡騰片市場,依最終用戶劃分,2019-2028 年(百萬美元)
表 242 中國泡騰片市場,依通路劃分,2019-2028 年(百萬美元)
表 243 印度泡騰片市場,依產品劃分,2019-2028 年(百萬美元)
表 244 印度泡騰片市場補充品,依產品分類,2019-2028 年(百萬美元)
表 245 印度泡騰片市場藥物,依產品分類,2019-2028 年(百萬美元)
表 246 印度泡騰片市場,依方法劃分,2019-2028 年(百萬美元)
表 247 印度泡騰片市場濕式製粒狀況,依方法分類,2019-2028 年(百萬美元)
表 248 印度泡騰片市場,依類型,2019-2028(百萬美元)
表 249 印度泡騰片市場,依適應症,2019-2028(百萬美元)
表 250 印度泡騰片市場,依人口類型,2019-2028 年(百萬美元)
表 251 印度泡騰片市場,依應用劃分,2019-2028(百萬美元)
表 252 印度泡騰片市場,依最終用戶劃分,2019-2028 年(百萬美元)
表 253 印度泡騰片市場,依通路劃分,2019-2028 年(百萬美元)
表 254 韓國泡騰片市場,依產品分類,2019-2028(百萬美元)
表255 韓國泡騰片市場補充劑,依產品分類,2019-2028(百萬美元)
表256 韓國泡騰片市場藥物,依產品分類,2019-2028(百萬美元)
表 257 韓國泡騰片市場,依方法,2019-2028(百萬美元)
表258 韓國泡騰片市場濕式製粒狀況,依方法分類,2019-2028年(百萬美元)
表 259 韓國泡騰片市場,依類型,2019-2028(百萬美元)
表 260 韓國泡騰片市場,依適應症,2019-2028(百萬美元)
表 261 韓國泡騰片市場,依人口類型,2019-2028(百萬美元)
表 262 韓國泡騰片市場,依應用分類,2019-2028(百萬美元)
表 263 韓國泡騰片市場,依最終用戶劃分,2019-2028 年(百萬美元)
表 264 韓國泡騰片市場,依通路,2019-2028(百萬美元)
表 265 澳洲泡騰片市場,依產品分類,2019-2028 年(百萬美元)
表 266 澳洲泡騰片市場補充劑,依產品分類,2019-2028 年(百萬美元)
表 267 澳洲泡騰片市場藥物,依產品分類,2019-2028 年(百萬美元)
表 268 澳洲泡騰片市場,依方法,2019-2028 年(百萬美元)
表 269 澳洲泡騰片市場濕式製粒狀況,依方法分類,2019-2028 年(百萬美元)
表 270 澳洲泡騰片市場,依類型,2019-2028(百萬美元)
表 271 澳洲泡騰片市場,依適應症,2019-2028 年(百萬美元)
表 272 澳洲泡騰片市場,依人口類型,2019-2028 年(百萬美元)
表 273 澳洲泡騰片市場,依應用劃分,2019-2028 年(百萬美元)
表 274 澳洲泡騰片市場,依最終使用者劃分,2019-2028 年(百萬美元)
表 275 澳洲泡騰片市場,依通路劃分,2019-2028 年(百萬美元)
表 276 新加坡泡騰片市場,依產品分類,2019-2028 年(百萬美元)
表 277 新加坡泡騰片市場補充劑,依產品分類,2019-2028 年(百萬美元)
表 278 新加坡泡騰片市場藥物,依產品分類,2019-2028 年(百萬美元)
表 279 新加坡泡騰片市場,依方法,2019-2028 年(百萬美元)
表 280 新加坡泡騰片市場濕式製粒狀況,依方法分類,2019-2028 年(百萬美元)
表 281 新加坡泡騰片市場,依類型,2019-2028 年(百萬美元)
表 282 新加坡泡騰片市場,依適應症,2019-2028 年(百萬美元)
表283 新加坡泡騰片市場,依人口類型,2019-2028(百萬美元)
表 284 新加坡泡騰片市場,依應用劃分,2019-2028 年(百萬美元)
表 285 新加坡泡騰片市場,依最終用戶劃分,2019-2028 年(百萬美元)
表 286 新加坡泡騰片市場,依通路劃分,2019-2028 年(百萬美元)
表 287 泰國泡騰片市場,依產品分類,2019-2028 年(百萬美元)
表 288 泰國泡騰片市場補充劑,依產品分類,2019-2028 年(百萬美元)
表 289 泰國泡騰片市場藥物,依產品分類,2019-2028 年(百萬美元)
表 290 泰國泡騰片市場,依方法,2019-2028 年(百萬美元)
表 291 泰國泡騰片市場濕式製粒狀況,依方法分類,2019-2028 年(百萬美元)
表 292 泰國泡騰片市場,依類型,2019-2028(百萬美元)
表 293 泰國泡騰片市場,依適應症,2019-2028 年(百萬美元)
表294 泰國泡騰片市場,依人口類型,2019-2028(百萬美元)
表 295 泰國泡騰片市場,依應用劃分,2019-2028 年(百萬美元)
表 296 泰國泡騰片市場,依最終用戶劃分,2019-2028 年(百萬美元)
表 297 泰國泡騰片市場,依通路,2019-2028 年(百萬美元)
表 298 馬來西亞泡騰片市場,依產品分類,2019-2028 年(百萬美元)
表 299 馬來西亞泡騰片市場補充劑,依產品分類,2019-2028 年(百萬美元)
表 300 馬來西亞泡騰片市場藥物,依產品分類,2019-2028 年(百萬美元)
表 301 馬來西亞泡騰片市場,依方法,2019-2028 年(百萬美元)
表 302 馬來西亞泡騰片市場濕式製粒狀況,依方法分類,2019-2028 年(百萬美元)
表 303 馬來西亞泡騰片市場,依類型,2019-2028 年(百萬美元)
表 304 馬來西亞泡騰片市場,依適應症,2019-2028 年(百萬美元)
表 305 馬來西亞泡騰片市場,依人口類型,2019-2028 年(百萬美元)
表 306 馬來西亞泡騰片市場,依應用劃分,2019-2028 年(百萬美元)
表 307 馬來西亞泡騰片市場,依最終用戶劃分,2019-2028 年(百萬美元)
表 308 馬來西亞泡騰片市場,依通路,2019-2028 年(百萬美元)
表 309 印尼泡騰片市場,依產品分類,2019-2028 年(百萬美元)
表 310 印尼泡騰片市場補充劑,依產品分類,2019-2028 年(百萬美元)
表 311 印尼泡騰片市場藥物,依產品分類,2019-2028 年(百萬美元)
表 312 印尼泡騰片市場,依方法,2019-2028 年(百萬美元)
表 313 印尼泡騰片市場濕式製粒情況,依方法分類,2019-2028 年(百萬美元)
表 314 印尼泡騰片市場,依類型,2019-2028(百萬美元)
表 315 印尼泡騰片市場,依適應症,2019-2028 年(百萬美元)
表 316 印尼泡騰片市場,依人口類型,2019-2028 年(百萬美元)
表 317 印尼泡騰片市場,依應用劃分,2019-2028 年(百萬美元)
表 318 印尼泡騰片市場,依最終使用者劃分,2019-2028 年(百萬美元)
表 319 印尼泡騰片市場,依通路劃分,2019-2028 年(百萬美元)
表 320 菲律賓泡騰片市場,依產品分類,2019-2028 年(百萬美元)
表 321 菲律賓泡騰片市場補充劑,依產品分類,2019-2028 年(百萬美元)
表 322 菲律賓泡騰片市場藥物,依產品分類,2019-2028 年(百萬美元)
表 323 菲律賓泡騰片市場,依方法,2019-2028 年(百萬美元)
表 324 菲律賓泡騰片市場濕式製粒狀況,依方法分類,2019-2028 年(百萬美元)
表 325 菲律賓泡騰片市場,依類型,2019-2028(百萬美元)
表 326 菲律賓泡騰片市場,依適應症,2019-2028 年(百萬美元)
表 327 菲律賓泡騰片市場,依人口類型,2019-2028 年(百萬美元)
表 328 菲律賓泡騰片市場,依應用劃分,2019-2028(百萬美元)
表 329 菲律賓泡騰片市場,依最終用戶劃分,2019-2028 年(百萬美元)
表 330 菲律賓泡騰片市場,依通路劃分,2019-2028 年(百萬美元)
表 331 越南泡騰片市場,依產品分類,2019-2028 年(百萬美元)
表 332 越南泡騰片市場補充劑,依產品分類,2019-2028 年(百萬美元)
表 33 越南泡騰片市場藥物,依產品分類,2019-2028 年(百萬美元)
表 334 越南泡騰片市場,依方法,2019-2028(百萬美元)
表 335 越南泡騰片市場濕式製粒狀況,依方法分類,2019-2028 年(百萬美元)
表 336 越南泡騰片市場,依類型,2019-2028(百萬美元)
表 337 越南泡騰片市場,依適應症,2019-2028 年(百萬美元)
表 338 越南泡騰片市場,依人口類型,2019-2028 年(百萬美元)
表 339 越南泡騰片市場,依應用劃分,2019-2028(百萬美元)
表 340 越南泡騰片市場,依最終用戶劃分,2019-2028 年(百萬美元)
表 341 越南泡騰片市場,依通路劃分,2019-2028 年(百萬美元)
表 342 亞太其他地區泡騰片市場(依產品劃分),2019-2028 年(百萬美元)
表 343 歐洲泡騰片市場,依國家/地區,2019-2028 年(百萬美元)
表 344 歐洲泡騰片市場,依產品劃分,2019-2028 年(百萬美元)
表 345 歐洲泡騰片市場補充劑,依產品分類,2019-2028 年(百萬美元)
表 346 歐洲泡騰片市場藥物,依產品分類,2019-2028 年(百萬美元)
表 347 歐洲泡騰片市場,依方法分類,2019-2028 年(百萬美元)
表 348 歐洲泡騰片市場濕式製粒狀況,依方法分類,2019-2028 年(百萬美元)
表 349 歐洲泡騰片市場,依類型,2019-2028(百萬美元)
表 350 歐洲泡騰片市場,依適應症,2019-2028 年(百萬美元)
表 351 歐洲泡騰片市場,依人口類型,2019-2028 年(百萬美元)
表 352 歐洲泡騰片市場,依應用劃分,2019-2028 年(百萬美元)
表 353 歐洲泡騰片市場,依最終使用者劃分,2019-2028 年(百萬美元)
表 354 歐洲泡騰片市場,依通路劃分,2019-2028 年(百萬美元)
表 355 德國泡騰片市場,依產品分類,2019-2028 年(百萬美元)
表 356 德國泡騰片市場補充劑,依產品分類,2019-2028 年(百萬美元)
表 357 德國泡騰片市場藥物,依產品分類,2019-2028 年(百萬美元)
表 358 德國泡騰片市場,依方法分類,2019-2028 年(百萬美元)
表 359 德國泡騰片市場濕式製粒狀況,依方法分類,2019-2028 年(百萬美元)
表 360 德國泡騰片市場,依類型,2019-2028 年(百萬美元)
表 361 德國泡騰片市場,依適應症,2019-2028 年(百萬美元)
表 362 德國泡騰片市場,依人口類型,2019-2028 年(百萬美元)
表 363 德國泡騰片市場,依應用劃分,2019-2028 年(百萬美元)
表 364 德國泡騰片市場,依最終用戶劃分,2019-2028 年(百萬美元)
表 365 德國泡騰片市場,依通路劃分,2019-2028 年(百萬美元)
表 366 義大利泡騰片市場,依產品分類,2019-2028 年(百萬美元)
表 367 義大利泡騰片市場補充劑,依產品分類,2019-2028 年(百萬美元)
表 368 義大利泡騰片市場藥物,依產品分類,2019-2028 年(百萬美元)
表 369 義大利泡騰片市場,依方法分類,2019-2028 年(百萬美元)
表 370 義大利泡騰片市場濕式製粒情況,依方法分類,2019-2028 年(百萬美元)
表 371 義大利泡騰片市場,依類型,2019-2028(百萬美元)
表 372 義大利泡騰片市場,依適應症,2019-2028 年(百萬美元)
表 373 義大利泡騰片市場,依人口類型,2019-2028 年(百萬美元)
表 374 義大利泡騰片市場,依應用劃分,2019-2028 年(百萬美元)
表 375 義大利泡騰片市場,依最終使用者劃分,2019-2028 年(百萬美元)
表 376 義大利泡騰片市場,依通路,2019-2028 年(百萬美元)
表 377 法國泡騰片市場,依產品分類,2019-2028 年(百萬美元)
表 378 法國泡騰片市場補充劑,依產品分類,2019-2028 年(百萬美元)
表 379 法國泡騰片市場藥物,依產品分類,2019-2028 年(百萬美元)
表 380 法國泡騰片市場,依方法分類,2019-2028 年(百萬美元)
表 381 法國泡騰片市場濕式製粒狀況,依方法分類,2019-2028 年(百萬美元)
表 382 法國泡騰片市場,依類型,2019-2028 年(百萬美元)
表 383 法國泡騰片市場,依適應症,2019-2028 年(百萬美元)
表 384 法國泡騰片市場,依人口類型,2019-2028 年(百萬美元)
表 385 法國泡騰片市場,依應用劃分,2019-2028 年(百萬美元)
表 386 法國泡騰片市場,依最終用戶劃分,2019-2028 年(百萬美元)
表 387 法國泡騰片市場,依通路劃分,2019-2028 年(百萬美元)
表 388 英國泡騰片市場,依產品分類,2019-2028 年(百萬美元)
表 389 英國泡騰片市場補充劑,依產品分類,2019-2028 年(百萬美元)
表 390 英國泡騰片市場藥物,依產品分類,2019-2028 年(百萬美元)
表 391 英國泡騰片市場,依方法分類,2019-2028 年(百萬美元)
表 392 英國泡騰片市場濕式製粒狀況,依方法分類,2019-2028 年(百萬美元)
表 393 英國泡騰片市場,依類型,2019-2028 年(百萬美元)
表 394 英國泡騰片市場,依適應症,2019-2028 年(百萬美元)
表 395 英國泡騰片市場,依人口類型,2019-2028 年(百萬美元)
表 396 英國泡騰片市場,依應用劃分,2019-2028 年(百萬美元)
表 397 英國泡騰片市場,依最終使用者劃分,2019-2028 年(百萬美元)
表 398 英國泡騰片市場,依通路劃分,2019-2028 年(百萬美元)
表 399 西班牙泡騰片市場,依產品分類,2019-2028 年(百萬美元)
表 400 西班牙泡騰片市場補充劑,依產品分類,2019-2028 年(百萬美元)
表 401 西班牙泡騰片市場藥物,依產品分類,2019-2028 年(百萬美元)
表 402 西班牙泡騰片市場,依方法分類,2019-2028 年(百萬美元)
表 403 西班牙泡騰片市場濕式製粒狀況,依方法分類,2019-2028 年(百萬美元)
表 404 西班牙泡騰片市場,依類型,2019-2028(百萬美元)
表 405 西班牙泡騰片市場,依適應症,2019-2028 年(百萬美元)
表 406 西班牙泡騰片市場,依人口類型,2019-2028 年(百萬美元)
表 407 西班牙泡騰片市場,依應用劃分,2019-2028 年(百萬美元)
表 408 西班牙泡騰片市場,依最終用戶劃分,2019-2028 年(百萬美元)
表 409 西班牙泡騰片市場,依通路劃分,2019-2028 年(百萬美元)
表 410 荷蘭泡騰片市場,依產品分類,2019-2028 年(百萬美元)
表 411 荷蘭泡騰片市場補充劑,依產品分類,2019-2028 年(百萬美元)
表 412 荷蘭泡騰片市場藥物,依產品分類,2019-2028 年(百萬美元)
表 413 荷蘭泡騰片市場,依方法分類,2019-2028 年(百萬美元)
表 414 荷蘭泡騰片市場濕式製粒狀況,依方法分類,2019-2028 年(百萬美元)
表 415 荷蘭泡騰片市場,依類型,2019-2028 年(百萬美元)
表 416 荷蘭泡騰片市場,依適應症,2019-2028 年(百萬美元)
表 417 荷蘭泡騰片市場,依人口類型,2019-2028 年(百萬美元)
表 418 荷蘭泡騰片市場,依應用劃分,2019-2028 年(百萬美元)
表 419 荷蘭泡騰片市場,依最終用戶劃分,2019-2028 年(百萬美元)
表 420 荷蘭泡騰片市場,依通路劃分,2019-2028 年(百萬美元)
表 421 俄羅斯泡騰片市場,依產品分類,2019-2028 年(百萬美元)
表 422 俄羅斯泡騰片市場補充劑,依產品分類,2019-2028 年(百萬美元)
表 423 俄羅斯泡騰片市場藥物,依產品分類,2019-2028 年(百萬美元)
表 424 俄羅斯泡騰片市場,依方法分類,2019-2028 年(百萬美元)
表 425 俄羅斯泡騰片市場濕式製粒情況,依方法分類,2019-2028 年(百萬美元)
表 426 俄羅斯泡騰片市場,依類型,2019-2028(百萬美元)
表 427 俄羅斯泡騰片市場,依適應症,2019-2028 年(百萬美元)
表 428 俄羅斯泡騰片市場,依人口類型,2019-2028 年(百萬美元)
表 429 俄羅斯泡騰片市場,依應用劃分,2019-2028(百萬美元)
表 430 俄羅斯泡騰片市場,依最終用戶劃分,2019-2028 年(百萬美元)
表 431 俄羅斯泡騰片市場,依通路,2019-2028 年(百萬美元)
表 432 瑞士泡騰片市場,依產品劃分,2019-2028 年(百萬美元)
表 433 瑞士泡騰片市場補充劑,依產品分類,2019-2028 年(百萬美元)
表 434 瑞士泡騰片市場藥物,依產品分類,2019-2028 年(百萬美元)
表 435 瑞士泡騰片市場,依方法分類,2019-2028 年(百萬美元)
表 436 瑞士泡騰片市場濕式製粒狀況,依方法分類,2019-2028 年(百萬美元)
表 437 瑞士泡騰片市場,依類型,2019-2028 年(百萬美元)
表 438 瑞士泡騰片市場,依適應症,2019-2028 年(百萬美元)
表 439 瑞士泡騰片市場,依人口類型,2019-2028 年(百萬美元)
表 440 瑞士泡騰片市場,依應用劃分,2019-2028 年(百萬美元)
表 441 瑞士泡騰片市場,依最終用戶劃分,2019-2028 年(百萬美元)
表 442 瑞士泡騰片市場,依通路劃分,2019-2028 年(百萬美元)
表 443 土耳其泡騰片市場,依產品分類,2019-2028 年(百萬美元)
表 444 土耳其泡騰片市場補充劑,依產品分類,2019-2028 年(百萬美元)
表 445 土耳其泡騰片市場藥物,依產品分類,2019-2028 年(百萬美元)
表 446 土耳其泡騰片市場,依方法分類,2019-2028 年(百萬美元)
表 447 土耳其泡騰片市場濕式製粒狀況,依方法分類,2019-2028 年(百萬美元)
表 448 土耳其泡騰片市場,依類型,2019-2028(百萬美元)
表 449 土耳其泡騰片市場,依適應症,2019-2028 年(百萬美元)
表 450 土耳其泡騰片市場,依人口類型,2019-2028 年(百萬美元)
表 451 土耳其泡騰片市場,依應用劃分,2019-2028 年(百萬美元)
表 452 土耳其泡騰片市場,依最終使用者劃分,2019-2028 年(百萬美元)
表 453 土耳其泡騰片市場,依通路劃分,2019-2028 年(百萬美元)
表 454 奧地利泡騰片市場,依產品分類,2019-2028 年(百萬美元)
表 455 奧地利泡騰片市場補充劑,依產品分類,2019-2028 年(百萬美元)
表 456 奧地利泡騰片市場藥物,依產品分類,2019-2028 年(百萬美元)
表 457 奧地利泡騰片市場,依方法分類,2019-2028 年(百萬美元)
表 458 奧地利泡騰片市場濕式製粒狀況,依方法分類,2019-2028 年(百萬美元)
表 459 2019-2028 年奧地利泡騰片市場(按類型劃分)(百萬美元)
表 460 奧地利泡騰片市場,依適應症,2019-2028 年(百萬美元)
表 461 2019-2028 年奧地利泡騰片市場(依人口類型劃分)(百萬美元)
表 462 奧地利泡騰片市場,依應用劃分,2019-2028 年(百萬美元)
表 463 2019-2028 年奧地利泡騰片市場按最終用戶劃分(百萬美元)
表 464 奧地利泡騰片市場,依通路劃分,2019-2028 年(百萬美元)
表 465 挪威泡騰片市場,依產品劃分,2019-2028 年(百萬美元)
表 466 挪威泡騰片市場補充劑,依產品分類,2019-2028 年(百萬美元)
表 467 挪威泡騰片市場藥物,依產品分類,2019-2028 年(百萬美元)
表 468 2019-2028 年挪威泡騰片市場(依方法劃分)(百萬美元)
表 469 挪威泡騰片市場濕式製粒狀況,依方法分類,2019-2028 年(百萬美元)
表 470 挪威泡騰片市場,依類型,2019-2028 年(百萬美元)
表 471 挪威泡騰片市場,依適應症,2019-2028 年(百萬美元)
表 472 挪威泡騰片市場,依人口類型,2019-2028 年(百萬美元)
表 473 挪威泡騰片市場,依應用劃分,2019-2028 年(百萬美元)
表 474 2019-2028 年挪威泡騰片市場最終用戶分佈(百萬美元)
表 475 挪威泡騰片市場,依通路劃分,2019-2028 年(百萬美元)
表 476 匈牙利泡騰片市場,依產品分類,2019-2028 年(百萬美元)
表 477 匈牙利泡騰片市場補充劑,依產品分類,2019-2028 年(百萬美元)
表 478 匈牙利泡騰片市場藥物,依產品分類,2019-2028 年(百萬美元)
表 479 匈牙利泡騰片市場,依方法分類,2019-2028 年(百萬美元)
表 480 匈牙利泡騰片市場濕式製粒狀況,依方法分類,2019-2028 年(百萬美元)
表 481 2019-2028 年匈牙利泡騰片市場(按類型劃分)(百萬美元)
表 482 匈牙利泡騰片市場,依適應症,2019-2028 年(百萬美元)
表 483 2019-2028 年匈牙利泡騰片市場(按人口類型劃分)(百萬美元)
表 484 匈牙利泡騰片市場,依應用劃分,2019-2028 年(百萬美元)
表 485 匈牙利泡騰片市場,依最終用戶劃分,2019-2028 年(百萬美元)
表 486 匈牙利泡騰片市場,依通路劃分,2019-2028 年(百萬美元)
表 487 立陶宛泡騰片市場,依產品分類,2019-2028 年(百萬美元)
表 488 立陶宛泡騰片市場補充劑,依產品分類,2019-2028 年(百萬美元)
表 489 立陶宛泡騰片市場藥物,依產品分類,2019-2028 年(百萬美元)
表 490 立陶宛泡騰片市場,依方法分類,2019-2028 年(百萬美元)
表491 立陶宛泡騰片市場濕式製粒狀況,依方法分類,2019-2028年(百萬美元)
表492 立陶宛泡騰片市場,依類型,2019-2028(百萬美元)
表 493 立陶宛泡騰片市場,依適應症,2019-2028 年(百萬美元)
表494 立陶宛泡騰片市場,依人口類型,2019-2028年(百萬美元)
表495 立陶宛泡騰片市場,依應用劃分,2019-2028(百萬美元)
表 496 立陶宛泡騰片市場,依最終使用者劃分,2019-2028 年(百萬美元)
表 497 立陶宛泡騰片市場,依通路劃分,2019-2028 年(百萬美元)
表 498 愛爾蘭泡騰片市場,依產品分類,2019-2028 年(百萬美元)
表 499 愛爾蘭泡騰片市場補充劑,依產品分類,2019-2028 年(百萬美元)
表 500 愛爾蘭泡騰片市場藥物,依產品分類,2019-2028 年(百萬美元)
表 501 愛爾蘭泡騰片市場,依方法分類,2019-2028 年(百萬美元)
表 502 愛爾蘭泡騰片市場濕式製粒狀況,依方法分類,2019-2028 年(百萬美元)
表 503 愛爾蘭泡騰片市場,依類型,2019-2028 年(百萬美元)
表 504 愛爾蘭泡騰片市場,依適應症,2019-2028 年(百萬美元)
表 505 愛爾蘭泡騰片市場,依人口類型,2019-2028 年(百萬美元)
表 506 愛爾蘭泡騰片市場,依應用劃分,2019-2028 年(百萬美元)
表 507 愛爾蘭泡騰片市場,依最終用戶劃分,2019-2028 年(百萬美元)
表 508 愛爾蘭泡騰片市場,依通路劃分,2019-2028 年(百萬美元)
表 509 波蘭泡騰片市場,依產品分類,2019-2028 年(百萬美元)
表 510 波蘭泡騰片市場補充劑,依產品分類,2019-2028 年(百萬美元)
表 511 波蘭泡騰片市場藥物,依產品分類,2019-2028 年(百萬美元)
表 512 波蘭泡騰片市場,依方法分類,2019-2028 年(百萬美元)
表 513 波蘭泡騰片市場濕式製粒狀況,依方法分類,2019-2028 年(百萬美元)
表 514 波蘭泡騰片市場,依類型,2019-2028(百萬美元)
表 515 波蘭泡騰片市場,依適應症,2019-2028 年(百萬美元)
表 516 波蘭泡騰片市場,依人口類型,2019-2028 年(百萬美元)
表 517 波蘭泡騰片市場,依應用劃分,2019-2028 年(百萬美元)
表 518 波蘭泡騰片市場,依最終用戶劃分,2019-2028 年(百萬美元)
表 519 波蘭泡騰片市場,依通路劃分,2019-2028 年(百萬美元)
表 520 歐洲其他地區泡騰片市場,依產品分類,2019-2028 年(百萬美元)
图片列表
圖 1 全球泡騰片市場:細分
圖 2 全球泡騰片市場:數據三角測量
圖 3 全球泡騰片市場:DROC 分析
圖 4 全球泡騰片市場:全球與區域市場分析
圖 5 全球泡騰片市場:公司研究分析
圖 6 全球泡騰片市場:訪談人口統計
圖 7 全球泡騰片市場:DBMR 市場地位網格
圖 8 全球泡騰片市場:市場應用覆蓋網格
圖 9 全球泡騰片市場:供應商份額分析
圖 10 全球泡騰片市場:細分
圖 11 慢性病和研發活動的增加預計將推動 2021 年至 2028 年預測期內全球泡騰片市場的發展
圖 12 預計診斷領域將在 2021 年和 2028 年佔據全球泡騰片市場的最大份額
FIGURE 13 NORTH AMERICA is expected to DOMINATE the gLOBAL Effervescent tablet market and ASIA-PACIFIC IS EXPECTED TO GROW WITH THE HIGHEST CAGR IN THE FORECAST PERIOD OF 2021 TO 2028
FIGURE 14 asia-pacific is the fastest growing market for Effervescent tablet manufacturers in the forecast period of 2021 to 2028
FIGURE 15 DRIVERS, RESTRAINTS, OPPORTUNITIES AND CHALLENGEs OF Global EFFERVESCENT TABLET MARKET
FIGURE 16 global effervescent tablet market: BY PRODUCTS, 2020
FIGURE 17 global effervescent tablet market: BY PRODUCTS, 2020-2028 (USD Million)
FIGURE 18 global effervescent tablet market: BY PRODUCTS, CAGR (2021-2028)
FIGURE 19 global effervescent tablet market: BY PRODUCTS, LIFELINE CURVE
FIGURE 20 global effervescent tablet market: BY METHOD, 2020
FIGURE 21 global effervescent tablet market: BY METHOD, 2020-2028 (USD Million)
FIGURE 22 global effervescent tablet market: BY METHOD, CAGR (2021-2028)
FIGURE 23 global effervescent tablet market: BY METHOD, LIFELINE CURVE
FIGURE 24 global effervescent tablet market: BY TYPE, 2020
FIGURE 25 global effervescent tablet market: BY TYPE, 2020-2028 (USD Million)
FIGURE 26 global effervescent tablet market: BY TYPE, CAGR (2021-2028)
FIGURE 27 global effervescent tablet market: BY TYPE, LIFELINE CURVE
FIGURE 28 global effervescent tablet market: BY INDICATION, 2020
FIGURE 29 global effervescent tablet market: BY INDICATION, 2020-2028 (USD Million)
FIGURE 30 global effervescent tablet market: BY INDICATION, CAGR (2021-2028)
FIGURE 31 global effervescent tablet market: BY INDICATION, LIFELINE CURVE
FIGURE 32 global effervescent tablet market: BY POPULATION TYPE, 2020
FIGURE 33 global effervescent tablet market: BY POPULATION TYPE, 2020-2028 (USD Million)
FIGURE 34 global effervescent tablet market: BY POPULATION TYPE, CAGR (2021-2028)
FIGURE 35 global effervescent tablet market: BY POPULATION TYPE, LIFELINE CURVE
FIGURE 36 global effervescent tablet market: BY APPLICATION, 2020
FIGURE 37 global effervescent tablet market: BY APPLICATION, 2020-2028 (USD Million)
FIGURE 38 global effervescent tablet market: BY APPLICATION, CAGR (2021-2028)
FIGURE 39 global effervescent tablet market: BY APPLICATION, LIFELINE CURVE
FIGURE 40 global effervescent tablet market: BY END USER, 2020
FIGURE 41 global effervescent tablet market: BY END USER, 2020-2028 (USD Million)
FIGURE 42 global effervescent tablet market: BY END USER, CAGR (2021-2028)
FIGURE 43 global effervescent tablet market: BY END USER, LIFELINE CURVE
FIGURE 44 global effervescent tablet market: BY DISTRIBUTION CHANNEL, 2020
FIGURE 45 global effervescent tablet market: BY DISTRIBUTION CHANNEL, 2020-2028 (USD Million)
FIGURE 46 global effervescent tablet market: BY DISTRIBUTION CHANNEL, CAGR (2021-2028)
FIGURE 47 global effervescent tablet market: BY DISTRIBUTION CHANNEL, LIFELINE CURVE
FIGURE 48 GLOBAL Effervescent tablet market: SNAPSHOT (2020)
FIGURE 49 GLOBAL Effervescent tablet market: BY REGION (2020)
FIGURE 50 GLOBAL Effervescent tablet market: BY REGION (2021 & 2028)
FIGURE 51 GLOBAL Effervescent tablet market: BY REGION (2020 & 2028)
FIGURE 52 GLOBAL Effervescent tablet market: BY products (2021-2028)
FIGURE 53 NORTH AMERICA effervescent tablet market: SNAPSHOT (2020)
FIGURE 54 NORTH AMERICA EFFERVESCENT TABLET Market: BY COUNTRY (2020)
FIGURE 55 NORTH AMERICA EFFERVESCENT TABLET Market: BY COUNTRY (2021 & 2028)
FIGURE 56 NORTH AMERICA EFFERVESCENT TABLET Market: BY COUNTRY (2020 & 2028)
FIGURE 57 NORTH AMERICA EFFERVESCENT TABLET Market: BY Products (2021-2028)
FIGURE 58 SOUTH AMERICA effervescent tablet market: SNAPSHOT (2020)
FIGURE 59 SOUTH AMERICA EFFERVESCENT TABLET Market: BY COUNTRY (2020)
FIGURE 60 SOUTH AMERICA EFFERVESCENT TABLET Market: BY COUNTRY (2021 & 2028)
FIGURE 61 SOUTH AMERICA EFFERVESCENT TABLET Market: BY COUNTRY (2020 & 2028)
FIGURE 62 SOUTH AMERICA EFFERVESCENT TABLET Market: BY Products (2021-2028)
FIGURE 63 MIDDLE EAST & AFRICA Effervescent tablet market: SNAPSHOT (2020)
FIGURE 64 MIDDLE EAST & AFRICA Effervescent tablet market: BY COUNTRY (2020)
FIGURE 65 MIDDLE EAST & AFRICA Effervescent tablet market: BY COUNTRY (2021 & 2028)
FIGURE 66 MIDDLE EAST & AFRICA Effervescent tablet market: BY COUNTRY (2020 & 2028)
FIGURE 67 MIDDLE EAST & AFRICA Effervescent tablet market: BY Products (2021-2028)
FIGURE 68 ASIA-PACIFIC Effervescent tablet market: SNAPSHOT (2020)
FIGURE 69 ASIA-PACIFIC Effervescent tablet market: BY COUNTRY (2020)
FIGURE 70 ASIA-PACIFIC Effervescent tablet market: BY COUNTRY (2021 & 2028)
FIGURE 71 ASIA-PACIFIC Effervescent tablet market: BY COUNTRY (2020 & 2028)
FIGURE 72 ASIA-PACIFIC Effervescent tablet market: BY Products (2021-2028)
FIGURE 73 EUROPE effervescent tablet market: SNAPSHOT (2020)
FIGURE 74 EUROPE EFFERVESCENT TABLET Market: BY COUNTRY (2020)
FIGURE 75 EUROPE EFFERVESCENT TABLET Market: BY COUNTRY (2021 & 2028)
FIGURE 76 EUROPE EFFERVESCENT TABLET Market: BY COUNTRY (2020 & 2028)
FIGURE 77 EUROPE EFFERVESCENT TABLET Market: BY Products (2021-2028)
FIGURE 78 Global effervescent tablet Market: company share 2020 (%)
FIGURE 79 North America effervescent tablet Market: company share 2020 (%)
FIGURE 80 Europe effervescent tablet Market: company share 2020 (%)
FIGURE 81 Asia-Pacific effervescent tablet Market: company share 2020 (%)
研究方法
数据收集和基准年分析是使用具有大样本量的数据收集模块完成的。该阶段包括通过各种来源和策略获取市场信息或相关数据。它包括提前检查和规划从过去获得的所有数据。它同样包括检查不同信息源中出现的信息不一致。使用市场统计和连贯模型分析和估计市场数据。此外,市场份额分析和关键趋势分析是市场报告中的主要成功因素。要了解更多信息,请请求分析师致电或下拉您的询问。
DBMR 研究团队使用的关键研究方法是数据三角测量,其中包括数据挖掘、数据变量对市场影响的分析和主要(行业专家)验证。数据模型包括供应商定位网格、市场时间线分析、市场概览和指南、公司定位网格、专利分析、定价分析、公司市场份额分析、测量标准、全球与区域和供应商份额分析。要了解有关研究方法的更多信息,请向我们的行业专家咨询。
可定制
Data Bridge Market Research 是高级形成性研究领域的领导者。我们为向现有和新客户提供符合其目标的数据和分析而感到自豪。报告可定制,包括目标品牌的价格趋势分析、了解其他国家的市场(索取国家列表)、临床试验结果数据、文献综述、翻新市场和产品基础分析。目标竞争对手的市场分析可以从基于技术的分析到市场组合策略进行分析。我们可以按照您所需的格式和数据样式添加您需要的任意数量的竞争对手数据。我们的分析师团队还可以为您提供原始 Excel 文件数据透视表(事实手册)中的数据,或者可以帮助您根据报告中的数据集创建演示文稿。

