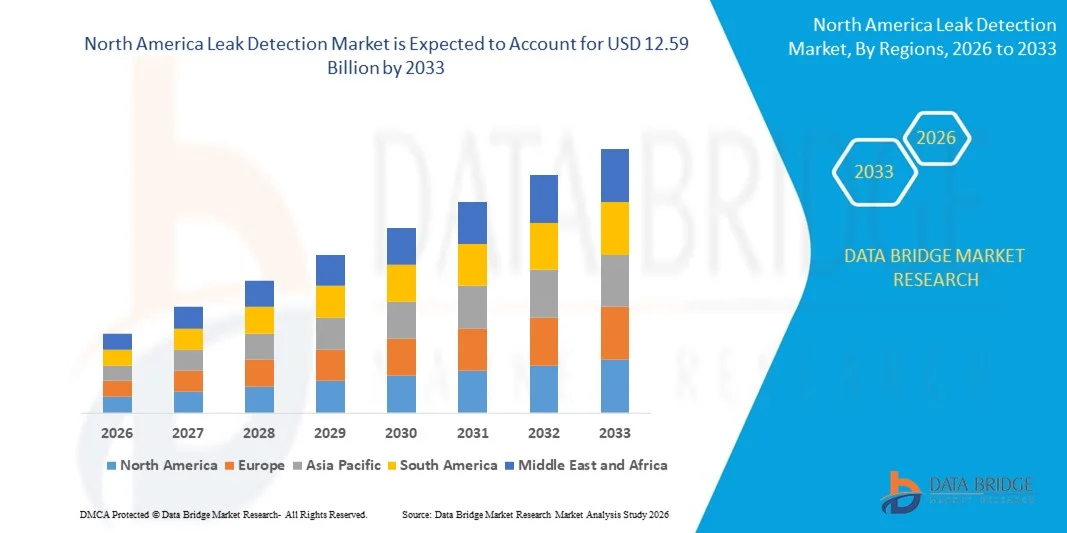
North America Leak Detection Market
市场规模(十亿美元)
CAGR :
% 
 USD
6.75 Billion
USD
12.59 Billion
2025
2033
USD
6.75 Billion
USD
12.59 Billion
2025
2033
| 2026 –2033 | |
| USD 6.75 Billion | |
| USD 12.59 Billion | |
| % | |
|
北美洩漏檢測市場細分,按類型(上游、中游和下游)、產品類型(手持式氣體檢測儀、無人機檢測儀、載人飛機檢測儀和車載檢測儀)、技術(聲學/超音波、光纖、壓力-流量偏差法、擴展實時瞬態模型(E-RT™)、熱成像、品質/體積平衡、蒸汽感測、雷射吸收和雷射雷達、液壓洩漏檢測、負壓閥及其他)、最終用戶(石油和天然氣、化工廠、水處理廠、火力發電廠、採礦和泥漿及其他)劃分——行業趨勢及至 2033 年的預測
北美洩漏檢測市場規模
- 2025年北美洩漏檢測市場規模為67.5億美元,預計2033年將達到125.9億美元,預測期間內 複合年增長率為8.1%。
- 市場成長的主要驅動力是石油天然氣、水務和化學等行業日益重視安全、環境保護和損失預防等監管措施,導致先進洩漏檢測系統的應用更加廣泛。
- 此外,老化的基礎設施、管道故障和資源損失帶來的營運風險不斷上升,促使營運商投資於即時監測和早期洩漏識別解決方案,這加速了洩漏檢測技術的部署,並推動了整體市場的擴張。
北美洩漏檢測市場分析
- 洩漏檢測系統是一種旨在識別、定位和監測管道、儲罐和工業系統中液體或氣體意外洩漏的技術,它採用感測器、軟體分析和自動化監測工具等方法,以確保安全性和運作效率。
- 對洩漏檢測解決方案日益增長的需求主要源於更嚴格的環境法規、對資產完整性管理的日益重視,以及減少關鍵基礎設施和工業運營中因未檢測到的洩漏而造成的經濟損失和停機時間的迫切需求。
- 由於美國擁有龐大的石油和天然氣管道網路、老化的水利基礎設施以及與環境保護和工業安全相關的嚴格監管,預計到2025年,美國將在洩漏檢測市場佔據主導地位。
- 由於對管道完整性管理、節水措施和更嚴格的環境法規的投資不斷增加,預計加拿大將在預測期內成為洩漏檢測市場成長最快的地區。
- 由於用於長距離運輸的油氣管道網路十分龐大,中游業務在2025年佔據了42.1%的市場份額,成為市場主導力量。中游業務面臨著因管道基礎設施老化、壓力波動以及惡劣環境條件等因素導致的高洩漏風險,因此持續監測至關重要。營運商越來越多地部署先進的洩漏檢測系統,以確保符合監管要求、最大限度地減少產品損失並防止環境損害。
報告範圍和洩漏檢測市場細分
|
屬性 |
洩漏檢測關鍵市場洞察 |
|
涵蓋部分 |
|
|
覆蓋國家/地區 |
北美洲
|
|
主要市場參與者 |
|
|
市場機遇 |
|
|
加值資料資訊集 |
除了對市場狀況(如市場價值、成長率、細分、地理覆蓋範圍和主要參與者)的洞察之外,Data Bridge Market Research 精心編制的市場報告還包括深入的專家分析、按地域劃分的公司生產和產能、分銷商和合作夥伴的網絡佈局、詳細和最新的價格趨勢分析以及供應鏈和需求的缺口分析。 |
北美洩漏檢測市場趨勢
即時和基於感測器的洩漏檢測技術應用日益廣泛
- 洩漏檢測市場的一個關鍵趨勢是,在關鍵基礎設施領域,即時和基於感測器的監控系統正日益普及,這主要是由於需要儘早發現洩漏並進行持續的資產監控。各行各業正逐漸從週期性的人工檢查轉向自動化檢測系統,以提高安全性和營運效率。
- 例如,霍尼韋爾國際公司和ABB等公司部署了先進的基於感測器的洩漏檢測解決方案,並將其與工業控制系統集成,從而實現對管道和加工設施的持續監控。這些解決方案有助於加快反應速度,並降低重大環境和經濟損失的風險。
- 石油和天然氣行業正在擴大即時洩漏檢測技術的應用範圍,以監測長距離管道和海上資產,因為在這些領域,即時檢測至關重要。這一趨勢正在推動對能夠精確定位洩漏並快速發出警報的系統的需求。
- 水務公司也正在採用基於感測器的檢測平台來解決無收益水損失和老化的配水管網問題。即時監測使操作人員能夠在小洩漏演變成重大基礎設施故障之前將其檢測出來。
- 數據分析和通訊技術的進步,透過實現集中監控和可操作的洞察,提高了基於感測器的系統效率。這一趨勢正在加速向更智慧、數位連接的洩漏檢測基礎設施轉型。
- 總體而言,對即時感測和監控解決方案日益增長的依賴正在推動市場朝著更高自動化程度、更強可靠性和更嚴格的監管合規性方向發展。
北美洩漏檢測市場動態
司機
嚴格的環境和安全法規
- 各地日益嚴格的環境和安全法規是洩漏檢測市場的主要驅動力,因為各國政府和監管機構都在實施更嚴格的標準,以防止有害洩漏和排放。石油、天然氣、化學品和水處理產業必須採用可靠的檢測系統以確保合規性。
- 例如,美國環保署和歐盟委員會等機構強制要求對管道和工業設施的洩漏進行持續監測和報告。這些法規促使營運商投資於經認證的洩漏檢測技術。
- 石油和天然氣產業在甲烷排放和洩漏預防方面面臨日益嚴格的審查,這促使先進檢測解決方案的部署不斷增加。監管壓力正促使營運商使用現代監測工具升級傳統系統。
- 化工廠和發電廠也正在採用洩漏檢測系統,以滿足職業安全標準並降低事故風險。合規要求直接影響這些產業的採購決策。
- 對環境永續性的日益重視正在加強監管力度,從而維持對洩漏檢測技術的長期需求。這項驅動因素持續推動市場成長,使洩漏檢測系統成為工業營運的必備組成部分。
克制/挑戰
高昂的部署和整合成本
- 洩漏檢測市場面臨部署和整合成本高昂的挑戰,尤其是在大型管道網路和複雜工業系統中。實施先進的檢測技術通常需要在硬體、軟體和系統整合方面進行大量前期投資。
- 例如,部署光纖或即時瞬態監測系統(例如西門子能源和艾默生電氣公司提供的系統)的公司必須投入大量資金進行安裝和校準。這些成本對於中小型業者來說可能難以負擔。
- 與現有基礎設施的整合帶來了額外的複雜性,因為老舊的管道和設施可能並非為支援現代監測系統而設計。這會增加專案工期和實施成本。
- 持續的維護、資料管理和專業人員需求會進一步增加總擁有成本。這些因素可能會延緩對成本敏感的行業的採用。
- 儘管從長遠來看具有營運效益,但高昂的初始投資仍然是一個主要障礙,尤其是在預算受限的地區。這項挑戰持續影響某些終端使用者群體的採用率和市場滲透率。
北美洩漏檢測市場範圍
市場按類型、產品類型、技術和最終用戶進行細分。
- 按類型
根據類型劃分,洩漏檢測市場可分為上游、中游和下游三個部分。預計到2025年,中游領域將佔據最大的市場份額,達到42.1%,這主要得益於用於長距離運輸的龐大油氣管道網路。由於管道基礎設施老化、壓力波動以及惡劣環境條件的影響,中游運作面臨與洩漏相關的高風險,因此持續監測至關重要。營運商越來越多地部署先進的洩漏檢測系統,以確保符合監管要求、最大限度地減少產品損失並防止環境損害。輸送管道中未被發現的洩漏造成的巨大經濟損失進一步推動了中游資產對洩漏檢測技術的應用。集中式監測系統和SCADA平台的整合也鞏固了該領域的領先地位。
預計2026年至2033年間,上游領域將迎來最快成長,這主要得益於陸上和海上油田勘探和生產活動的日益活躍。上游作業涉及複雜的油井、輸油管線和集輸系統網絡,早期洩漏檢測對於保障安全和資產完整性至關重要。對海上鑽井和非常規資源的投資不斷增加,加速了對即時監控解決方案的需求。惡劣的作業環境和高壓條件進一步推動了對先進技術的需求。減少作業停機時間的日益重視也促進了該領域技術的快速應用。
- 依產品類型
根據產品類型,洩漏檢測市場可細分為手持式氣體檢測儀、無人機氣體檢測儀、載人飛機氣體檢測儀和車載氣體檢測儀。由於手持式氣體偵測儀在日常檢查和維護活動中的廣泛應用,預計到2025年,其市場份額將佔據主導地位。這些設備因其便攜性、易用性和成本效益而備受工業場所青睞。石油和天然氣運營商、公用事業公司和化學公司依靠手持式檢測儀在現場檢查中快速識別氣體洩漏。它們能夠以高靈敏度檢測多種氣體,從而提高運行安全性。定期的監管檢查也支撐了對手持式解決方案的持續需求。
預計在預測期內,基於無人機的探測器領域將實現最快成長,這主要得益於無人機在偏遠和難以到達區域的日益普及。基於無人機的系統能夠快速巡檢長距離管道走廊、海上平台和危險區域,而無需人員冒險。感測器小型化和無人機續航能力的提升提高了探測精度和覆蓋範圍。這些系統顯著縮短了巡檢時間並降低了營運成本。自主監測解決方案的日益普及也推動了其加速應用。
- 透過技術
根據技術劃分,洩漏檢測市場包括聲學或超音波檢測、光纖檢測、壓力-流量偏差法、E-RTTM(電子即時洩漏檢測)、熱成像、品質或體積平衡法、蒸汽感測、雷射吸收和雷射雷達、液壓洩漏檢測、負壓閥等。光纖技術憑藉其遠距離連續即時監測的能力,預計將在2025年佔據最大的市場份額。光纖系統具有高靈敏度和精確的洩漏定位能力,使其適用於關鍵管道基礎設施。其抗電磁幹擾能力增強了在複雜工業環境中的可靠性。在高價值資產中日益廣泛的應用推動了其強大的市場滲透。長期運作效率也進一步鞏固了其市場主導地位。
由於雷射吸收和雷射雷達技術具有高精度和遠距離洩漏檢測能力,預計在2026年至2033年間將實現最快成長。這些技術能夠快速偵測大範圍區域的氣體排放,支援地面和空中應用。日益嚴格的環境法規促使營運商採用先進的排放監測工具。與無人機和飛機整合可增強可擴展性和覆蓋範圍。對減少甲烷排放的日益重視也加速了市場需求。
- 最終用戶
根據最終用戶,洩漏檢測市場可細分為石油天然氣、化工廠、水處理廠、火力發電廠、採礦和泥漿處理以及其他領域。預計到2025年,石油天然氣領域將佔據市場收入的主導地位,這主要得益於碳氫化合物處理和運輸過程中洩漏帶來的高風險和高成本。嚴格的安全和環境法規迫使營運商在上游、中游和下游作業中部署先進的洩漏檢測系統。大規模基礎設施和連續流作業增加了對即時監測的需求。防止收入損失和環境事故仍然是重中之重。高額的資本投資能力也為尖端技術的應用提供了支持。
預計在預測期內,水處理廠產業將以最快的速度成長,這主要受人們對水資源流失和基礎設施老化的日益關注所驅動。市政當局和公用事業公司正在採用洩漏檢測解決方案,以減少無收益水並提高供水效率。不斷增長的城市化進程給供水網路帶來了壓力,因此對早期發現洩漏的需求也日益增加。公用事業領域的數位轉型措施也促進了技術的應用。永續發展目標進一步加速了該產業的成長。
北美洩漏檢測市場區域分析
- 2025年,美國在洩漏檢測市場佔據主導地位,收入份額最大,這主要得益於其龐大的油氣管道網路、老化的水利基礎設施以及與環境保護和工業安全相關的嚴格監管。
- 洩漏檢測系統在石油天然氣作業、市政供水、化工廠和發電設施等領域的廣泛應用,得益於先進的監測基礎設施、高科技的應用以及對損失預防的高度重視,持續支撐著終端用戶行業的強勁需求。
- 霍尼韋爾國際公司、艾默生電氣公司和泰萊福瑞爾公司等主要市場參與者的強大實力,以及感測器技術、即時監控軟體和整合分析平台的不斷進步,鞏固了美國的領先地位。
加拿大洩漏檢測市場洞察
預計在2026年至2033年期間,加拿大將成為北美洩漏檢測市場中複合年增長率最高的國家,這主要得益於管道完整性管理、節水舉措以及更嚴格的環境法規方面投資的增加。例如,加拿大油氣營運商和市政公用事業公司正越來越多地部署先進的洩漏檢測解決方案,以監測長距離管道並減少無收益水損失。對減少甲烷排放、基礎設施現代化以及採用數位化監測技術的日益重視正在加速市場成長,使加拿大成為該地區成長最快的國家。
墨西哥洩漏檢測市場洞察
預計2026年至2033年間,墨西哥市場將穩定成長,這主要得益於油氣基礎設施的逐步擴張、對管道安全日益重視以及對供水網路投資的增加。煉油、輸油和市政供水等產業對洩漏檢測系統的廣泛應用,支撐了市場的持續需求。監管力度的加強、基礎設施的改造升級以及與北美技術供應商的合作,都將推動洩漏檢測市場在預測期內保持穩定成長。
北美洩漏檢測市場份額
洩漏檢測產業主要由一些老牌企業主導,其中包括:
- Teledyne FLIR LLC(美國)
- ABB(瑞典)
- 霍尼韋爾國際公司(美國)
- 西門子能源(德國)
- 濱特爾(美國)
- ClampOn AS(挪威)
- 施耐德電機(法國)
- Atmos International(英國)
- 木質部(美國)
- 艾默生電氣公司(美國)
- 科隆測量技術有限公司(德國)
- PERMA-PIPE International Holdings, Inc.(美國)
- TTK(印度)
- PSI Software SE(德國)
- HIMA(印度)
- AVEVA集團有限公司(英國)
- 橫河電機株式會社(日本)
- INFICON(瑞士)
- MAGNUM Pirex AG / MAGNUM LEO-Pipe GmbH(德國)
- 鷹牌測量系統(澳洲)
- OptaSense有限公司(英國)
北美洩漏檢測市場最新發展
- 2025年5月,全球水技術公司賽萊默(Xylem)透過其2025年合作夥伴加速器計畫推出了人工智慧驅動的洩漏檢測系統。這些創新旨在透過實現即時洩漏檢測和快速反應來增強水安全,從而應對基礎設施老化和水資源短缺等挑戰。
- 2025年3月,ChampionX公司的航空光學氣體成像(AOGI)平台獲得美國環保署(EPA)的批准。該技術結合了高清光學氣體成像和先進的雲台系統,能夠精確地檢測、定位和可視化甲烷洩漏。它特別適用於二疊紀盆地等廣闊區域,使技術人員能夠識別組件層級的洩漏,並簡化維修流程。
- 2024年11月,道達爾能源宣布計畫在2025年底前在所有上游資產上安裝即時甲烷外洩檢測設備。此舉旨在減少甲烷排放,並支持該公司在2030年實現近零甲烷排放的目標。此舉凸顯了能源產業對環境永續發展和合規性的承諾。
- 2024年10月,Airtech與Distran達成合作,將先進的洩漏檢測技術整合到複合材料製造流程中。此次合作結合了Distran的超音波洩漏檢測系統和Airtech在真空袋壓成型方面的專業技術,旨在提高複合材料的品質控制水平並減少缺陷。
- 2024年6月,摩恩與Amica保險公司達成策略合作協議,旨在推廣住宅環境中的漏水檢測技術。該合作鼓勵房主安裝漏水檢測設備,以最大限度地減少水災損失並降低與漏水相關的保險索賠。
SKU-

研究方法
数据收集和基准年分析是使用具有大样本量的数据收集模块完成的。该阶段包括通过各种来源和策略获取市场信息或相关数据。它包括提前检查和规划从过去获得的所有数据。它同样包括检查不同信息源中出现的信息不一致。使用市场统计和连贯模型分析和估计市场数据。此外,市场份额分析和关键趋势分析是市场报告中的主要成功因素。要了解更多信息,请请求分析师致电或下拉您的询问。
DBMR 研究团队使用的关键研究方法是数据三角测量,其中包括数据挖掘、数据变量对市场影响的分析和主要(行业专家)验证。数据模型包括供应商定位网格、市场时间线分析、市场概览和指南、公司定位网格、专利分析、定价分析、公司市场份额分析、测量标准、全球与区域和供应商份额分析。要了解有关研究方法的更多信息,请向我们的行业专家咨询。
可定制
Data Bridge Market Research 是高级形成性研究领域的领导者。我们为向现有和新客户提供符合其目标的数据和分析而感到自豪。报告可定制,包括目标品牌的价格趋势分析、了解其他国家的市场(索取国家列表)、临床试验结果数据、文献综述、翻新市场和产品基础分析。目标竞争对手的市场分析可以从基于技术的分析到市场组合策略进行分析。我们可以按照您所需的格式和数据样式添加您需要的任意数量的竞争对手数据。我们的分析师团队还可以为您提供原始 Excel 文件数据透视表(事实手册)中的数据,或者可以帮助您根据报告中的数据集创建演示文稿。

