
North America Leak Detection Market
Market Size in USD Billion
 USD
6.75 Billion
USD
12.59 Billion
2025
2033
USD
6.75 Billion
USD
12.59 Billion
2025
2033
| 2026 - 2033 | |
| USD 6.75 Billion | |
| USD 12.59 Billion | |
| % | |
|
North America Leak Detection Market Size
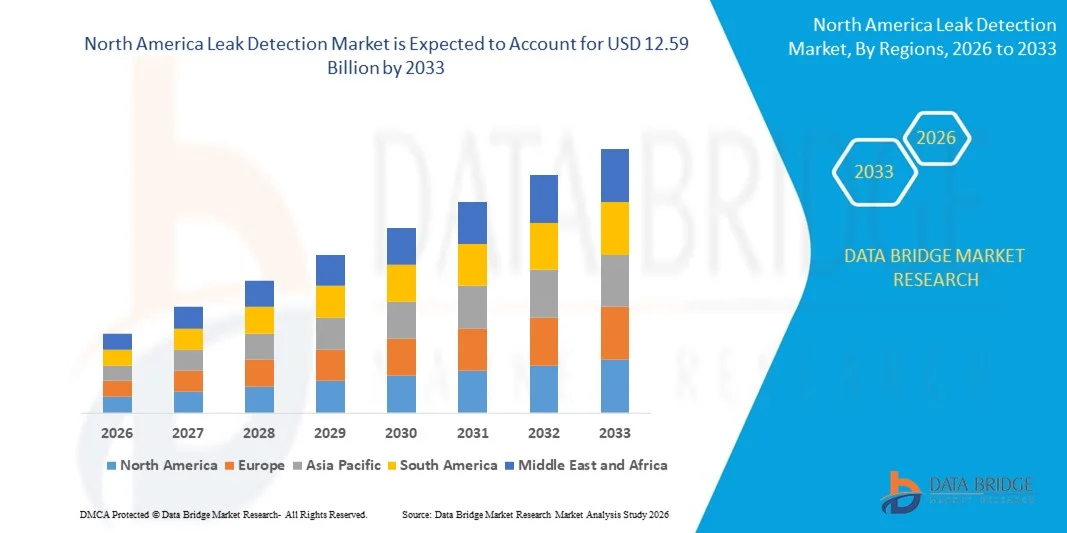
- The North America leak detection market size was valued at USD 6.75 billion in 2025 and is expected to reach USD 12.59 billion by 2033, at a CAGR of 8.1% during the forecast period
- The market growth is largely driven by increasing regulatory emphasis on safety, environmental protection, and loss prevention across industries such as oil and gas, water utilities, and chemicals, leading to higher adoption of advanced leak detection systems
- Furthermore, rising operational risks associated with aging infrastructure, pipeline failures, and resource losses are pushing operators to invest in real-time monitoring and early leak identification solutions, which is accelerating the deployment of leak detection technologies and supporting overall market expansion
North America Leak Detection Market Analysis
- Leak detection systems are technologies designed to identify, locate, and monitor unintended releases of liquids or gases in pipelines, storage tanks, and industrial systems using methods such as sensors, software analytics, and automated monitoring tools to ensure safety and operational efficiency
- The growing demand for leak detection solutions is primarily fueled by stricter environmental regulations, increasing focus on asset integrity management, and the need to reduce financial losses and downtime caused by undetected leaks across critical infrastructure and industrial operations
- U.S. dominated the leak detection market in 2025, due to extensive oil and gas pipeline networks, aging water infrastructure, and strong regulatory enforcement related to environmental protection and industrial safety
- Canada is expected to be the fastest growing region in the leak detection market during the forecast period due to increasing investments in pipeline integrity management, water conservation initiatives, and stricter environmental regulations
- Midstream segment dominated the market with a market share of 42.1% in 2025, due to the extensive network of oil and gas pipelines used for transportation over long distances. Midstream operations face high risks associated with leaks due to aging pipeline infrastructure, pressure variations, and exposure to harsh environmental conditions, making continuous monitoring essential. Operators increasingly deploy advanced leak detection systems to ensure regulatory compliance, minimize product loss, and prevent environmental damage
Report Scope and Leak Detection Market Segmentation
|
Attributes |
Leak Detection Key Market Insights |
|
Segments Covered |
|
|
Countries Covered |
North America
|
|
Key Market Players |
|
|
Market Opportunities |
|
|
Value Added Data Infosets |
In addition to the insights on market scenarios such as market value, growth rate, segmentation, geographical coverage, and major players, the market reports curated by the Data Bridge Market Research also include in-depth expert analysis, geographically represented company-wise production and capacity, network layouts of distributors and partners, detailed and updated price trend analysis and deficit analysis of supply chain and demand. |
North America Leak Detection Market Trends
Growing Use of Real-Time and Sensor-Based Leak Detection
- A key trend in the leak detection market is the growing adoption of real-time and sensor-based monitoring systems across critical infrastructure, driven by the need for early identification of leaks and continuous asset surveillance. Industries are increasingly shifting from periodic manual inspections toward automated detection systems to improve safety and operational efficiency
- For instance, companies such as Honeywell International Inc. and ABB deploy advanced sensor-based leak detection solutions integrated with industrial control systems to enable continuous monitoring of pipelines and processing facilities. These solutions support faster response times and reduce the risk of major environmental and financial losses
- The oil and gas sector is expanding its use of real-time leak detection technologies to monitor long-distance pipelines and offshore assets where immediate detection is essential. This trend is strengthening demand for systems capable of precise leak localization and rapid alert generation
- Water utilities are also adopting sensor-based detection platforms to address non-revenue water losses and aging distribution networks. Real-time monitoring enables operators to detect small leaks before they escalate into major infrastructure failures
- Advancements in data analytics and communication technologies are enhancing the effectiveness of sensor-based systems by enabling centralized monitoring and actionable insights. This trend is reinforcing the transition toward smarter, digitally connected leak detection infrastructures
- Overall, the growing reliance on real-time sensing and monitoring solutions is shaping the market toward higher automation, improved reliability, and stronger regulatory compliance across industries
North America Leak Detection Market Dynamics
Driver
Strict Environmental and Safety Regulations
- Stringent environmental and safety regulations across regions are a major driver of the leak detection market, as governments and regulatory bodies enforce stricter standards to prevent hazardous leaks and emissions. Industries handling oil, gas, chemicals, and water are required to adopt reliable detection systems to ensure compliance
- For instance, organizations such as the U.S. Environmental Protection Agency and the European Commission mandate continuous monitoring and reporting of leaks in pipelines and industrial facilities. These regulations push operators to invest in certified leak detection technologies
- The oil and gas industry faces heightened scrutiny regarding methane emissions and spill prevention, increasing deployment of advanced detection solutions. Regulatory pressure is encouraging operators to upgrade legacy systems with modern monitoring tools
- Chemical plants and power generation facilities are also adopting leak detection systems to meet occupational safety standards and reduce accident risks. Compliance requirements directly influence procurement decisions across these sectors
- The rising focus on environmental sustainability is strengthening regulatory enforcement, which sustains long-term demand for leak detection technologies. This driver continues to shape market growth by making leak detection systems a mandatory component of industrial operations
Restraint/Challenge
High Deployment and Integration Costs
- The leak detection market faces challenges related to high deployment and integration costs, particularly for large-scale pipeline networks and complex industrial systems. Implementing advanced detection technologies often requires significant upfront investment in hardware, software, and system integration
- For instance, companies deploying fiber optic or real-time transient monitoring systems, such as those supplied by Siemens Energy and Emerson Electric Co., must invest in extensive installation and calibration processes. These costs can be prohibitive for small and mid-sized operators
- Integration with legacy infrastructure presents additional complexity, as older pipelines and facilities may not be designed to support modern monitoring systems. This increases project timelines and implementation expenses
- Ongoing maintenance, data management, and skilled personnel requirements further add to total ownership costs. These factors can delay adoption in cost-sensitive industries
- Despite long-term operational benefits, the high initial investment remains a key barrier, particularly in regions with budget constraints. This challenge continues to influence adoption rates and market penetration across certain end-user segments
North America Leak Detection Market Scope
The market is segmented on the basis of type, product type, technology, and end user.
- By Type
On the basis of type, the leak detection market is segmented into upstream, midstream, and downstream. The midstream segment dominated the largest market revenue share of 42.1% in 2025, driven by the extensive network of oil and gas pipelines used for transportation over long distances. Midstream operations face high risks associated with leaks due to aging pipeline infrastructure, pressure variations, and exposure to harsh environmental conditions, making continuous monitoring essential. Operators increasingly deploy advanced leak detection systems to ensure regulatory compliance, minimize product loss, and prevent environmental damage. The high economic impact of undetected leaks in transmission pipelines further strengthens adoption across midstream assets. Integration of centralized monitoring systems and SCADA platforms also supports the dominance of this segment.
The upstream segment is anticipated to witness the fastest growth from 2026 to 2033, fueled by rising exploration and production activities in onshore and offshore fields. Upstream operations involve complex networks of wells, flowlines, and gathering systems where early leak detection is critical for safety and asset integrity. Increasing investments in offshore drilling and unconventional resources are accelerating the need for real-time monitoring solutions. Harsh operating environments and high-pressure conditions further drive demand for advanced technologies. Growing emphasis on reducing operational downtime supports rapid adoption in this segment.
- By Product Type
On the basis of product type, the leak detection market is segmented into handheld gas detectors, UAV-based detectors, manned aircraft detectors, and vehicle-based detectors. Handheld gas detectors dominated the market revenue share in 2025 due to their widespread use in routine inspections and maintenance activities. These devices are valued for their portability, ease of use, and cost-effectiveness across industrial sites. Oil and gas operators, utilities, and chemical facilities rely on handheld detectors for quick identification of gas leaks during field inspections. Their ability to detect multiple gases with high sensitivity enhances operational safety. Regular regulatory inspections also support sustained demand for handheld solutions.
The UAV-based detectors segment is expected to register the fastest growth during the forecast period, driven by the increasing use of drones for remote and hard-to-access areas. UAV-based systems enable rapid inspection of long pipeline corridors, offshore platforms, and hazardous zones without exposing personnel to risk. Advances in sensor miniaturization and drone endurance improve detection accuracy and coverage. These systems significantly reduce inspection time and operational costs. Growing acceptance of autonomous monitoring solutions supports accelerated adoption.
- By Technology
On the basis of technology, the leak detection market includes acoustic or ultrasound, fiber optic, pressure-flow deviation methods, E-RTTM, thermal imaging, mass or volume balance, vapor sensing, laser absorption and lidar, hydraulic leak detection, negative pressure valves, and others. Fiber optic technology accounted for the largest revenue share in 2025, driven by its capability for continuous, real-time monitoring over long distances. Fiber optic systems offer high sensitivity and precise leak localization, making them suitable for critical pipeline infrastructure. Their immunity to electromagnetic interference enhances reliability in complex industrial environments. Increasing deployment in high-value assets supports strong market penetration. Long-term operational efficiency further contributes to dominance.
Laser absorption and lidar technology is projected to witness the fastest growth from 2026 to 2033 due to its high accuracy and ability to detect leaks from a distance. These technologies enable rapid detection of gas emissions across wide areas, supporting both ground-based and aerial applications. Rising environmental regulations push operators to adopt advanced emission monitoring tools. Integration with UAVs and aircraft enhances scalability and coverage. Growing focus on methane emission reduction accelerates demand.
- By End User
On the basis of end user, the leak detection market is segmented into oil and gas, chemical plants, water treatment plants, thermal power plants, mining and slurry, and others. The oil and gas segment dominated the market revenue share in 2025, driven by the high risk and cost associated with leaks in hydrocarbon handling and transportation. Strict safety and environmental regulations compel operators to deploy advanced leak detection systems across upstream, midstream, and downstream operations. Large-scale infrastructure and continuous flow operations increase the need for real-time monitoring. Preventing revenue loss and environmental incidents remains a key priority. High capital investment capacity also supports adoption of sophisticated technologies.
The water treatment plants segment is expected to grow at the fastest rate during the forecast period, driven by increasing concerns over water loss and infrastructure aging. Municipalities and utilities are adopting leak detection solutions to reduce non-revenue water and improve distribution efficiency. Growing urbanization places pressure on water supply networks, increasing the need for early leak identification. Digital transformation initiatives in utilities support technology adoption. Sustainability goals further accelerate growth in this segment.
North America Leak Detection Market Regional Analysis
- U.S. dominated the leak detection market with the largest revenue share in 2025, driven by extensive oil and gas pipeline networks, aging water infrastructure, and strong regulatory enforcement related to environmental protection and industrial safety
- Widespread utilization of leak detection systems across oil and gas operations, municipal water utilities, chemical plants, and power generation facilities, supported by advanced monitoring infrastructure, high technology adoption, and strong focus on loss prevention, continues to sustain robust demand across end-user industries
- The strong presence of major market players such as Honeywell International Inc., Emerson Electric Co., and Teledyne FLIR LLC, along with continuous advancements in sensor technologies, real-time monitoring software, and integrated analytics platforms, reinforces the U.S. leadership position
Canada Leak Detection Market Insight
Canada is projected to register the fastest CAGR in the North America leak detection market from 2026 to 2033, supported by increasing investments in pipeline integrity management, water conservation initiatives, and stricter environmental regulations. For instance, Canadian oil and gas operators and municipal utilities are increasingly deploying advanced leak detection solutions to monitor long-distance pipelines and reduce non-revenue water losses. Growing emphasis on methane emission reduction, infrastructure modernization, and adoption of digital monitoring technologies is accelerating market growth, positioning Canada as the fastest-growing country in the region.
Mexico Leak Detection Market Insight
Mexico is expected to grow steadily from 2026 to 2033, driven by gradual expansion of oil and gas infrastructure, increasing focus on pipeline safety, and rising investments in water distribution networks. Adoption of leak detection systems across refining, transmission, and municipal water sectors is supporting consistent market demand. Strengthening regulatory oversight, infrastructure rehabilitation efforts, and collaboration with North American technology providers are contributing to stable growth of the leak detection market throughout the forecast period.
North America Leak Detection Market Share
The leak detection industry is primarily led by well-established companies, including:
- Teledyne FLIR LLC (U.S.)
- ABB (Sweden)
- Honeywell International Inc. (U.S.)
- Siemens Energy (Germany)
- Pentair (U.S.)
- ClampOn AS (Norway)
- Schneider Electric (France)
- Atmos International (U.K.)
- Xylem (U.S.)
- Emerson Electric Co. (U.S.)
- KROHNE Messtechnik GmbH (Germany)
- PERMA-PIPE International Holdings, Inc. (U.S.)
- TTK (India)
- PSI Software SE (Germany)
- HIMA (India)
- AVEVA Group Limited (U.K.)
- Yokogawa Electric Corporation (Japan)
- INFICON (Switzerland)
- MAGNUM Pirex AG / MAGNUM LEO-Pipe GmbH (Germany)
- Hawk Measurement Systems (Australia)
- OptaSense Ltd. (U.K.)
Latest Developments in North America Leak Detection Market
- In May 2025, Xylem, a global water technology company, has introduced AI-powered leak detection systems through its 2025 Partnerships Accelerator. These innovations aim to enhance water security by enabling real-time leak detection and rapid response, addressing challenges such as aging infrastructure and water scarcity
- In March 2025, ChampionX has received approval from the U.S. Environmental Protection Agency (EPA) for its Aerial Optical Gas Imaging (AOGI) platform. This technology combines high-definition optical gas imaging with an advanced gimbal system to detect, locate, and visualize methane leaks with pinpoint accuracy. It is particularly effective for expansive areas such as the Permian Basin, enabling technicians to identify leaks at the component level and streamline repair processes
- In November 2024, TotalEnergies announced plans to install real-time methane leak detection equipment on all its upstream assets by the end of 2025. This initiative aims to reduce methane emissions and supports the company's goal of achieving near-zero methane emissions by 2030. The move underscores the industry's commitment to environmental sustainability and regulatory compliance
- In October 2024, Airtech has partnered with Distran to integrate advanced leak detection technology into composite manufacturing processes. The collaboration combines Distran's ultrasonic leak detection systems with Airtech's expertise in vacuum bagging, aiming to enhance quality control and reduce defects in composite materials
- In June 2024, Moen has entered into a strategic agreement with Amica Insurance to promote the adoption of leak detection technology in residential settings. The partnership encourages homeowners to install water leak detection devices, aiming to minimize water damage and reduce insurance claims related to leaks
SKU-

- Interactive Data Analysis Dashboard
- Company Analysis Dashboard for high growth potential opportunities
- Research Analyst Access for customization & queries
- Competitor Analysis with Interactive dashboard
- Latest News, Updates & Trend analysis
- Harness the Power of Benchmark Analysis for Comprehensive Competitor Tracking
North America Leak Detection Market, Supply Chain Analysis and Ecosystem Framework
To support market growth and help clients navigate the impact of geopolitical shifts, DBMR has integrated in-depth supply chain analysis into its North America Leak Detection Market research reports. This addition empowers clients to respond effectively to global changes affecting their industries. The supply chain analysis section includes detailed insights such as North America Leak Detection Market consumption and production by country, price trend analysis, the impact of tariffs and geopolitical developments, and import and export trends by country and HSN code. It also highlights major suppliers with data on production capacity and company profiles, as well as key importers and exporters. In addition to research, DBMR offers specialized supply chain consulting services backed by over a decade of experience, providing solutions like supplier discovery, supplier risk assessment, price trend analysis, impact evaluation of inflation and trade route changes, and comprehensive market trend analysis.
Data collection and base year analysis are done using data collection modules with large sample sizes. The stage includes obtaining market information or related data through various sources and strategies. It includes examining and planning all the data acquired from the past in advance. It likewise envelops the examination of information inconsistencies seen across different information sources. The market data is analysed and estimated using market statistical and coherent models. Also, market share analysis and key trend analysis are the major success factors in the market report. To know more, please request an analyst call or drop down your inquiry.
The key research methodology used by DBMR research team is data triangulation which involves data mining, analysis of the impact of data variables on the market and primary (industry expert) validation. Data models include Vendor Positioning Grid, Market Time Line Analysis, Market Overview and Guide, Company Positioning Grid, Patent Analysis, Pricing Analysis, Company Market Share Analysis, Standards of Measurement, Global versus Regional and Vendor Share Analysis. To know more about the research methodology, drop in an inquiry to speak to our industry experts.
Data Bridge Market Research is a leader in advanced formative research. We take pride in servicing our existing and new customers with data and analysis that match and suits their goal. The report can be customized to include price trend analysis of target brands understanding the market for additional countries (ask for the list of countries), clinical trial results data, literature review, refurbished market and product base analysis. Market analysis of target competitors can be analyzed from technology-based analysis to market portfolio strategies. We can add as many competitors that you require data about in the format and data style you are looking for. Our team of analysts can also provide you data in crude raw excel files pivot tables (Fact book) or can assist you in creating presentations from the data sets available in the report.


