Asia-Pacific Travel and Expense Management Software Market, By Deployment Model (On-PremiseCloud), Organization Size (Medium Enterprises, Large Enterprises), Industry (Defence, Government) - Industry Trends and Forecast to 2029.
Asia-Pacific Travel and Expense Management Software Market Analysis and Size
Rise in international visits by government representatives worldwide and hassle-free claims and reimbursement via travel and expense management software is driving the overall growth of the market. The constant threat of data breach is a major restraint factor for the travel and expense management market.
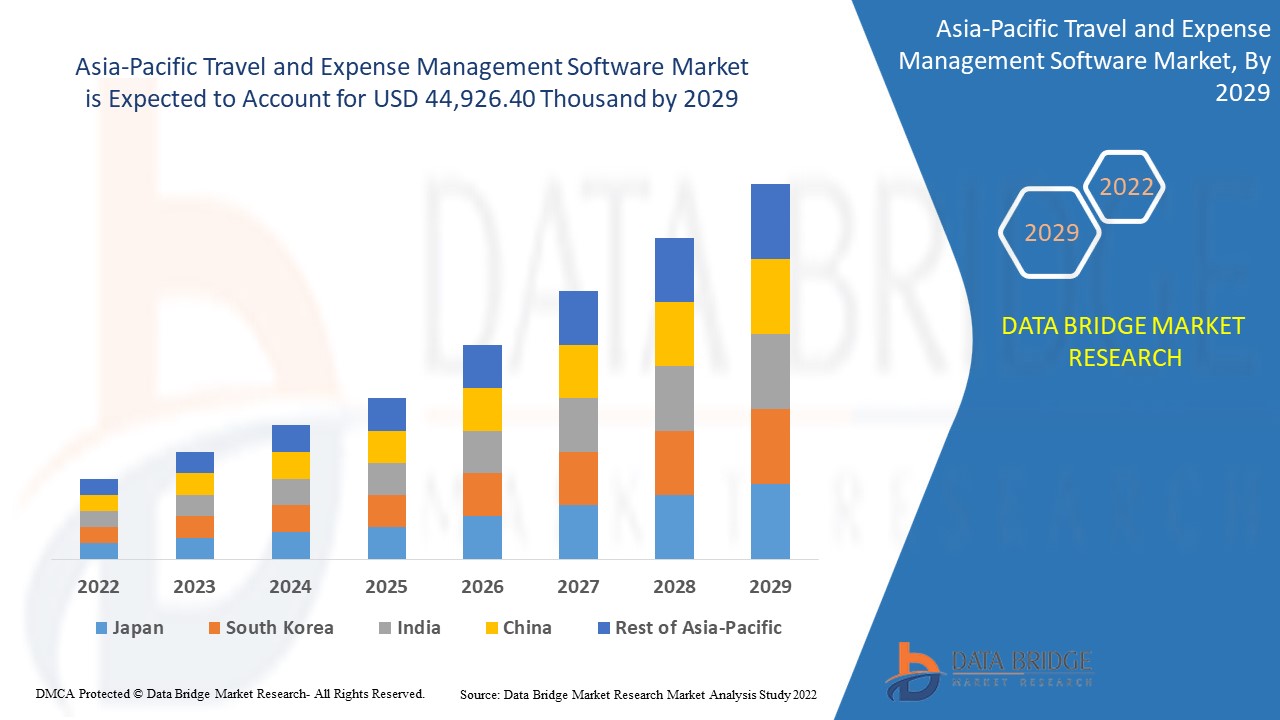
Data Bridge Market Research analyses that travel and expense management software market is expected to reach the value of USD 44,926.40 thousand by 2029, at a CAGR of 6.5% during the forecast period. Cloud segment accounts for the largest offering segment in travel and expense management software market. Travel and expense management software market report also covers pricing analysis, patent analysis, and technological advancements in depth.
|
Report Metric |
Details |
|
Forecast Period |
2022 to 2029 |
|
Base Year |
2021 |
|
Historic Years |
2020 (Customizable to 2019-2014) |
|
Quantitative Units |
Revenue in USD Thousand, Pricing in USD |
|
Segments Covered |
Deployment Model (On-Premise, Cloud), Organization Size (Medium Enterprises, Large Enterprises), Industry (Defence, Government, Others) |
|
Countries Covered |
Japan, Australia, Hong Kong, New Zealand, Rest of Asia-Pacific in Asia-Pacific |
|
Market Players Covered |
Webexpenses Pty Ltd, Inc, Concur Technologies, Inc., GBT Travel Services UK Limited, Oversight Systems, Inc., Infor, Oracle, Emburse, Inc., TripActions, Empxtrack Inc(Saigun Technologies Pvt. Ltd), Expensify, Inc., SutiSoft, Inc., Zoho Corporation Pvt. Ltd., TravelPerk S.L.U, ExpensePoint, Rydoo, 8common, and Coupa Software Inc., among others. |
Market Definition
Travel and expense management software is a comprehensive system that can assist you in managing and monitoring your business travel expenses. T&E management software is essential for companies sending staff on business trips, whether for planning trips, overseeing personnel on the road, or generating expenditure reports.
Businesses of all kinds can benefit from corporate travel and expense management software. It's essential to make sure you have a thorough understanding of your business travel expenses and knowledgeable customer support in case of problems. Additionally, it aids in optimizing your billing process and schedule travel according to your company's travel policy.
Travel and Expense Management Software Market Dynamics
Drivers
-
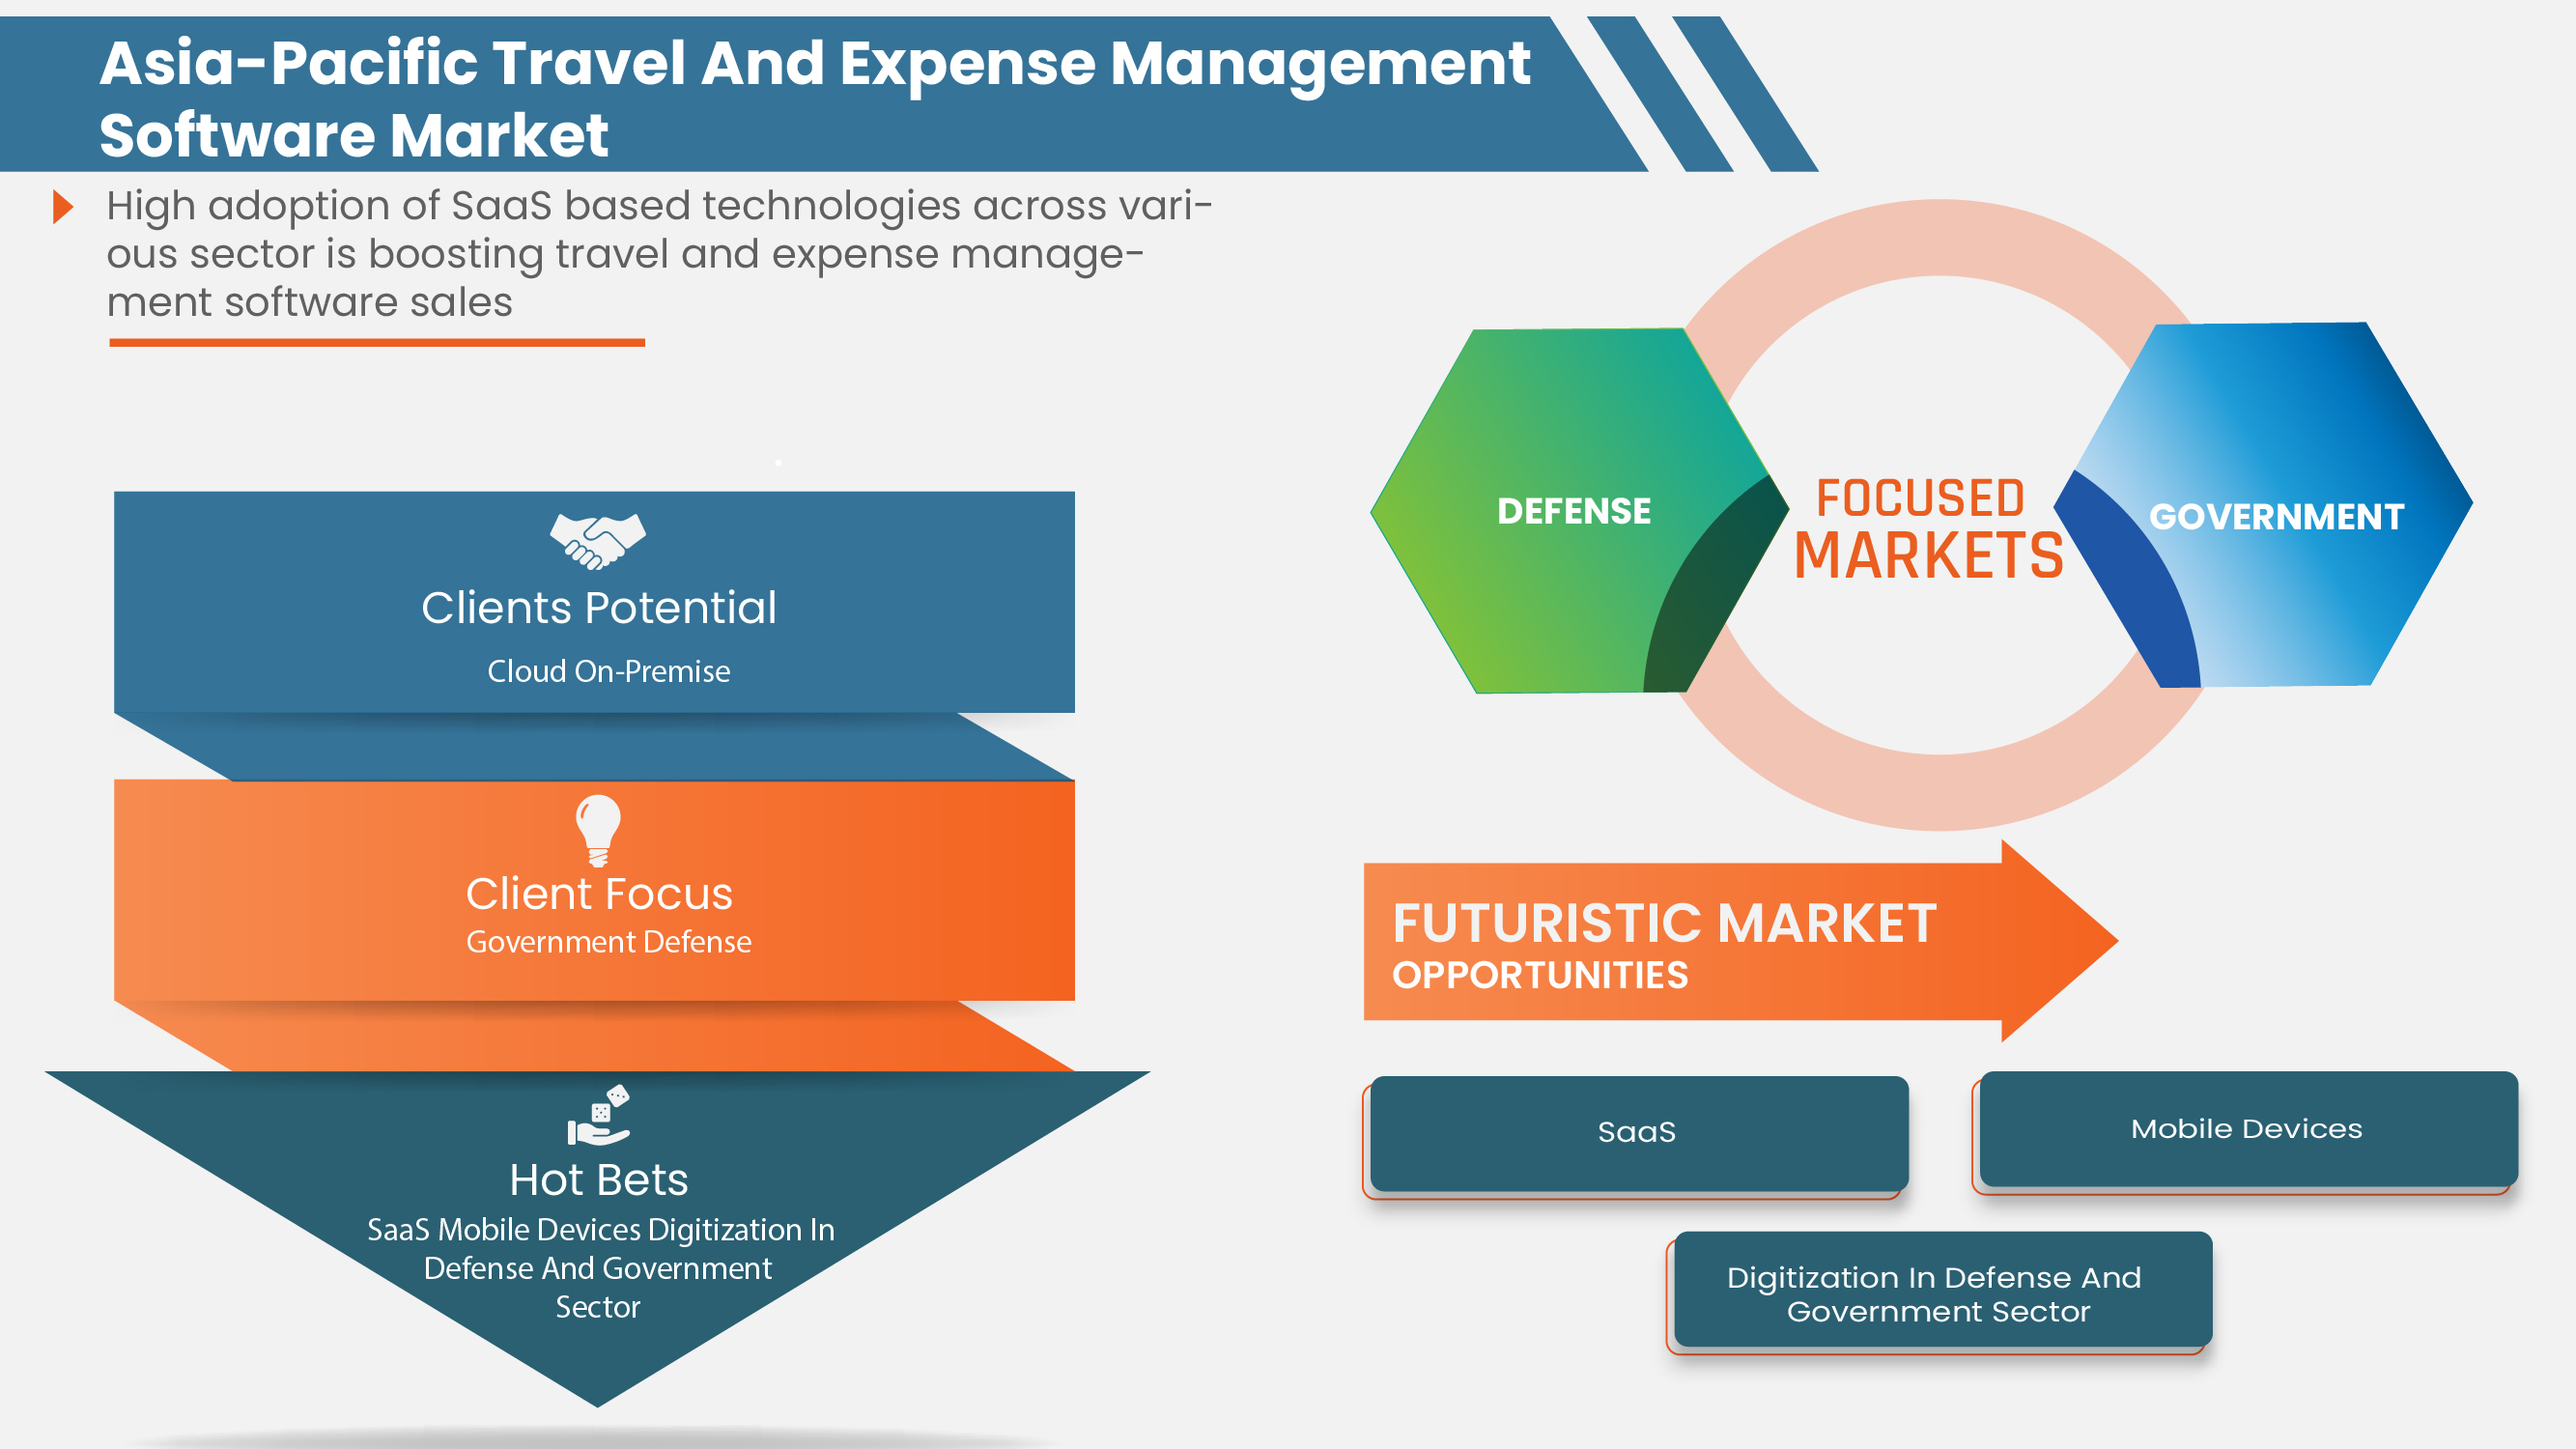
HIGH ADOPTION OF MOBILE DEVICES
The rise in the number of smartphones globally due to their high demand and affordable rate, has resulted in the increasing number of multi-platform software. This software is developed to work across multiple devices, synchronized with same data for the user. In the travel and expense management software market, many companies offer smartphone applications with details of users, their history, tickets, and offers. The same companies offer websites or online services having the same features. Furthermore, with the advent of mobile computing technology, the cloud and the ability to connect to business systems all over the globe, many businesses are looking mobile app technology, system integrations and real-time solutions to help staff get things done quickly and more efficiently. Mobile expense management is one area where there have been huge developments in business efficiency. Employees that travel around the globe for business can use mobile expense reporting apps to streamline their expense reporting. The use of mobile device and expense applications offers a several benefits for the employee and the organization and as a driver for the growth of travel and expense management software market.
-
INCREASING MILITARY TRAVEL INTERNATIONALLY
The movement of the military, which may be internally or in a nation, is increasing due to various reasons such as the presence of military outposts and postings; international exercises, and U.N. peacekeeping forces. The increasing budget of military expenses in various nations across the globe has allowed the military to provide travel allowance (T.A.) to the soldiers. Additionally, the presence of SAAS for travel expenses analysis with travel and expense management software on smartphones has allowed penetration of these software in military. The continuously evolving bilateral relations of nations allow their military to conduct exercises to boost soldiers' confidence, gain experience and increase brotherhood between two armies. Also, the increasing alien military bases of various army allows the soldiers to travel across the globe. These factors through which the movement of army and army personals has increase across the borders has started to act as a driver for the growth of travel and expense management software market. As the personal have started doing their travel booking and travel expenses through available software in the market.
Opportunities
-
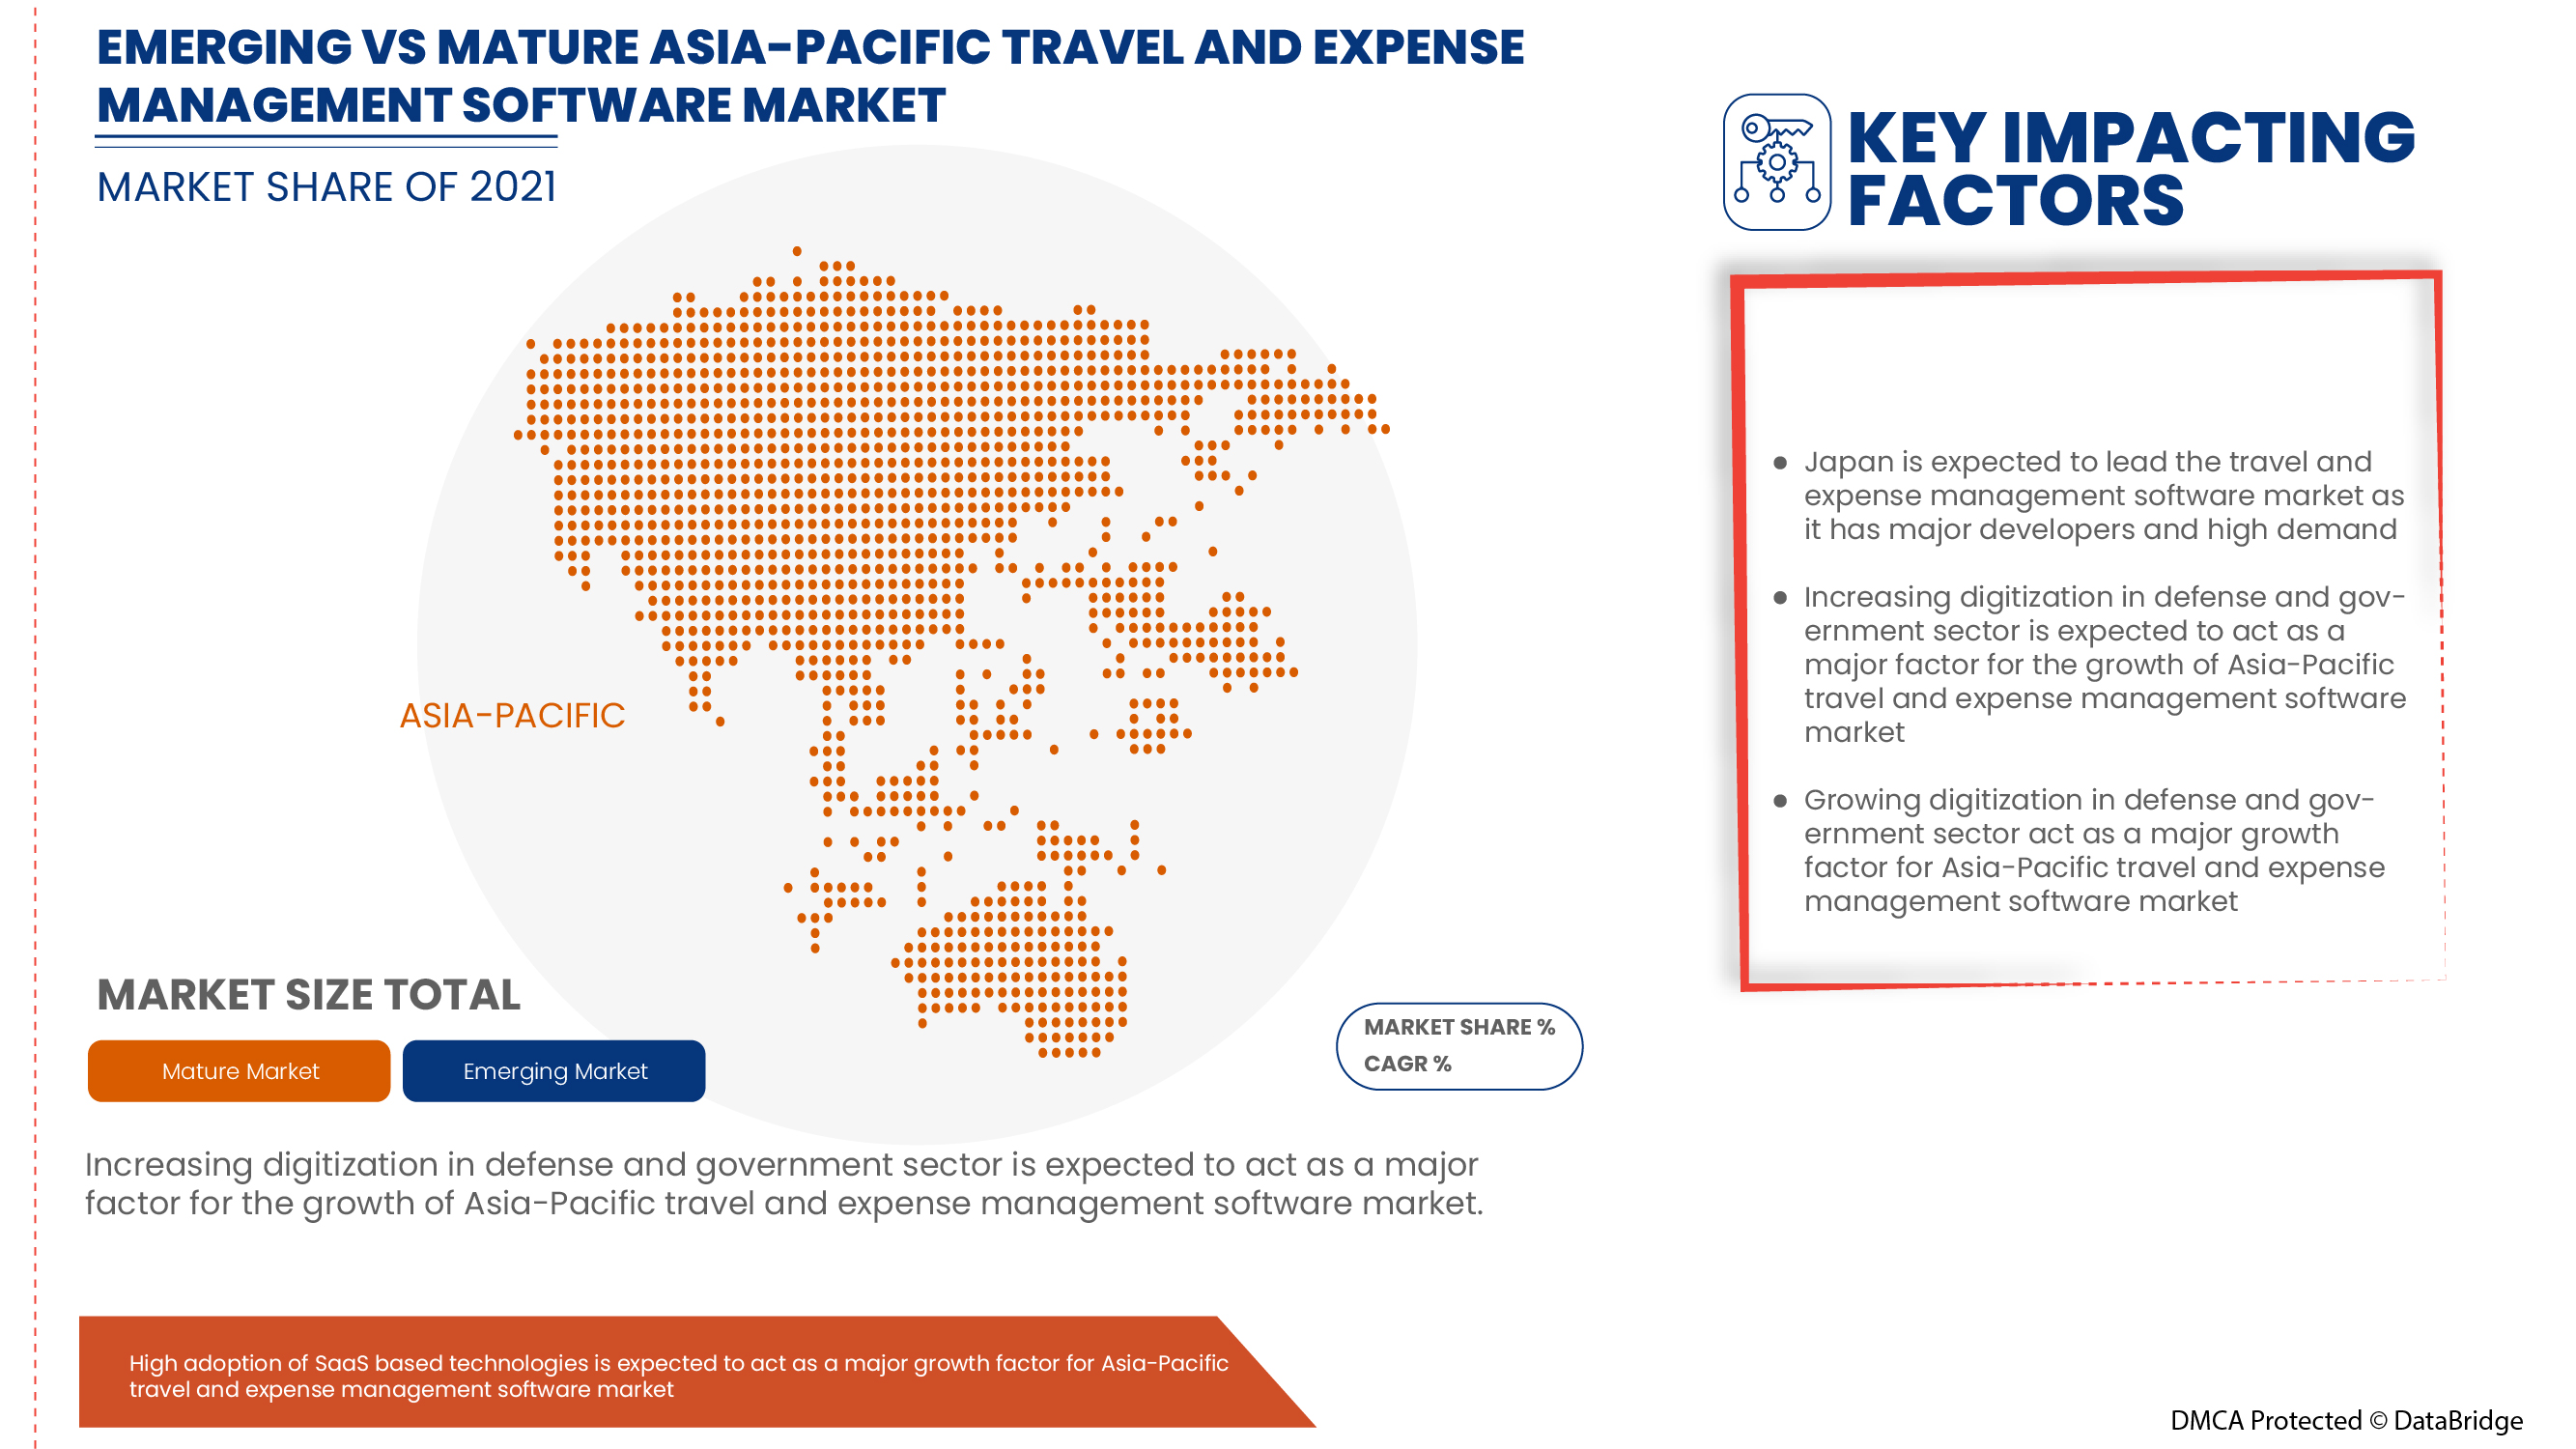
RISE IN DIGITIZATION IN DEFENSE AND GOVERNMENT SECTOR
Digitalization enables using digital technologies such as cloud computing, big data, data analytics, Internet of Things (IoT), artificial intelligence in the defence sector and government sector. The deployment of digital technologies improves legacy processes and enhances operation and process efficiencies, enabling faster decision making and better situational awareness. Digital technologies are perceived as key enablers to adapt to changes, facilitating more efficient operations and increased outputs. In many nations, governments are increasing their efforts to bring digital transformations in sectors such as executive, ministries and defence. This digitization rise is an opportunity for the travel and expense management software market. Because of this, it is becoming normal in many sectors and its team to use the institution's travel and expense management software.
-
MORE OF PARTNERSHIP AND ACQUISITION AMONG MARKET PLAYERS
The travel and expense management software market is fragmented as it consists of many regional players and global players. The presence of these companies in the region provides stiff competition in travel and expense management software market and produces the best applications and software for various business and employees. To tackle the stiff completion, few market players tend to sign an agreement, and partnership with other market players, to develop better software using advanced technologies such as ML and A.I. Additionally, few market players acquire small start-ups or businesses to increase their market dominance and offer better products and software. These steps by the market players provide various possibilities to expand the travel and expense management software market.
Restraints/Challenges
-
CONSTANT THREAT OF DATA BREACH
An expense management software holds data such as employee names and details, corporate credit card information, transaction statements, business-related activities, and financial history. Therefore, it has become a critical part of businesses and they tend to be careful when choosing an expense management solution. With such important business data contained in travel and expense management software, businesses are little conscious of the security of travel and expense management software across the globe. But, hackers or cybercriminals use phishing, malware, social engineering, or related techniques to steal information from businesses and travel and expense management software. Thus the constant threat of data breach in Travel and expense management software market is expected to limit the growth of market.
-
FRAGMENTATION IN THE TRAVEL AND EXPENSE SOFTWARE INDUSTRY
Most companies today have different software for travel and expense management. It is a big challenge for them as travel bookings happen on one platform and expense process on the other, making the whole T&E process inefficient. According to a report from ITILITE, 70% of expenses are travel-related, and having separate tools for travel bookings, and expense reimbursements result in cost leakages, poor data visibility, and even leaves room for fraud and on top of all this, it provides a broken experience to employees and finance managers. This is estimated to act a restrain for the travel and expense management software market growth.
The presence and use of different software for travel and expense management, hits on the finance productivity as it will be hard to manage data and expenses on a different platform. Additionally, due to this fragmentation in the travel and expense software industry, many companies continue to use their current segregated systems as they worry about the cost to change. But on the contrary, using an integrated travel and expense management solution can help them save more than 30% of the costs. Furthermore, this segregation also allows many frauds to slip by during audits as different software offer different offers to the customers and generally financial teams cannot detect these frauds. The fragmentation in travel and expense management industry, limits the finance professional as they don't have any visibility over the travel expenses, and can easily fall into the trap of exceeding your allocated budget.
Recent Development
- In December 2019, Chrome River Technologies, Inc., was named a "Leader" in the IDC Market Scape: Worldwide SaaS and Cloud-Enabled Enterprise Travel and Expense Management Applications 2019 Vendor Assessment. Company is was positioned as a Leader for large enterprise deployments which created a brand image globally
Travel and Expense Management Software Market
The travel and expense management software market is segmented on the basis of deployment model, organization size, and industry. The growth amongst these segments will help you analyse meagre growth segments in the industries and provide the users with a valuable market overview and market insights to help them make strategic decisions for identifying core market applications.
Deployment Model
- On-Premise
- Cloud
On the basis of deployment, the travel and expense management software market is segmented into on-premise and cloud.
Organization Size
- Medium Enterprise
- Large Enterprise
On the basis of organization size, the travel and expense management software market is segmented into medium enterprises, large enterprises.
Industry
- Defense
- Government
- Others
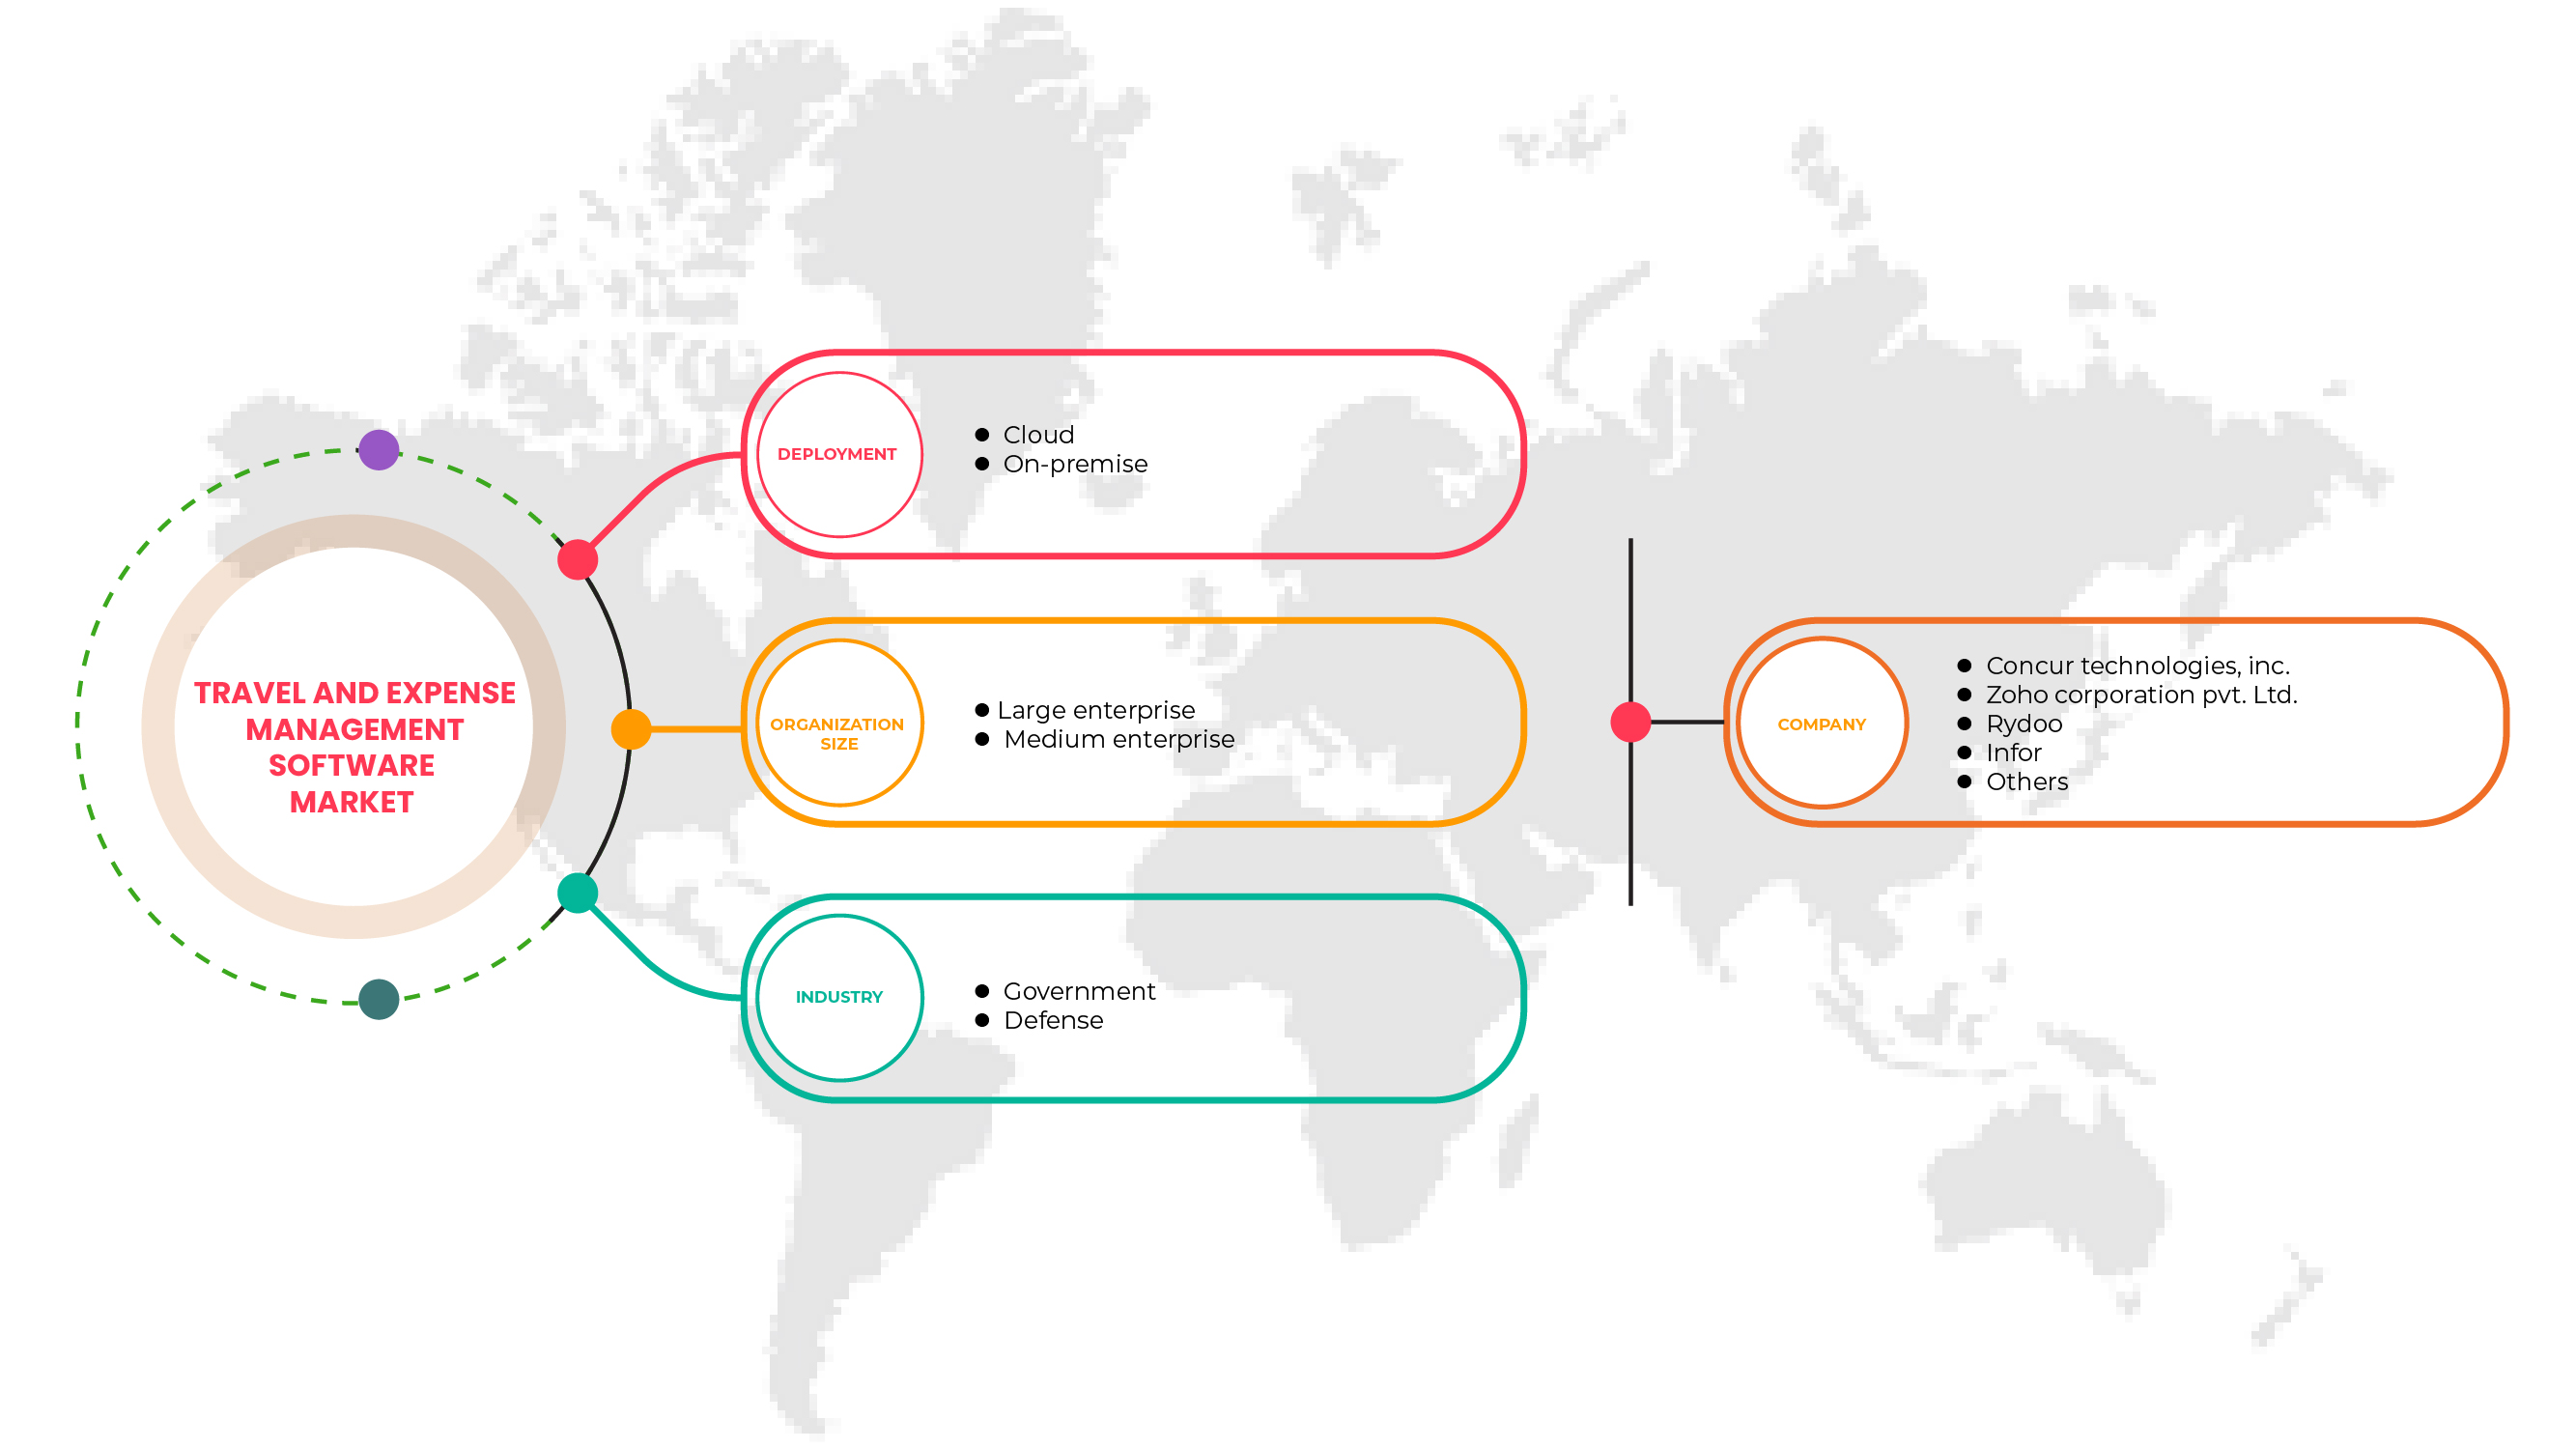
On the basis of industry, the travel and expense management market is segmented into defense, Government and others.
Travel and Expense Management Software Market Regional Analysis/Insights
The travel and expense management software market is analysed and market size insights and trends are provided by deployment model, organization size and industry.
The countries covered in the travel and expense management software market report are Japan, Australia, Hong Kong, New Zealand and Rest of Asia-Pacific in Asia-Pacific.
Japan is expected to dominate the Asia-Pacific travel and expense management software market due to the rising inclination towards travel and expense management software.
The country section of the report also provides individual market impacting factors and changes in market regulation that impact the current and future trends of the market. Data points like down-stream and upstream value chain analysis, technical trends and porter's five forces analysis, case studies are some of the pointers used to forecast the market scenario for individual countries. Also, the presence and availability of global brands and their challenges faced due to large or scarce competition from local and domestic brands, impact of domestic tariffs and trade routes are considered while providing forecast analysis of the country data
Competitive Landscape and Travel and Expense Management Software Market Share Analysis
The travel and expense management software market competitive landscape provides details of the competitor. Details included are company overview, company financials, revenue generated, market potential, investment in research and development, new market initiatives, presence, production sites and facilities, production capacities, company strengths and weaknesses, solution launch, product width and breadth, application dominance. The above data points are only related to the companies' focus on travel and expense management software market.
Some of the major players operating in the market are Webexpenses Pty Ltd, Inc, Concur Technologies, Inc., GBT Travel Services UK Limited, Oversight Systems, Inc., Infor, Oracle, Emburse, Inc., TripActions, Empxtrack Inc(Saigun Technologies Pvt. Ltd), Expensify, Inc., SutiSoft, Inc., Zoho Corporation Pvt. Ltd., TravelPerk S.L.U, ExpensePoint, Rydoo, 8common, and Coupa Software Inc., among others.
SKU-
Accédez en ligne au rapport sur le premier cloud mondial de veille économique

- Tableau de bord d'analyse de données interactif
- Tableau de bord d'analyse d'entreprise pour les opportunités à fort potentiel de croissance
- Accès d'analyste de recherche pour la personnalisation et les requêtes
- Analyse de la concurrence avec tableau de bord interactif
- Dernières actualités, mises à jour et analyse des tendances
- Exploitez la puissance de l'analyse comparative pour un suivi complet de la concurrence
Table des matières
1 INTRODUCTION
1.1 OBJECTIFS DE L'ÉTUDE
1.2 DÉFINITION DU MARCHÉ
1.3 APERÇU DU MARCHÉ DES LOGICIELS DE GESTION DES VOYAGES ET DES DÉPENSES EN ASIE-PACIFIQUE
1.4 MONNAIE ET TARIFS
1.5 LIMITATIONS
1.6 MARCHÉS COUVERTS
2 SEGMENTATION DU MARCHÉ
2.1 MARCHÉS COUVERTS
2,2 ANS CONSIDÉRÉS POUR L'ÉTUDE
2.3 PORTÉE GÉOGRAPHIQUE
2.4 MODÈLE DE VALIDATION DES DONNÉES DU TRÉPIED DBMR
2.5 ENTRETIENS PRIMAIRES AVEC DES LEADERS D'OPINION CLÉS
2.6 GRILLE DE POSITIONNEMENT DU MARCHÉ DBMR
2.7 ANALYSE DES PARTS DES FOURNISSEURS
2.8 MODÉLISATION MULTIVARIÉE
2.9 COURBE DE TYPE DE DÉPLOIEMENT
2.1 MATRICE DES DÉFIS
2.11 SOURCES SECONDAIRES
2.12 HYPOTHÈSES
3 RÉSUMÉ EXÉCUTIF
4 INFORMATIONS PREMIUM
4.1 ANALYSE DES PRIX ET DES MARGES
4.2 ANALYSE COMPARATIVE DES MARQUES
4.3 NORMES RÉGLEMENTAIRES
4.3.1 ASIE-PACIFIQUE
4.4 DÉFIS
4.5 RÉSUMÉ RÉGIONAL
4.5.1 ASIE-PACIFIQUE
5 APERÇU DU MARCHÉ
5.1 PILOTES
5.1.1 FORTE ADOPTION DES APPAREILS MOBILES
5.1.2 AUGMENTATION DES DÉPLACEMENTS MILITAIRES À L'INTERNATIONAL
5.1.3 AUGMENTATION DE L'UTILISATION DE L'IA ET DU ML DANS LES LOGICIELS
5.1.4 RÉCLAMATIONS ET REMBOURSEMENTS SANS TRACAS VIA UN LOGICIEL DE GESTION DES DÉPENSES ET DES VOYAGES
5.2 RESTRICTIONS
5.2.1 MENACE CONSTANTE DE VIOLATION DE DONNÉES
5.2.2 FRAGMENTATION DANS LE SECTEUR DES LOGICIELS DE VOYAGE ET DE FRAIS DE GESTION
5.3 OPPORTUNITÉS
5.3.1 L'AUGMENTATION DE LA NUMÉRISATION DANS LES SECTEURS DE LA DÉFENSE ET DU GOUVERNEMENT
5.3.2 PLUS DE PARTENARIATS ET D'ACQUISITIONS ENTRE LES ACTEURS DU MARCHÉ
5.3.3 ÉMERGENCE DU SAAS DANS LA GESTION DES DÉPENSES
5.4 DÉFIS
5.4.1 SCÉNARIO GÉOPOLITIQUE EN CONSTANTE ÉVOLUTION
5.4.2 PRÉOCCUPATIONS CONCERNANT LA VIE PRIVÉE ET LES MOUVEMENTS
6 MARCHÉ DES LOGICIELS DE GESTION DES VOYAGES ET DES FRAIS EN ASIE-PACIFIQUE, PAR DÉPLOIEMENT
6.1 APERÇU
6.2 NUAGE
6.3 SUR SITE
7 MARCHÉ DES LOGICIELS DE GESTION DES VOYAGES ET DES FRAIS EN ASIE-PACIFIQUE, PAR TAILLE D'ORGANISATION
7.1 APERÇU
7.2 GRANDE ENTREPRISE
7.3 ENTREPRISE MOYENNE
8 MARCHÉ DES LOGICIELS DE GESTION DES VOYAGES ET DES FRAIS EN ASIE-PACIFIQUE, PAR SECTEUR D'ACTIVITÉ
8.1 APERÇU
8.2 GOUVERNEMENT
8.3 DÉFENSE
9 MARCHÉ DES LOGICIELS DE GESTION DES VOYAGES ET DES FRAIS EN ASIE-PACIFIQUE, PAR RÉGION
9.1 ASIE-PACIFIQUE
9.1.1 JAPON
9.1.2 AUSTRALIE
9.1.3 HONG KONG
9.1.4 NOUVELLE-ZÉLANDE
9.1.5 RESTE DE L'ASIE-PACIFIQUE
10 MARCHÉ DES LOGICIELS DE GESTION DES VOYAGES ET DES FRAIS EN ASIE-PACIFIQUE : PAYSAGE DES ENTREPRISES
10.1 ANALYSE DES ACTIONS DE L'ENTREPRISE : ASIE-PACIFIQUE
10.2 ANALYSE DES ACTIONS DES ENTREPRISES : ÉTATS-UNIS, CANADA, ROYAUME-UNI, ESPAGNE, BRÉSIL, ÉMIRATS ARABES UNIS, JAPON, AUSTRALIE
11 ANALYSE SWOT
12 PROFIL DE L'ENTREPRISE
12.1 CONCUR TECHNOLOGIES, INC.
12.1.1 INSTANTANÉ DE L'ENTREPRISE
12.1.2 ANALYSE DES ACTIONS DE L'ENTREPRISE
12.1.3 PORTEFEUILLE DE PRODUITS
12.1.4 ÉVOLUTIONS RÉCENTES
12.2 ZOHO CORPORATION PVT. LTD.
12.2.1 INSTANTANÉ DE L'ENTREPRISE
12.2.2 ANALYSE DES ACTIONS DE L'ENTREPRISE
12.2.3 PORTEFEUILLE DE PRODUITS
12.2.4 ÉVOLUTIONS RÉCENTES
12.3 RYDOO
12.3.1 INSTANTANÉ DE L'ENTREPRISE
12.3.2 ANALYSE DES ACTIONS DE L'ENTREPRISE
12.3.3 PORTEFEUILLE DE PRODUITS
12.3.4 ÉVOLUTIONS RÉCENTES
12.4 INFOR
12.4.1 INSTANTANÉ DE L'ENTREPRISE
12.4.2 ANALYSE DES ACTIONS DE L'ENTREPRISE
12.4.3 PORTEFEUILLE DE PRODUITS
12.4.4 ÉVOLUTION RÉCENTE
12.5 ACTIONS DE VOYAGE
12.5.1 INSTANTANÉ DE L'ENTREPRISE
12.5.2 ANALYSE DES ACTIONS DE L'ENTREPRISE
12.5.3 PORTEFEUILLE DE PRODUITS
12.5.4 ÉVOLUTIONS RÉCENTES
12.6 8COMMUN
12.6.1 INSTANTANÉ DE L'ENTREPRISE
12.6.2 PORTEFEUILLE DE PRODUITS
12.6.3 ÉVOLUTIONS RÉCENTES
12.7 COUPA SOFTWARE INC.
12.7.1 INSTANTANÉ DE L'ENTREPRISE
12.7.2 ANALYSE DES REVENUS
12.7.3 PORTEFEUILLE DE PRODUITS
12.7.4 ÉVOLUTIONS RÉCENTES
12.8 EMBURSE, INC.
12.8.1 INSTANTANÉ DE L'ENTREPRISE
12.8.2 PORTEFEUILLE DE PRODUITS
12.8.3 ÉVOLUTIONS RÉCENTES
12.9 EXPENSEPOINT
12.9.1 INSTANTANÉ DE L'ENTREPRISE
12.9.2 PORTEFEUILLE DE PRODUITS
12.9.3 ÉVOLUTIONS RÉCENTES
12.1 EXPENSIFY, INC.
12.10.1 INSTANTANÉ DE L'ENTREPRISE
12.10.2 ANALYSE DES REVENUS
12.10.3 PORTEFEUILLE DE PRODUITS
12.10.4 ÉVOLUTIONS RÉCENTES
12.11 EMPXTRACK INC (SAIGUN TECHNOLOGIES PVT. LTD)
12.11.1 INSTANTANÉ DE L'ENTREPRISE
12.11.2 PORTEFEUILLE DE SOLUTIONS
12.11.3 ÉVOLUTION RÉCENTE
12.12 GBT TRAVEL SERVICES UK LIMITED
12.12.1 INSTANTANÉ DE L'ENTREPRISE
12.12.2 PORTEFEUILLE DE PRODUITS
12.12.3 ÉVOLUTIONS RÉCENTES
12.13 ORACLE
12.13.1 INSTANTANÉ DE L'ENTREPRISE
12.13.2 ANALYSE DES REVENUS
12.13.3 PORTEFEUILLE DE PRODUITS
12.13.4 ÉVOLUTIONS RÉCENTES
12.14 SYSTÈMES DE SURVEILLANCE, INC.
12.14.1 INSTANTANÉ DE L'ENTREPRISE
12.14.2 PORTEFEUILLE DE PRODUITS
12.14.3 ÉVOLUTION RÉCENTE
12.15 SUTISOFT, INC.
12.15.1 INSTANTANÉ DE L'ENTREPRISE
12.15.2 PORTEFEUILLE DE PRODUITS
12.15.3 ÉVOLUTIONS RÉCENTES
12.16 TRAVELPERK SLU
12.16.1 INSTANTANÉ DE L'ENTREPRISE
12.16.2 PORTEFEUILLE DE SOLUTIONS
12.16.3 ÉVOLUTIONS RÉCENTES
12.17 WEBEXPENSES PTY LTD
12.17.1 INSTANTANÉ DE L'ENTREPRISE
12.17.2 PORTEFEUILLE DE PRODUITS
12.17.3 ÉVOLUTION RÉCENTE
13 QUESTIONNAIRE
14 RAPPORTS CONNEXES
Liste des tableaux
TABLEAU 1 PAYS ET LEURS EFFECTIFS MILITAIRES RESPECTIFS
TABLEAU 2 LES PAYS ET L'EXERCICE QU'ILS MENENT
TABLEAU 3 MARCHÉ DES LOGICIELS DE GESTION DES VOYAGES ET DES FRAIS EN ASIE-PACIFIQUE, PAR DÉPLOIEMENT, 2020-2029 (EN MILLIERS USD)
TABLEAU 4 MARCHÉ DES LOGICIELS DE GESTION DES DÉPENSES ET DES VOYAGES EN NUAGE EN ASIE-PACIFIQUE, PAR RÉGION, 2020-2029 (EN MILLIERS USD)
TABLEAU 5 ASIE-PACIFIQUE MARCHÉ DES LOGICIELS DE GESTION DES DÉPENSES ET DES VOYAGES SUR SITE, PAR RÉGION, 2020-2029 (EN MILLIERS USD)
TABLEAU 6 MARCHÉ DES LOGICIELS DE GESTION DES VOYAGES ET DES FRAIS EN ASIE-PACIFIQUE, PAR TAILLE D'ORGANISATION, 2020-2029 (EN MILLIERS USD)
TABLEAU 7 GRANDES ENTREPRISES ASIE-PACIFIQUE SUR LE MARCHÉ DES LOGICIELS DE GESTION DES VOYAGES ET DES FRAIS, PAR RÉGION, 2020-2029 (EN MILLIERS USD)
TABLEAU 8 MARCHÉ DES LOGICIELS DE GESTION DES DÉPENSES ET DES VOYAGES DES ENTREPRISES DE TAILLE MOYENNE EN ASIE-PACIFIQUE, PAR RÉGION, 2020-2029 (EN MILLIERS USD)
TABLEAU 9 MARCHÉ DES LOGICIELS DE GESTION DES VOYAGES ET DES FRAIS EN ASIE-PACIFIQUE, PAR SECTEUR, 2020-2029 (EN MILLIERS USD)
TABLEAU 10 GOUVERNEMENT ASIE-PACIFIQUE SUR LE MARCHÉ DES LOGICIELS DE GESTION DES DÉPENSES ET DES VOYAGES, PAR RÉGION, 2020-2029 (EN MILLIERS USD)
TABLEAU 11 MARCHÉ DES LOGICIELS DE GESTION DES DÉPENSES ET DES DÉPLACEMENTS EN ASIE-PACIFIQUE, PAR RÉGION, 2020-2029 (EN MILLIERS USD)
TABLEAU 12 MARCHÉ DES LOGICIELS DE GESTION DES VOYAGES ET DES FRAIS EN ASIE-PACIFIQUE, PAR PAYS, 2020-2029 (EN MILLIERS USD)
TABLEAU 13 MARCHÉ DES LOGICIELS DE GESTION DES VOYAGES ET DES FRAIS EN ASIE-PACIFIQUE, PAR DÉPLOIEMENT, 2020-2029 (EN MILLIERS USD)
TABLEAU 14 MARCHÉ DES LOGICIELS DE GESTION DES DÉPENSES ET DES VOYAGES EN ASIE-PACIFIQUE, PAR TAILLE D'ORGANISATION, 2020-2029 (EN MILLIERS USD)
TABLEAU 15 MARCHÉ DES LOGICIELS DE GESTION DES VOYAGES ET DES FRAIS EN ASIE-PACIFIQUE, PAR SECTEUR, 2020-2029 (EN MILLIERS USD)
TABLEAU 16 MARCHÉ JAPONAIS DES LOGICIELS DE GESTION DES DÉPENSES ET DES VOYAGES, PAR DÉPLOIEMENT, 2020-2029 (EN MILLIERS USD)
TABLEAU 17 MARCHÉ JAPONAIS DES LOGICIELS DE GESTION DES DÉPENSES ET DES VOYAGES, PAR TAILLE D'ORGANISATION, 2020-2029 (EN MILLIERS USD)
TABLEAU 18 MARCHÉ JAPONAIS DES LOGICIELS DE GESTION DES DÉPENSES ET DES VOYAGES, PAR SECTEUR, 2020-2029 (EN MILLIERS USD)
TABLEAU 19 MARCHÉ AUSTRALIEN DES LOGICIELS DE GESTION DES VOYAGES ET DES FRAIS, PAR DÉPLOIEMENT, 2020-2029 (EN MILLIERS USD)
TABLEAU 20 MARCHÉ AUSTRALIEN DES LOGICIELS DE GESTION DES VOYAGES ET DES FRAIS, PAR TAILLE D'ORGANISATION, 2020-2029 (EN MILLIERS USD)
TABLEAU 21 MARCHÉ AUSTRALIEN DES LOGICIELS DE GESTION DES DÉPENSES ET DES VOYAGES, PAR SECTEUR, 2020-2029 (EN MILLIERS USD)
TABLEAU 22 MARCHÉ DES LOGICIELS DE GESTION DES DÉPENSES ET DES VOYAGES À HONG KONG, PAR DÉPLOIEMENT, 2020-2029 (EN MILLIERS USD)
TABLEAU 23 MARCHÉ DES LOGICIELS DE GESTION DES DÉPENSES ET DES VOYAGES À HONG KONG, PAR TAILLE D'ORGANISATION, 2020-2029 (EN MILLIERS USD)
TABLEAU 24 MARCHÉ DES LOGICIELS DE GESTION DES DÉPENSES ET DES VOYAGES À HONG KONG, PAR SECTEUR, 2020-2029 (EN MILLIERS USD)
TABLEAU 25 MARCHÉ DES LOGICIELS DE GESTION DES DÉPENSES ET DES VOYAGES EN NOUVELLE-ZÉLANDE, PAR DÉPLOIEMENT, 2020-2029 (EN MILLIERS USD)
TABLEAU 26 MARCHÉ DES LOGICIELS DE GESTION DES DÉPENSES ET DES VOYAGES EN NOUVELLE-ZÉLANDE, PAR TAILLE D'ORGANISATION, 2020-2029 (EN MILLIERS USD)
TABLEAU 27 MARCHÉ DES LOGICIELS DE GESTION DES DÉPENSES ET DES VOYAGES EN NOUVELLE-ZÉLANDE, PAR SECTEUR, 2020-2029 (EN MILLIERS USD)
TABLEAU 28 RESTE DU MARCHÉ DES LOGICIELS DE GESTION DES VOYAGES ET DES FRAIS EN ASIE-PACIFIQUE, PAR DÉPLOIEMENT, 2020-2029 (EN MILLIERS USD)
Liste des figures
FIGURE 1 MARCHÉ DES LOGICIELS DE GESTION DES VOYAGES ET DES FRAIS EN ASIE-PACIFIQUE : SEGMENTATION
FIGURE 2 MARCHÉ DES LOGICIELS DE GESTION DES VOYAGES ET DES FRAIS EN ASIE-PACIFIQUE : TRIANGULATION DES DONNÉES
FIGURE 3 MARCHÉ DES LOGICIELS DE GESTION DES VOYAGES ET DES FRAIS EN ASIE-PACIFIQUE : ANALYSE DROC
FIGURE 4 MARCHÉ DES LOGICIELS DE GESTION DES DÉPENSES ET DES VOYAGES EN ASIE-PACIFIQUE : ANALYSE DU MARCHÉ ASIE-PACIFIQUE PAR RAPPORT AU MARCHÉ RÉGIONAL
FIGURE 5 MARCHÉ DES LOGICIELS DE GESTION DES DÉPENSES ET DES VOYAGES EN ASIE-PACIFIQUE : ANALYSE DE LA RECHERCHE DES ENTREPRISES
FIGURE 6 MARCHÉ DES LOGICIELS DE GESTION DES VOYAGES ET DES FRAIS EN ASIE-PACIFIQUE : DONNÉES DÉMOGRAPHIQUES DES ENTRETIENS
FIGURE 7 MARCHÉ DES LOGICIELS DE GESTION DES DÉPENSES ET DES VOYAGES EN ASIE-PACIFIQUE : GRILLE DE POSITIONNEMENT SUR LE MARCHÉ DBMR
FIGURE 8 MARCHÉ DES LOGICIELS DE GESTION DES VOYAGES ET DES FRAIS EN ASIE-PACIFIQUE : ANALYSE DE LA PART DES FOURNISSEURS
FIGURE 9 MARCHÉ DES LOGICIELS DE GESTION DES VOYAGES ET DES FRAIS EN ASIE-PACIFIQUE : SEGMENTATION
FIGURE 10 L'ADOPTION ÉLEVÉE DES APPAREILS MOBILES ET L'AUGMENTATION DES EXERCICES MILITAIRES DEVRAIENT STIMULER LE MARCHÉ DES LOGICIELS DE GESTION DES VOYAGES ET DES DÉPENSES EN ASIE-PACIFIQUE AU COURS DE LA PÉRIODE DE PRÉVISION DE 2021 À 2029
FIGURE 11 LE CLOUD DEVRAIT REPRÉSENTER LA PLUS GRANDE PART DU MARCHÉ DES LOGICIELS DE GESTION DES VOYAGES ET DES DÉPENSES EN ASIE-PACIFIQUE ENTRE 2022 ET 2029
FIGURE 12 SYSTÈMES DE GESTION DES DÉPENSES DE 2017 À 2021
FIGURE 13 DÉFIS ET DOMAINES D'AMÉLIORATION EN MATIÈRE DE GESTION DES DÉPLACEMENTS ET DES FRAIS
FIGURE 14 MOTEURS, CONTRAINTES, OPPORTUNITÉS ET DÉFIS DU MARCHÉ DES LOGICIELS DE GESTION DES VOYAGES ET DES DÉPENSES EN ASIE-PACIFIQUE
FIGURE 15 MARCHÉ DES LOGICIELS DE GESTION DES VOYAGES ET DES FRAIS EN ASIE-PACIFIQUE, PAR DÉPLOIEMENT, 2021
FIGURE 16 MARCHÉ DES LOGICIELS DE GESTION DES VOYAGES ET DES FRAIS EN ASIE-PACIFIQUE, PAR TAILLE D'ORGANISATION, 2021
FIGURE 17 MARCHÉ DES LOGICIELS DE GESTION DES VOYAGES ET DES FRAIS EN ASIE-PACIFIQUE, PAR SECTEUR, 2021
FIGURE 18 MARCHÉ DES LOGICIELS DE GESTION DES DÉPENSES ET DES VOYAGES EN ASIE-PACIFIQUE : INSTANTANÉ (2021)
FIGURE 19 MARCHÉ DES LOGICIELS DE GESTION DES VOYAGES ET DES FRAIS EN ASIE-PACIFIQUE : PAR PAYS (2021)
FIGURE 20 MARCHÉ DES LOGICIELS DE GESTION DES VOYAGES ET DES FRAIS EN ASIE-PACIFIQUE : PAR PAYS (2022 ET 2029)
FIGURE 21 MARCHÉ DES LOGICIELS DE GESTION DES VOYAGES ET DES FRAIS EN ASIE-PACIFIQUE : PAR PAYS (2021 ET 2029)
FIGURE 22 MARCHÉ DES LOGICIELS DE GESTION DES DÉPENSES ET DES VOYAGES EN ASIE-PACIFIQUE : PAR DÉPLOIEMENT (2022-2029)
FIGURE 23 MARCHÉ DES LOGICIELS DE GESTION DES VOYAGES ET DES FRAIS EN ASIE-PACIFIQUE : PART DE L'ENTREPRISE EN 2021 (%)
FIGURE 24 MARCHÉ DES LOGICIELS DE GESTION DES VOYAGES ET DES FRAIS AUX ÉTATS-UNIS, AU CANADA, AU ROYAUME-UNI, EN ESPAGNE, AU BRÉSIL, AUX ÉMIRATS ARABES UNIS, AU JAPON ET EN AUSTRALIE : PART DES ENTREPRISES EN 2021 (%)
Méthodologie de recherche
La collecte de données et l'analyse de l'année de base sont effectuées à l'aide de modules de collecte de données avec des échantillons de grande taille. L'étape consiste à obtenir des informations sur le marché ou des données connexes via diverses sources et stratégies. Elle comprend l'examen et la planification à l'avance de toutes les données acquises dans le passé. Elle englobe également l'examen des incohérences d'informations observées dans différentes sources d'informations. Les données de marché sont analysées et estimées à l'aide de modèles statistiques et cohérents de marché. De plus, l'analyse des parts de marché et l'analyse des tendances clés sont les principaux facteurs de succès du rapport de marché. Pour en savoir plus, veuillez demander un appel d'analyste ou déposer votre demande.
La méthodologie de recherche clé utilisée par l'équipe de recherche DBMR est la triangulation des données qui implique l'exploration de données, l'analyse de l'impact des variables de données sur le marché et la validation primaire (expert du secteur). Les modèles de données incluent la grille de positionnement des fournisseurs, l'analyse de la chronologie du marché, l'aperçu et le guide du marché, la grille de positionnement des entreprises, l'analyse des brevets, l'analyse des prix, l'analyse des parts de marché des entreprises, les normes de mesure, l'analyse globale par rapport à l'analyse régionale et des parts des fournisseurs. Pour en savoir plus sur la méthodologie de recherche, envoyez une demande pour parler à nos experts du secteur.
Personnalisation disponible
Data Bridge Market Research est un leader de la recherche formative avancée. Nous sommes fiers de fournir à nos clients existants et nouveaux des données et des analyses qui correspondent à leurs objectifs. Le rapport peut être personnalisé pour inclure une analyse des tendances des prix des marques cibles, une compréhension du marché pour d'autres pays (demandez la liste des pays), des données sur les résultats des essais cliniques, une revue de la littérature, une analyse du marché des produits remis à neuf et de la base de produits. L'analyse du marché des concurrents cibles peut être analysée à partir d'une analyse basée sur la technologie jusqu'à des stratégies de portefeuille de marché. Nous pouvons ajouter autant de concurrents que vous le souhaitez, dans le format et le style de données que vous recherchez. Notre équipe d'analystes peut également vous fournir des données sous forme de fichiers Excel bruts, de tableaux croisés dynamiques (Fact book) ou peut vous aider à créer des présentations à partir des ensembles de données disponibles dans le rapport.

