Europe Biodiesel Market, By Feedstock (Vegetable Oil and Animal Fats), Blend (B100, B20, B10, and B5), Production Technology (Trans-Esterification, Pyrolysis, Hydro Heating, Dilution, Micro-Emulsification, and Others), Application (Fuel, Power Generation, and Others) Industry Trends and Forecast to 2029.
Europe Biodiesel Market Analysis and Insights
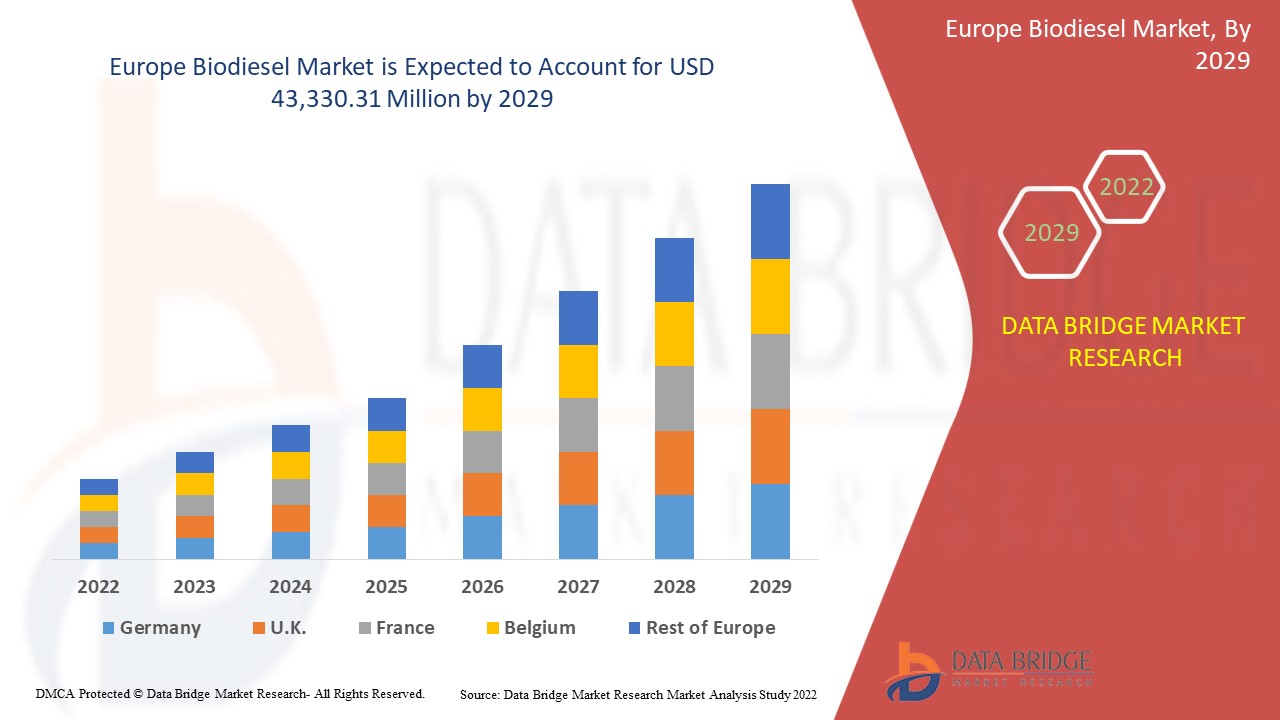
Europe biodiesel market is expected to gain significant growth in the forecast period of 2022 to 2029. Data Bridge Market Research analyzes that the market is growing with a CAGR of 4.7% in the forecast period of 2022 to 2029 and is expected to reach USD 43,330.31 million by 2029. Some of the major factors driving the market growth are growing demand for eco-friendly fuels, high compatibility of biodiesel with existing diesel engines, and rapidly depleting reserves of fossil fuels.
Biodiesel is becoming a more affordable option due to the unstable prices of petroleum-based products. The biodiesel market is developing in response to public pressure to reduce emissions and replace fossil fuels due to environmental concerns and concerns over rapidly depleting crude oil reserves across the globe. Moreover, the use of biodiesel boosts the fuel's cetane number and improves its lubricity.
Europe biodiesel market report provides details of market share, new developments, impact of domestic and localized market players, analyzes opportunities in terms of emerging revenue pockets, changes in market regulations, product approvals, strategic decisions, product launches, geographic expansions, and technological innovations in the market. To understand the analysis and the market scenario contact us for an analyst brief, our team will help you create a revenue impact solution to achieve your desired goal.
|
Report Metric |
Details |
|
Forecast Period |
2022 to 2029 |
|
Base Year |
2021 |
|
Historic Year |
2020 (Customizable to 2019 - 2014) |
|
Quantitative Units |
Revenue in USD Million |
|
Segments Covered |
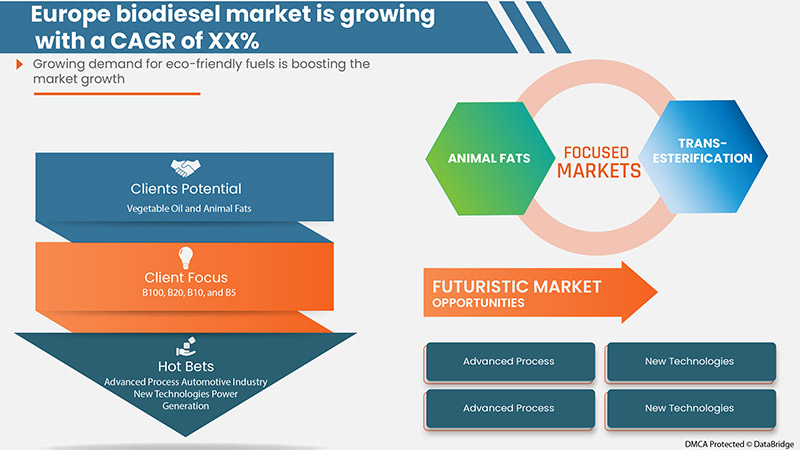
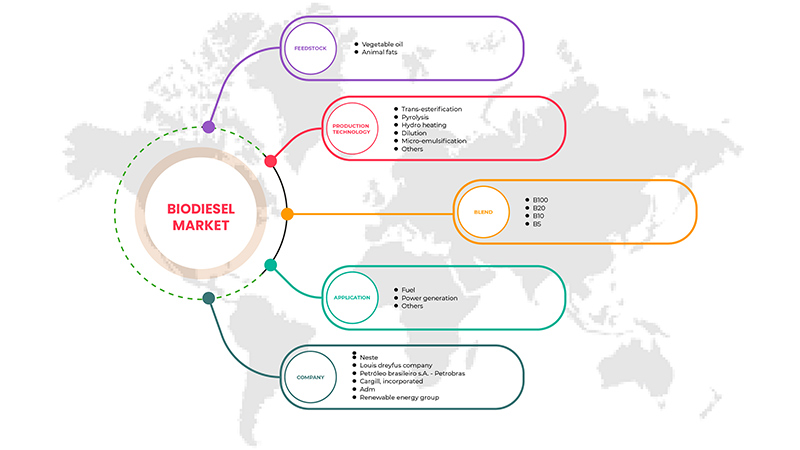
By Feedstock (Vegetable Oil and Animal Fats), Blend (B100, B20, B10, and B5), Production Technology (Trans-Esterification, Pyrolysis, Hydro Heating, Dilution, Micro-Emulsification, and Others), Application (Fuel, Power Generation, and Others) |
|
Countries Covered |
U.K., Russia, France, Spain, Italy, Germany, Turkey, Netherlands, Switzerland, Belgium, Luxembourg, and rest of Europe |
|
Market Players Covered |
Louis Dreyfus Company, Münzer Bioindustrie GmbH, Bio-Oils Energy, Argent Energy, Eco Fox Srl, ecomotion.de, ECODIESEL COLOMBIA S.A., ADM, Neste, Renewable Energy Group, VERBIO Vereinigte BioEnergie AG, Petróleo Brasileiro S.A. – Petrobras, and Cargill, Incorporated. |
Market Definition
Biodiesel is obtained from renewable feedstock such as vegetable oil and animal fats by utilizing a chemical procedure called trans-esterification which converts oil and fats into fatty acids methyl esters. It is employed as a substitute for petroleum diesel fuel and is often combined with petroleum diesel fuel for other parts. It is efficient to decrease exhaust release when compared to petroleum diesel fuel. It has applications in automotive, marine, aviation, industrial, and other industries. In marine industry, it is used as an excellent material as shipping fuel, being biodegradable and non-toxic in nature.
Europe Biodiesel Market Dynamics
DRIVERS
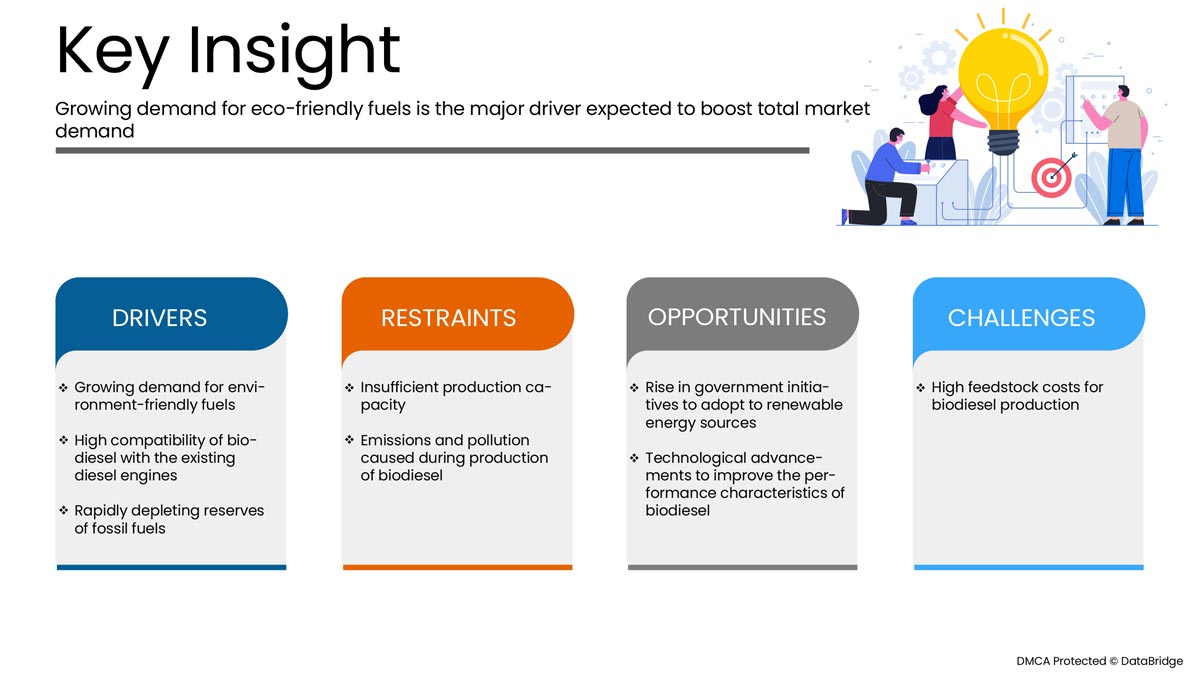
- Growing demand for environment-friendly fuels
Biodiesel fuel is similar to diesel fuel but is much more eco-friendly. Biodiesel is a clean, non-polluting energy source. This green transition is seen as a catalyst for the biodiesel market, paving the way for biodiesel suppliers. The need to integrate renewable energy sources is driving the demand for biodiesel. Biodiesel is expected to grow fast in popularity as a replacement for conventional fossil fuels in various applications. Biodiesel is helping several countries across Europe to decrease their reliance on foreign oil reserves and imports, since it is manufactured domestically and deployed in a diesel engine with minor or near modifications. Moreover, second-generation and third-generation biofuels, such as those produced using algae, have a greater potential to reduce emissions. Therefore, the growing demand for eco-friendly and sustainable fuels and energy sources across various industries is expected to drive the demand for biodiesel, which in turn is expected to drive market growth.
- High compatibility of biodiesel with the existing diesel engines
The industry is expected to benefit from increased demand for fuel in commercial vehicles as a replacement for crude oil as it emits fewer Volatile Organic Compounds (VOCs) than traditional fuels, such as diesel. The main target for biodiesel consumption is fuel and power generation applications. Today, automotive and marine industries are using a majority of the fuel produced, which uses components of crude oil in heavy quantities. These conventional fuels release toxicants into the environment. Also, in power generation, biodiesel can be used in generators where only a few changes or no changes are needed to be done to the structure of machine.
- Rapidly depleting reserves of fossil fuels
The limited availability and surging prices of non-renewable energy sources, such as petrol, diesel, and Liquefied Petroleum Gas (LPG) are favoring the utilization of biodiesel in various industries. Biofuel production and its uses in industries and transportation considerably minimize fossil fuel dependence. Furthermore, a growing preference for replacing fossil fuels, which are associated with higher Greenhouse Gas (GHG) emissions, with biofuel such as biodiesel, which is renewable and biodegradable, is influencing the demand in various European countries.
OPPORTUNITIES
- Rise in government initiatives to adopt renewable energy sources
Governments of many countries are supporting eco-friendly alternatives such as biodiesel. Government aid like subsidies and imposing mandates indicates and helps in continued market growth. Governments in the European region are constantly attempting to adopt renewable energy sources to generate power and as a fuel to reduce GHG emissions. As a result, the demand for the product in fuel applications and power generation applications is expected to grow in the near future.
- Technological advancements to improve the performance characteristics of biodiesel
The transportation sector is mainly responsible for adding GHGs to the environment. These pollutants are produced by burning petrol and diesel which are used in different locomotives. Though biodiesel has proved to be a promising and best resource for alternative fuel, its exhaust emissions and especially Nitrous Oxide (NOx) is harmful. Nanoparticles added to emulsions have the potential to reduce exhaust emissions without compromising engine performances. The addition of nano additives to biodiesel aids in increasing fuel properties. Nanoparticles increase the surface-to-volume ratio and oxidation rate of fuel. It decreases ignition delay and improves the ignition temperature of combustion zone.
RESTRAINTS/CHALLENGES
- Insufficient production capacity
Europe biodiesel market is largely affected by lack of efficiency in the production of biodiesel in desired quantities and this is due to several factors. At present, there is no policy mechanism incentivizing farmers to collect and deliver biomass residues to a next-generation biodiesel plant. Therefore, it is important to establish a reliable supply chain for biomass covering collection, transportation, and handling of biomass feedstock. If the policymakers seek to foster an industry for long term, they could create a mechanism whereby cooperatives or farming communities could be involved in the process of collection, storage, and delivery of residues for the adequate use of feedstock for the production of biodiesel.
- Emissions and pollution caused during production of biodiesel
Substituting conventional fuels with biodiesel blends is considered to be extremely vital for social and environmental reasons; however, there are potential problems associated with its use. Despite the favorable environmental impacts in terms of overall reduced GHG emissions, biodiesel has the potential to increase NOx emissions. Approximately 3% to 4%, 4% to 6%, and 6% to 9% of petroleum diesel are emitted from B20, B40, and B100 respectively.
- High feedstock costs for biodiesel production
Demand for biodiesel and clean-burning fuels over traditional petroleum-based fuels is also linked to the agricultural commodity market. Vegetable oils, such as soybean oil, canola oil, and palm oil, are the most common feedstocks for biodiesel production. Feedstock costs account for approximately 80% to 85% of total biodiesel production costs. Therefore, high price volatility of the feedstock on which biodiesel producers rely threatens their long-term financial stability. Feedstock prices will rise in tandem with biodiesel prices, resulting in lower profit margins.
Recent Development
- In September 2022, Neste launched a strategic study on transitioning its refinery in Porvoo, Finland, to non-crude oil refining and into a globally leading renewable and circular solutions site. Through co-processing and retrofitting units, and benefiting from available refining assets, experience, and know-how Neste targets to significantly grow its renewables and circular production in Porvoo in long term.
Europe Biodiesel Market Scope
Europe biodiesel market is segmented into four notable segments based on feedstock, blend, production technology, and application. The growth amongst these segments will help you analyze major growth segments in the industries and provide the users with a valuable market overview and market insights to make strategic decisions to identify core market applications.
Feedstock
- Vegetable Oil
- Animal Fats
Based on feedstock, the market is segmented into vegetable oil and animal fats.
Blend
- B20
- B10
- B5
- B100
Based on a blend, the market is segmented into B100, B20, B10, and B5.
Production Technology
- Trans-Esterification
- Pyrolysis
- Hydro Heating
- Dilution
- Micro-Emulsification
- Others
Based on production technology, the market is segmented into trans-esterification, pyrolysis, hydro heating, dilution, micro-emulsification, and others.
Application
- Fuel
- Power Generation
- Others
Based on application, the market is segmented into fuel, power generation, and others.
Europe Biodiesel Market Regional Analysis/Insights
Europe biodiesel market is segmented based on feedstock, blend, production technology, and application.
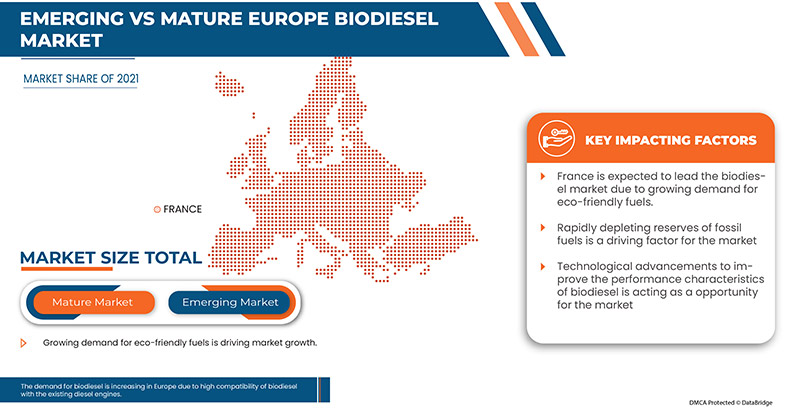
The countries covered in the market are U.K., Russia, France, Spain, Italy, Germany, Turkey, Netherlands, Switzerland, Belgium, Luxembourg, and rest of Europe. France is dominating the market in terms of market share and market revenue due to the growing demand for commercial vehicles in the region.
The country section of the report also provides individual market-impacting factors and changes in market regulation that impact the current and future trends of the market. Data point downstream and upstream value chain analysis, technical trends porter's five forces analysis, and case studies are some of the pointers used to forecast the market scenario for individual countries. Also, the presence and availability of Europe brands and their challenges faced due to large or scarce competition from local and domestic brands, and the impact of domestic tariffs and trade routes are considered while providing forecast analysis of the country data.
Competitive Landscape and Europe Biodiesel Market Share Analysis
Europe biodiesel market competitive landscape provides details by competitors. Details included are company overview, company financials, revenue generated, market potential, investment in R&D, new market initiatives, production sites and facilities, company strengths and weaknesses, product launch, product trials pipelines, product approvals, patents, product width and breadth, application dominance, technology lifeline curve. The above data points provided are only related to the companies’ focus related to the market.
Some of the prominent participants operating in the Europe biodiesel market are Louis Dreyfus Company, Münzer Bioindustrie GmbH, Bio-Oils Energy, Argent Energy, Eco Fox Srl, ecomotion.de, ECODIESEL COLOMBIA S.A., ADM, Neste, Renewable Energy Group, VERBIO Vereinigte BioEnergie AG, Petróleo Brasileiro S.A. – Petrobras, and Cargill, Incorporated.
Research Methodology
Data collection and base year analysis are done using data collection modules with large sample sizes. The market data is analyzed and estimated using market statistical and coherent models. In addition, market share analysis and key trend analysis are the major success factors in the market report. The key research methodology used by the DBMR research team is data triangulation which involves data mining, analysis of the impact of data variables on the market, and primary (industry expert) validation. Apart from this, data models include Vendor Positioning grids, Market Time Line Analysis, Market Overview and Guide, Company Positioning grids, Company Market Share Analysis, Standards of Measurement, Europe Vs Regional, and Vendor Share Analysis. Please request an analyst call in case of further inquiry.
SKU-
Accédez en ligne au rapport sur le premier cloud mondial de veille économique

- Tableau de bord d'analyse de données interactif
- Tableau de bord d'analyse d'entreprise pour les opportunités à fort potentiel de croissance
- Accès d'analyste de recherche pour la personnalisation et les requêtes
- Analyse de la concurrence avec tableau de bord interactif
- Dernières actualités, mises à jour et analyse des tendances
- Exploitez la puissance de l'analyse comparative pour un suivi complet de la concurrence
Table des matières
1 INTRODUCTION
1.1 OBJECTIFS DE L'ÉTUDE
1.2 DÉFINITION DU MARCHÉ
1.3 APERÇU DU MARCHÉ EUROPÉEN DU BIODIESEL
1.4 LIMITATIONS
1,5 MARCHÉS COUVERTS
2 SEGMENTATION DU MARCHÉ
2.1 MARCHÉS COUVERTS
2.2 PORTÉE GÉOGRAPHIQUE
2,3 ANS CONSIDÉRÉS POUR L'ÉTUDE
2.4 MONNAIE ET TARIFS
2.5 MODÈLE DE VALIDATION DES DONNÉES DU TRÉPIED BMR
2.6 COURBE DE VIE DE LA MATIÈRE PREMIÈRE
2.7 MODÉLISATION MULTIVARIÉE
2.8 ENTRETIENS PRIMAIRES AVEC DES LEADERS D'OPINION CLÉS
2.9 GRILLE DE POSITIONNEMENT DU MARCHÉ DBMR
2.1 GRILLE DE COUVERTURE DES APPLICATIONS DU MARCHÉ
2.11 MATRICE DES DÉFIS DU MARCHÉ DBMR
2.12 ANALYSE DE LA PART DES FOURNISSEURS BMR
2.13 DONNÉES D'IMPORTATION-EXPORTATION
2.14 SOURCES SECONDAIRES
2.15 HYPOTHÈSES
3 RÉSUMÉ EXÉCUTIF
4 INFORMATIONS PREMIUM
4.1 SCÉNARIO DES SOUS-PRODUITS DU BIODIESEL
4.2 ANALYSE DES IMPORTATIONS ET DES EXPORTATIONS
4.3 APERÇUS INDUSTRIELS
4.4 ANALYSE DE LA PRODUCTION ET DE LA CONSOMMATION
4.5 NORMES CERTIFIÉES
4.5.1 UNION EUROPÉENNE
4.5.2 CRITÈRES DE DURABILITÉ DE LA COMMISSION EUROPÉENNE
4.5.3 DIRECTIVE SUR LES ÉNERGIES RENOUVELABLES (RED II)
4.5.4 SPÉCIFICATIONS EUROPÉENNES DU CARBURANT DIESEL
4.6 ANALYSE DE LA CHAÎNE DE VALEUR
5 APERÇU DU MARCHÉ
5.1 PILOTES
5.1.1 DEMANDE CROISSANTE DE CARBURANTS RESPECTUEUX DE L'ENVIRONNEMENT
5.1.2 HAUTE COMPATIBILITÉ DU BIODIESEL AVEC LES MOTEURS DIESEL EXISTANTS
5.1.3 ÉPUISEMENT RAPIDE DES RÉSERVES DE COMBUSTIBLES FOSSILES
5.2 RESTRICTIONS
5.2.1 CAPACITÉ DE PRODUCTION INSUFFISANTE
5.2.2 ÉMISSIONS ET POLLUTION CAUSÉES LORS DE LA PRODUCTION DE BIODIESEL
5.3 OPPORTUNITÉS
5.3.1 AUGMENTATION DES INITIATIVES GOUVERNEMENTALES VISANT À ADOPTER DES SOURCES D'ÉNERGIE RENOUVELABLES
5.3.2 AVANCÉES TECHNOLOGIQUES POUR AMÉLIORER LES CARACTÉRISTIQUES DE PERFORMANCE DU BIODIESEL
5.4 DÉFI
5.4.1 COÛTS ÉLEVÉS DES MATIÈRES PREMIÈRES POUR LA PRODUCTION DE BIODIESEL
6 MARCHÉ EUROPÉEN DU BIODIESEL, PAR MATIÈRE PREMIÈRE
6.1 APERÇU
6.2 HUILE VÉGÉTALE
6.2.1 HUILES COMESTIBLES
6.2.1.1 HUILE DE COLZA
6.2.1.2 HUILE DE SOJA
6.2.1.3 HUILE DE PALME
6.2.1.4 HUILE DE MAÏS
6.2.1.5 HUILE DE CANOLA
6.2.1.6 AUTRES
6.2.2 HUILES NON COMESTIBLES
6.2.2.1 JATROPHA
6.2.2.2 KARANJA
6.2.2.3 MAHUJA
6.2.2.4 GRAINES DE CAOUTCHOUC
6.2.2.5 MICROALGUES
6.2.2.6 COTONIER À SOIE
6.2.2.7 AUTRES
6.2.2.7.1 CARBURANT
6.2.2.7.2 PRODUCTION D'ÉNERGIE
6.2.2.7.3 AUTRES
6.3 GRAISSES ANIMALES
6.3.1 GRAISSE BLANCHE
6.3.2 SUIF
6.3.3 VOLAILLE
6.3.4 AUTRES
6.3.4.1 CARBURANT
6.3.4.2 PRODUCTION D'ÉNERGIE
6.3.4.3 AUTRES
7 MARCHÉ EUROPÉEN DU BIODIESEL, PAR MÉLANGE
7.1 APERÇU
7.2 B20
7.3 B10
7.4 B5
7,5 B100
8 MARCHÉ EUROPÉEN DU BIODIESEL, PAR TECHNOLOGIE DE PRODUCTION
8.1 APERÇU
8.2 TRANSESTÉRIFICATION
8.3 PYROLYSE
8.4 CHAUFFAGE HYDRAULIQUE
DILUTION 8,5
8.6 MICRO-ÉMULSIFICATION
8.7 AUTRES
9 MARCHÉ EUROPÉEN DU BIODIESEL, PAR APPLICATION
9.1 APERÇU
9.2 CARBURANT
9.2.1 AUTOMOBILE
9.2.1.1 VÉHICULES ROUTIERS
9.2.1.1.1 TRAVAUX LÉGERS
9.2.1.1.2 SERVICE MOYEN
9.2.1.1.3 SERVICE INTENSE
9.2.1.2 VÉHICULES TOUT-TERRAIN
9.2.1.2.1 ENGINS DE CONSTRUCTION
9.2.1.2.2 ÉQUIPEMENTS MINIERS
9.2.1.2.3 LOCOMOTIVES
9.2.1.2.4 AUTRES
9.2.1.1 MARINE
9.2.1.2 AGRICULTURE
9.2.1.3 AUTRES
9.3 PRODUCTION D'ÉNERGIE
9.4 AUTRES
10 MARCHÉ EUROPÉEN DU BIODIESEL, PAR PAYS
10.1 EUROPE
10.1.1 FRANCE
10.1.2 ALLEMAGNE
10.1.3 ESPAGNE
10.1.4 Royaume-Uni
10.1.5 ITALIE
10.1.6 BELGIQUE
10.1.7 RUSSIE
10.1.8 SUISSE
10.1.9 PAYS-BAS
10.1.10 TURQUIE
10.1.11 LUXEMBOURG
10.1.12 RESTE DE L'EUROPE
11 MARCHÉ EUROPÉEN DU BIODIESEL, PAYSAGE DES ENTREPRISES
11.1 ANALYSE DES ACTIONS DE L'ENTREPRISE : EUROPE
11.2 COLLABORATION
11.3 EXPANSION DES INSTALLATIONS
11.4 LANCEMENT DU PRODUIT
11.5 ACQUISITION
12 ANALYSE SWOT
13 PROFILS D'ENTREPRISE
13.1 NESTE
13.1.1 INSTANTANÉ DE L'ENTREPRISE
13.1.2 ANALYSE DES REVENUS
13.1.3 PORTEFEUILLE DE PRODUITS
13.1.4 ÉVOLUTIONS RÉCENTES
13.2 SOCIÉTÉ LOUIS DREYFUS
13.2.1 INSTANTANÉ DE L'ENTREPRISE
13.2.2 PORTEFEUILLE DE PRODUITS
13.2.3 ÉVOLUTION RÉCENTE
13.3 PETRÓLEO BRASILEIRO SA – PETROBRAS
13.3.1 INSTANTANÉ DE L'ENTREPRISE
13.3.2 ANALYSE DES REVENUS
13.3.3 PORTEFEUILLE DE PRODUITS
13.3.4 ÉVOLUTION RÉCENTE
13.4 CARGILL, INCORPORÉE
13.4.1 INSTANTANÉ DE L'ENTREPRISE
13.4.2 PORTEFEUILLE DE PRODUITS
13.4.3 ÉVOLUTIONS RÉCENTES
13,5 ADM
13.5.1 INSTANTANÉ DE L'ENTREPRISE
13.5.2 ANALYSE DES REVENUS
13.5.3 PORTEFEUILLE DE PRODUITS
13.5.4 ÉVOLUTIONS RÉCENTES
13.6 ÉNERGIE ARGENTÉE
13.6.1 INSTANTANÉ DE L'ENTREPRISE
13.6.2 PORTEFEUILLE DE PRODUITS
13.6.3 ÉVOLUTION RÉCENTE
13.7 BIO-HUILES ÉNERGIE
13.7.1 INSTANTANÉ DE L'ENTREPRISE
13.7.2 PORTEFEUILLE DE PRODUITS
13.7.3 ÉVOLUTION RÉCENTE
13.8 ECOMOTION.DE
13.8.1 INSTANTANÉ DE L'ENTREPRISE
13.8.2 PORTEFEUILLE DE PRODUITS
13.8.3 ÉVOLUTION RÉCENTE
13.9 ECODIESEL COLOMBIA SA
13.9.1 INSTANTANÉ DE L'ENTREPRISE
13.9.2 PORTEFEUILLE DE PRODUITS
13.9.3 ÉVOLUTION RÉCENTE
13.1 ECO FOX SRL
13.10.1 INSTANTANÉ DE L'ENTREPRISE
13.10.2 PORTEFEUILLE DE PRODUITS
13.10.3 ÉVOLUTION RÉCENTE
13.11 MÜNZER BIOINDUSTRIE GMBH
13.11.1 INSTANTANÉ DE L'ENTREPRISE
13.11.2 PORTEFEUILLE DE PRODUITS
13.11.3 ÉVOLUTION RÉCENTE
13.12 GROUPE ÉNERGIE RENOUVELABLE
13.12.1 INSTANTANÉ DE L'ENTREPRISE
13.12.2 PORTEFEUILLE DE PRODUITS
13.12.3 ÉVOLUTIONS RÉCENTES
13.13 VERBIO UNITED BIOENERGY AG
13.13.1 INSTANTANÉ DE L'ENTREPRISE
13.13.2 PORTEFEUILLE DE PRODUITS
13.13.3 ÉVOLUTION RÉCENTE
14 QUESTIONNAIRE
15 RAPPORTS CONNEXES
Liste des tableaux
TABLEAU 1 DONNÉES D'IMPORTATION DE BIODIESEL ET DE SES MÉLANGES, NE CONTENANT PAS OU CONTENANT < 70 % EN POIDS DE PÉTROLE ; CODE SH – 3826 (MILLIERS USD)
TABLEAU 2 DONNÉES D'EXPORTATION DE BIODIESEL ET DE SES MÉLANGES, NE CONTENANT PAS OU CONTENANT < 70 % EN POIDS DE PÉTROLE ; CODE SH – 3826 (MILLIERS USD)
TABLEAU 3 MARCHÉ EUROPÉEN DU BIODIESEL, PAR MATIÈRE PREMIÈRE, 2020-2029 (EN MILLIONS USD)
TABLEAU 4 MARCHÉ EUROPÉEN DES HUILES VÉGÉTALES SUR LE MARCHÉ DU BIODIESEL, PAR SEGMENT, 2020-2029 (EN MILLIONS USD)
TABLEAU 5 MARCHÉ EUROPÉEN DES HUILES COMESTIBLES SUR LE MARCHÉ DU BIODIESEL, PAR TYPE, 2020-2029 (EN MILLIONS USD)
TABLEAU 6 MARCHÉ EUROPÉEN DES HUILES NON COMESTIBLES DANS LE BIODIESEL, PAR TYPE, 2020-2029 (EN MILLIONS USD)
TABLEAU 7 MARCHÉ EUROPÉEN DES HUILES VÉGÉTALES SUR LE MARCHÉ DU BIODIESEL, PAR APPLICATION, 2020-2029 (EN MILLIONS USD)
TABLEAU 8 GRAISSES ANIMALES SUR LE MARCHÉ EUROPÉEN DU BIODIESEL, PAR SEGMENT, 2020-2029 (EN MILLIONS USD)
TABLEAU 9 GRAISSES ANIMALES SUR LE MARCHÉ EUROPÉEN DU BIODIESEL, PAR APPLICATION, 2020-2029 (EN MILLIONS USD)
TABLEAU 10 MARCHÉ EUROPÉEN DU BIODIESEL, PAR MÉLANGE, 2020-2029 (EN MILLIONS USD)
TABLEAU 11 MARCHÉ EUROPÉEN DU BIODIESEL, PAR TECHNOLOGIE DE PRODUCTION, 2020-2029 (EN MILLIONS USD)
TABLEAU 12 MARCHÉ EUROPÉEN DU BIODIESEL, PAR APPLICATION, 2020-2029 (EN MILLIONS USD)
TABLEAU 13 MARCHÉ EUROPÉEN DU CARBURANT SUR LE MARCHÉ DU BIODIESEL, PAR TYPE, 2020-2029 (EN MILLIONS USD)
TABLEAU 14 MARCHÉ AUTOMOBILE EUROPÉEN DU BIODIESEL, PAR TYPE, 2020-2029 (EN MILLIONS USD)
TABLEAU 15 VÉHICULES ROUTIERS SUR LE MARCHÉ EUROPÉEN DU BIODIESEL, PAR TYPE, 2020-2029 (EN MILLIONS USD)
TABLEAU 16 VÉHICULES TOUT-TERRAIN SUR LE MARCHÉ EUROPÉEN DU BIODIESEL, PAR TYPE, 2020-2029 (EN MILLIONS USD)
TABLEAU 17 MARCHÉ EUROPÉEN DU BIODIESEL, PAR PAYS, 2020-2029 (EN MILLIONS USD)
TABLEAU 18 MARCHÉ EUROPÉEN DU BIODIESEL, PAR PAYS, 2020-2029 (MILLIONS DE LITRES)
TABLEAU 19 MARCHÉ FRANÇAIS DU BIODIESEL, PAR MATIÈRE PREMIÈRE, 2020-2029 (EN MILLIONS USD)
TABLEAU 20 MARCHÉ FRANÇAIS DES HUILES VÉGÉTALES SUR LE MARCHÉ DU BIODIESEL, PAR SEGMENT, 2020-2029 (EN MILLIONS USD)
TABLEAU 21 HUILES ALIMENTAIRES SUR LE MARCHÉ DU BIODIESEL EN FRANCE, PAR TYPE, 2020-2029 (EN MILLIONS USD)
TABLEAU 22 MARCHÉ FRANÇAIS DES HUILES NON COMESTIBLES SUR LE MARCHÉ DU BIODIESEL, PAR TYPE, 2020-2029 (EN MILLIONS USD)
TABLEAU 23 MARCHÉ FRANÇAIS DES HUILES VÉGÉTALES SUR LE MARCHÉ DU BIODIESEL, PAR APPLICATION, 2020-2029 (EN MILLIONS USD)
TABLEAU 24 GRAISSES ANIMALES SUR LE MARCHÉ DU BIODIESEL EN FRANCE, PAR SEGMENT, 2020-2029 (EN MILLIONS USD)
TABLEAU 25 MARCHÉ FRANÇAIS DES GRAISSES ANIMALES SUR LE MARCHÉ DU BIODIESEL, PAR APPLICATION, 2020-2029 (EN MILLIONS USD)
TABLEAU 26 MARCHÉ FRANÇAIS DU BIODIESEL, PAR MÉLANGE, 2020-2029 (EN MILLIONS USD)
TABLEAU 27 MARCHÉ FRANÇAIS DU BIODIESEL, PAR TECHNOLOGIE DE PRODUCTION, 2020-2029 (EN MILLIONS USD)
TABLEAU 28 MARCHÉ FRANÇAIS DU BIODIESEL, PAR APPLICATION, 2020-2029 (EN MILLIONS USD)
TABLEAU 29 MARCHÉ FRANÇAIS DES CARBURANTS SUR LE MARCHÉ DU BIODIESEL, PAR TYPE, 2020-2029 (EN MILLIONS USD)
TABLEAU 30 MARCHÉ AUTOMOBILE FRANÇAIS SUR LE MARCHÉ DU BIODIESEL, PAR TYPE, 2020-2029 (EN MILLIONS USD)
TABLEAU 31 VÉHICULES ROUTIERS SUR LE MARCHÉ DU BIODIESEL EN FRANCE, PAR TYPE, 2020-2029 (EN MILLIONS USD)
TABLEAU 32 VÉHICULES TOUT-TERRAIN SUR LE MARCHÉ DU BIODIESEL EN FRANCE, PAR TYPE, 2020-2029 (EN MILLIONS USD)
TABLEAU 33 MARCHÉ DU BIODIESEL EN ALLEMAGNE, PAR MATIÈRE PREMIÈRE, 2020-2029 (EN MILLIONS USD)
TABLEAU 34 MARCHÉ ALLEMAND DE L'HUILE VÉGÉTALE SUR LE MARCHÉ DU BIODIESEL, PAR SEGMENT, 2020-2029 (EN MILLIONS USD)
TABLEAU 35 HUILES COMESTIBLES SUR LE MARCHÉ DU BIODIESEL EN ALLEMAGNE, PAR TYPE, 2020-2029 (EN MILLIONS USD)
TABLEAU 36 HUILES NON COMESTIBLES SUR LE MARCHÉ DU BIODIESEL EN ALLEMAGNE, PAR TYPE, 2020-2029 (EN MILLIONS USD)
TABLEAU 37 MARCHÉ ALLEMAND DE L'HUILE VÉGÉTALE SUR LE MARCHÉ DU BIODIESEL, PAR APPLICATION, 2020-2029 (EN MILLIONS USD)
TABLEAU 38 ALLEMAGNE GRAISSES ANIMALES SUR LE MARCHÉ DU BIODIESEL, PAR SEGMENT, 2020-2029 (EN MILLIONS USD)
TABLEAU 39 ALLEMAGNE GRAISSES ANIMALES SUR LE MARCHÉ DU BIODIESEL, PAR APPLICATION, 2020-2029 (EN MILLIONS USD)
TABLEAU 40 MARCHÉ DU BIODIESEL EN ALLEMAGNE, PAR MÉLANGE, 2020-2029 (EN MILLIONS USD)
TABLEAU 41 MARCHÉ DU BIODIESEL EN ALLEMAGNE, PAR TECHNOLOGIE DE PRODUCTION, 2020-2029 (EN MILLIONS USD)
TABLEAU 42 MARCHÉ DU BIODIESEL EN ALLEMAGNE, PAR APPLICATION, 2020-2029 (EN MILLIONS USD)
TABLEAU 43 MARCHÉ ALLEMAND DU CARBURANT SUR LE MARCHÉ DU BIODIESEL, PAR TYPE, 2020-2029 (EN MILLIONS USD)
TABLEAU 44 MARCHÉ AUTOMOBILE ALLEMAND DU BIODIESEL, PAR TYPE, 2020-2029 (EN MILLIONS USD)
TABLEAU 45 VÉHICULES ROUTIERS ALLEMANDS SUR LE MARCHÉ DU BIODIESEL, PAR TYPE, 2020-2029 (EN MILLIONS USD)
TABLEAU 46 VÉHICULES TOUT-TERRAIN ALLEMANDS SUR LE MARCHÉ DU BIODIESEL, PAR TYPE, 2020-2029 (EN MILLIONS USD)
TABLEAU 47 MARCHÉ ESPAGNOL DU BIODIESEL, PAR MATIÈRE PREMIÈRE, 2020-2029 (EN MILLIONS USD)
TABLEAU 48 ESPAGNE HUILE VÉGÉTALE SUR LE MARCHÉ DU BIODIESEL, PAR SEGMENT, 2020-2029 (EN MILLIONS USD)
TABLEAU 49 HUILES COMESTIBLES SUR LE MARCHÉ DU BIODIESEL EN ESPAGNE, PAR TYPE, 2020-2029 (EN MILLIONS USD)
TABLEAU 50 HUILES NON COMESTIBLES SUR LE MARCHÉ DU BIODIESEL EN ESPAGNE, PAR TYPE, 2020-2029 (EN MILLIONS USD)
TABLEAU 51 HUILE VÉGÉTALE ESPAGNOLE SUR LE MARCHÉ DU BIODIESEL, PAR APPLICATION, 2020-2029 (EN MILLIONS USD)
TABLEAU 52 ESPAGNE GRAISSES ANIMALES SUR LE MARCHÉ DU BIODIESEL, PAR SEGMENT, 2020-2029 (EN MILLIONS USD)
TABLEAU 53 ESPAGNE GRAISSES ANIMALES SUR LE MARCHÉ DU BIODIESEL, PAR APPLICATION, 2020-2029 (EN MILLIONS USD)
TABLEAU 54 MARCHÉ ESPAGNOL DU BIODIESEL, PAR MÉLANGE, 2020-2029 (EN MILLIONS USD)
TABLEAU 55 MARCHÉ ESPAGNOL DU BIODIESEL, PAR TECHNOLOGIE DE PRODUCTION, 2020-2029 (EN MILLIONS USD)
TABLEAU 56 MARCHÉ ESPAGNOL DU BIODIESEL, PAR APPLICATION, 2020-2029 (EN MILLIONS USD)
TABLEAU 57 CARBURANT SUR LE MARCHÉ DU BIODIESEL EN ESPAGNE, PAR TYPE, 2020-2029 (EN MILLIONS USD)
TABLEAU 58 MARCHÉ AUTOMOBILE ESPAGNOL SUR LE MARCHÉ DU BIODIESEL, PAR TYPE, 2020-2029 (EN MILLIONS USD)
TABLEAU 59 VÉHICULES ROUTIERS ESPAGNOLS SUR LE MARCHÉ DU BIODIESEL, PAR TYPE, 2020-2029 (EN MILLIONS USD)
TABLEAU 60 VÉHICULES TOUT-TERRAIN ESPAGNOLS SUR LE MARCHÉ DU BIODIESEL, PAR TYPE, 2020-2029 (EN MILLIONS USD)
TABLEAU 61 MARCHÉ DU BIODIESEL AU ROYAUME-UNI, PAR MATIÈRE PREMIÈRE, 2020-2029 (EN MILLIONS USD)
TABLEAU 62 HUILE VÉGÉTALE SUR LE MARCHÉ DU BIODIESEL AU ROYAUME-UNI, PAR SEGMENT, 2020-2029 (EN MILLIONS USD)
TABLEAU 63 HUILES COMESTIBLES SUR LE MARCHÉ DU BIODIESEL AU ROYAUME-UNI, PAR TYPE, 2020-2029 (EN MILLIONS USD)
TABLEAU 64 HUILES NON COMESTIBLES SUR LE MARCHÉ DU BIODIESEL AU ROYAUME-UNI, PAR TYPE, 2020-2029 (EN MILLIONS USD)
TABLEAU 65 HUILE VÉGÉTALE SUR LE MARCHÉ DU BIODIESEL AU ROYAUME-UNI, PAR APPLICATION, 2020-2029 (EN MILLIONS USD)
TABLEAU 66 GRAISSES ANIMALES SUR LE MARCHÉ DU BIODIESEL AU ROYAUME-UNI, PAR SEGMENT, 2020-2029 (EN MILLIONS USD)
TABLEAU 67 GRAISSES ANIMALES SUR LE MARCHÉ DU BIODIESEL AU ROYAUME-UNI, PAR APPLICATION, 2020-2029 (EN MILLIONS USD)
TABLEAU 68 MARCHÉ DU BIODIESEL AU ROYAUME-UNI, PAR MÉLANGE, 2020-2029 (EN MILLIONS USD)
TABLEAU 69 MARCHÉ DU BIODIESEL AU ROYAUME-UNI, PAR TECHNOLOGIE DE PRODUCTION, 2020-2029 (EN MILLIONS USD)
TABLEAU 70 MARCHÉ DU BIODIESEL AU ROYAUME-UNI, PAR APPLICATION, 2020-2029 (EN MILLIONS USD)
TABLEAU 71 CARBURANT SUR LE MARCHÉ DU BIODIESEL AU ROYAUME-UNI, PAR TYPE, 2020-2029 (EN MILLIONS USD)
TABLEAU 72 MARCHÉ AUTOMOBILE DU BIODIESEL AU ROYAUME-UNI, PAR TYPE, 2020-2029 (EN MILLIONS USD)
TABLEAU 73 VÉHICULES ROUTIERS BRITANNIQUES SUR LE MARCHÉ DU BIODIESEL, PAR TYPE, 2020-2029 (EN MILLIONS USD)
TABLEAU 74 VÉHICULES TOUT-TERRAIN SUR LE MARCHÉ DU BIODIESEL AU ROYAUME-UNI, PAR TYPE, 2020-2029 (EN MILLIONS USD)
TABLEAU 75 MARCHÉ ITALIEN DU BIODIESEL, PAR MATIÈRE PREMIÈRE, 2020-2029 (EN MILLIONS USD)
TABLEAU 76 MARCHÉ ITALIEN DE L'HUILE VÉGÉTALE SUR LE MARCHÉ DU BIODIESEL, PAR SEGMENT, 2020-2029 (EN MILLIONS USD)
TABLEAU 77 HUILES COMESTIBLES SUR LE MARCHÉ DU BIODIESEL EN ITALIE, PAR TYPE, 2020-2029 (EN MILLIONS USD)
TABLEAU 78 HUILES NON COMESTIBLES SUR LE MARCHÉ DU BIODIESEL EN ITALIE, PAR TYPE, 2020-2029 (EN MILLIONS USD)
TABLEAU 79 HUILE VÉGÉTALE ITALIENNE SUR LE MARCHÉ DU BIODIESEL, PAR APPLICATION, 2020-2029 (EN MILLIONS USD)
TABLEAU 80 ITALIE GRAISSES ANIMALES SUR LE MARCHÉ DU BIODIESEL, PAR SEGMENT, 2020-2029 (EN MILLIONS USD)
TABLEAU 81 ITALIE GRAISSES ANIMALES SUR LE MARCHÉ DU BIODIESEL, PAR APPLICATION, 2020-2029 (EN MILLIONS USD)
TABLEAU 82 MARCHÉ ITALIEN DU BIODIESEL, PAR MÉLANGE, 2020-2029 (EN MILLIONS USD)
TABLEAU 83 MARCHÉ ITALIEN DU BIODIESEL, PAR TECHNOLOGIE DE PRODUCTION, 2020-2029 (EN MILLIONS USD)
TABLEAU 84 MARCHÉ ITALIEN DU BIODIESEL, PAR APPLICATION, 2020-2029 (EN MILLIONS USD)
TABLEAU 85 CARBURANT ITALIEN SUR LE MARCHÉ DU BIODIESEL, PAR TYPE, 2020-2029 (EN MILLIONS USD)
TABLEAU 86 MARCHÉ AUTOMOBILE ITALIEN SUR LE MARCHÉ DU BIODIESEL, PAR TYPE, 2020-2029 (EN MILLIONS USD)
TABLEAU 87 VÉHICULES ROUTIERS ITALIENS SUR LE MARCHÉ DU BIODIESEL, PAR TYPE, 2020-2029 (EN MILLIONS USD)
TABLEAU 88 VÉHICULES TOUT-TERRAIN ITALIEN SUR LE MARCHÉ DU BIODIESEL, PAR TYPE, 2020-2029 (EN MILLIONS USD)
TABLEAU 89 MARCHÉ BELGE DU BIODIESEL, PAR MATIÈRE PREMIÈRE, 2020-2029 (EN MILLIONS USD)
TABLEAU 90 MARCHÉ BELGE DE L'HUILE VÉGÉTALE SUR LE MARCHÉ DU BIODIESEL, PAR SEGMENT, 2020-2029 (EN MILLIONS USD)
TABLEAU 91 HUILES COMESTIBLES SUR LE MARCHÉ DU BIODIESEL EN BELGIQUE, PAR TYPE, 2020-2029 (EN MILLIONS USD)
TABLEAU 92 HUILES NON COMESTIBLES SUR LE MARCHÉ DU BIODIESEL EN BELGIQUE, PAR TYPE, 2020-2029 (EN MILLIONS USD)
TABLEAU 93 MARCHÉ BELGE DE L'HUILE VÉGÉTALE SUR LE MARCHÉ DU BIODIESEL, PAR APPLICATION, 2020-2029 (EN MILLIONS USD)
TABLEAU 94 MARCHÉ DES GRAISSES ANIMALES SUR LE MARCHÉ DU BIODIESEL EN BELGIQUE, PAR SEGMENT, 2020-2029 (EN MILLIONS USD)
TABLEAU 95 MARCHÉ DES GRAISSES ANIMALES SUR LE MARCHÉ DU BIODIESEL EN BELGIQUE, PAR APPLICATION, 2020-2029 (EN MILLIONS USD)
TABLEAU 96 MARCHÉ BELGE DU BIODIESEL, PAR MÉLANGE, 2020-2029 (EN MILLIONS USD)
TABLEAU 97 MARCHÉ BELGE DU BIODIESEL, PAR TECHNOLOGIE DE PRODUCTION, 2020-2029 (EN MILLIONS USD)
TABLEAU 98 MARCHÉ BELGE DU BIODIESEL, PAR APPLICATION, 2020-2029 (EN MILLIONS USD)
TABLEAU 99 MARCHÉ DU CARBURANT SUR LE BIODIESEL EN BELGIQUE, PAR TYPE, 2020-2029 (EN MILLIONS USD)
TABLEAU 100 MARCHÉ AUTOMOBILE BELGE SUR LE MARCHÉ DU BIODIESEL, PAR TYPE, 2020-2029 (EN MILLIONS USD)
TABLEAU 101 VÉHICULES ROUTIERS BELGES SUR LE MARCHÉ DU BIODIESEL, PAR TYPE, 2020-2029 (EN MILLIONS USD)
TABLEAU 102 VÉHICULES TOUT-TERRAIN BELGES SUR LE MARCHÉ DU BIODIESEL, PAR TYPE, 2020-2029 (EN MILLIONS USD)
TABLEAU 103 MARCHÉ RUSSE DU BIODIESEL, PAR MATIÈRE PREMIÈRE, 2020-2029 (EN MILLIONS USD)
TABLEAU 104 HUILE VÉGÉTALE RUSSE SUR LE MARCHÉ DU BIODIESEL, PAR SEGMENT, 2020-2029 (EN MILLIONS USD)
TABLEAU 105 HUILES COMESTIBLES SUR LE MARCHÉ DU BIODIESEL EN RUSSIE, PAR TYPE, 2020-2029 (EN MILLIONS USD)
TABLEAU 106 HUILES NON COMESTIBLES SUR LE MARCHÉ DU BIODIESEL EN RUSSIE, PAR TYPE, 2020-2029 (EN MILLIONS USD)
TABLEAU 107 HUILE VÉGÉTALE RUSSE SUR LE MARCHÉ DU BIODIESEL, PAR APPLICATION, 2020-2029 (EN MILLIONS USD)
TABLEAU 108 GRAISSES ANIMALES SUR LE MARCHÉ DU BIODIESEL EN RUSSIE, PAR SEGMENT, 2020-2029 (EN MILLIONS USD)
TABLEAU 109 GRAISSES ANIMALES SUR LE MARCHÉ DU BIODIESEL EN RUSSIE, PAR APPLICATION, 2020-2029 (EN MILLIONS USD)
TABLEAU 110 MARCHÉ RUSSE DU BIODIESEL, PAR MÉLANGE, 2020-2029 (EN MILLIONS USD)
TABLEAU 111 MARCHÉ RUSSE DU BIODIESEL, PAR TECHNOLOGIE DE PRODUCTION, 2020-2029 (EN MILLIONS USD)
TABLEAU 112 MARCHÉ DU BIODIESEL EN RUSSIE, PAR APPLICATION, 2020-2029 (EN MILLIONS USD)
TABLEAU 113 CARBURANT RUSSE SUR LE MARCHÉ DU BIODIESEL, PAR TYPE, 2020-2029 (EN MILLIONS USD)
TABLEAU 114 MARCHÉ AUTOMOBILE RUSSE SUR LE MARCHÉ DU BIODIESEL, PAR TYPE, 2020-2029 (EN MILLIONS USD)
TABLEAU 115 VÉHICULES ROUTIERS RUSSES SUR LE MARCHÉ DU BIODIESEL, PAR TYPE, 2020-2029 (EN MILLIONS USD)
TABLEAU 116 VÉHICULES TOUT-TERRAIN RUSSES SUR LE MARCHÉ DU BIODIESEL, PAR TYPE, 2020-2029 (EN MILLIONS USD)
TABLEAU 117 MARCHÉ SUISSE DU BIODIESEL, PAR MATIÈRE PREMIÈRE, 2020-2029 (EN MILLIONS USD)
TABLEAU 118 SUISSE HUILE VÉGÉTALE SUR LE MARCHÉ DU BIODIESEL, PAR SEGMENT, 2020-2029 (EN MILLIONS USD)
TABLEAU 119 HUILES COMESTIBLES SUR LE MARCHÉ DU BIODIESEL EN SUISSE, PAR TYPE, 2020-2029 (EN MILLIONS USD)
TABLEAU 120 HUILES NON COMESTIBLES SUR LE MARCHÉ DU BIODIESEL EN SUISSE, PAR TYPE, 2020-2029 (EN MILLIONS USD)
TABLEAU 121 SUISSE HUILE VÉGÉTALE SUR LE MARCHÉ DU BIODIESEL, PAR APPLICATION, 2020-2029 (EN MILLIONS USD)
TABLEAU 122 SUISSE GRAISSES ANIMALES SUR LE MARCHÉ DU BIODIESEL, PAR SEGMENT, 2020-2029 (EN MILLIONS USD)
TABLEAU 123 SUISSE GRAISSES ANIMALES SUR LE MARCHÉ DU BIODIESEL, PAR APPLICATION, 2020-2029 (EN MILLIONS USD)
TABLEAU 124 MARCHÉ SUISSE DU BIODIESEL, PAR MÉLANGE, 2020-2029 (EN MILLIONS USD)
TABLEAU 125 MARCHÉ SUISSE DU BIODIESEL, PAR TECHNOLOGIE DE PRODUCTION, 2020-2029 (EN MILLIONS USD)
TABLEAU 126 MARCHÉ SUISSE DU BIODIESEL, PAR APPLICATION, 2020-2029 (EN MILLIONS USD)
TABLEAU 127 SUISSE CARBURANT SUR LE MARCHÉ DU BIODIESEL, PAR TYPE, 2020-2029 (EN MILLIONS USD)
TABLEAU 128 MARCHÉ AUTOMOBILE SUISSE SUR LE MARCHÉ DU BIODIESEL, PAR TYPE, 2020-2029 (EN MILLIONS USD)
TABLEAU 129 VÉHICULES ROUTIERS SUISSES SUR LE MARCHÉ DU BIODIESEL, PAR TYPE, 2020-2029 (EN MILLIONS USD)
TABLEAU 130 VÉHICULES TOUT-TERRAIN SUISSES SUR LE MARCHÉ DU BIODIESEL, PAR TYPE, 2020-2029 (EN MILLIONS USD)
TABLEAU 131 MARCHÉ DU BIODIESEL AUX PAYS-BAS, PAR MATIÈRE PREMIÈRE, 2020-2029 (EN MILLIONS USD)
TABLEAU 132 HUILE VÉGÉTALE SUR LE MARCHÉ DU BIODIESEL AUX PAYS-BAS, PAR SEGMENT, 2020-2029 (EN MILLIONS USD)
TABLEAU 133 HUILES COMESTIBLES SUR LE MARCHÉ DU BIODIESEL AUX PAYS-BAS, PAR TYPE, 2020-2029 (EN MILLIONS USD)
TABLEAU 134 HUILES NON COMESTIBLES SUR LE MARCHÉ DU BIODIESEL AUX PAYS-BAS, PAR TYPE, 2020-2029 (EN MILLIONS USD)
TABLEAU 135 HUILE VÉGÉTALE SUR LE MARCHÉ DU BIODIESEL AUX PAYS-BAS, PAR APPLICATION, 2020-2029 (EN MILLIONS USD)
TABLEAU 136. GRAISSES ANIMALES SUR LE MARCHÉ DU BIODIESEL AUX PAYS-BAS, PAR SEGMENT, 2020-2029 (EN MILLIONS USD)
TABLEAU 137. GRAISSES ANIMALES SUR LE MARCHÉ DU BIODIESEL AUX PAYS-BAS, PAR APPLICATION, 2020-2029 (EN MILLIONS USD)
TABLEAU 138 MARCHÉ DU BIODIESEL AUX PAYS-BAS, PAR MÉLANGE, 2020-2029 (EN MILLIONS USD)
TABLEAU 139 MARCHÉ DU BIODIESEL AUX PAYS-BAS, PAR TECHNOLOGIE DE PRODUCTION, 2020-2029 (EN MILLIONS USD)
TABLEAU 140 MARCHÉ DU BIODIESEL AUX PAYS-BAS, PAR APPLICATION, 2020-2029 (EN MILLIONS USD)
TABLEAU 141 CARBURANT SUR LE MARCHÉ DU BIODIESEL AUX PAYS-BAS, PAR TYPE, 2020-2029 (EN MILLIONS USD)
TABLEAU 142 MARCHÉ AUTOMOBILE DU BIODIESEL AUX PAYS-BAS, PAR TYPE, 2020-2029 (EN MILLIONS USD)
TABLEAU 143 VÉHICULES ROUTIERS SUR LE MARCHÉ DU BIODIESEL AUX PAYS-BAS, PAR TYPE, 2020-2029 (EN MILLIONS USD)
TABLEAU 144 VÉHICULES TOUT-TERRAIN SUR LE MARCHÉ DU BIODIESEL AUX PAYS-BAS, PAR TYPE, 2020-2029 (EN MILLIONS USD)
TABLEAU 145 MARCHÉ DU BIODIESEL EN TURQUIE, PAR MATIÈRE PREMIÈRE, 2020-2029 (EN MILLIONS USD)
TABLEAU 146 HUILE VÉGÉTALE DE DINDE SUR LE MARCHÉ DU BIODIESEL, PAR SEGMENT, 2020-2029 (EN MILLIONS USD)
TABLEAU 147 HUILES COMESTIBLES DE DINDE SUR LE MARCHÉ DU BIODIESEL, PAR TYPE, 2020-2029 (EN MILLIONS USD)
TABLEAU 148 HUILES NON COMESTIBLES SUR LE MARCHÉ DU BIODIESEL EN TURQUIE, PAR TYPE, 2020-2029 (EN MILLIONS USD)
TABLEAU 149 HUILE VÉGÉTALE DE DINDE SUR LE MARCHÉ DU BIODIESEL, PAR APPLICATION, 2020-2029 (EN MILLIONS USD)
TABLEAU 150 GRAISSES ANIMALES DE DINDE SUR LE MARCHÉ DU BIODIESEL, PAR SEGMENT, 2020-2029 (EN MILLIONS USD)
TABLEAU 151 GRAISSES ANIMALES DE DINDE SUR LE MARCHÉ DU BIODIESEL, PAR APPLICATION, 2020-2029 (EN MILLIONS USD)
TABLEAU 152 MARCHÉ DU BIODIESEL EN TURQUIE, PAR MÉLANGE, 2020-2029 (EN MILLIONS USD)
TABLEAU 153 MARCHÉ DU BIODIESEL EN TURQUIE, PAR TECHNOLOGIE DE PRODUCTION, 2020-2029 (EN MILLIONS USD)
TABLEAU 154 MARCHÉ DU BIODIESEL EN TURQUIE, PAR APPLICATION, 2020-2029 (EN MILLIONS USD)
TABLEAU 155 CARBURANT DE LA TURQUIE SUR LE MARCHÉ DU BIODIESEL, PAR TYPE, 2020-2029 (EN MILLIONS USD)
TABLEAU 156 MARCHÉ AUTOMOBILE DU BIODIESEL EN TURQUIE, PAR TYPE, 2020-2029 (EN MILLIONS USD)
TABLEAU 157 VÉHICULES ROUTIERS SUR LE MARCHÉ DU BIODIESEL EN TURQUIE, PAR TYPE, 2020-2029 (EN MILLIONS USD)
TABLEAU 158 VÉHICULES TOUT-TERRAIN SUR LE MARCHÉ DU BIODIESEL EN TURQUIE, PAR TYPE, 2020-2029 (EN MILLIONS USD)
TABLEAU 159 MARCHÉ DU BIODIESEL AU LUXEMBOURG, PAR MATIÈRE PREMIÈRE, 2020-2029 (EN MILLIONS USD)
TABLEAU 160 MARCHÉ LUXEMBOURGEOIS DE L'HUILE VÉGÉTALE SUR LE MARCHÉ DU BIODIESEL, PAR SEGMENT, 2020-2029 (EN MILLIONS USD)
TABLEAU 161 HUILES COMESTIBLES SUR LE MARCHÉ DU BIODIESEL AU LUXEMBOURG, PAR TYPE, 2020-2029 (EN MILLIONS USD)
TABLEAU 162 HUILES NON COMESTIBLES SUR LE MARCHÉ DU BIODIESEL AU LUXEMBOURG, PAR TYPE, 2020-2029 (EN MILLIONS USD)
TABLEAU 163 MARCHÉ LUXEMBOURGEOIS DE L'HUILE VÉGÉTALE SUR LE MARCHÉ DU BIODIESEL, PAR APPLICATION, 2020-2029 (EN MILLIONS USD)
TABLEAU 164 GRAISSES ANIMALES SUR LE MARCHÉ DU BIODIESEL AU LUXEMBOURG, PAR SEGMENT, 2020-2029 (EN MILLIONS USD)
TABLEAU 165 GRAISSES ANIMALES SUR LE MARCHÉ DU BIODIESEL AU LUXEMBOURG, PAR APPLICATION, 2020-2029 (EN MILLIONS USD)
TABLEAU 166 MARCHÉ DU BIODIESEL AU LUXEMBOURG, PAR MÉLANGE, 2020-2029 (EN MILLIONS USD)
TABLEAU 167 MARCHÉ DU BIODIESEL AU LUXEMBOURG, PAR TECHNOLOGIE DE PRODUCTION, 2020-2029 (EN MILLIONS USD)
TABLEAU 168 MARCHÉ DU BIODIESEL AU LUXEMBOURG, PAR APPLICATION, 2020-2029 (EN MILLIONS USD)
TABLEAU 169 MARCHÉ LUXEMBOURGEOIS DU CARBURANT SUR LE BIODIESEL, PAR TYPE, 2020-2029 (EN MILLIONS USD)
TABLEAU 170 MARCHÉ AUTOMOBILE LUXEMBOURGEOIS DU BIODIESEL, PAR TYPE, 2020-2029 (EN MILLIONS USD)
TABLEAU 171 VÉHICULES ROUTIERS LUXEMBOURGEOIS SUR LE MARCHÉ DU BIODIESEL, PAR TYPE, 2020-2029 (EN MILLIONS USD)
TABLEAU 172 VÉHICULES TOUT-TERRAIN LUXEMBOURGEOIS SUR LE MARCHÉ DU BIODIESEL, PAR TYPE, 2020-2029 (EN MILLIONS USD)
TABLEAU 173 MARCHÉ DU BIODIESEL DANS LE RESTE DE L'EUROPE, PAR MATIÈRE PREMIÈRE, 2020-2029 (EN MILLIONS USD)
Liste des figures
FIGURE 1 MARCHÉ EUROPÉEN DU BIODIESEL
FIGURE 2 MARCHÉ EUROPÉEN DU BIODIESEL : TRIANGULATION DES DONNÉES
FIGURE 3 MARCHÉ EUROPÉEN DU BIODIESEL : ANALYSE DROC
FIGURE 4 MARCHÉ EUROPÉEN DU BIODIESEL : ANALYSE DU MARCHÉ RÉGIONAL
FIGURE 5 MARCHÉ EUROPÉEN DU BIODIESEL : ANALYSE DE LA RECHERCHE DES ENTREPRISES
FIGURE 6 MARCHÉ EUROPÉEN DU BIODIESEL : COURBE DE DURÉE DE VIE DE LA MATIÈRE PREMIÈRE
FIGURE 7 MARCHÉ EUROPÉEN DU BIODIESEL : MODÉLISATION MULTIVARIABLE
FIGURE 8 MARCHÉ EUROPÉEN DU BIODIESEL : DONNÉES DÉMOGRAPHIQUES DES ENTRETIENS
FIGURE 9 MARCHÉ EUROPÉEN DU BIODIESEL : GRILLE DE POSITIONNEMENT DU MARCHÉ DBMR
FIGURE 10 MARCHÉ EUROPÉEN DU BIODIESEL : GRILLE DE COUVERTURE DES APPLICATIONS DU MARCHÉ
FIGURE 11 MARCHÉ EUROPÉEN DU BIODIESEL : LA MATRICE DES DÉFIS DU MARCHÉ
FIGURE 12 MARCHÉ EUROPÉEN DU BIODIESEL : ANALYSE DES PARTS DE FOURNISSEURS
FIGURE 13 MARCHÉ EUROPÉEN DU BIODIESEL : SEGMENTATION
FIGURE 14 LA DEMANDE CROISSANTE DE CARBURANTS RESPECTUEUX DE L'ENVIRONNEMENT DEVRAIT STIMULER LE MARCHÉ EUROPÉEN DU BIODIESEL AU COURS DE LA PÉRIODE DE PRÉVISION
FIGURE 15 LE SEGMENT DES HUILES VÉGÉTALES DEVRAIT REPRÉSENTER LA PLUS GRANDE PART DU MARCHÉ EUROPÉEN DU BIODIESEL EN 2022 ET 2029
FIGURE 16 SCÉNARIO D'IMPORTATION-EXPORTATION (EN MILLIERS USD)
FIGURE 17 MOTEURS, CONTRAINTES, OPPORTUNITÉS ET DÉFIS DU MARCHÉ EUROPÉEN DU BIODIESEL
FIGURE 18 MARCHÉ EUROPÉEN DU BIODIESEL : PAR MATIÈRE PREMIÈRE, 2021
FIGURE 19 MARCHÉ EUROPÉEN DU BIODIESEL : PAR MÉLANGE, 2021
FIGURE 20 MARCHÉ EUROPÉEN DU BIODIESEL : PAR TECHNOLOGIE DE PRODUCTION, 2021
FIGURE 21 MARCHÉ EUROPÉEN DU BIODIESEL : PAR APPLICATION, 2021
FIGURE 22 MARCHÉ EUROPÉEN DU BIODIESEL : INSTANTANÉ (2021)
FIGURE 23 MARCHÉ EUROPÉEN DU BIODIESEL : PAR PAYS (2021)
FIGURE 24 MARCHÉ EUROPÉEN DU BIODIESEL : PAR PAYS (2022 et 2029)
FIGURE 25 MARCHÉ EUROPÉEN DU BIODIESEL : PAR PAYS (2021 & 2029)
FIGURE 26 MARCHÉ EUROPÉEN DU BIODIESEL : PAR MÉLANGE (2022-2029)
FIGURE 27 MARCHÉ EUROPÉEN DU BIODIESEL : PART DES ENTREPRISES 2021 (%)
Méthodologie de recherche
La collecte de données et l'analyse de l'année de base sont effectuées à l'aide de modules de collecte de données avec des échantillons de grande taille. L'étape consiste à obtenir des informations sur le marché ou des données connexes via diverses sources et stratégies. Elle comprend l'examen et la planification à l'avance de toutes les données acquises dans le passé. Elle englobe également l'examen des incohérences d'informations observées dans différentes sources d'informations. Les données de marché sont analysées et estimées à l'aide de modèles statistiques et cohérents de marché. De plus, l'analyse des parts de marché et l'analyse des tendances clés sont les principaux facteurs de succès du rapport de marché. Pour en savoir plus, veuillez demander un appel d'analyste ou déposer votre demande.
La méthodologie de recherche clé utilisée par l'équipe de recherche DBMR est la triangulation des données qui implique l'exploration de données, l'analyse de l'impact des variables de données sur le marché et la validation primaire (expert du secteur). Les modèles de données incluent la grille de positionnement des fournisseurs, l'analyse de la chronologie du marché, l'aperçu et le guide du marché, la grille de positionnement des entreprises, l'analyse des brevets, l'analyse des prix, l'analyse des parts de marché des entreprises, les normes de mesure, l'analyse globale par rapport à l'analyse régionale et des parts des fournisseurs. Pour en savoir plus sur la méthodologie de recherche, envoyez une demande pour parler à nos experts du secteur.
Personnalisation disponible
Data Bridge Market Research est un leader de la recherche formative avancée. Nous sommes fiers de fournir à nos clients existants et nouveaux des données et des analyses qui correspondent à leurs objectifs. Le rapport peut être personnalisé pour inclure une analyse des tendances des prix des marques cibles, une compréhension du marché pour d'autres pays (demandez la liste des pays), des données sur les résultats des essais cliniques, une revue de la littérature, une analyse du marché des produits remis à neuf et de la base de produits. L'analyse du marché des concurrents cibles peut être analysée à partir d'une analyse basée sur la technologie jusqu'à des stratégies de portefeuille de marché. Nous pouvons ajouter autant de concurrents que vous le souhaitez, dans le format et le style de données que vous recherchez. Notre équipe d'analystes peut également vous fournir des données sous forme de fichiers Excel bruts, de tableaux croisés dynamiques (Fact book) ou peut vous aider à créer des présentations à partir des ensembles de données disponibles dans le rapport.

