Marché européen du kaolin, par qualité (calciné, hydraté, délaminé, traité en surface et structuré), processus (lavé à l'eau, flotté à l'air, calciné, délaminé et modifié en surface et non traité), application (Papier, Céramique, Peinture et revêtements, Fibre de verre, Plastique,Caoutchouc, Produits pharmaceutiques et médicaux, cosmétiques et autres) Tendances et prévisions de l’industrie jusqu’en 2029
Quelle est la taille du marché et le taux de croissance de Kaolin en Europe
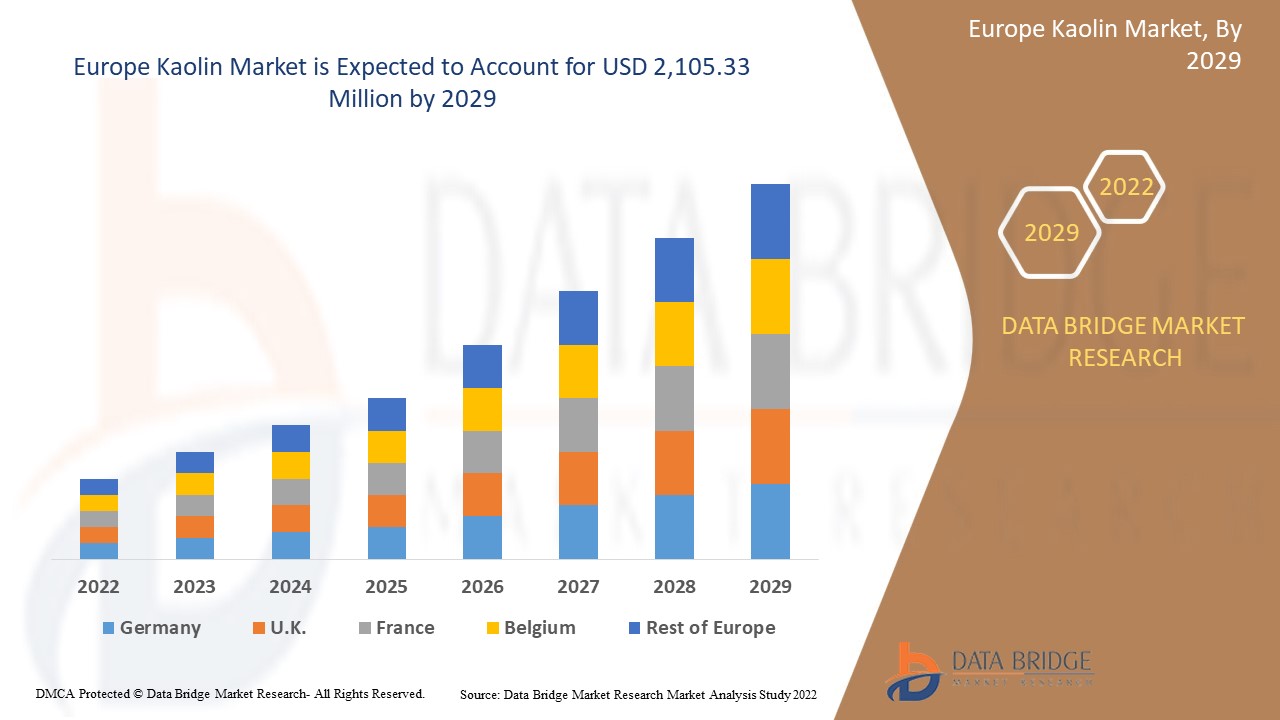
Le marché du kaolin en Europe devrait connaître une croissance significative au cours de la période prévue de 2022 à 2029. Data Bridge Market Research analyse que le marché est en croissance avec un TCAC de 4,7% au cours de la période de prévision de 2022 à 2029 et devrait atteindre USD 2,105,33 millions d'ici 2029. Le principal facteur de croissance du marché de Kaolin est l'augmentation deConstructionactivités à travers le monde, propriétés chimiques et physiques favorables du kaolin, augmentation de la demande de kaolin de diverses industries d'utilisation finale, et forte adoption du kaolin comme unrevêtementadditifs.
Les industries adoptent de plus en plus le kaolin comme matière première pour la production de produits médicinaux et cosmétiques d'importance commerciale. En outre, les propriétés chimiques telles que les protéines adsorbantes, les lipides et les huiles ont augmenté l'utilisation du kaolin pour produire des lavages du visage, des masques du visage, des paquets de boue, des gommages corporels et d'autres produits cosmétiques. Les médicaments, tels que les bains de bouche, les tampons chirurgicaux, les agents de séchage et les agents de protection temporaire contre l'éruption des couches, utilisent le kaolin comme ingrédient clé en raison de ses propriétés chimiques favorables. Par conséquent, l'utilisation intensive du kaolin dans diverses applications et industries peut être à l'origine de la croissance du marché européen du kaolin.
Le rapport sur le marché du kaolin en Europe fournit des détails sur la part de marché, les nouveaux développements et l'impact des acteurs du marché national et local, analyse les possibilités en termes de nouvelles poches de revenus, les changements dans la réglementation du marché, les approbations de produits, les décisions stratégiques, les lancements de produits, les expansions géographiques et les innovations technologiques sur le marché. Pour comprendre l'analyse et le scénario du marché, contactez-nous pour un exposé d'analyste. Notre équipe vous aidera à créer une solution d'impact sur les revenus pour atteindre votre objectif.
|
Rapport métrique |
Détails |
|
Période de prévision |
2022 à 2029 |
|
Année de référence |
2021 |
|
Années historiques |
2020 (sur mesure jusqu ' en 2019-2014) |
|
Unités quantitatives |
Recettes en millions de dollars |
|
Segments couverts |
Par grade (Calcined, Hydrous, Délaminé, Traité de Surface et Structured), Procédé (eau lavée, airfloat, calciné, Délaminé, et surface modifiée et non traitée), Application (Papier, Céramique, Peinture et Revêtement, Fibre de verre, Plastique, Caoutchouc, Pharmaceutique et Médical, Cosmétiques, etc.) |
|
Pays couverts |
Royaume-Uni, Russie, France, Espagne, Italie, Allemagne, Turquie, Pays-Bas, Suisse, Belgique et le reste de l'Europe. |
|
Acteurs du marché couverts |
Quartz Works GmbH, LB MINERALS, Ltd., KaMin LLC. / CADAM, Imerys S.A., SibelCO, Ashapura Group, Thiele Kaolin Company, BASF SE |
Définition du marché
Kaolin, aussi appelé argile de porcelaine, est une argile blanche douce utilisée comme ingrédient nécessaire dans la fabrication de papier, caoutchouc, cosmétiques, et d'autres. Kaolin est utilisé comme agent de remplissage dans l'industrie du papier avec de l'adhésif, ce qui améliore l'apparence du papier, lui donnant une brillance variée, la douceur, la luminosité, l'opacité et l'imprimabilité. De plus, le produit améliore la capacité d'impression du papier en fournissant une absorption d'encre ajoutée, un maintien pigmentaire d'encre et une rugosité accrue. Il est très utilisé dans l'industrie céramique pour la fabrication de porcelaine et de réfractaire. Kaolin améliore la résistance mécanique et l'abrasion dans l'industrie du caoutchouc.
Dynamique du marché européen de Kaolin
Cette section traite de la compréhension des facteurs du marché, des restrictions, des possibilités et des défis. Tout cela est examiné en détail ci-dessous :
Conducteurs
- L'augmentation des activités de construction dans le monde entier
L'accroissement des activités de construction dans les pays en développement s'est accompagné d'une migration accrue de la population rurale vers les centres urbains et d'une augmentation des investissements dans le développement des infrastructures. La demande croissante de produits en raison de l'augmentation des pratiques de rénovation résidentielle dans divers pays, comme les États-Unis, les consommateurs dérivants se concentrent sur le remplacement des planchers de bois par des carreaux de céramique, alimente la croissance du marché du kaolin. En outre, l'Europe devrait connaître un rythme rapide en raison de la croissance de la production et de la consommation de céramique dans ses pays.
- Propriétés chimiques et physiques favorables du kaolin
Kaolin est préféré comme métal de choix dans diverses applications et industries d'utilisation finale en raison de ses propriétés chimiques et physiques souhaitées et favorables qu'il exécute lorsqu'il est utilisé. Dans l'industrie des plastiques, la demande d'argile de kaolin est de plus en plus forte, car son utilisation améliore ses performances électriques, sa durabilité et sa résistance. De plus, l'adoption croissante de la céramique est due à l'opacité, l'inerte chimique, la texture non abrasive et la forme plate de l'argile de kaolin. En outre, l'utilisation du kaolin dans les bétons et le mortier augmente en raison de sa stabilité thermique. Certaines qualités de kaolin ont des particules fines, une forte adsorption et des propriétés de suspension.
- Augmentation de la demande de kaolin provenant de diverses industries d'utilisation finale
De nombreuses variables et propriétés importantes qui agissent en faveur du kaolin et de la demande croissante de produits fabriqués au kaolin ont maintenu le marché du kaolin en croissance constante dans le monde entier. L'application la plus courante du kaolin est dans le secteur du papier, ce qui permet de l'utiliser comme revêtement de papier avec une texture lisse et une opacité appropriée. Cette augmentation est attribuable à l'augmentation de la demande de papier provenant de diverses industries d'utilisation finale, comme l'emballage et l'impression. De plus, ce matériau est largement utilisé pour remplir et enrober des morceaux car il réduit la taille des particules et améliore la résistance. Kaolin est souvent utilisé dans l'industrie du papier parce qu'il offre une variété de qualités, y compris une bonne réceptivité à l'encre, la douceur du papier et l'opacité optimale pour la fabrication du papier.
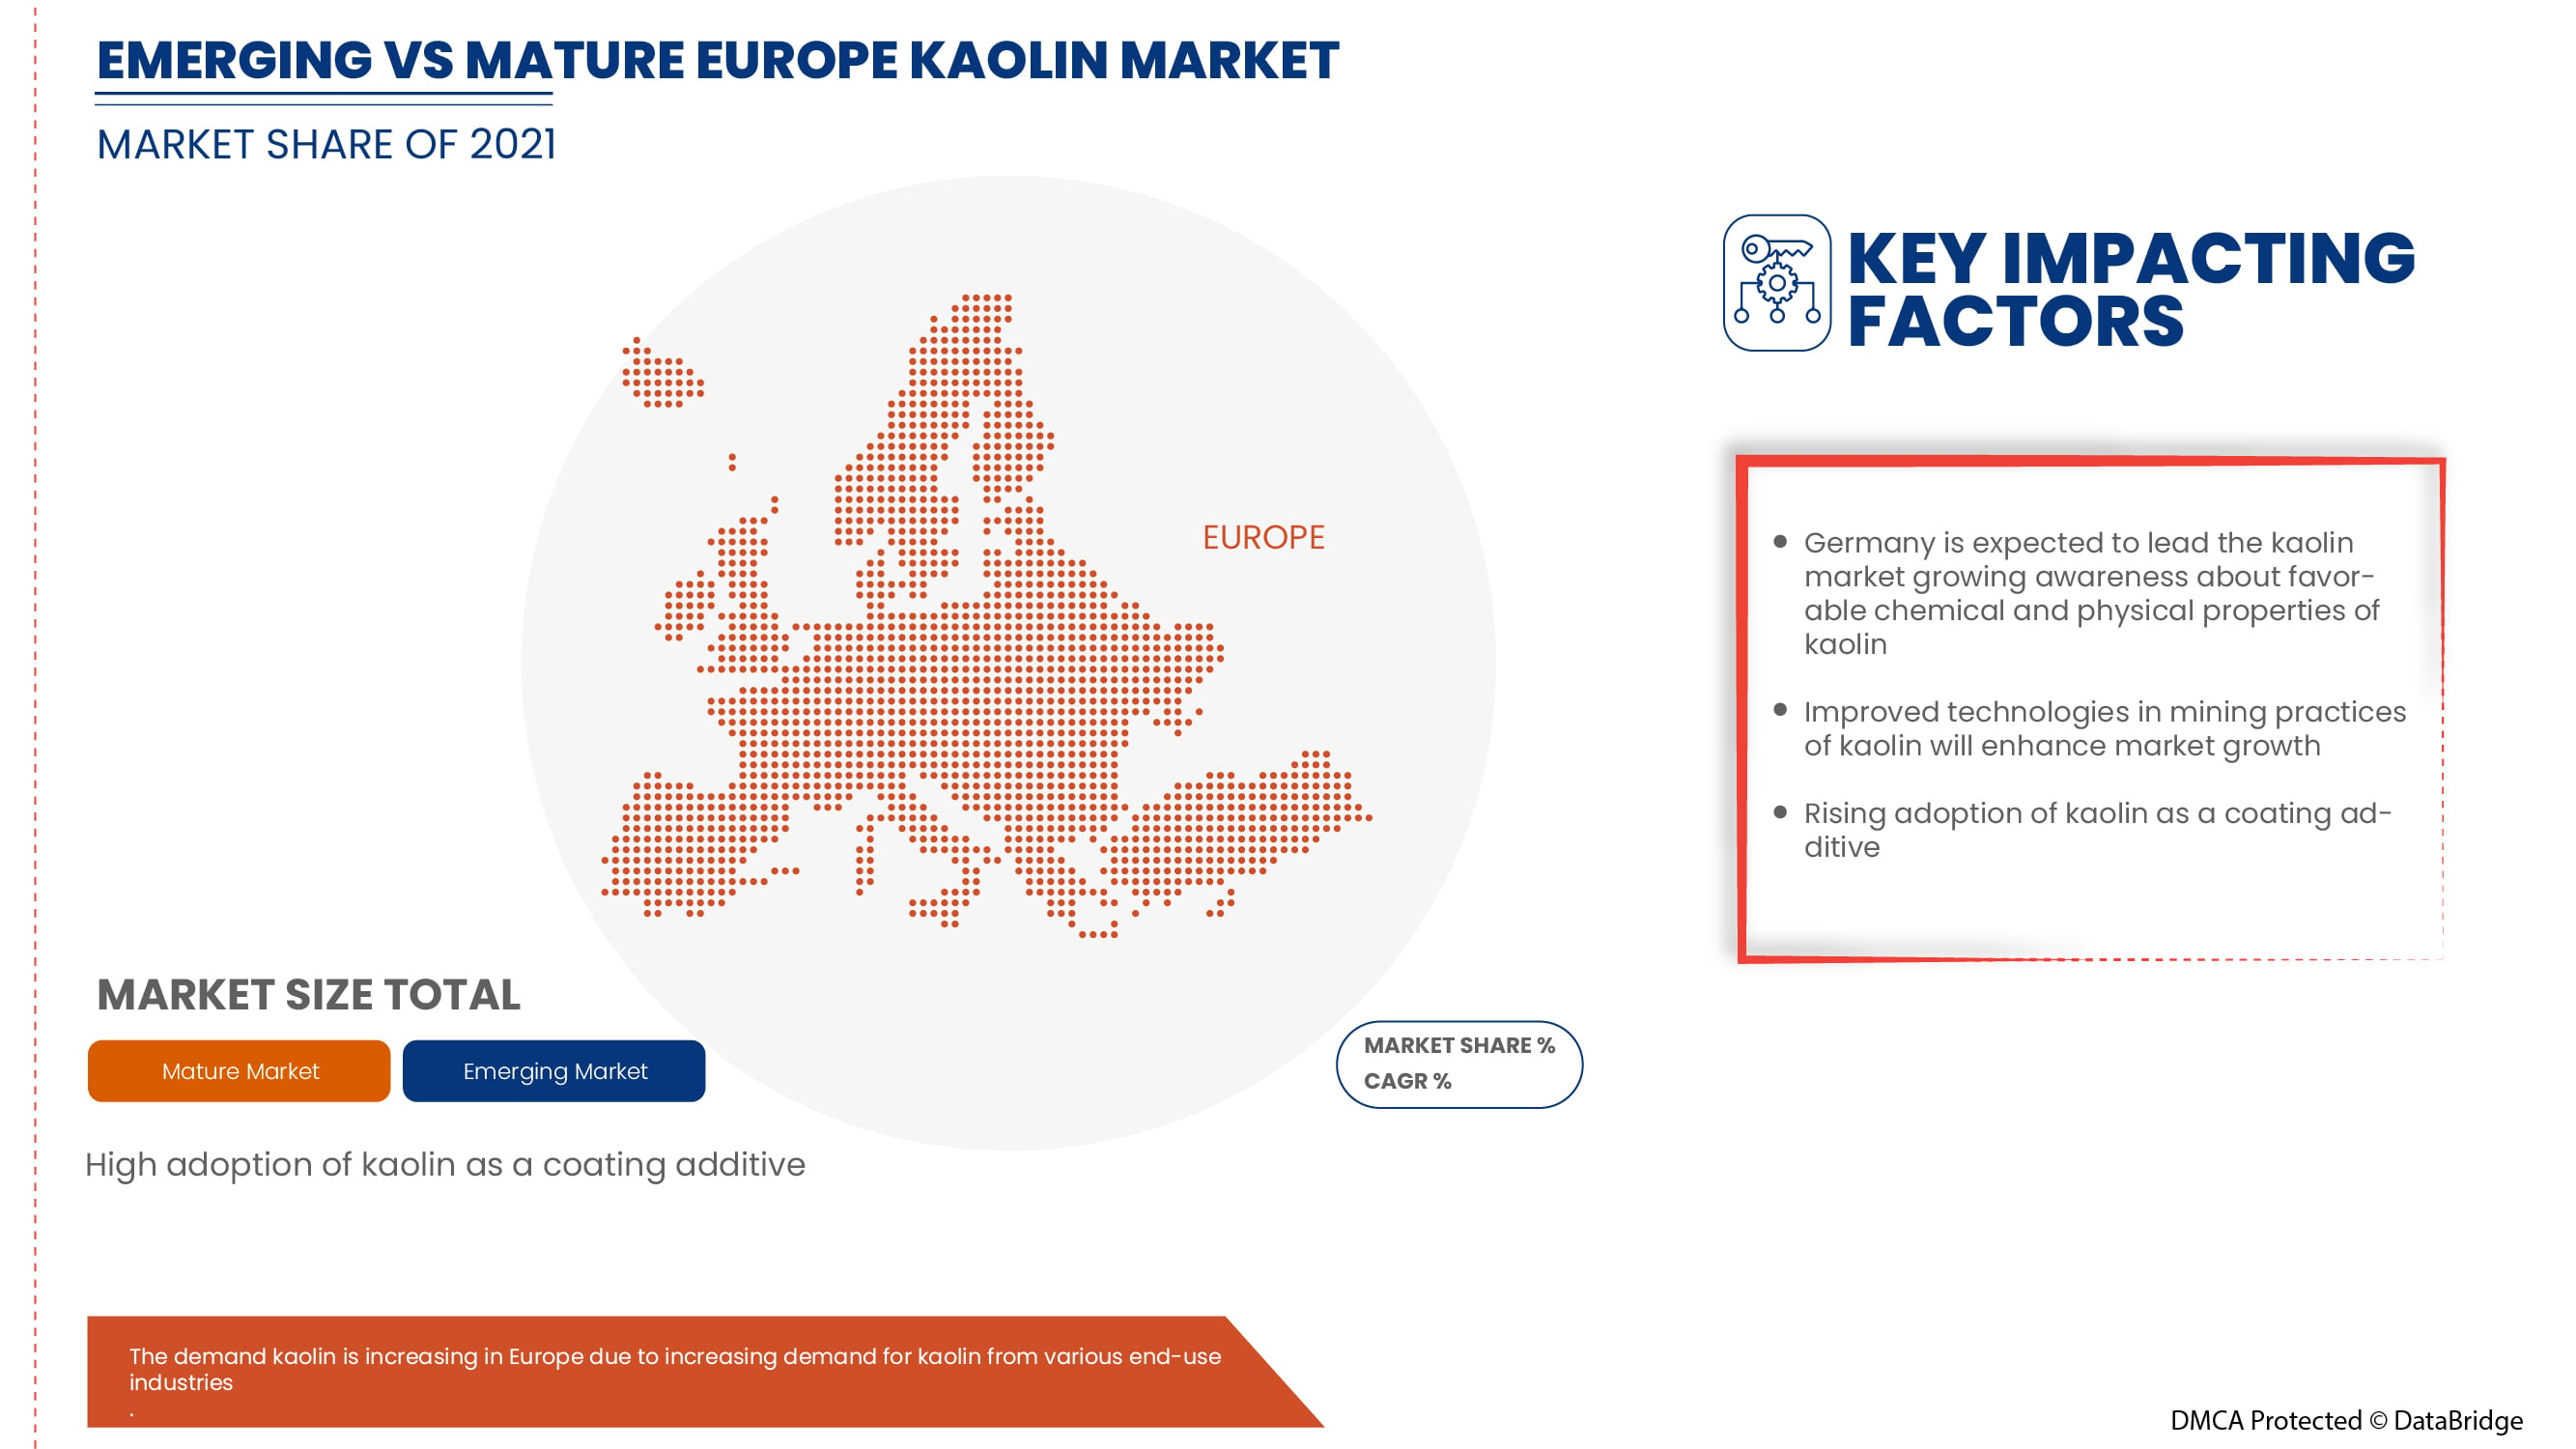
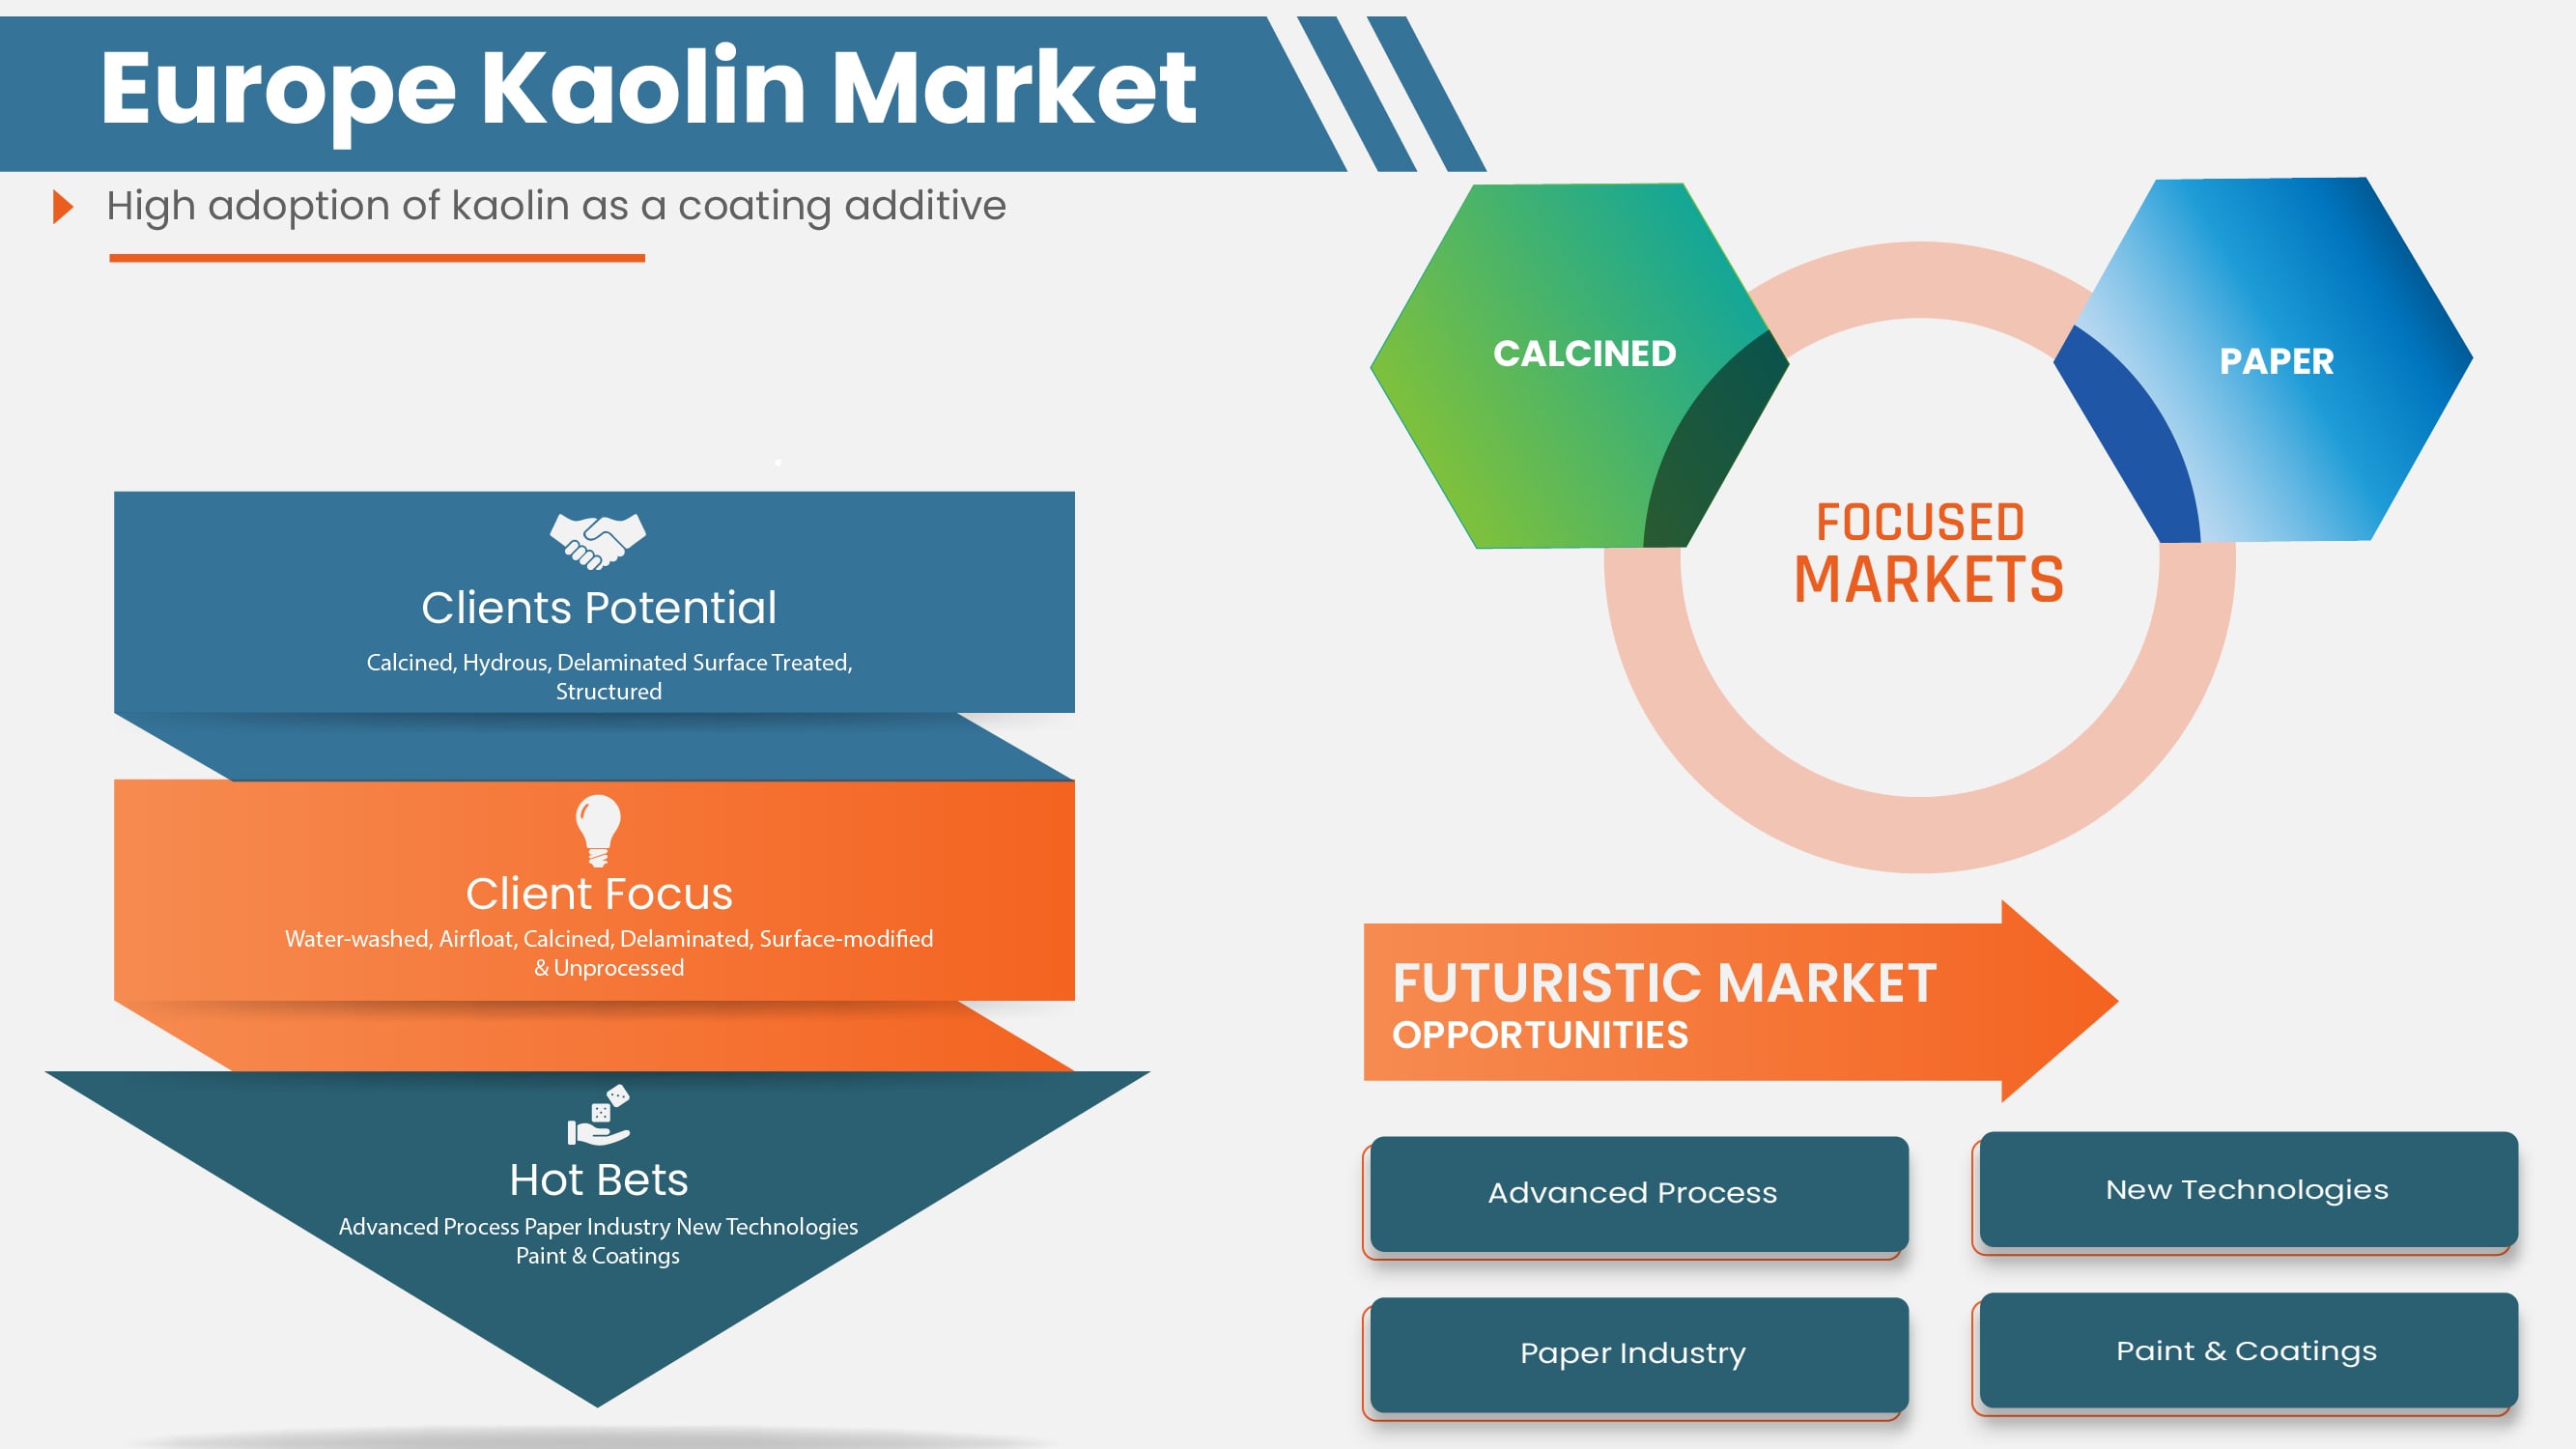
- Haute adoption du kaolin comme additif de revêtement
L'industrie du papier et des peintures et revêtements sont parmi les principaux utilisateurs de kaolin dans ses produits. Kaolin est utilisé pour améliorer la performance des peintures sous la forme de meilleures propriétés de suspension, dispersion rapide, résistance à la corrosion, résistance supérieure à l'eau et viscosité réduite. En outre, le kaolin est utilisé comme revêtement et agent de remplissage lorsqu'il est combiné avec des adhésifs dans le revêtement en papier pour assurer son opacité, sa couleur et son imprimabilité. Kaolin est le minéral particulaire le plus utilisé dans le remplissage et le revêtement du papier. Il améliore l'apparence du papier, caractérisé par le brillant, la douceur, la luminosité et l'opacité, et de la plus grande importance, il améliore l'imprimabilité. Le papier est également rempli de kaolin pour étendre la fibre.
Possibilités
- Principales initiatives stratégiques mises en œuvre par les grandes entreprises
Le marché européen du kaolin a connu un effet négatif inattendu en raison de l'émergence de COVID-10 et de restrictions de circulation et de verrouillages à l'échelle nationale. Par conséquent, les fabricants se concentrent principalement sur le maintien des flux de liquidité pour éviter d'autres pertes. De plus, les principaux acteurs du marché du kaolin ont mis en œuvre diverses initiatives et évolutions stratégiques pour obtenir une part de marché importante et dominante et améliorer leurs activités.
- Amélioration des technologies dans les pratiques minières du kaolin
Le développement technologique pour le traitement du kaolin est essentiellement le développement d'une feuille de flux séquentielle pour sa beneficiation afin d'éliminer toutes les impuretés indésirables, et les propriétés requises du matériau traité sont assurées par un calibrage approprié, une amélioration de la luminosité, des modifications de surface et d'autres opérations. Les méthodes modernes de beneficiation (route humide) du kaolin utilisent des techniques telles que le concassage/attrition, le soufflage, le criblage ou la classification mécanique, les séparations centrifuges, la séparation magnétique, la floculation sélective, la flottation de mousse, le blanchiment oxydatif et réducteur. D'autres techniques, telles que l'attrition/la délamination, le pugging, la calcination, la modification de surface, etc., sont également utilisées pour améliorer les propriétés du produit final.
Restrictions et difficultés
- Effet négatif sur l'industrie du papier en raison de l'émergence de covid-19
L'épidémie de COVID-19 a perturbé la fabrication et l'approvisionnement du marché du kaolin, ce qui a retardé l'expansion de l'industrie mondiale. De nombreuses entreprises de kaolin emploient des moyens pour éviter les pertes de temps d'arrêt, qui sont de plus en plus préoccupantes à mesure que les effets de la pandémie persistent. La performance du kaolin dans les applications de remplissage de papier a été érodée par la concurrence de matériaux alternatifs, en particulier les carbonates de calcium. La croissance lente de la production de papier couché limitera les avances pour le kaolin à l'avenir, limitant ainsi le développement du marché européen du kaolin.
- L'exploitation minière de Kaolin cause de nombreux risques pour l'environnement et la santé
Du point de vue de l'environnement, le problème environnemental le plus important se pose parce que les opérations d'extraction du kaolin créent des surfaces à forte sensibilité au ruissellement et à l'érosion de l'eau, avec un fort potentiel d'effets environnementaux sur et hors site. De plus, le kaolin minier a des effets négatifs à long terme sur l'environnement, comme les déséquilibres environnementaux et agricoles, l'érosion, l'envasement des rivières et des lacs et la déforestation. En raison de l'élimination de la végétation pour le processus d'excavation et d'enlèvement de l'argile, une partie du sol local n'est pas protégée, provoquant des processus de compactage dans certaines situations et de lessivage. Une fois que le sol lessivé devient impropre à l'agriculture, les terres utilisées pour l'extraction de l'argile finissent par être abandonnées par les propriétaires. Par conséquent, l'exploitation du kaolin entraîne une dégradation de l'environnement et de la santé humaine, ce qui devrait freiner la croissance et le développement du marché européen du kaolin.
- Disponibilité facile des substituts
D'autres substituts facilement disponibles sur le marché sont l'argile bentonite. L'argile bentonite possède de puissantes propriétés d'absorption d'huile et peut absorber plus que sa masse corporelle dans l'eau. Cela en fait un excellent ingrédient pour les personnes avec une peau extrêmement grasse et entraîne son utilisation dans les produits cosmétiques. L'argile bentonite est composée de montmorillonite, un type d'argile smectite. Il a une teneur élevée en eau et gonfle quand il entre en contact avec l'eau. Cela le rend efficace pour extraire les impuretés de la peau. Une autre alternative est la terre de Fuller, qui est également utilisée pour le soin de la peau et la désintoxication. De plus, l'argile rhassaul est une argile extraite dans les montagnes de l'Atlas dans le morocco. Il est riche en minéraux, possède des propriétés de nettoyage et de conditionnement, et est une excellente alternative à l'argile de kaolin.
- Hausse du prix du kaolin
Les entreprises et les acteurs opérant sur le marché européen du kaolin se concentrent sur l'augmentation des prix du kaolin pour assurer la durabilité à long terme de l'entreprise. Ces acteurs ont annoncé une hausse des prix en 2021 pour différentes applications, dans lesquelles le papier figurait parmi les applications clés. La plupart des entreprises ont connu une inflation dans divers aspects de l'entreprise, y compris l'inflation dans les produits chimiques et les coûts de fret. De plus, la dégradation causée par l'éclatement de la pandémie par les principaux secteurs d'application a eu une incidence directe sur les revenus des principaux participants au marché.
Développement récent
- En juillet 2022, Thiele Kaolin Company a annoncé une hausse de prix de 9% pour toutes les catégories de produits en raison du climat économique actuel en Europe, ce qui a entraîné une augmentation des coûts pour les activités manufacturières dans le monde entier. Pour l'entreprise, ces hausses de coûts ont affecté l'énergie, les produits chimiques, la main-d'oeuvre, l'exploitation minière, l'entretien et d'autres intrants nécessaires pour produire des produits de qualité
- En novembre 2021, KaMin LLC / CADAM a accepté d'acquérir l'activité minérale de kaolin de BASF SE. Le secteur des minéraux kaolin fait partie de la division Performance Chemicals de BASF. Cela renforce grandement les activités de kaolin de l'entreprise à travers le monde
Marché européen de Kaolin
Le marché européen du kaolin est classé selon le grade, le procédé et l'application. La croissance de ces segments vous aidera à analyser les principaux segments de croissance dans les industries et à fournir aux utilisateurs une vue d'ensemble et des perspectives de marché précieuses pour prendre des décisions stratégiques afin d'identifier les principales applications du marché.
Classe
- Calcinées
- Eau
- Délaminés
- Traitement de surface
- Structured
Sur la base du grade, le marché du kaolin en Europe est classé en cinq segments, à savoir calciné, hydros, délaminé, traité en surface et structuré.
Processus
- Lave-eau
- Flûte aérienne
- Calcinées
- Délaminés
- Modifié et non transformé en surface
Sur la base du procédé, le marché du kaolin en Europe est classé en cinq segments lavés à l'eau, à l'air, calcinés, délaminés et modifiés en surface et non transformés.
Demande
- Papier
- Céramique
- Peinture & revêtements
- Fibre de verre
- Plastique
- Rubber
- Produits pharmaceutiques et médicaux
- Produits cosmétiques
- Autres
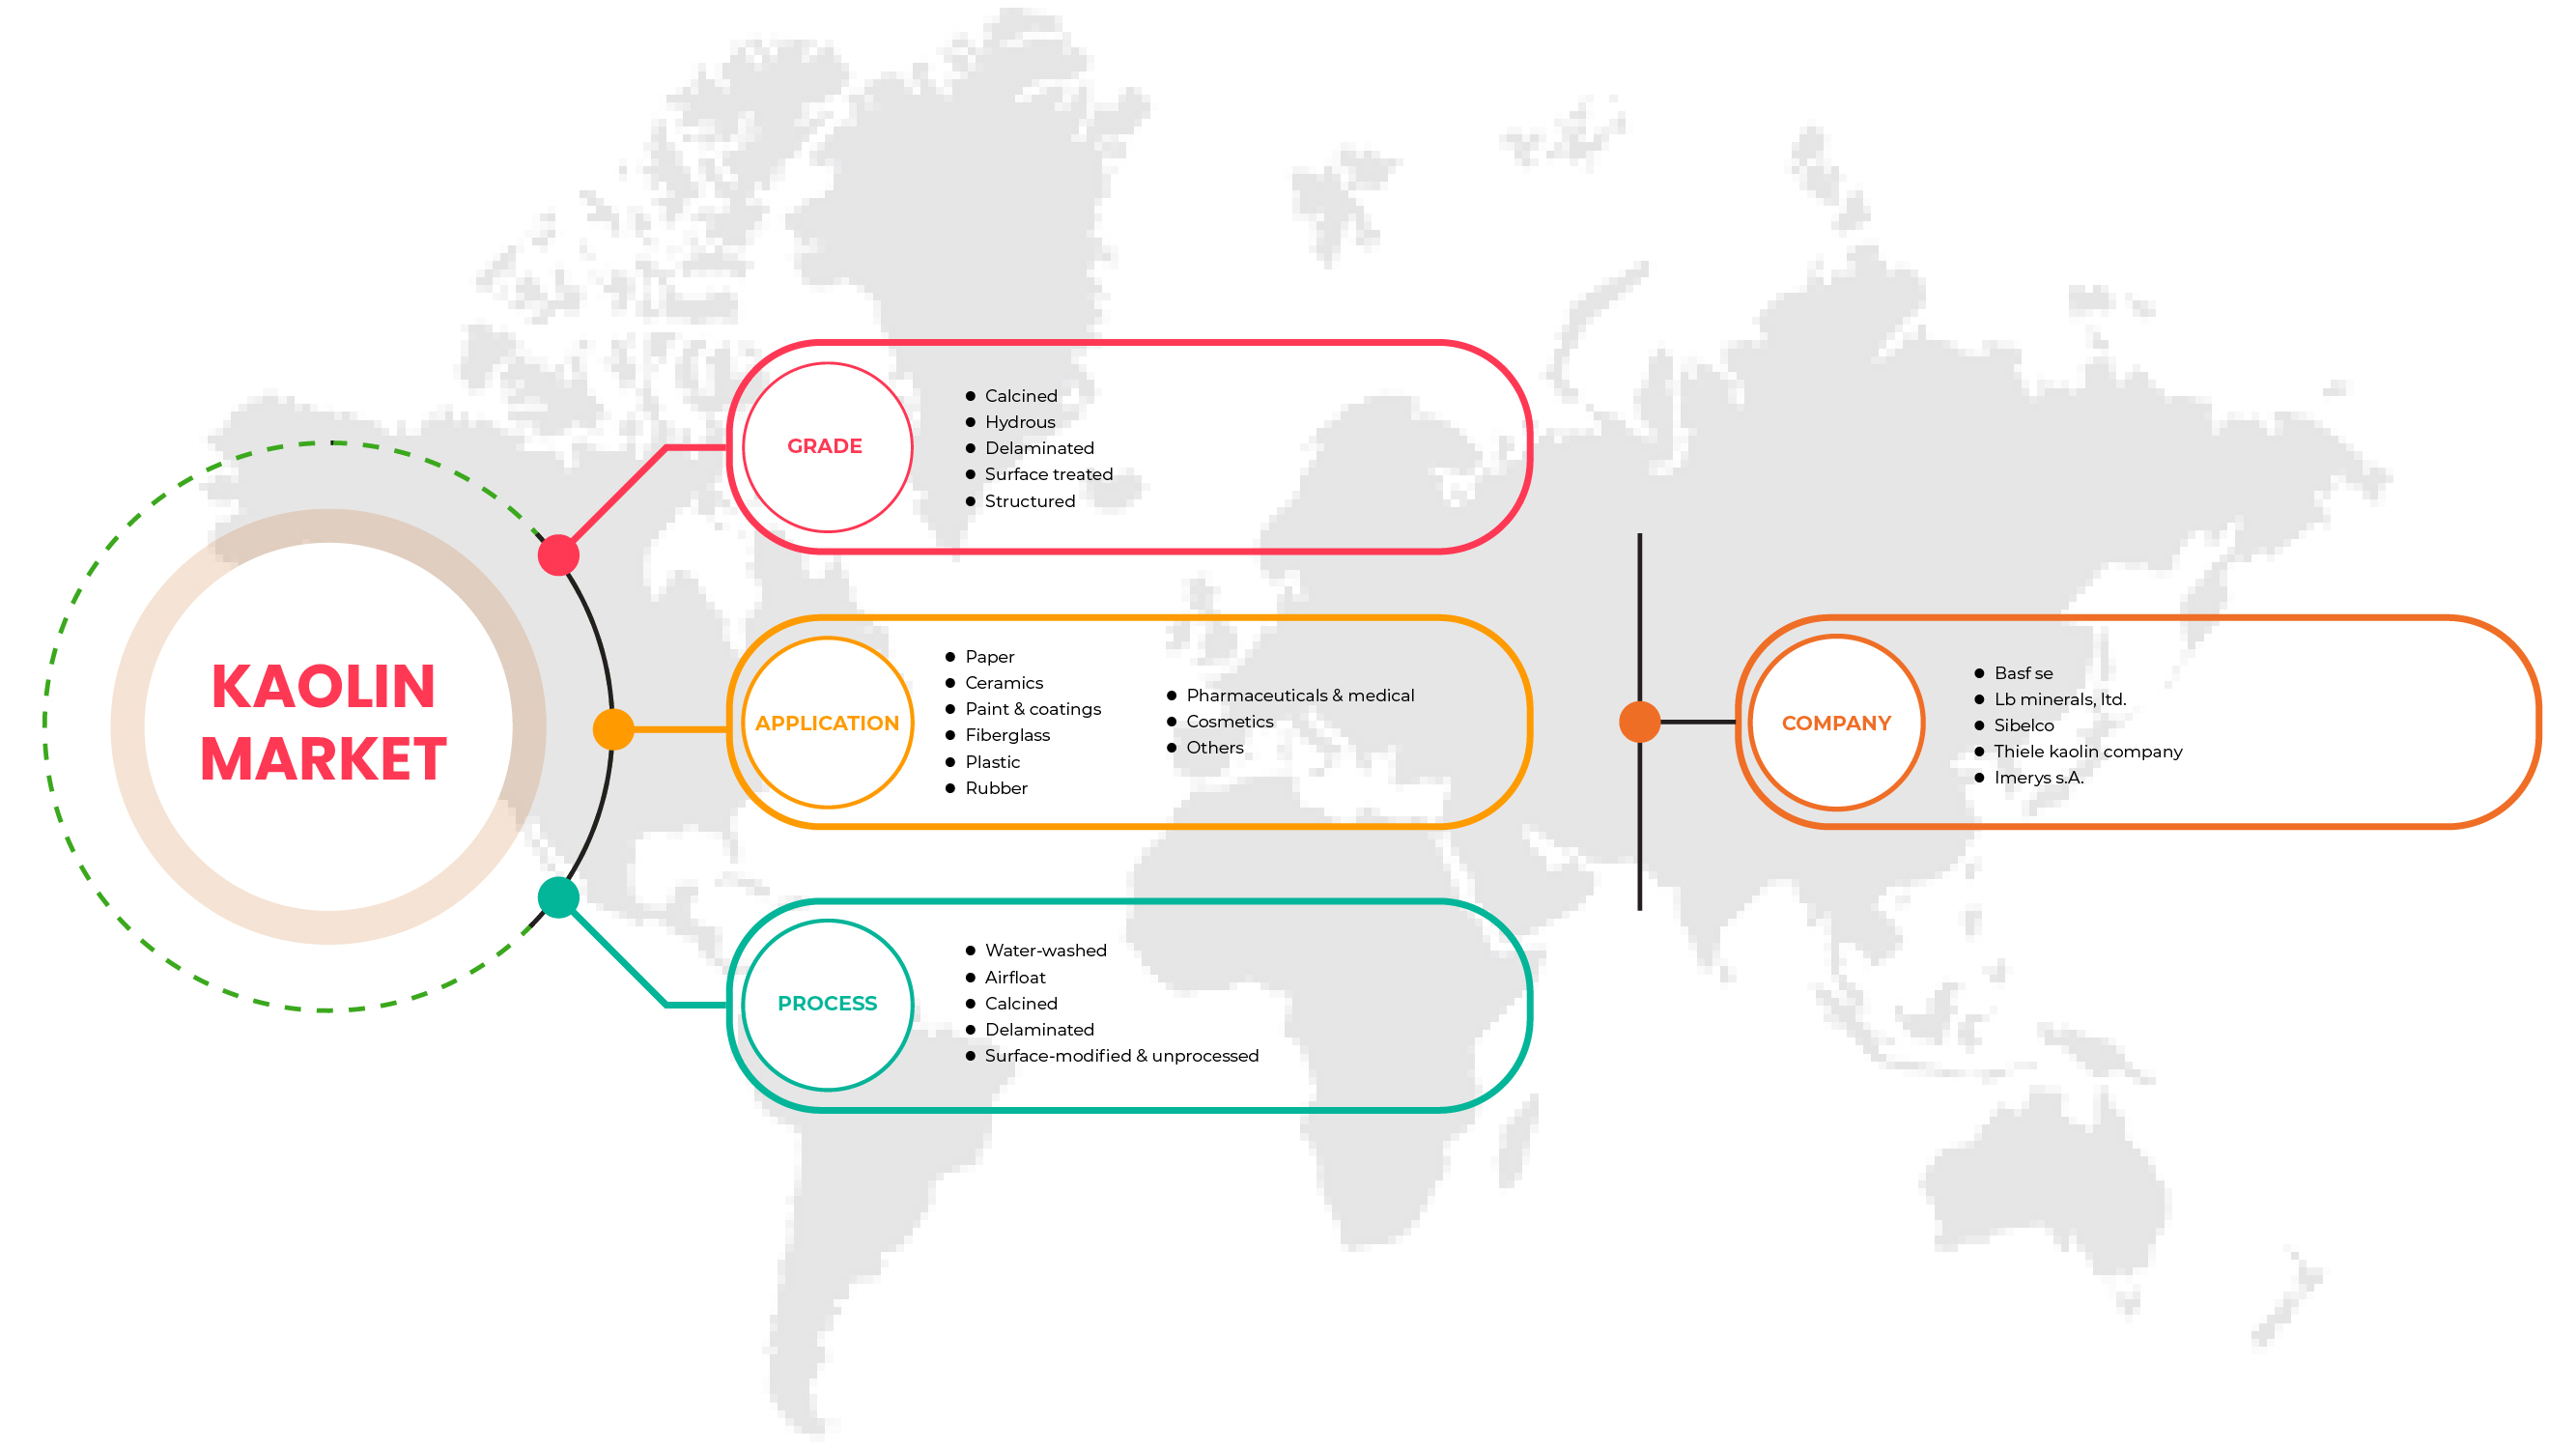
Sur la base de l'application, le marché européen du kaolin est classé en neuf segments papier, céramique, peinture et revêtements, fibre de verre, plastique, caoutchouc, produits pharmaceutiques et médicaux, cosmétiques, etc.
Europe Marché Kaolin Analyse régionale/Insights
Le marché du kaolin en Europe est segmenté en fonction du grade, du processus et de l'application.
Les pays du marché européen de Kaolin sont le Royaume-Uni, la Russie, la France, l'Espagne, l'Italie, l'Allemagne, la Turquie, les Pays-Bas, la Suisse, la Belgique et le reste de l'Europe. L'Allemagne domine le marché européen de Kaolin en termes de parts de marché et de revenus du marché en raison de la prise de conscience croissante des excellentes caractéristiques et propriétés de Kaolin dans la région.
La section de pays du rapport présente également les facteurs qui influent sur le marché et les modifications de la réglementation du marché qui influent sur les tendances actuelles et futures du marché. L'analyse de la chaîne de valeur en aval et en amont, les tendances technologiques, l'analyse des cinq forces du porteur et les études de cas sont quelques indicateurs utilisés pour prévoir le scénario du marché pour chaque pays. En outre, la présence et la disponibilité des marques européennes et les défis auxquels elles sont confrontées en raison de la concurrence importante ou rare des marques locales et nationales, de l'impact des tarifs intérieurs et des itinéraires commerciaux sont examinés tout en fournissant une analyse prévisionnelle des données nationales.
Paysage concurrentiel et Europe Kaolin Analyse des parts de marché
Le paysage concurrentiel du marché du kaolin en Europe fournit des détails par les concurrents. Les détails inclus sont l'aperçu de l'entreprise, les finances de l'entreprise, les revenus générés, le potentiel du marché, les investissements dans la recherche et le développement, les nouvelles initiatives du marché, les sites et installations de production, les points forts et les faiblesses de l'entreprise, le lancement de produits, les pipelines d'essais de produits, les approbations de produits, les brevets, la largeur et l'étendue du produit, la dominance de l'application, la courbe de survie technologique. Les données ci-dessus ne concernent que les entreprises qui se concentrent sur le marché européen du kaolin.
Voici quelques-uns des principaux acteurs du marché européen de Kaolin:
- Quartz Works GmbH
- LB MINERALS, Ltd.
- KAMIN LLC / CADAM
- Je ne sais pas.
- SIBELCO
- Groupe Ashapura
- Société Thiele Kaolin
- BASE SE
Méthodologie de recherche
La collecte des données et l'analyse de l'année de référence se font à l'aide de modules de collecte de données de grande taille. Les données du marché sont analysées et estimées à l'aide de modèles statistiques et cohérents du marché. De plus, l'analyse de la part de marché et l'analyse des tendances clés sont les principaux facteurs de succès du rapport sur le marché. La principale méthodologie de recherche utilisée par l'équipe de recherche DBMR est la triangulation des données qui implique l'extraction de données, l'analyse de l'impact des variables de données sur le marché et la validation primaire (expert de l'industrie). Les modèles de données comprennent les grilles de positionnement des fournisseurs, l'analyse de la ligne de temps du marché, l'aperçu et le guide du marché, les grilles de positionnement de l'entreprise, l'analyse des parts de marché de l'entreprise, les normes de mesure, l'analyse des parts de marché régionales et des fournisseurs d'Europe. Veuillez demander un appel d'analyste en cas d'enquête complémentaire.
SKU-
Accédez en ligne au rapport sur le premier cloud mondial de veille économique

- Tableau de bord d'analyse de données interactif
- Tableau de bord d'analyse d'entreprise pour les opportunités à fort potentiel de croissance
- Accès d'analyste de recherche pour la personnalisation et les requêtes
- Analyse de la concurrence avec tableau de bord interactif
- Dernières actualités, mises à jour et analyse des tendances
- Exploitez la puissance de l'analyse comparative pour un suivi complet de la concurrence
Table des matières
1 INTRODUCTION
1.1 OBJECTIFS DE L'ÉTUDE
1.2 DÉFINITION DU MARCHÉ
1.3 APERÇU DU MARCHÉ EUROPÉEN DU KAOLIN
1.4 LIMITATIONS
1,5 MARCHÉS COUVERTS
2 SEGMENTATION DU MARCHÉ
2.1 MARCHÉS COUVERTS
2.2 PORTÉE GÉOGRAPHIQUE
2,3 ANS CONSIDÉRÉS POUR L'ÉTUDE
2.4 MONNAIE ET TARIFS
2.5 MODÈLE DE VALIDATION DES DONNÉES DU TRÉPIED DBMR
2.6 COURBE DE VIE DU PRODUIT
2.7 MODÉLISATION MULTIVARIÉE
2.8 ENTRETIENS PRIMAIRES AVEC DES LEADERS D'OPINION CLÉS
2.9 GRILLE DE POSITIONNEMENT DU MARCHÉ DBMR
2.1 GRILLE DE COUVERTURE DES APPLICATIONS DU MARCHÉ
2.11 MATRICE DES DÉFIS DU MARCHÉ DBMR
2.12 ANALYSE DES PARTS DES FOURNISSEURS DBMR
2.13 DONNÉES D'IMPORTATION-EXPORTATION
2.14 SOURCES SECONDAIRES
2.15 HYPOTHÈSES
3 RÉSUMÉ EXÉCUTIF
4 INFORMATIONS PREMIUM
4.1 ANALYSE DU PILON
4.1.1 FACTEURS POLITIQUES
4.1.2 FACTEURS ÉCONOMIQUES
4.1.3 FACTEURS SOCIAUX
4.1.4 FACTEURS TECHNOLOGIQUES
4.1.5 FACTEURS JURIDIQUES
4.1.6 FACTEURS ENVIRONNEMENTAUX
4.2 LES CINQ FORCES DE PORTER :
4.2.1 MENACE DE NOUVEAUX ENTRANTS :
4.2.2 MENACE DE SUBSTITUTS :
4.2.3 POUVOIR DE NÉGOCIATION DU CLIENT :
4.2.4 POUVOIR DE NÉGOCIATION DES FOURNISSEURS :
4.2.5 CONCURRENCE INTERNE (RIVALITÉ) :
4.3 CRITÈRES DE SÉLECTION CRITIQUES POUR LES DÉCISIONS COMMERCIALES
4.4 SCÉNARIO D'IMPORTATION-EXPORTATION
4.5 PROCÉDÉ DE FABRICATION : MARCHÉ EUROPÉEN DU KAOLIN
4.6 ÉVOLUTION DU MARCHÉ / ÉVÉNEMENTS ACTUELS
4.7 CAPACITÉ DE PRODUCTION DES FABRICANTS : MARCHÉ EUROPÉEN DU KAOLIN
4.8 ANALYSE DE LA CHAÎNE D'APPROVISIONNEMENT - MARCHÉ EUROPÉEN DU KAOLIN
4.8.1 APERÇU
4.8.2 SCÉNARIO DE COÛTS LOGISTIQUES
4.8.3 IMPORTANCE DES PRESTATAIRES DE SERVICES LOGISTIQUES
4.9 APERÇU DES TECHNOLOGIES
4.1 CRITÈRES DE SÉLECTION DES FOURNISSEURS
4.11 SCÉNARIO D'ANALYSE DES PRIX
4.11.1 ANALYSE DES PRIX DES MATIÈRES PREMIÈRES
4.11.2 STATISTIQUES DES PRIX ACTUELS
4.11.3 PRÉVISIONS DE PRIX
4.12 ANALYSE DE LA PRODUCTION ET DE LA CONSOMMATION
4.13 COUVERTURE RÉGLEMENTAIRE
4.14 SCÉNARIO DE COÛTS DE FABRICATION ET IMPACT FUTUR
5 APERÇU DU MARCHÉ
5.1 PILOTES
5.1.1 HAUSSE DES ACTIVITÉS DE CONSTRUCTION À TRAVERS LE MONDE
5.1.2 PROPRIÉTÉS CHIMIQUES ET PHYSIQUES FAVORABLES DU KAOLIN
5.1.3 AUGMENTATION DE LA DEMANDE DE KAOLIN DE LA PART DE DIVERSES INDUSTRIES D'UTILISATION FINALE
5.1.4 FORTE ADOPTION DU KAOLIN COMME ADDITIF DE REVÊTEMENT
5.2 ERREUR ! RÉFÉRENCE HYPERLIEN NON VALIDE. RESTRICTIONS
5.2.1 EFFET NÉGATIF SUR L'INDUSTRIE PAPIER EN RAISON DE L'ÉMERGENCE DU COVID-19
5.2.2 L'EXPLOITATION MINIÈRE DU KAOLIN PROVOQUE DE NOMBREUX RISQUES POUR L'ENVIRONNEMENT ET LA SANTÉ
5.3 OPPORTUNITÉS
5.3.1 INITIATIVES STRATÉGIQUES CLÉS MIS EN ŒUVRE PAR DES ENTREPRISES DE PREMIER PLAN
5.3.2 TECHNOLOGIES AMÉLIORÉES DANS LES PRATIQUES MINIÈRES DU KAOLIN
5.4 DÉFIS
5.4.1 DISPONIBILITÉ FACILE DE SUBSTITUTS
5.4.2 HAUSSE DU PRIX DU KAOLIN
6 MARCHÉ EUROPÉEN DU KAOLIN, PAR QUALITÉ
6.1 APERÇU
6.2 CALCINÉ
6.3 HYDRE
6.4 DÉLAMINÉ
6.5 SURFACE TRAITÉE
6.6 STRUCTURÉ
7 MARCHÉ EUROPÉEN DU KAOLIN, PAR PROCÉDÉ
7.1 APERÇU
7.2 LAVAGE À L'EAU
7.3 AIRFLOAT
7.4 CALCINÉ
7.5 DÉLAMINÉ
7.6 SURFACE MODIFIÉE ET NON TRAITÉE
8 MARCHÉ EUROPÉEN DU KAOLIN, PAR APPLICATION
8.1 APERÇU
8.2 PAPIER
8.3 CÉRAMIQUE
8.4 PEINTURE ET REVÊTEMENTS
8,5 FIBRE DE VERRE
8.6 PLASTIQUE
8.7 CAOUTCHOUC
8.8 PRODUITS PHARMACEUTIQUES ET MÉDICAUX
8.9 COSMÉTIQUES
8.1 AUTRES
9 MARCHÉ EUROPÉEN DU KAOLIN, PAR RÉGION
9.1 EUROPE
9.1.1 ALLEMAGNE
9.1.2 Royaume-Uni
9.1.3 FRANCE
9.1.4 ITALIE
9.1.5 ESPAGNE
9.1.6 RUSSIE
9.1.7 SUISSE
9.1.8 TURQUIE
9.1.9 BELGIQUE
9.1.10 PAYS-BAS
9.1.11 RESTE DE L'EUROPE
10 MARCHÉ EUROPÉEN DU KAOLIN : PAYSAGE DES ENTREPRISES
10.1 ANALYSE DES ACTIONS DE L'ENTREPRISE : EUROPE
10.2 DÉSINVESTISSEMENT
10.3 AUGMENTATION DES PRIX
10.4 ACQUISITION
10.5 EXPANSION DES INSTALLATIONS
11 ANALYSE SWOT
12 PROFILS D'ENTREPRISE
12.1 IMERYS SA
12.1.1 INSTANTANÉ DE L'ENTREPRISE
12.1.2 ANALYSE DES REVENUS
12.1.3 ANALYSE DES ACTIONS DE L'ENTREPRISE
12.1.4 PORTEFEUILLE DE PRODUITS
12.1.5 ÉVOLUTION RÉCENTE
12.2 SIBELCO
12.2.1 INSTANTANÉ DE L'ENTREPRISE
12.2.2 ANALYSE DES REVENUS
12.2.3 ANALYSE DES ACTIONS DE L'ENTREPRISE
12.2.4 PORTEFEUILLE DE PRODUITS
12.2.5 ÉVOLUTION RÉCENTE
12.3 BASF SE
12.3.1 INSTANTANÉ DE L'ENTREPRISE
12.3.2 ANALYSE DES REVENUS
12.3.3 ANALYSE DES ACTIONS DE L'ENTREPRISE
12.3.4 PORTEFEUILLE DE PRODUITS
12.3.5 ÉVOLUTION RÉCENTE
12.4 KAMIN LLC. / CADAM
12.4.1 INSTANTANÉ DE L'ENTREPRISE
12.4.2 ANALYSE DES ACTIONS DE L'ENTREPRISE
12.4.3 PORTEFEUILLE DE PRODUITS
12.4.4 ÉVOLUTIONS RÉCENTES
12.5 SOCIÉTÉ DE KAOLIN THIELE
12.5.1 INSTANTANÉ DE L'ENTREPRISE
12.5.2 ANALYSE DES ACTIONS DE L'ENTREPRISE
12.5.3 PORTEFEUILLE DE PRODUITS
12.5.4 ÉVOLUTIONS RÉCENTES
12.6 GROUPE ASHAPURA
12.6.1 INSTANTANÉ DE L'ENTREPRISE
12.6.2 ANALYSE DES REVENUS
12.6.3 PORTEFEUILLE DE PRODUITS
12.6.4 ÉVOLUTIONS RÉCENTES
12,7 EICL
12.7.1 INSTANTANÉ DE L'ENTREPRISE
12.7.2 ANALYSE DES REVENUS
12.7.3 PORTEFEUILLE DE PRODUITS
12.7.4 ÉVOLUTIONS RÉCENTES
12,8 I-MINÉRAUXINC.
12.8.1 INSTANTANÉ DE L'ENTREPRISE
12.8.2 ANALYSE DES REVENUS
12.8.3 PORTEFEUILLE DE PRODUITS
12.8.4 ÉVOLUTIONS RÉCENTES
12,9 LB MINERALS, LTD.
12.9.1 INSTANTANÉ DE L'ENTREPRISE
12.9.2 PORTEFEUILLE DE PRODUITS
12.9.3 ÉVOLUTIONS RÉCENTES
12.1 QUARTZ WORKS GMBH
12.10.1 INSTANTANÉ DE L'ENTREPRISE
12.10.2 PORTEFEUILLE DE PRODUITS
12.10.3 ÉVOLUTIONS RÉCENTES
13 QUESTIONNAIRE
14 RAPPORTS CONNEXES
Liste des tableaux
TABLEAU 1 DONNÉES D'IMPORTATION DE KAOLIN ET AUTRES ARGILES KAOLINIQUES, CALCINÉES OU NON ; CODE SH – 2507 (MILLIERS USD)
TABLEAU 2 DONNÉES SUR LES EXPORTATIONS DE KAOLIN ET AUTRES ARGILES KAOLINIQUES, CALCINÉES OU NON ; CODE SH – 2507 (MILLIERS USD)
TABLEAU 3 LE TABLEAU SUIVANT MONTRE LES CAPACITÉS DE PRODUCTION DE DIFFÉRENTES SOCIÉTÉS OPÉRANT SUR LE MARCHÉ EUROPÉEN DU KAOLIN.
TABLEAU 4 CADRE RÉGLEMENTAIRE
TABLEAU 5 MARCHÉ EUROPÉEN DU KAOLIN, PAR QUALITÉ, 2020-2029 (EN MILLIONS USD)
TABLEAU 6 MARCHÉ EUROPÉEN DU KAOLIN, PAR QUALITÉ, 2020-2029 (KILO TONNES)
TABLEAU 7 MARCHÉ EUROPÉEN DU KAOLIN CALCINÉ, PAR RÉGION, 2020-2029 (EN MILLIONS USD)
TABLEAU 8 MARCHÉ EUROPEEN DU KAOLIN CALCINÉ, PAR RÉGION, 2020-2029 (KILO TONNES)
TABLEAU 9 MARCHÉ HYDRIQUE DU KAOLIN EN EUROPE, PAR RÉGION, 2020-2029 (EN MILLIONS USD)
TABLEAU 10 MARCHÉ HYDRIQUE DU KAOLIN EN EUROPE, PAR RÉGION, 2020-2029 (KILO TONNES)
TABLEAU 11 EUROPE DÉLAMINÉ SUR LE MARCHÉ EUROPÉEN DU KAOLIN, PAR RÉGION, 2020-2029 (EN MILLIONS USD)
TABLEAU 12 EUROPE DÉLAMINÉ SUR LE MARCHÉ EUROPÉEN DU KAOLIN, PAR RÉGION, 2020-2029 (KILO TONNES)
TABLEAU 13 SURFACES TRAITÉES SUR LE MARCHÉ EUROPÉEN DU KAOLIN, PAR RÉGION, 2020-2029 (EN MILLIONS USD)
TABLEAU 14 SURFACES TRAITÉES EN EUROPE SUR LE MARCHÉ EUROPÉEN DU KAOLIN, PAR RÉGION, 2020-2029 (KILO TONNES)
TABLEAU 15 MARCHÉ EUROPÉEN DU KAOLIN STRUCTURÉ EN EUROPE, PAR RÉGION, 2020-2029 (EN MILLIONS USD)
TABLEAU 16 MARCHÉ EUROPÉEN DU KAOLIN STRUCTURÉ EN EUROPE, PAR RÉGION, 2020-2029 (KILO TONNES)
TABLEAU 17 MARCHÉ EUROPÉEN DU KAOLIN, PAR PROCÉDÉ, 2020-2029 (EN MILLIONS USD)
TABLEAU 18 MARCHÉ EUROPÉEN DU KAOLIN, PAR QUALITÉ, 2020-2029 (KILO TONNES)
TABLEAU 19 MARCHÉ EUROPÉEN DU KAOLIN LAVÉ À L'EAU, PAR RÉGION, 2020-2029 (EN MILLIONS USD)
TABLEAU 20 MARCHÉ EUROPÉEN DU KAOLIN LAVÉ À L'EAU, PAR RÉGION, 2020-2029 (KILO TONNES)
TABLEAU 21 MARCHÉ EUROPÉEN DU KAOLIN PAR AIRFLOAT, PAR RÉGION, 2020-2029 (EN MILLIONS USD)
TABLEAU 22 MARCHÉ EUROPÉEN DU KAOLIN, PAR RÉGION, 2020-2029 (KILO TONNES)
TABLEAU 23 MARCHÉ EUROPÉEN DU KAOLIN CALCINÉ, PAR RÉGION, 2020-2029 (EN MILLIONS USD)
TABLEAU 24 MARCHÉ EUROPÉEN DU KAOLIN CALCINÉ, PAR RÉGION, 2020-2029 (KILO TONNES)
TABLEAU 25 EUROPE DÉLAMINÉ SUR LE MARCHÉ EUROPÉEN DU KAOLIN, PAR RÉGION, 2020-2029 (EN MILLIONS USD)
TABLEAU 26 EUROPE DÉLAMINÉ SUR LE MARCHÉ EUROPÉEN DU KAOLIN, PAR RÉGION, 2020-2029 (KILO TONNES)
TABLEAU 27 MARCHÉ EUROPÉEN DU KAOLIN MODIFIÉ EN SURFACE ET NON TRAITÉ, PAR RÉGION, 2020-2029 (EN MILLIONS USD)
TABLEAU 28 MARCHÉ EUROPÉEN DU KAOLIN MODIFIÉ EN SURFACE ET NON TRAITÉ, PAR RÉGION, 2020-2029 (KILO TONNES)
TABLEAU 29 MARCHÉ EUROPÉEN DU KAOLIN, PAR APPLICATION, 2020-2029 (EN MILLIONS USD)
TABLEAU 30 MARCHÉ EUROPÉEN DU KAOLIN, PAR APPLICATION, 2020-2029 (KILO TONNES)
TABLEAU 31 MARCHÉ EUROPÉEN DU PAPIER SUR LE KAOLIN, PAR RÉGION, 2020-2029 (EN MILLIONS USD)
TABLEAU 32 MARCHÉ EUROPÉEN DU PAPIER SUR LE KAOLIN, PAR RÉGION, 2020-2029 (KILO TONNES)
TABLEAU 33 CÉRAMIQUES EUROPÉENNES SUR LE MARCHÉ EUROPÉEN DU KAOLIN, PAR RÉGION, 2020-2029 (EN MILLIONS USD)
TABLEAU 34 CÉRAMIQUES EUROPÉENNES SUR LE MARCHÉ EUROPÉEN DU KAOLIN, PAR RÉGION, 2020-2029 (KILO TONNES)
TABLEAU 35 EUROPE PEINTURES ET REVÊTEMENTS SUR LE MARCHÉ EUROPÉEN DU KAOLIN, PAR RÉGION, 2020-2029 (EN MILLIONS USD)
TABLEAU 36 EUROPE PEINTURES ET REVÊTEMENTS SUR LE MARCHÉ EUROPÉEN DU KAOLIN, PAR RÉGION, 2020-2029 (KILO TONNES)
TABLEAU 37 FIBRE DE VERRE SUR LE MARCHÉ EUROPÉEN DU KAOLIN, PAR RÉGION, 2020-2029 (EN MILLIONS USD)
TABLEAU 38 FIBRE DE VERRE SUR LE MARCHÉ EUROPÉEN DU KAOLIN, PAR RÉGION, 2020-2029 (KILO TONNES)
TABLEAU 39 MARCHÉ EUROPÉEN DU PLASTIQUE SUR LE MARCHÉ EUROPÉEN DU KAOLIN, PAR RÉGION, 2020-2029 (EN MILLIONS USD)
TABLEAU 40 EUROPE PLASTIQUE SUR LE MARCHÉ EUROPÉEN DU KAOLIN, PAR RÉGION, 2020-2029 (KILO TONNES)
TABLEAU 41 CAOUTCHOUC EUROPÉEN SUR LE MARCHÉ EUROPÉEN DU KAOLIN, PAR RÉGION, 2020-2029 (EN MILLIONS USD)
TABLEAU 42 CAOUTCHOUC EUROPÉEN SUR LE MARCHÉ EUROPÉEN DU KAOLIN, PAR RÉGION, 2020-2029 (KILO TONNES)
TABLEAU 43 MARCHÉ EUROPÉEN DU KAOLIN, PAR RÉGION, 2020-2029 (EN MILLIONS USD)
TABLEAU 44 MARCHÉ EUROPÉEN DU KAOLIN, PAR RÉGION, 2020-2029 (KILO TONNES)
TABLEAU 45 COSMÉTIQUES EUROPÉENS SUR LE MARCHÉ EUROPÉEN DU KAOLIN, PAR RÉGION, 2020-2029 (EN MILLIONS USD)
TABLEAU 46 COSMÉTIQUES EUROPÉENS SUR LE MARCHÉ EUROPÉEN DU KAOLIN, PAR RÉGION, 2020-2029 (KILO TONNES)
TABLEAU 47 EUROPE AUTRES MARCHÉS DU KAOLIN EN EUROPE, PAR RÉGION, 2020-2029 (EN MILLIONS USD)
TABLEAU 48 MARCHÉ DU KAOLIN EN EUROPE, PAR RÉGION, 2020-2029 (KILO TONNES)
TABLEAU 49 MARCHÉ EUROPÉEN DU KAOLIN, PAR PAYS, 2020-2029 (EN MILLIONS USD)
TABLEAU 50 MARCHÉ EUROPÉEN DU KAOLIN, PAR PAYS, 2020-2029 (KILO TONNES)
TABLEAU 51 MARCHÉ EUROPÉEN DU KAOLIN, PAR QUALITÉ, 2020-2029 (EN MILLIONS USD)
TABLEAU 52 MARCHÉ EUROPÉEN DU KAOLIN, PAR QUALITÉ, 2020-2029 (KILO TONNES)
TABLEAU 53 MARCHÉ EUROPÉEN DU KAOLIN, PAR PROCÉDÉ, 2020-2029 (EN MILLIONS USD)
TABLEAU 54 MARCHÉ EUROPÉEN DU KAOLIN, PAR PROCÉDÉ, 2020-2029 (KILO TONNES)
TABLEAU 55 MARCHÉ EUROPÉEN DU KAOLIN, PAR APPLICATION, 2020-2029 (EN MILLIONS USD)
TABLEAU 56 MARCHÉ EUROPÉEN DU KAOLIN, PAR APPLICATION, 2020-2029 (KILO TONNES)
TABLEAU 57 MARCHÉ DU KAOLIN EN ALLEMAGNE, PAR QUALITÉ, 2020-2029 (EN MILLIONS USD)
TABLEAU 58 MARCHÉ DU KAOLIN EN ALLEMAGNE, PAR QUALITÉ, 2020-2029 (KILO TONNES)
TABLEAU 59 MARCHÉ DU KAOLIN EN ALLEMAGNE, PAR PROCÉDÉ, 2020-2029 (EN MILLIONS USD)
TABLEAU 60 MARCHÉ DU KAOLIN EN ALLEMAGNE, PAR PROCÉDÉ, 2020-2029 (KILO TONNES)
TABLEAU 61 MARCHÉ DU KAOLIN EN ALLEMAGNE, PAR APPLICATION, 2020-2029 (EN MILLIONS USD)
TABLEAU 62 MARCHÉ DU KAOLIN EN ALLEMAGNE, PAR APPLICATION, 2020-2029 (KILO TONNES)
TABLEAU 63 MARCHÉ DU KAOLIN AU ROYAUME-UNI, PAR QUALITÉ, 2020-2029 (EN MILLIONS USD)
TABLEAU 64 MARCHÉ DU KAOLIN AU ROYAUME-UNI, PAR QUALITÉ, 2020-2029 (KILO TONNES)
TABLEAU 65 MARCHÉ DU KAOLIN AU ROYAUME-UNI, PAR PROCÉDÉ, 2020-2029 (EN MILLIONS USD)
TABLEAU 66 MARCHÉ DU KAOLIN AU ROYAUME-UNI, PAR PROCÉDÉ, 2020-2029 (KILO TONNES)
TABLEAU 67 MARCHÉ DU KAOLIN AU ROYAUME-UNI, PAR APPLICATION, 2020-2029 (EN MILLIONS USD)
TABLEAU 68 MARCHÉ DU KAOLIN AU ROYAUME-UNI, PAR APPLICATION, 2020-2029 (KILO TONNES)
TABLEAU 69 MARCHÉ DU KAOLIN EN FRANCE, PAR QUALITÉ, 2020-2029 (EN MILLIONS USD)
TABLEAU 70 MARCHÉ DU KAOLIN EN FRANCE, PAR QUALITÉ, 2020-2029 (KILO TONNES)
TABLEAU 71 MARCHÉ DU KAOLIN EN FRANCE, PAR PROCÉDÉ, 2020-2029 (EN MILLIONS USD)
TABLEAU 72 MARCHÉ DU KAOLIN EN FRANCE, PAR PROCÉDÉ, 2020-2029 (KILO TONNES)
TABLEAU 73 MARCHÉ DU KAOLIN EN FRANCE, PAR APPLICATION, 2020-2029 (EN MILLIONS USD)
TABLEAU 74 MARCHÉ DU KAOLIN EN FRANCE, PAR APPLICATION, 2020-2029 (KILO TONNES)
TABLEAU 75 MARCHÉ DU KAOLIN EN ITALIE, PAR QUALITÉ, 2020-2029 (EN MILLIONS USD)
TABLEAU 76 MARCHÉ DU KAOLIN EN ITALIE, PAR QUALITÉ, 2020-2029 (KILO TONNES)
TABLEAU 77 MARCHÉ ITALIEN DU KAOLIN, PAR PROCÉDÉ, 2020-2029 (EN MILLIONS USD)
TABLEAU 78 MARCHÉ DU KAOLIN EN ITALIE, PAR PROCÉDÉ, 2020-2029 (KILO TONNES)
TABLEAU 79 MARCHÉ ITALIEN DU KAOLIN, PAR APPLICATION, 2020-2029 (EN MILLIONS USD)
TABLEAU 80 MARCHÉ DU KAOLIN EN ITALIE, PAR APPLICATION, 2020-2029 (KILO TONNES)
TABLEAU 81 MARCHÉ DU KAOLIN EN ESPAGNE, PAR QUALITÉ, 2020-2029 (EN MILLIONS USD)
TABLEAU 82 MARCHÉ DU KAOLIN EN ESPAGNE, PAR QUALITÉ, 2020-2029 (KILO TONNES)
TABLEAU 83 MARCHÉ DU KAOLIN EN ESPAGNE, PAR PROCÉDÉ, 2020-2029 (EN MILLIONS USD)
TABLEAU 84 MARCHÉ DU KAOLIN EN ESPAGNE, PAR PROCÉDÉ, 2020-2029 (KILO TONNES)
TABLEAU 85 MARCHÉ DU KAOLIN EN ESPAGNE, PAR APPLICATION, 2020-2029 (EN MILLIONS USD)
TABLEAU 86 MARCHÉ DU KAOLIN EN ESPAGNE, PAR APPLICATION, 2020-2029 (KILO TONNES)
TABLEAU 87 MARCHÉ RUSSE DU KAOLIN, PAR QUALITÉ, 2020-2029 (EN MILLIONS USD)
TABLEAU 88 MARCHÉ RUSSE DU KAOLIN, PAR QUALITÉ, 2020-2029 (KILO TONNES)
TABLEAU 89 MARCHÉ RUSSE DU KAOLIN, PAR PROCÉDÉ, 2020-2029 (EN MILLIONS USD)
TABLEAU 90 MARCHÉ RUSSE DU KAOLIN, PAR PROCÉDÉ, 2020-2029 (KILO TONNES)
TABLEAU 91 MARCHÉ RUSSE DU KAOLIN, PAR APPLICATION, 2020-2029 (EN MILLIONS USD)
TABLEAU 92 MARCHÉ RUSSE DU KAOLIN, PAR APPLICATION, 2020-2029 (KILO TONNES)
TABLEAU 93 MARCHÉ SUISSE DU KAOLIN, PAR QUALITÉ, 2020-2029 (EN MILLIONS USD)
TABLEAU 94 MARCHÉ DU KAOLIN SUISSE, PAR QUALITÉ, 2020-2029 (KILO TONNES)
TABLEAU 95 MARCHÉ SUISSE DU KAOLIN, PAR PROCÉDÉ, 2020-2029 (EN MILLIONS USD)
TABLEAU 96 MARCHÉ SUISSE DU KAOLIN, PAR PROCÉDÉ, 2020-2029 (KILO TONNES)
TABLEAU 97 MARCHÉ SUISSE DU KAOLIN, PAR APPLICATION, 2020-2029 (EN MILLIONS USD)
TABLEAU 98 MARCHÉ SUISSE DU KAOLIN, PAR APPLICATION, 2020-2029 (KILO TONNES)
TABLEAU 99 MARCHÉ DU KAOLIN EN TURQUIE, PAR QUALITÉ, 2020-2029 (EN MILLIONS USD)
TABLEAU 100 MARCHÉ DU KAOLIN EN TURQUIE, PAR QUALITÉ, 2020-2029 (KILO TONNES)
TABLEAU 101 MARCHÉ DU KAOLIN EN TURQUIE, PAR PROCÉDÉ, 2020-2029 (EN MILLIONS USD)
TABLEAU 102 MARCHÉ DU KAOLIN EN TURQUIE, PAR PROCÉDÉ, 2020-2029 (KILO TONNES)
TABLEAU 103 MARCHÉ DU KAOLIN EN TURQUIE, PAR APPLICATION, 2020-2029 (EN MILLIONS USD)
TABLEAU 104 MARCHÉ DU KAOLIN EN TURQUIE, PAR APPLICATION, 2020-2029 (KILO TONNES)
TABLEAU 105 MARCHÉ DU KAOLIN EN BELGIQUE, PAR QUALITE, 2020-2029 (EN MILLIONS USD)
TABLEAU 106 MARCHÉ DU KAOLIN EN BELGIQUE, PAR QUALITÉ, 2020-2029 (KILO TONNES)
TABLEAU 107 MARCHÉ DU KAOLIN EN BELGIQUE, PAR PROCÉDÉ, 2020-2029 (EN MILLIONS USD)
TABLEAU 108 MARCHÉ DU KAOLIN EN BELGIQUE, PAR PROCÉDÉ, 2020-2029 (KILO TONNES)
TABLEAU 109 MARCHÉ DU KAOLIN EN BELGIQUE, PAR APPLICATION, 2020-2029 (EN MILLIONS USD)
TABLEAU 110 MARCHÉ DU KAOLIN EN BELGIQUE, PAR APPLICATION, 2020-2029 (KILO TONNES)
TABLEAU 111 MARCHÉ DU KAOLIN AUX PAYS-BAS, PAR QUALITÉ, 2020-2029 (EN MILLIONS USD)
TABLEAU 112 MARCHÉ DU KAOLIN AUX PAYS-BAS, PAR QUALITÉ, 2020-2029 (KILO TONNES)
TABLEAU 113 MARCHÉ DU KAOLIN AUX PAYS-BAS, PAR PROCÉDÉ, 2020-2029 (EN MILLIONS USD)
TABLEAU 114 MARCHÉ DU KAOLIN AUX PAYS-BAS, PAR PROCÉDÉ, 2020-2029 (KILO TONNES)
TABLEAU 115 MARCHÉ DU KAOLIN AUX PAYS-BAS, PAR APPLICATION, 2020-2029 (EN MILLIONS USD)
TABLEAU 116 MARCHÉ DU KAOLIN AUX PAYS-BAS, PAR APPLICATION, 2020-2029 (KILO TONNES)
TABLEAU 117 MARCHÉ DU KAOLIN DANS LE RESTE DE L'EUROPE, PAR QUALITÉ, 2020-2029 (EN MILLIONS USD)
TABLEAU 118 MARCHÉ DU KAOLIN DANS LE RESTE DE L'EUROPE, PAR QUALITÉ, 2020-2029 (KILO TONNES)
Liste des figures
FIGURE 1 MARCHÉ EUROPÉEN DU KAOLIN
FIGURE 2 MARCHÉ EUROPÉEN DU KAOLIN : TRIANGULATION DES DONNÉES
FIGURE 3 MARCHÉ EUROPÉEN DU KAOLIN : ANALYSE DROC
FIGURE 4 MARCHÉ EUROPÉEN DU KAOLIN : ANALYSE DU MARCHÉ EUROPÉEN ET RÉGIONAL
FIGURE 5 MARCHÉ EUROPÉEN DU KAOLIN : ANALYSE DE LA RECHERCHE DES ENTREPRISES
FIGURE 6 MARCHÉ EUROPÉEN DU KAOLIN : COURBE DE DURÉE DE VIE DU PRODUIT
FIGURE 7 MARCHÉ EUROPÉEN DU KAOLIN : MODÉLISATION MULTIVARIÉE
FIGURE 8 MARCHÉ EUROPÉEN DU KAOLIN : DÉMOGRAPHIE DES ENTRETIENS
FIGURE 9 MARCHÉ EUROPÉEN DU KAOLIN : GRILLE DE POSITIONNEMENT DU MARCHÉ DBMR
FIGURE 10 MARCHÉ EUROPÉEN DU KAOLIN : GRILLE DE COUVERTURE DES APPLICATIONS DU MARCHÉ
FIGURE 11 MARCHÉ EUROPÉEN DU KAOLIN : LA MATRICE DES DÉFIS DU MARCHÉ
FIGURE 12 MARCHÉ EUROPÉEN DU KAOLIN : ANALYSE DES PARTS DE FOURNISSEURS
FIGURE 13 MARCHÉ EUROPÉEN DU KAOLIN : SEGMENTATION
FIGURE 14 L'AUGMENTATION DES ACTIVITÉS DE CONSTRUCTION À TRAVERS LE MONDE DEVRAIT DYNAMISER LE MARCHÉ EUROPÉEN DU KAOLIN AU COURS DE LA PÉRIODE DE PRÉVISION
FIGURE 15 LE SEGMENT CALCINÉ DEVRAIT REPRÉSENTER LA PLUS GRANDE PART DU MARCHÉ EUROPÉEN DU KAOLIN EN 2022 ET 2029
FIGURE 16 SCÉNARIO D'IMPORTATION-EXPORTATION (EN MILLIERS USD)
FIGURE 17 STATISTIQUES DES PRIX ACTUELS (PAR KG)
FIGURE 18 PRÉVISIONS DE PRIX (PAR KG)
FIGURE 19 ANALYSE DE LA PRODUCTION ET DE LA CONSOMMATION
FIGURE 20 MOTEURS, CONTRAINTES, OPPORTUNITÉS ET DÉFIS DU MARCHÉ EUROPÉEN DU KAOLIN
FIGURE 21 MARCHÉ EUROPÉEN DU KAOLIN : PAR QUALITÉ, 2021
FIGURE 22 MARCHÉ EUROPÉEN DU KAOLIN : PAR PROCÉDÉ, 2021
FIGURE 23 MARCHÉ EUROPÉEN DU KAOLIN : PAR APPLICATION, 2021
FIGURE 24 MARCHÉ EUROPÉEN DU KAOLIN : INSTANTANÉ (2021)
FIGURE 25 MARCHÉ EUROPÉEN DU KAOLIN : PAR PAYS (2021)
FIGURE 26 MARCHÉ EUROPÉEN DU KAOLIN : PAR PAYS (2022 et 2029)
FIGURE 27 MARCHÉ EUROPÉEN DU KAOLIN : PAR PAYS (2021 & 2029)
FIGURE 28 MARCHÉ EUROPÉEN DU KAOLIN : PAR QUALITÉ (2022-2029)
FIGURE 29 MARCHÉ EUROPÉEN DU KAOLIN : PART DE L'ENTREPRISE 2021 (%)
Méthodologie de recherche
La collecte de données et l'analyse de l'année de base sont effectuées à l'aide de modules de collecte de données avec des échantillons de grande taille. L'étape consiste à obtenir des informations sur le marché ou des données connexes via diverses sources et stratégies. Elle comprend l'examen et la planification à l'avance de toutes les données acquises dans le passé. Elle englobe également l'examen des incohérences d'informations observées dans différentes sources d'informations. Les données de marché sont analysées et estimées à l'aide de modèles statistiques et cohérents de marché. De plus, l'analyse des parts de marché et l'analyse des tendances clés sont les principaux facteurs de succès du rapport de marché. Pour en savoir plus, veuillez demander un appel d'analyste ou déposer votre demande.
La méthodologie de recherche clé utilisée par l'équipe de recherche DBMR est la triangulation des données qui implique l'exploration de données, l'analyse de l'impact des variables de données sur le marché et la validation primaire (expert du secteur). Les modèles de données incluent la grille de positionnement des fournisseurs, l'analyse de la chronologie du marché, l'aperçu et le guide du marché, la grille de positionnement des entreprises, l'analyse des brevets, l'analyse des prix, l'analyse des parts de marché des entreprises, les normes de mesure, l'analyse globale par rapport à l'analyse régionale et des parts des fournisseurs. Pour en savoir plus sur la méthodologie de recherche, envoyez une demande pour parler à nos experts du secteur.
Personnalisation disponible
Data Bridge Market Research est un leader de la recherche formative avancée. Nous sommes fiers de fournir à nos clients existants et nouveaux des données et des analyses qui correspondent à leurs objectifs. Le rapport peut être personnalisé pour inclure une analyse des tendances des prix des marques cibles, une compréhension du marché pour d'autres pays (demandez la liste des pays), des données sur les résultats des essais cliniques, une revue de la littérature, une analyse du marché des produits remis à neuf et de la base de produits. L'analyse du marché des concurrents cibles peut être analysée à partir d'une analyse basée sur la technologie jusqu'à des stratégies de portefeuille de marché. Nous pouvons ajouter autant de concurrents que vous le souhaitez, dans le format et le style de données que vous recherchez. Notre équipe d'analystes peut également vous fournir des données sous forme de fichiers Excel bruts, de tableaux croisés dynamiques (Fact book) ou peut vous aider à créer des présentations à partir des ensembles de données disponibles dans le rapport.

