Global Metabolomics Services Market
Taille du marché en milliards USD
TCAC :
% 
 USD
3.97 Billion
USD
9.22 Billion
2025
2033
USD
3.97 Billion
USD
9.22 Billion
2025
2033
| 2026 –2033 | |
| USD 3.97 Billion | |
| USD 9.22 Billion | |
| % | |
|
Segmentation du marché mondial des services de métabolomique, par produit et service (chromatographie, services de bioinformatique métabolomique, spectrométrie de masse, services de séparation et de détection), type d'échantillon (urine, tumeur, milieux de culture cellulaire, sang total, ingrédients alimentaires, plantes et autres), source d'échantillon (humain, animal et autres), utilisateur final (industrie médicale, industrie agricole, industrie agroalimentaire et autres) - Tendances et prévisions du secteur jusqu'en 2033
Taille du marché des services de métabolomique
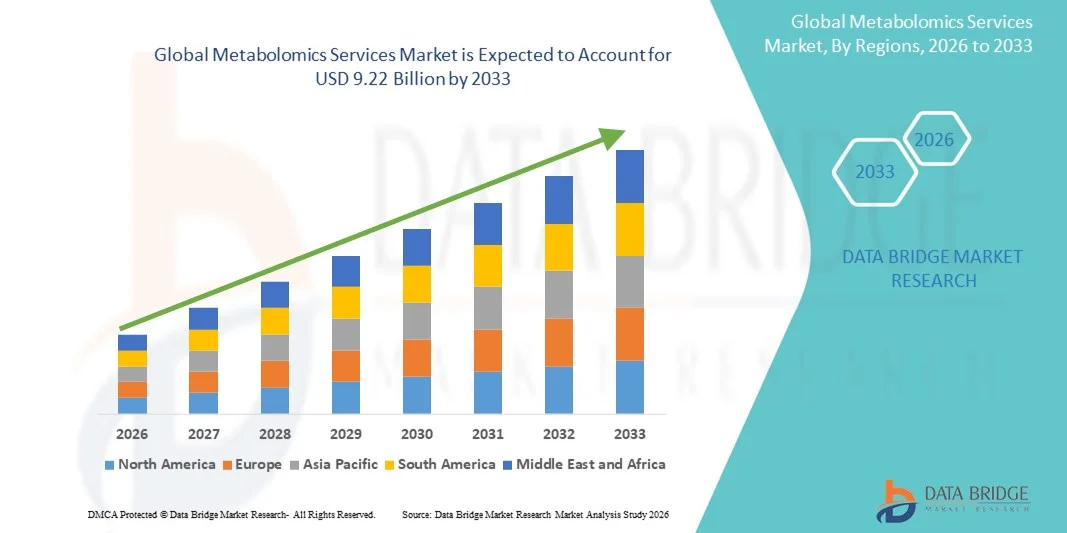
- Le marché mondial des services de métabolomique était évalué à 3,97 milliards de dollars américains en 2025 et devrait atteindre 9,22 milliards de dollars américains d'ici 2033 , avec un TCAC de 11,12 % au cours de la période de prévision.
- La croissance du marché est largement tirée par l'adoption croissante des technologies omiques avancées dans la recherche en sciences de la vie et les soins de santé, conjuguée aux progrès technologiques rapides des plateformes analytiques telles que la spectrométrie de masse, la résonance magnétique nucléaire (RMN) et la bioinformatique. Ces avancées permettent un profilage métabolique plus précis, à haut débit et plus rentable dans les milieux de la recherche académique, pharmaceutique et clinique.
- De plus, la demande croissante en médecine personnalisée, en découverte de biomarqueurs et en analyse des voies pathologiques positionne les services de métabolomique comme un élément essentiel du développement moderne de médicaments, du diagnostic et de la recherche translationnelle. L'intégration croissante de la métabolomique à la génomique et à la protéomique, ainsi que l'expansion de ses applications en oncologie, en neurologie et dans les troubles métaboliques, accélèrent l'adoption des services de métabolomique, stimulant ainsi significativement la croissance globale du marché.
Analyse du marché des services de métabolomique
- Les services de métabolomique, qui englobent l'analyse complète des métabolites dans des échantillons biologiques à l'aide de techniques avancées telles que la spectrométrie de masse (SM) et la résonance magnétique nucléaire (RMN), sont de plus en plus essentiels dans la recherche biomédicale moderne, la découverte de médicaments et la médecine personnalisée en raison de leur capacité à fournir des informations approfondies sur les mécanismes des maladies, l'identification des biomarqueurs et les réponses thérapeutiques.
- La demande croissante de services de métabolomique est principalement alimentée par l'adoption grandissante de la médecine de précision, l'augmentation des investissements dans la recherche pharmaceutique et biotechnologique , et le besoin accru de détection précoce des maladies et de découverte de biomarqueurs. L'intégration d'approches multi-omiques, notamment la génomique et la protéomique, renforce encore l'utilité et l'adoption des plateformes de métabolomique.
- L'Amérique du Nord a dominé le marché des services de métabolomique en 2025, représentant la plus grande part de revenus (environ 39,8 %). Cette domination s'explique par une infrastructure de santé solide, des investissements importants en R&D et la présence de prestataires de services et d'instituts de recherche de premier plan. Les États-Unis ont concentré la majeure partie de la demande régionale, portée par les applications dans le développement de médicaments, les essais cliniques et la découverte de biomarqueurs.
- La région Asie-Pacifique devrait connaître la croissance la plus rapide sur le marché des services de métabolomique au cours de la période de prévision, avec un TCAC supérieur à celui des autres régions, en raison de l'augmentation des investissements dans la recherche en biotechnologie, de la hausse des dépenses de santé et du développement des activités de recherche pharmaceutique et universitaire dans des pays comme la Chine, le Japon et l'Inde.
- Le segment des sources d'échantillons humains a dominé le marché avec une part de revenus de 48,2 % en 2025, grâce à l'utilisation croissante de la métabolomique dans le diagnostic clinique, la découverte de biomarqueurs de maladies, les études nutritionnelles et la médecine personnalisée.
Portée du rapport et segmentation du marché des services de métabolomique
|
Attributs |
Principaux enseignements du marché des services de métabolomique |
|
Segments couverts |
|
|
Pays couverts |
Amérique du Nord
Europe
Asie-Pacifique
Moyen-Orient et Afrique
Amérique du Sud
|
|
Acteurs clés du marché |
• Syneos Health (États-Unis) |
|
Opportunités de marché |
|
|
Ensembles d'informations de données à valeur ajoutée |
En plus des informations sur les scénarios de marché tels que la valeur du marché, le taux de croissance, la segmentation, la couverture géographique et les principaux acteurs, les rapports de marché élaborés par Data Bridge Market Research comprennent également une analyse approfondie par des experts, l'épidémiologie des patients, l'analyse du pipeline, l'analyse des prix et le cadre réglementaire. |
Tendances du marché des services de métabolomique
Adoption croissante des techniques de métabolomique avancées
- L'adoption croissante des techniques métabolomiques avancées pour la découverte exhaustive de biomarqueurs, la médecine personnalisée et la recherche en biologie des systèmes constitue une tendance majeure et en pleine accélération sur le marché mondial des services de métabolomique. Chercheurs et entreprises pharmaceutiques exploitent de plus en plus la métabolomique pour analyser les métabolites de petites molécules, comprendre les mécanismes pathologiques et identifier des cibles thérapeutiques.
- Par exemple, en 2024, plusieurs organismes de recherche sous contrat (CRO) de premier plan ont introduit des plateformes de métabolomique à haut débit basées sur la LC-MS et la RMN afin d'améliorer leurs capacités analytiques pour la découverte de médicaments et les applications de médecine de précision.
- L'intégration croissante de la métabolomique à la génomique, à la protéomique et à la bioinformatique permet une compréhension plus globale des voies biologiques, soutenant ainsi la tendance aux études multi-omiques dans la recherche académique et clinique.
- La demande croissante de diagnostics non invasifs, de recherches en nutrition et de profilage métabolique dans les essais cliniques stimule davantage l'utilisation des services de métabolomique dans les secteurs pharmaceutique, biotechnologique et de la santé.
- De plus, le développement d'outils d'analyse de données basés sur le nuage et de flux de travail standardisés améliore l'accessibilité et la reproductibilité des études métabolomiques, favorisant une adoption plus large dans les laboratoires et les institutions de recherche.
- Cette tendance vers une analyse métabolique complète et à haute résolution transforme les stratégies de recherche et permet une prise de décision plus rapide et plus précise dans le développement de médicaments et les soins de santé personnalisés.
Dynamique du marché des services de métabolomique
Conducteur
Coût élevé des services et complexité technique
- Le besoin croissant de médecine de précision , de thérapies personnalisées et de découverte de biomarqueurs avancés est un moteur essentiel du marché mondial des services de métabolomique. Les organisations utilisent la métabolomique pour identifier les indicateurs précoces de maladies, optimiser l'efficacité des médicaments et suivre la réponse des patients, ce qui stimule la demande de services analytiques spécialisés.
- Par exemple, en 2025, une entreprise pharmaceutique de premier plan a collaboré avec une CRO spécialisée en métabolomique afin d'accélérer l'identification de biomarqueurs pour les troubles métaboliques, démontrant ainsi le rôle crucial de la métabolomique dans le développement ciblé de médicaments.
- De plus, la croissance rapide des secteurs de la biotechnologie et de la pharmacie, conjuguée à l'augmentation des investissements en R&D, alimente la demande de services de métabolomique à haut débit et rentables.
- La tendance à la nutrition personnalisée, au profilage métabolique dans les diagnostics cliniques et à la recherche axée sur le mode de vie élargit le potentiel du marché dans les secteurs de la santé et du bien-être.
- De plus, les initiatives gouvernementales et les programmes de financement soutenant la recherche en omique et le dépistage précoce des maladies encouragent davantage l'adoption des technologies et des services de métabolomique à l'échelle mondiale.
Retenue/Défi
Préoccupations liées à la cybersécurité et aux coûts initiaux élevés
- Malgré son potentiel, le coût élevé et la complexité technique des services de métabolomique demeurent des obstacles importants à leur adoption généralisée, notamment auprès des petits laboratoires et des jeunes entreprises de biotechnologie. Les analyses métabolomiques nécessitent un appareillage spécialisé, du personnel qualifié et une interprétation sophistiquée des données, ce qui peut en limiter l'accessibilité.
- Par exemple, certains établissements universitaires des régions en développement peinent à mettre en œuvre des flux de travail métabolomiques basés sur la RMN et la LC-MS en raison de budgets et d'expertise technique limités.
- La variabilité dans la préparation des échantillons, l'absence de protocoles standardisés et la complexité de l'analyse des données peuvent également entraîner des incohérences et limiter la reproductibilité, constituant ainsi des obstacles à une mise en œuvre plus large dans les contextes cliniques et de recherche.
- De plus, les exigences réglementaires et d'assurance qualité relatives aux diagnostics métabolomiques et à la validation des biomarqueurs peuvent accroître les coûts opérationnels et ralentir l'adoption dans certaines régions.
- Relever ces défis grâce à l'automatisation, l'optimisation des coûts, la standardisation des flux de travail et les programmes de formation est essentiel pour assurer une croissance durable du marché mondial des services de métabolomique.
Étendue du marché des services de métabolomique
Le marché est segmenté en fonction du produit et du service, du type d'échantillon, de la source de l'échantillon et de l'utilisateur final.
- Par produit et service
Le marché des services de métabolomique est segmenté, selon les produits et services proposés, en chromatographie, services de bioinformatique métabolomique, spectrométrie de masse et services de séparation et de détection. En 2025, le segment de la spectrométrie de masse représentait la plus grande part de marché (45,8 %), grâce à sa sensibilité et sa précision inégalées, ainsi qu'à sa capacité à fournir un profilage métabolique ciblé et non ciblé. La spectrométrie de masse est largement utilisée dans la recherche pharmaceutique, le diagnostic clinique et la découverte de biomarqueurs en raison de sa polyvalence pour la détection de métabolites complexes dans divers types d'échantillons. La domination de ce segment est encore renforcée par l'utilisation croissante des systèmes de spectrométrie de masse en tandem (MS/MS), de spectrométrie de masse à haute résolution (HSMS) et des systèmes LC-MS intégrés, qui permettent un débit, une précision et une reproductibilité accrus. La spectrométrie de masse est compatible avec de nombreux échantillons biologiques et environnementaux tels que l'urine, le plasma, les tissus tumoraux et les extraits végétaux. Son adoption généralisée est soutenue par d'importants investissements des institutions de recherche et des entreprises de biotechnologie pour la découverte de médicaments, la médecine personnalisée et le suivi des maladies. L'innovation continue dans l'automatisation des instruments et les capacités d'analyse des données contribue également à sa position de leader sur le marché, ce qui en fait la technique analytique privilégiée en métabolomique.
Le segment des services de bioinformatique en métabolomique devrait connaître le taux de croissance annuel composé (TCAC) le plus rapide, à 11,2 %, entre 2026 et 2033. Cette croissance est portée par le besoin croissant de traiter et d'interpréter les volumes massifs de données générés par les expériences de métabolomique avancée. Les services de bioinformatique fournissent des outils essentiels pour l'analyse des voies métaboliques, la cartographie des réseaux métaboliques et l'intégration multi-omique, autant d'éléments cruciaux pour la recherche translationnelle et la médecine de précision. L'adoption croissante de l'intelligence artificielle, de l'apprentissage automatique et des plateformes d'analyse dans le cloud accélère encore la demande de solutions bioinformatiques spécialisées. Ce segment est soutenu par des collaborations entre les prestataires de services et les institutions de recherche afin de proposer des services complets de traitement, d'analyse statistique et de visualisation des données. La demande croissante des laboratoires de recherche pharmaceutiques, cliniques et universitaires pour des informations prédictives et exploitables issues des données métabolomiques contribue également à cette croissance. Enfin, la complexité des données métabolomiques et la nécessité de disposer de professionnels qualifiés pour les interpréter incitent de plus en plus d'organisations à externaliser leurs services de bioinformatique, faisant de ce segment le plus dynamique du marché.
- Par type d'échantillon
Le marché des services de métabolomique est segmenté, selon le type d'échantillon, en urine, tumeurs, milieux de culture cellulaire, sang total, ingrédients alimentaires, plantes et autres. En 2025, le segment de l'urine représentait la plus grande part de marché (36,5 %), grâce au caractère non invasif du prélèvement, à la richesse en métabolites de l'urine et à ses nombreuses applications en recherche clinique, en diagnostic et en toxicologie. L'urine est largement utilisée pour le suivi de la fonction rénale, la détection des troubles métaboliques et l'identification des biomarqueurs de maladies. Sa position dominante s'explique par des protocoles de prélèvement standardisés, une reproductibilité élevée et des contraintes éthiques et réglementaires minimes, permettant ainsi la réalisation d'études épidémiologiques à grande échelle. Les laboratoires et les instituts de recherche privilégient l'urine pour sa facilité de manipulation, son rapport coût-efficacité et sa compatibilité avec les méthodes analytiques à haut débit. Ce segment bénéficie également de l'intérêt croissant porté à la médecine préventive, aux études nutritionnelles et à la recherche en santé publique. Enfin, la grande disponibilité d'échantillons d'urine pour les études populationnelles renforce son rôle de type d'échantillon dominant en métabolomique.
Le segment des échantillons tumoraux devrait connaître le taux de croissance annuel composé (TCAC) le plus rapide, soit 12,0 %, entre 2026 et 2033, sous l'effet de la prévalence croissante du cancer et de l'augmentation des investissements dans la recherche en oncologie. La métabolomique tumorale permet aux chercheurs de caractériser les modifications métaboliques associées à la progression tumorale, à la réponse aux traitements et à la résistance aux médicaments. L'intégration de la métabolomique tumorale à la génomique et à la protéomique en oncologie de précision stimule la demande. Les entreprises pharmaceutiques et biotechnologiques exploitent de plus en plus la métabolomique tumorale pour la découverte de nouveaux biomarqueurs et le développement de médicaments ciblés. La multiplication des initiatives mondiales visant à faire progresser la recherche sur le cancer, conjuguée aux avancées technologiques en matière de traitement des échantillons et d'analyse à haute résolution, favorise une croissance rapide. Les échantillons tumoraux gagnent en importance dans la médecine personnalisée, les essais cliniques et la recherche préclinique, ce qui en fait le segment d'échantillons connaissant la croissance la plus rapide.
- Par source d'échantillon
Selon la source des échantillons, le marché des services de métabolomique est segmenté en trois catégories : humains, animaux et autres. Le segment des échantillons humains a dominé le marché en 2025, représentant 48,2 % des revenus. Cette domination s’explique par l’utilisation croissante de la métabolomique dans le diagnostic clinique, la découverte de biomarqueurs de maladies, les études nutritionnelles et la médecine personnalisée. La métabolomique humaine apporte des éclairages sur les mécanismes complexes des maladies, les interventions thérapeutiques et la santé métabolique, ce qui la rend essentielle pour les hôpitaux, les entreprises pharmaceutiques et les institutions de recherche universitaires. La position dominante de ce segment est soutenue par l’augmentation des financements publics alloués à la recherche translationnelle, les progrès des techniques de métabolomique à haut débit et la prévalence croissante des maladies chroniques à l’échelle mondiale. Les échantillons humains sont privilégiés pour les études multi-omiques, permettant l’intégration des données métabolomiques avec la génomique, la protéomique et la transcriptomique afin d’obtenir une vision globale. La sensibilisation croissante des consommateurs à la santé et à la médecine de précision contribue également à cette forte demande. Enfin, des pratiques de prélèvement éthiques et des protocoles standardisés renforcent la préférence pour les échantillons humains dans les services de métabolomique.
Le segment des sources d'échantillons animaux devrait connaître le taux de croissance annuel composé (TCAC) le plus rapide, soit 10,8 %, entre 2026 et 2033, porté par son adoption croissante dans les études précliniques, la recherche vétérinaire et les applications agricoles. La métabolomique animale est essentielle à l'étude des modèles de maladies, de l'efficacité des médicaments, de la toxicologie et des réponses métaboliques chez les animaux de laboratoire et d'élevage. Ce segment bénéficie également de l'essor de la recherche en nutrition animale, en sélection animale et en biotechnologie, notamment en Amérique du Nord, en Europe et en Asie-Pacifique. L'utilisation croissante de la métabolomique animale pour le profilage des métabolites chez le bétail, l'optimisation de l'alimentation et le suivi de la santé vétérinaire stimule la croissance. Les entreprises pharmaceutiques et les instituts de recherche investissent dans la métabolomique animale pour le développement de médicaments et les études translationnelles, ce qui contribue à accélérer son adoption. La demande croissante de modèles animaux de haute qualité et d'expériences contrôlées garantit une croissance plus rapide de ce segment que celle des échantillons humains ou d'autres sources.
- Par l'utilisateur final
Selon l'utilisateur final, le marché des services de métabolomique se segmente en industrie médicale, industrie agricole, industrie agroalimentaire et autres. Le segment de l'industrie médicale représentait la plus grande part de marché (50,5 %) en 2025, grâce à l'essor de la métabolomique dans le diagnostic clinique, la découverte de médicaments, l'identification de biomarqueurs et la médecine de précision. Les hôpitaux, les laboratoires de recherche et les entreprises pharmaceutiques s'appuient fortement sur les services de métabolomique pour le profilage des maladies, le suivi thérapeutique et l'optimisation des traitements. La position dominante de ce segment est confortée par la prévalence croissante des maladies chroniques, le développement des infrastructures de santé et les initiatives gouvernementales croissantes en faveur de la recherche médicale avancée. Les progrès réalisés dans les technologies de métabolomique à haut débit, l'intégration de la bioinformatique et les approches multi-omiques renforcent encore le leadership de ce segment. L'adoption de la métabolomique dans la médecine personnalisée et les thérapies spécifiques aux patients garantit une demande soutenue de la part des utilisateurs finaux du secteur médical.
Le secteur agricole devrait connaître le taux de croissance annuel composé (TCAC) le plus rapide, soit 11,5 %, entre 2026 et 2033. Cette croissance est portée par l'utilisation croissante de la métabolomique pour l'amélioration des cultures, l'analyse des sols, le profilage des métabolites végétaux et l'agriculture de précision. La métabolomique agricole contribue à optimiser les rendements, à comprendre les réponses au stress, à améliorer la nutrition des plantes et à développer des aliments biofortifiés. L'augmentation des financements publics pour une agriculture durable, l'adoption croissante des biotechnologies de pointe et le besoin accru d'une production alimentaire de haute qualité accélèrent la demande. Les entreprises exploitent de plus en plus la métabolomique pour améliorer leurs programmes de sélection, surveiller la santé des plantes et développer des ingrédients alimentaires fonctionnels. Les progrès technologiques rapides et l'intégration de la métabolomique à la génomique en agriculture contribuent à la forte croissance de ce segment d'utilisateurs finaux.
Analyse régionale du marché des services de métabolomique
- L'Amérique du Nord a dominé le marché des services de métabolomique, représentant la plus grande part de revenus (environ 39,8 %) en 2025, grâce à une infrastructure de santé solide, des dépenses élevées en R&D et la présence de prestataires de services et d'instituts de recherche de premier plan.
- L'adoption généralisée des services de métabolomique dans la région est motivée par les applications dans le développement de médicaments, les essais cliniques et la découverte de biomarqueurs, avec une demande croissante en matière de médecine de précision et de thérapies personnalisées.
- Des investissements importants dans la recherche en sciences de la vie, des installations de laboratoire de pointe et des collaborations entre les institutions universitaires et les entreprises pharmaceutiques renforcent encore la position de leader de l'Amérique du Nord.
Analyse du marché américain des services de métabolomique
Le marché américain des services de métabolomique représentait la majeure partie de la demande régionale en 2025, porté par le besoin croissant de métabolomique dans les processus de développement de médicaments, les diagnostics cliniques et les programmes de découverte de biomarqueurs. L'intérêt grandissant pour la médecine de précision, conjugué à d'importants financements publics et privés dans la recherche en biotechnologie, accélère la croissance du marché. Par ailleurs, la disponibilité de plateformes analytiques avancées, du profilage métabolique à haut débit et de personnel de recherche qualifié renforce encore l'expansion du marché aux États-Unis.
Analyse du marché européen des services de métabolomique
Le marché européen des services de métabolomique devrait connaître une croissance annuelle composée (TCAC) significative au cours de la période de prévision, portée par des investissements importants dans la recherche en sciences de la vie, des normes réglementaires rigoureuses et une collaboration accrue entre les entreprises pharmaceutiques et les institutions de recherche. Des pays comme l'Allemagne, la France et le Royaume-Uni enregistrent une croissance soutenue des applications de la métabolomique, notamment dans la découverte de médicaments, les essais cliniques et la validation des biomarqueurs. La région bénéficie également d'infrastructures de santé performantes et d'initiatives gouvernementales soutenant la recherche translationnelle.
Analyse du marché des services de métabolomique au Royaume-Uni
Le marché britannique des services de métabolomique devrait connaître une forte croissance au cours de la période prévisionnelle, portée par l'augmentation des investissements dans la recherche en biotechnologie et par une collaboration étroite entre le monde universitaire et l'industrie. Cette croissance est également soutenue par l'utilisation croissante de la métabolomique dans les essais cliniques, la médecine de précision et la recherche de biomarqueurs. Un secteur pharmaceutique bien établi, conjugué au soutien gouvernemental à l'innovation dans les domaines de la santé et des sciences de la vie, contribue également à l'expansion du marché.
Analyse du marché allemand des services de métabolomique
Le marché allemand des services de métabolomique devrait connaître une croissance annuelle composée importante, portée par un écosystème de R&D dynamique, des infrastructures de laboratoire de pointe et un intérêt marqué pour la médecine personnalisée. Les secteurs pharmaceutique et biotechnologique allemands exploitent de plus en plus la métabolomique pour la découverte de médicaments, les études toxicologiques et l'identification de biomarqueurs. La collaboration entre les instituts de recherche et l'industrie favorise l'adoption des services de métabolomique dans les applications académiques et commerciales.
Analyse du marché des services de métabolomique en Asie-Pacifique
Le marché des services de métabolomique en Asie-Pacifique devrait connaître la croissance la plus rapide au cours de la période de prévision, portée par l'augmentation des investissements dans la recherche en biotechnologie, le développement des activités de recherche pharmaceutique et académique, et la hausse des dépenses de santé dans des pays comme la Chine, le Japon et l'Inde. Cette croissance est également soutenue par la multiplication des organismes de recherche sous contrat (ORC), les initiatives de financement gouvernementales et l'adoption croissante des technologies analytiques avancées dans les études métabolomiques.
Analyse du marché japonais des services de métabolomique
Le marché japonais des services de métabolomique est en plein essor grâce à l'importance accordée par le pays à la recherche en biotechnologie, à la médecine de précision et au diagnostic clinique. L'augmentation des investissements en R&D, la qualité des infrastructures de laboratoire et les collaborations entre entreprises pharmaceutiques et institutions académiques stimulent la croissance de ce marché. Par ailleurs, le recours croissant à la métabolomique dans la découverte de médicaments et l'identification de biomarqueurs contribue à son expansion constante au Japon.
Analyse du marché des services de métabolomique en Chine
En 2025, le marché chinois des services de métabolomique représentait la plus grande part de revenus de la région Asie-Pacifique, porté par l'essor rapide de la recherche en biotechnologie, le soutien gouvernemental aux sciences de la vie et la hausse des dépenses de santé. La forte présence d'organismes de recherche sous contrat (CRO) en Chine, ses infrastructures de laboratoire de pointe et l'intérêt croissant porté à la métabolomique dans le développement de médicaments, les essais cliniques et la découverte de biomarqueurs sont autant de facteurs clés de la croissance de ce marché. Le pays connaît également une intensification des collaborations entre institutions de recherche nationales et internationales, favorisant ainsi l'adoption des services de métabolomique dans les secteurs académique et commercial.
Part de marché des services de métabolomique
Le secteur des services de métabolomique est principalement dominé par des entreprises bien établies, notamment :
• Syneos Health (États-Unis)
• Charles River Laboratories (États-Unis)
• Eurofins Scientific (Luxembourg)
• Labcorp (États-Unis)
• Metabolon, Inc. (États-Unis)
• Cambridge Isotope Laboratories, Inc. (États-Unis)
• Agilent Technologies, Inc. (États-Unis)
• Thermo Fisher Scientific, Inc. (États-Unis)
• SGS SA (Suisse)
• Proteome Sciences plc (Royaume-Uni)
• Shimadzu Corporation (Japon)
• Metabolomic Discoveries GmbH (Allemagne)
• Waters Corporation (États-Unis)
Dernières évolutions du marché mondial des services de métabolomique
- En juillet 2021, Thermo Fisher Scientific, Inc. et l'Université de Californie à Davis (UC Davis) ont lancé le Centre d'excellence en métabolomique clinique, une initiative de recherche collaborative visant à créer des pratiques exemplaires standardisées, des flux de travail avancés et des innovations en métabolomique clinique afin de soutenir les laboratoires et les chercheurs du monde entier. Ce partenariat a réuni l'expertise académique et la technologie industrielle pour accélérer la recherche de haute qualité en métabolomique, les méthodes analytiques et le partage de données au sein de la communauté scientifique.
- En janvier 2023, CosmosID, plateforme reconnue pour son analyse du microbiome à haute résolution, a intégré de nouveaux services de métabolomique à sa plateforme, combinant données métabolomiques, métagénomiques et métatranscriptomiques. Cette amélioration offre aux chercheurs un service multi-omique complet, associant profilage microbien et analyse de la production de métabolites, afin d'approfondir leur compréhension de la structure et de la fonction du microbiome dans le cadre d'études sur la santé et les maladies.
- En septembre 2024, Trinity Biotech plc a annoncé l'acquisition de Metabolomics Diagnostics, une société irlandaise de deep tech spécialisée dans les diagnostics basés sur les biomarqueurs et s'appuyant sur la métabolomique avancée, la spectrométrie de masse et la bioinformatique d'apprentissage automatique. Cette acquisition a permis à Trinity Biotech de se doter d'une plateforme propriétaire pour des tests tels que PrePsia (un test de dépistage précoce du risque de prééclampsie pendant la grossesse) et de se positionner pour commercialiser cette technologie sur le marché américain en 2025.
- En février 2025, Metabolon, Inc. a lancé une plateforme bioinformatique intégrée dotée d'outils de modélisation prédictive multi-omique, d'analyse des facteurs latents et d'analyse des voies métaboliques, permettant aux utilisateurs de télécharger et d'intégrer divers jeux de données omiques. Cette plateforme améliorée a permis une interprétation plus robuste des données métabolomiques et autres données biologiques, favorisant une compréhension plus approfondie de la biologie des systèmes pour la recherche et les applications cliniques.
- En juin 2025, Bruker Corporation a annoncé l'acquisition de Biocrates Life Sciences AG, leader mondial des kits, tests, logiciels et services de métabolomique quantitative basés sur la spectrométrie de masse. Cette acquisition stratégique a renforcé le portefeuille de solutions multi-omiques de Bruker, élargissant son offre en matière d'instruments, de réactifs, de logiciels et de services de recherche, tout en rendant les technologies de métabolomique de haute qualité plus accessibles aux laboratoires du monde entier.
- En septembre 2025, Biognosys a étendu ses services en lançant des offres de métabolomique et de lipidomique quantitatives en Europe et aux États-Unis. Cette extension de service a complété les capacités existantes de Biognosys en protéomique et enrichi son portefeuille de services CRO, permettant d'accélérer les flux de travail de découverte de médicaments multi-omiques et de recherche clinique grâce à une plus grande profondeur analytique.
SKU-
Accédez en ligne au rapport sur le premier cloud mondial de veille économique

- Tableau de bord d'analyse de données interactif
- Tableau de bord d'analyse d'entreprise pour les opportunités à fort potentiel de croissance
- Accès d'analyste de recherche pour la personnalisation et les requêtes
- Analyse de la concurrence avec tableau de bord interactif
- Dernières actualités, mises à jour et analyse des tendances
- Exploitez la puissance de l'analyse comparative pour un suivi complet de la concurrence
Méthodologie de recherche
La collecte de données et l'analyse de l'année de base sont effectuées à l'aide de modules de collecte de données avec des échantillons de grande taille. L'étape consiste à obtenir des informations sur le marché ou des données connexes via diverses sources et stratégies. Elle comprend l'examen et la planification à l'avance de toutes les données acquises dans le passé. Elle englobe également l'examen des incohérences d'informations observées dans différentes sources d'informations. Les données de marché sont analysées et estimées à l'aide de modèles statistiques et cohérents de marché. De plus, l'analyse des parts de marché et l'analyse des tendances clés sont les principaux facteurs de succès du rapport de marché. Pour en savoir plus, veuillez demander un appel d'analyste ou déposer votre demande.
La méthodologie de recherche clé utilisée par l'équipe de recherche DBMR est la triangulation des données qui implique l'exploration de données, l'analyse de l'impact des variables de données sur le marché et la validation primaire (expert du secteur). Les modèles de données incluent la grille de positionnement des fournisseurs, l'analyse de la chronologie du marché, l'aperçu et le guide du marché, la grille de positionnement des entreprises, l'analyse des brevets, l'analyse des prix, l'analyse des parts de marché des entreprises, les normes de mesure, l'analyse globale par rapport à l'analyse régionale et des parts des fournisseurs. Pour en savoir plus sur la méthodologie de recherche, envoyez une demande pour parler à nos experts du secteur.
Personnalisation disponible
Data Bridge Market Research est un leader de la recherche formative avancée. Nous sommes fiers de fournir à nos clients existants et nouveaux des données et des analyses qui correspondent à leurs objectifs. Le rapport peut être personnalisé pour inclure une analyse des tendances des prix des marques cibles, une compréhension du marché pour d'autres pays (demandez la liste des pays), des données sur les résultats des essais cliniques, une revue de la littérature, une analyse du marché des produits remis à neuf et de la base de produits. L'analyse du marché des concurrents cibles peut être analysée à partir d'une analyse basée sur la technologie jusqu'à des stratégies de portefeuille de marché. Nous pouvons ajouter autant de concurrents que vous le souhaitez, dans le format et le style de données que vous recherchez. Notre équipe d'analystes peut également vous fournir des données sous forme de fichiers Excel bruts, de tableaux croisés dynamiques (Fact book) ou peut vous aider à créer des présentations à partir des ensembles de données disponibles dans le rapport.

