
Global Metabolomics Services Market
Market Size in USD Billion
 USD
3.97 Billion
USD
9.22 Billion
2025
2033
USD
3.97 Billion
USD
9.22 Billion
2025
2033
| 2026 - 2033 | |
| USD 3.97 Billion | |
| USD 9.22 Billion | |
| % | |
|
Metabolomics Services Market Size
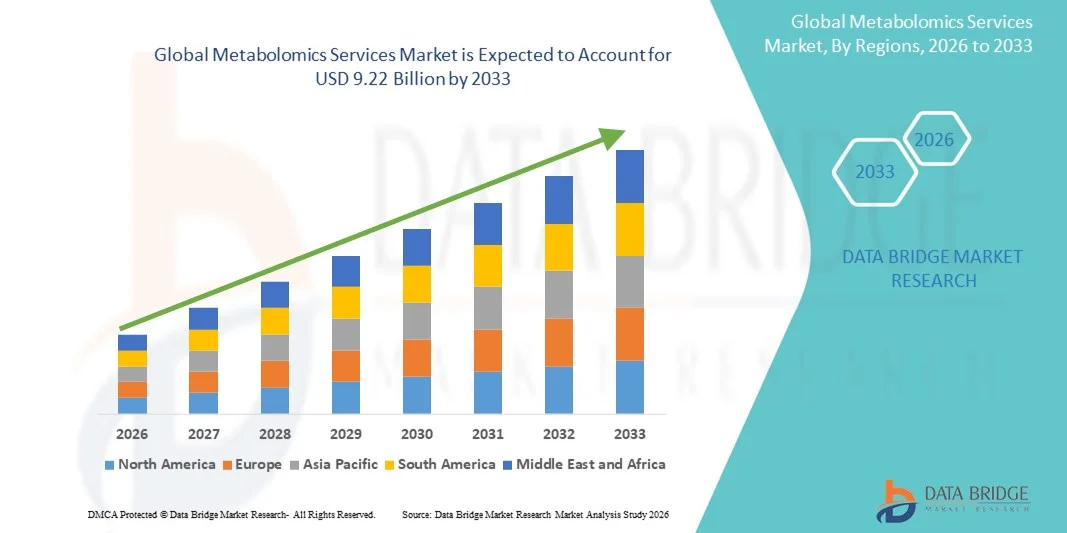
- The global metabolomics services market size was valued at USD 3.97 billion in 2025 and is expected to reach USD 9.22 billion by 2033, at a CAGR of 11.12% during the forecast period
- The market growth is largely driven by the increasing adoption of advanced omics technologies in life sciences research and healthcare, coupled with rapid technological progress in analytical platforms such as mass spectrometry, nuclear magnetic resonance (NMR), and bioinformatics. These advancements are enabling more precise, high-throughput, and cost-effective metabolic profiling across academic, pharmaceutical, and clinical research settings
- Furthermore, rising demand for personalized medicine, biomarker discovery, and disease pathway analysis is positioning metabolomics services as a critical component of modern drug development, diagnostics, and translational research. The growing integration of metabolomics with genomics and proteomics, along with expanding applications in oncology, neurology, and metabolic disorders, is accelerating the uptake of Metabolomics Services, thereby significantly boosting the overall growth of the market
Metabolomics Services Market Analysis
- Metabolomics services, encompassing comprehensive analysis of metabolites in biological samples using advanced techniques such as mass spectrometry (MS) and nuclear magnetic resonance (NMR), are increasingly vital in modern biomedical research, drug discovery, and personalized medicine due to their ability to provide deep insights into disease mechanisms, biomarker identification, and therapeutic responses
- The escalating demand for metabolomics services is primarily fueled by the growing adoption of precision medicine, increasing investments in pharmaceutical and biotechnology research, and rising need for early disease detection and biomarker discovery. Integration with multi-omics approaches, including genomics and proteomics, is further enhancing the utility and adoption of metabolomics platforms
- North America dominated the metabolomics services market with the largest revenue share of approximately 39.8% in 2025, supported by strong healthcare infrastructure, high R&D expenditure, and the presence of leading service providers and research institutions. The U.S. accounted for the majority of regional demand, driven by applications in drug development, clinical trials, and biomarker discovery
- Asia-Pacific is expected to be the fastest-growing region in the metabolomics services market during the forecast period, with a CAGR outpacing other regions, due to increasing investments in biotechnology research, rising healthcare spending, and expanding pharmaceutical and academic research activities in countries such as China, Japan, and India
- The human sample source segment dominated the market with a revenue share of 48.2% in 2025, driven by the increasing use of metabolomics in clinical diagnostics, disease biomarker discovery, nutrition studies, and personalized medicine
Report Scope and Metabolomics Services Market Segmentation
|
Attributes |
Metabolomics Services Key Market Insights |
|
Segments Covered |
|
|
Countries Covered |
North America
Europe
Asia-Pacific
Middle East and Africa
South America
|
|
Key Market Players |
• Syneos Health (U.S.) |
|
Market Opportunities |
|
|
Value Added Data Infosets |
In addition to the insights on market scenarios such as market value, growth rate, segmentation, geographical coverage, and major players, the market reports curated by the Data Bridge Market Research also include in-depth expert analysis, patient epidemiology, pipeline analysis, pricing analysis, and regulatory framework. |
Metabolomics Services Market Trends
Growing Adoption of Advanced Metabolomics Techniques
- A significant and accelerating trend in the global metabolomics services market is the growing adoption of advanced metabolomics techniques for comprehensive biomarker discovery, personalized medicine, and systems biology research. Researchers and pharmaceutical companies are increasingly leveraging metabolomics to analyze small-molecule metabolites, understand disease mechanisms, and identify therapeutic target
- For instance, in 2024, several leading contract research organizations (CROs) introduced high-throughput LC-MS and NMR-based metabolomics platforms to enhance their analytical capabilities for drug discovery and precision medicine applications
- The increasing integration of metabolomics with genomics, proteomics, and bioinformatics is enabling more holistic insights into biological pathways, supporting the trend toward multi-omics studies in both academic and clinical research
- Growing demand for non-invasive diagnostics, nutrition research, and metabolite profiling in clinical trials is further driving the use of metabolomics services across pharmaceutical, biotechnology, and healthcare sectors
- In addition, the development of cloud-based data analysis tools and standardized workflows is improving accessibility and reproducibility of metabolomics studies, promoting broader adoption across laboratories and research institutions
- This trend toward comprehensive, high-resolution metabolite analysis is transforming research strategies and enabling faster, more precise decision-making in drug development and personalized healthcare
Metabolomics Services Market Dynamics
Driver
High Cost of Services and Technical Complexity
- The increasing need for precision medicine, personalized therapies, and advanced biomarker discovery is a major driver of the global Metabolomics Services market. Organizations are using metabolomics to identify early disease indicators, optimize drug efficacy, and monitor patient response, which is boosting demand for specialized analytical services
- For instance, in 2025, a leading pharmaceutical company collaborated with a metabolomics CRO to accelerate biomarker identification for metabolic disorders, demonstrating the critical role of metabolomics in targeted drug development
- Furthermore, the rapid growth of the biotechnology and pharmaceutical sectors, combined with increased R&D investments, is fueling demand for high-throughput and cost-effective metabolomics services
- The trend toward personalized nutrition, metabolite profiling in clinical diagnostics, and lifestyle-focused research is expanding the market’s potential in both healthcare and wellness industries
- In addition, government initiatives and funding programs supporting omics research and early disease detection are further encouraging the adoption of metabolomics technologies and services worldwide
Restraint/Challenge
Concerns Regarding Cybersecurity and High Initial Costs
- Despite its potential, the high cost and technical complexity of metabolomics services remain significant challenges for widespread adoption, particularly among small-scale laboratories and emerging biotech companies. Metabolomics analyses require specialized instrumentation, skilled personnel, and sophisticated data interpretation, which can limit accessibility
- For instance, some academic institutions in developing regions struggle to implement NMR- and LC-MS-based metabolomics workflows due to limited budgets and technical expertise
- Variability in sample preparation, lack of standardized protocols, and complex data analysis can also lead to inconsistencies and limit reproducibility, posing barriers to broader implementation in clinical and research settings
- Furthermore, regulatory and quality assurance requirements for metabolomics-based diagnostics and biomarker validation can increase operational costs and slow adoption in certain regions
- Addressing these challenges through automation, cost optimization, standardized workflows, and training programs is critical to ensure sustained growth in the global metabolomics services market
Metabolomics Services Market Scope
The market is segmented on the basis of product and service, sample type, sample source, and end user.
- By Product and Service
On the basis of product and service, the Metabolomics Services market is segmented into chromatography, metabolomics bioinformatics services, mass spectrometry, and separation and detection services. The mass spectrometry segment dominated the largest market revenue share of 45.8% in 2025, driven by its unmatched sensitivity, precision, and ability to provide both targeted and untargeted metabolic profiling. Mass spectrometry is widely adopted in pharmaceutical research, clinical diagnostics, and biomarker discovery due to its versatility in detecting complex metabolites across diverse sample types. The segment’s dominance is further strengthened by the increasing use of tandem MS, high-resolution MS, and integrated LC-MS systems, which enable higher throughput, accuracy, and reproducibility. Mass spectrometry is compatible with multiple biological and environmental samples such as urine, plasma, tumor tissues, and plant extracts. Its widespread adoption is supported by strong investments from research institutions and biotech companies for drug discovery, personalized medicine, and disease monitoring applications. Continuous innovation in instrument automation and data analysis capabilities also contributes to its market leadership, making it the most preferred analytical technique in metabolomics.
The metabolomics bioinformatics services segment is expected to witness the fastest CAGR of 11.2% from 2026 to 2033, driven by the growing need to process and interpret the massive volumes of data generated by advanced metabolomics experiments. Bioinformatics services provide essential tools for pathway analysis, metabolic network mapping, and multi-omics integration, which are critical for translational research and precision medicine. Increasing adoption of artificial intelligence, machine learning, and cloud-based analytics platforms is further accelerating the demand for specialized bioinformatics solutions. The segment is supported by collaborations between service providers and research institutions to deliver end-to-end data processing, statistical analysis, and visualization services. Rising demand from pharmaceutical, clinical, and academic research laboratories for predictive and actionable insights from metabolomics datasets also fuels growth. In addition, the complexity of metabolomic datasets and the need for skilled professionals to interpret them are pushing more organizations to outsource bioinformatics services, making this the fastest-growing segment in the market.
- By Sample Type
On the basis of sample type, the Metabolomics Services market is segmented into urine, tumor, cell culture media, whole blood, food ingredients, plant, and others. The urine segment held the largest market revenue share of 36.5% in 2025, driven by the non-invasive nature of urine collection, rich metabolite content, and extensive applications in clinical research, diagnostics, and toxicology studies. Urine is widely used for monitoring kidney function, detecting metabolic disorders, and identifying disease biomarkers. Its dominance is supported by standardized collection protocols, high reproducibility, and minimal ethical or regulatory concerns, allowing large-scale epidemiological studies. Laboratories and research institutions prefer urine due to ease of handling, cost-effectiveness, and compatibility with high-throughput analytical methods. The segment also benefits from the growing focus on preventive healthcare, nutrition studies, and public health research. In addition, the wide availability of urine samples for population-based studies strengthens its role as the dominant sample type in metabolomics services.
The tumor sample segment is expected to witness the fastest CAGR of 12.0% from 2026 to 2033, driven by the increasing prevalence of cancer and rising investments in oncology research. Tumor metabolomics enables researchers to profile metabolic changes associated with tumor progression, therapy response, and drug resistance. The integration of tumor metabolomics with genomics and proteomics in precision oncology is fueling demand. Pharmaceutical and biotech companies are increasingly leveraging tumor-based metabolomics for novel biomarker discovery and targeted drug development. Rising global initiatives to advance cancer research, coupled with technological advancements in sample processing and high-resolution analytics, are supporting rapid growth. Tumor samples are gaining traction in personalized medicine, clinical trials, and preclinical research, making this the fastest-growing segment in sample type.
- By Sample Source
On the basis of sample source, the Metabolomics Services market is segmented into human, animal, and others. The human sample source segment dominated the market with a revenue share of 48.2% in 2025, driven by the increasing use of metabolomics in clinical diagnostics, disease biomarker discovery, nutrition studies, and personalized medicine. Human metabolomics provides insights into complex disease mechanisms, therapeutic interventions, and metabolic health, making it highly relevant for hospitals, pharmaceutical companies, and academic research institutions. The segment’s dominance is supported by growing government funding for translational research, advancements in high-throughput metabolomics techniques, and the rising prevalence of chronic diseases globally. Human samples are preferred for multi-omics studies, allowing integration of metabolomic data with genomics, proteomics, and transcriptomics to develop holistic insights. Rising consumer awareness about health and precision medicine is further contributing to strong demand. Ethical collection practices and standardized protocols also reinforce the preference for human samples in metabolomics services.
The animal sample source segment is expected to witness the fastest CAGR of 10.8% from 2026 to 2033, fueled by growing adoption in preclinical studies, veterinary research, and agricultural applications. Animal metabolomics is critical for studying disease models, drug efficacy, toxicology, and metabolic responses in laboratory and livestock animals. The segment also benefits from increasing research in animal nutrition, breeding, and biotechnology, particularly in North America, Europe, and Asia-Pacific. Expanding use in livestock metabolite profiling, feed optimization, and veterinary health monitoring is driving growth. Pharmaceutical companies and research institutions are investing in animal metabolomics for drug development and translational studies, further boosting the adoption rate. Rising demand for high-quality animal models and controlled experiments ensures this segment grows faster than human or other sources.
- By End User
On the basis of end user, the Metabolomics Services market is segmented into medical industry, agriculture industry, food processing industry, and others. The medical industry segment accounted for the largest market revenue share of 50.5% in 2025, driven by the rising application of metabolomics in clinical diagnostics, drug discovery, biomarker identification, and precision medicine. Hospitals, research laboratories, and pharmaceutical companies rely heavily on metabolomics services for disease profiling, therapeutic monitoring, and treatment optimization. The segment’s dominance is supported by the increasing prevalence of chronic diseases, expanding healthcare infrastructure, and growing government initiatives for advanced medical research. Advancements in high-throughput metabolomics technologies, bioinformatics integration, and multi-omics approaches further reinforce the segment’s leadership. The adoption of metabolomics in personalized medicine and patient-specific therapies ensures continued demand from medical end users.
The agriculture industry segment is expected to witness the fastest CAGR of 11.5% from 2026 to 2033, driven by the growing use of metabolomics in crop improvement, soil analysis, plant metabolite profiling, and precision agriculture. Agricultural metabolomics helps optimize crop yield, understand stress responses, improve plant nutrition, and develop biofortified foods. Increasing government funding for sustainable agriculture, growing adoption of advanced biotechnologies, and the rising need for high-quality food production are accelerating demand. Companies are increasingly leveraging metabolomics to enhance breeding programs, monitor plant health, and develop functional food ingredients. Rapid technological advancements and the integration of metabolomics with genomics in agriculture contribute to strong growth in this end-user segment.
Metabolomics Services Market Regional Analysis
- North America dominated the metabolomics services market with the largest revenue share of approximately 39.8% in 2025, supported by strong healthcare infrastructure, high R&D expenditure, and the presence of leading service providers and research institution
- The widespread adoption of metabolomics services in the region is driven by applications in drug development, clinical trials, and biomarker discovery, with increasing demand for precision medicine and personalized therapeutics
- High investment in life sciences research, advanced laboratory facilities, and collaborations between academic institutions and pharmaceutical companies further strengthen North America’s leading position
U.S. Metabolomics Services Market Insight
The U.S. metabolomics services market accounted for the majority of regional demand in 2025, driven by the expanding need for metabolomics in drug development pipelines, clinical diagnostics, and biomarker discovery programs. The increasing focus on precision medicine, combined with strong government and private funding in biotechnology research, is accelerating market growth. In addition, the availability of advanced analytical platforms, high-throughput metabolite profiling, and skilled research personnel further reinforce market expansion in the U.S.
Europe Metabolomics Services Market Insight
The Europe metabolomics services market is projected to grow at a significant CAGR during the forecast period, driven by robust investments in life sciences research, stringent regulatory standards, and increasing collaborations between pharmaceutical companies and research institutions. Countries such as Germany, France, and the U.K. are witnessing steady growth in metabolomics applications, particularly in drug discovery, clinical trials, and biomarker validation. The region also benefits from well-established healthcare infrastructure and government initiatives supporting translational research.
U.K. Metabolomics Services Market Insight
The U.K. metabolomics services market expected to register healthy growth during the forecast period, fueled by rising investments in biotechnology research and strong academic-industry collaborations. The market growth is also supported by the increasing use of metabolomics in clinical trials, precision medicine, and biomarker research. A well-established pharmaceutical sector, along with government support for innovation in healthcare and life sciences, is further driving market expansion.
Germany Metabolomics Services Market Insight
The Germany metabolomics services market is anticipated to grow at a considerable CAGR, supported by the country’s strong R&D ecosystem, advanced laboratory infrastructure, and focus on personalized medicine. Germany’s pharmaceutical and biotechnology sectors are increasingly leveraging metabolomics for drug discovery, toxicology studies, and biomarker identification. Collaborations between research institutes and industry are enhancing the adoption of metabolomics services in both academic and commercial applications.
Asia-Pacific Metabolomics Services Market Insight
The Asia-Pacific metabolomics services market is expected to be the fastest-growing region during the forecast period, driven by rising investments in biotechnology research, expanding pharmaceutical and academic research activities, and increasing healthcare spending in countries such as China, Japan, and India. The growth is further supported by a surge in contract research organizations (CROs), government funding initiatives, and expanding adoption of advanced analytical technologies in metabolomics studies.
Japan Metabolomics Services Market Insight
The Japan metabolomics services market is gaining momentum due to the country’s strong focus on biotechnology research, precision medicine, and clinical diagnostics. Growing investments in R&D, a high standard of laboratory infrastructure, and collaborations between pharmaceutical companies and academic institutions are fueling market growth. In addition, the increasing use of metabolomics in drug discovery and biomarker identification is contributing to steady expansion in Japan.
China Metabolomics Services Market Insight
The China metabolomics services market accounted for the largest market revenue share in the Asia-Pacific region in 2025, driven by rapid expansion in biotechnology research, government support for life sciences, and rising healthcare spending. China’s strong presence of CROs, advanced laboratory infrastructure, and growing focus on metabolomics in drug development, clinical trials, and biomarker discovery are key factors driving market growth. The country is also witnessing increased collaborations between domestic and international research institutions, enhancing the adoption of metabolomics services across academic and commercial sectors.
Metabolomics Services Market Share
The Metabolomics Services industry is primarily led by well-established companies, including:
• Syneos Health (U.S.)
• Charles River Laboratories (U.S.)
• Eurofins Scientific (Luxembourg)
• Labcorp (U.S.)
• Metabolon, Inc. (U.S.)
• Cambridge Isotope Laboratories, Inc. (U.S.)
• Agilent Technologies, Inc. (U.S.)
• Thermo Fisher Scientific, Inc. (U.S.)
• SGS S.A. (Switzerland)
• Proteome Sciences plc (U.K.)
• Shimadzu Corporation (Japan)
• Metabolomic Discoveries GmbH (Germany)
• Waters Corporation (U.S.)
Latest Developments in Global Metabolomics Services Market
- In July 2021, Thermo Fisher Scientific, Inc. and the University of California, Davis (UC Davis) launched the Center of Excellence in Clinical Metabolomics, a collaborative research initiative aimed at creating standardized best practices, advanced workflows, and innovations in clinical metabolomics to support laboratories and researchers worldwide. This partnership brought together academic expertise and industry technology to accelerate high‑quality metabolomics research, analytical methods, and data sharing within the scientific community
- In January 2023, CosmosID, known for high‑resolution microbiome analysis, introduced new metabolomics services to its platform, integrating metabolomics data with metagenomics and metatranscriptomics. This enhancement provided researchers with a comprehensive multi‑omics service combining microbial profiling and metabolite production analysis to generate deeper insights into microbiome structure and function in health and disease studies
- In September 2024, Trinity Biotech plc announced the acquisition of Metabolomics Diagnostics, an Irish deep‑tech company specializing in biomarker‑based diagnostics powered by advanced metabolomics, mass spectrometry, and machine‑learning bioinformatics. This acquisition provided Trinity Biotech with a proprietary platform for tests such as PrePsia—an early pregnancy preeclampsia risk screening test—and positioned the company to commercialize the technology in the U.S. market in 2025
- In February 2025, Metabolon, Inc. launched an integrated bioinformatics platform featuring multi‑omics predictive modeling, latent factor analysis, and pathway analysis tools enabling users to upload and integrate diverse omics datasets. This enhanced platform allowed more robust interpretation of metabolomic and other biological data, supporting deeper systems biology insights for research and clinical applications
- In June 2025, Bruker Corporation announced the acquisition of biocrates life sciences ag, a global leader in quantitative, mass spectrometry‑based metabolomics kits, assays, software, and services. This strategic acquisition strengthened Bruker’s multi‑omics solutions portfolio—expanding its offerings across instruments, reagents, software, and research services while making high‑quality metabolomics technologies more accessible to laboratories worldwide
- In September 2025, Biognosys expanded its services by launching quantitative biocrates metabolomics and lipidomics offerings in both Europe and the United States. This service expansion complemented Biognosys’ existing proteomics capabilities and enriched its CRO service portfolio, enabling accelerated multi‑omics drug discovery and clinical research workflows with broader analytical depth
SKU-

- Interactive Data Analysis Dashboard
- Company Analysis Dashboard for high growth potential opportunities
- Research Analyst Access for customization & queries
- Competitor Analysis with Interactive dashboard
- Latest News, Updates & Trend analysis
- Harness the Power of Benchmark Analysis for Comprehensive Competitor Tracking
Data collection and base year analysis are done using data collection modules with large sample sizes. The stage includes obtaining market information or related data through various sources and strategies. It includes examining and planning all the data acquired from the past in advance. It likewise envelops the examination of information inconsistencies seen across different information sources. The market data is analysed and estimated using market statistical and coherent models. Also, market share analysis and key trend analysis are the major success factors in the market report. To know more, please request an analyst call or drop down your inquiry.
The key research methodology used by DBMR research team is data triangulation which involves data mining, analysis of the impact of data variables on the market and primary (industry expert) validation. Data models include Vendor Positioning Grid, Market Time Line Analysis, Market Overview and Guide, Company Positioning Grid, Patent Analysis, Pricing Analysis, Company Market Share Analysis, Standards of Measurement, Global versus Regional and Vendor Share Analysis. To know more about the research methodology, drop in an inquiry to speak to our industry experts.
Data Bridge Market Research is a leader in advanced formative research. We take pride in servicing our existing and new customers with data and analysis that match and suits their goal. The report can be customized to include price trend analysis of target brands understanding the market for additional countries (ask for the list of countries), clinical trial results data, literature review, refurbished market and product base analysis. Market analysis of target competitors can be analyzed from technology-based analysis to market portfolio strategies. We can add as many competitors that you require data about in the format and data style you are looking for. Our team of analysts can also provide you data in crude raw excel files pivot tables (Fact book) or can assist you in creating presentations from the data sets available in the report.


