Asia-Pacific Kegs Market, By Material (Plastic, Tin, and Stainless Steel), Capacity (Up To 20 Litre, 20 Litre To 40 Litre, 40 Litre To 60 Litre, and Above 60 Litre), End User (Alcoholic Beverages, Non- Alcoholic Beverages, Cooking Oil, Chemicals, and Others), Distribution Channel (Supermarket/Hypermarket, Commercial Liquor Store, and Others) Industry Trends and Forecast to 2029.
Asia-Pacific Kegs Market Analysis and Size
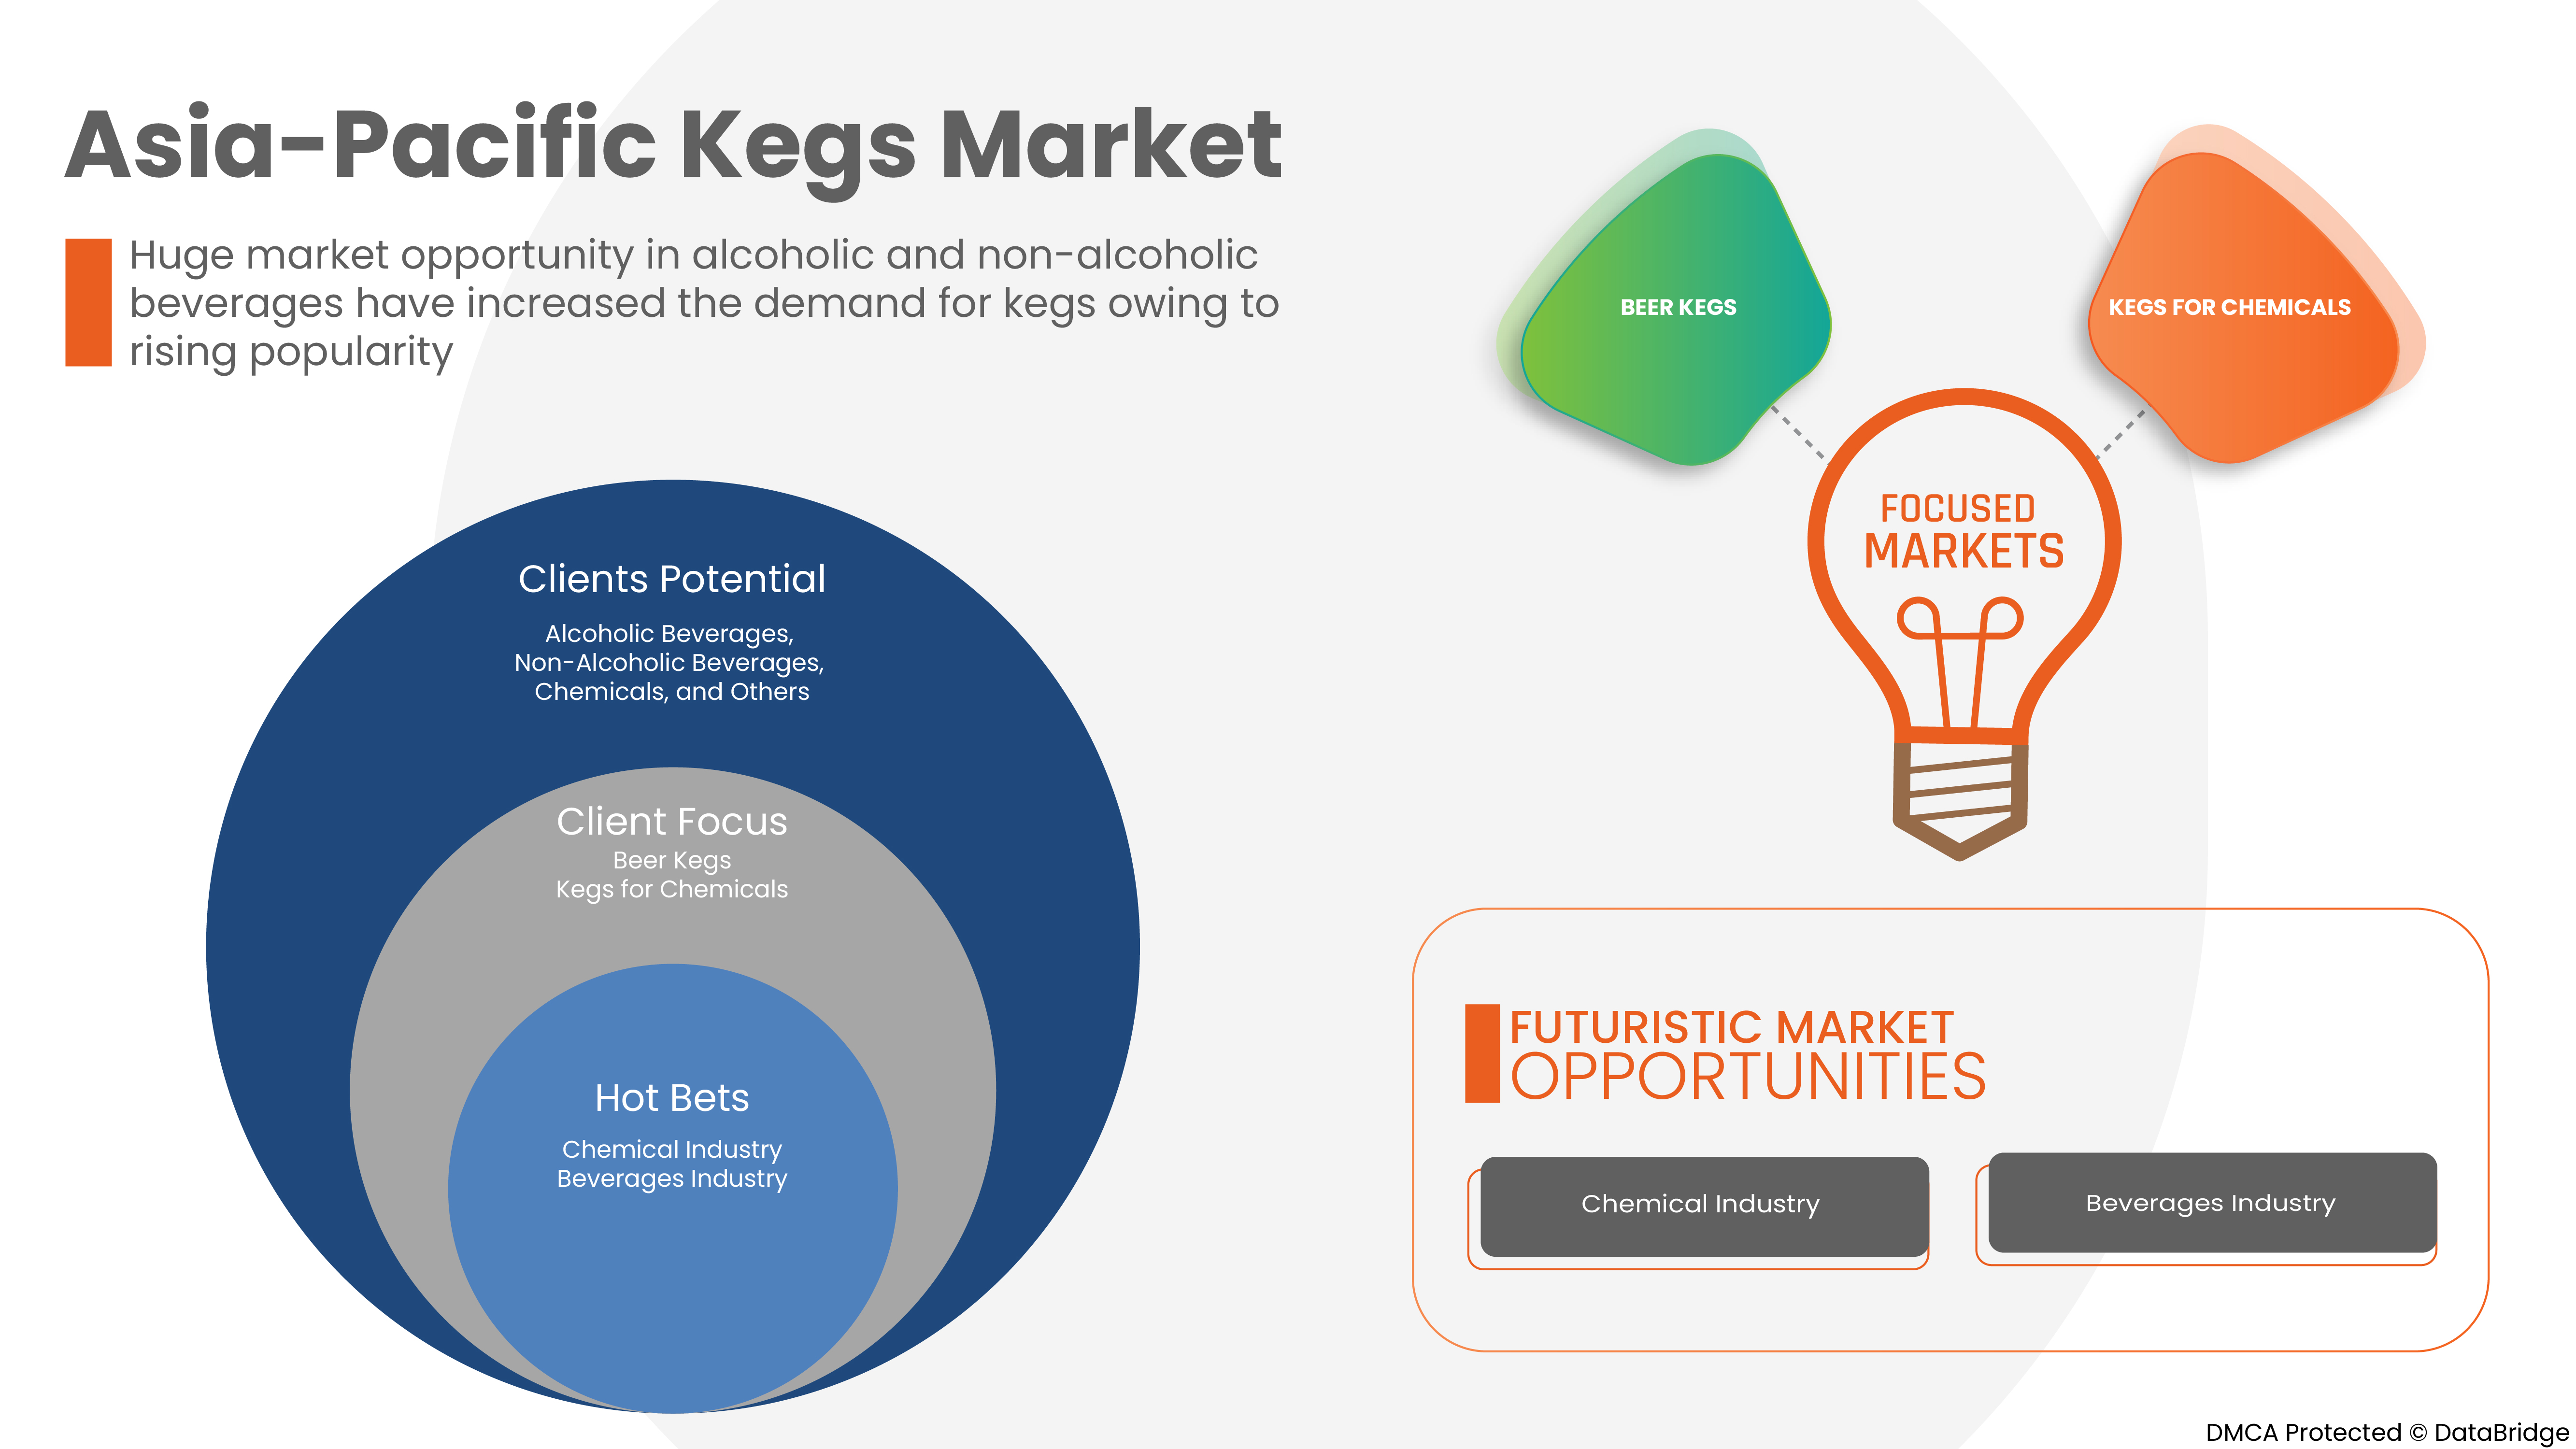
The Asia-Pacific kegs market is being driven by the increase in applications for kegs across industries. Additionally, the growth of the market is fueled by rising demand for alcoholic and non-alcoholic beverages. However, the primary factors limiting the market growth are the high costs associated with commercial kegs. As a result of the rising demand for kegs, manufacturers are putting more effort into launching new products with cut-edge technology and certified by authorized institutes. The market's expansion is ultimately aided by these choices.
Some of the factors driving the market growth are growing applications of kegs in chemical sector and food & beverages sector and increasing consumption of beverages due to gradual lifestyle changes. However, limitations in terms of slow replacement of kegs due to their prolonged lifespan are expected to hamper the market growth.
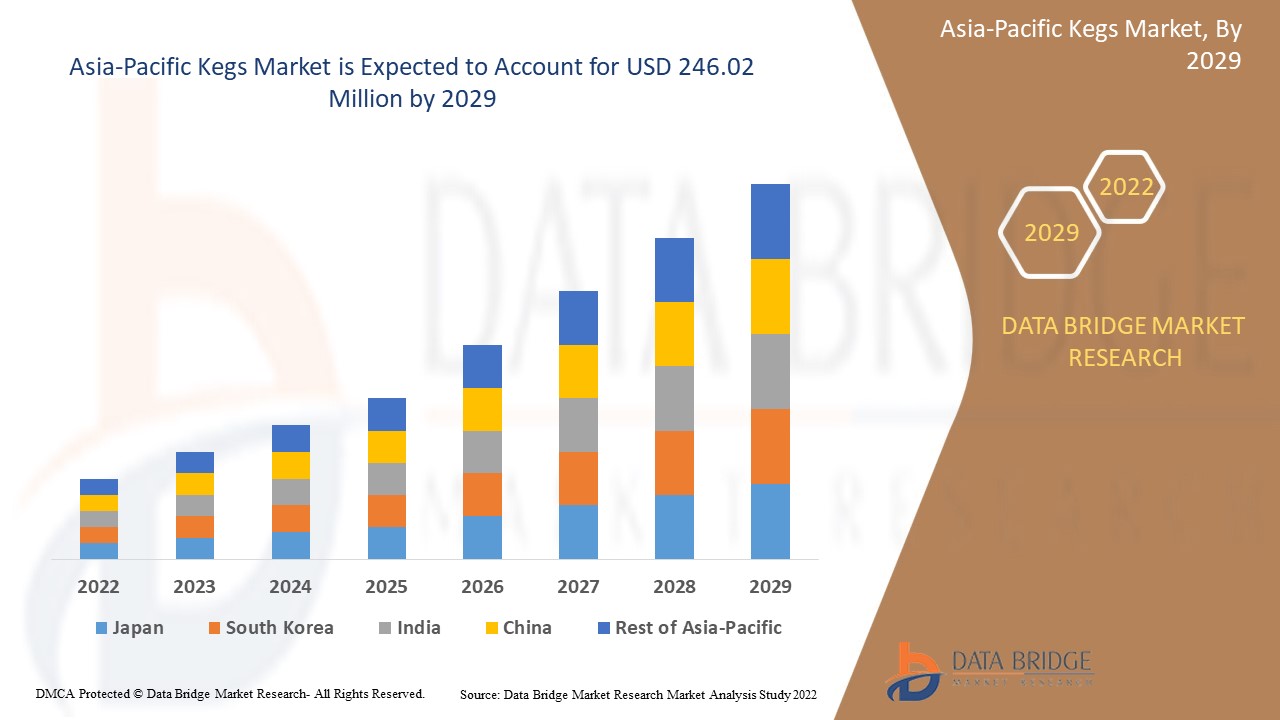
Data Bridge Market Research analyzes that the Asia-Pacific kegs market is expected to reach a value of USD 246.02 million by 2029 with a CAGR of 3.7% during the forecast period.
|
Report Metric |
Details |
|
Forecast Period |
2022 to 2029 |
|
Base Year |
2021 |
|
Historic Year |
2020 (Customizable to 2019 - 2014) |
|
Quantitative Units |
Revenue in USD Million, Volume in Million Units, and Pricing in USD |
|
Segments Covered |
By Material (Plastic, Tin, and Stainless Steel), Capacity (Up To 20 Litre, 20 Litre To 40 Litre, 40 Litre To 60 Litre, and Above 60 Litre), End User (Alcoholic Beverages, Non-Alcoholic Beverages, Cooking Oil, Chemicals, and Others), Distribution Channel (Supermarket/Hypermarket, Commercial Liquor Store, and Others). |
|
Countries Covered |
Japan, China, South Korea, India, Australia & New Zealand, Singapore, Thailand, Indonesia, Malaysia, Philippines, Taiwan, Hong Kong, and rest of Asia-Pacific. |
|
Market Players Covered |
SHINHAN INDUSTRIAL CO,. LTD., BLEFA GmbH, and Petainer Ltd. |
Market Definition
Kegs are little barrels. Beverages, chemicals, oils, and various liquids are transported and stored in kegs constructed with various raw materials. A keg is generally often made of stainless steel, however, aluminum can also be used if it has an interior plastic coating. Beer is frequently transported, served, and stored in it. A keg can also hold additional alcoholic and non-alcoholic beverages that are carbonated or not. It is common practice to maintain the pressure of carbonated beverages to keep carbon dioxide in the solution and prevent the beverage from going flat.
Asia-Pacific Kegs Market Dynamics
This section deals with understanding the market drivers, advantages, opportunities, restraints, and challenges. All of this is discussed in detail below:
DRIVERS
- Growing application of kegs in chemical sectors
A chemical storage keg is a high-quality storage container used by a wide range of industries to hold various types of chemical substances. They are available in a range of forms and sizes and have always been popular. An industrial chemical storage keg is a significant chemical storage system. Because chemicals are corrosive, they must be stored in a secure location. Chemical kegs are chemical storage containers that are frequently utilized in the chemical industry. They are available in a range of sizes and shapes and are used for static storage, processing, mixing, and transportation of both raw materials and finished chemical products.
Nowadays, most keg and chemical enterprises are investing in R&D, which leads to a surge in the applications of kegs in the chemical sector.
For instance,
- In November 2020, Indian Chemical New published an article titled “Role of R&D in Making Chemical Industry Aatma Nirbhar”. It said that according to the most recent statistics available, the Indian Chemical Industry spends roughly 2-3% of its total sales on R&D, compared to 9-10% for MNCs in other nations. According to Oxford Economics, the chemical industry spent USD 51.00 billion on R&D in 2017. China had the highest chemical R&D budget at USD 14.6 billion, followed by the U.S.and Japan at USD 12.10 billion and USD 6.90 billion, respectively. India was rated 7th with USD 1.80 billion investment in R&D in 2017. To compete with the international chemical sector, the industry must make significant investments in R&D. In addition, the Indian government provides numerous tax breaks to stimulate R&D investments.
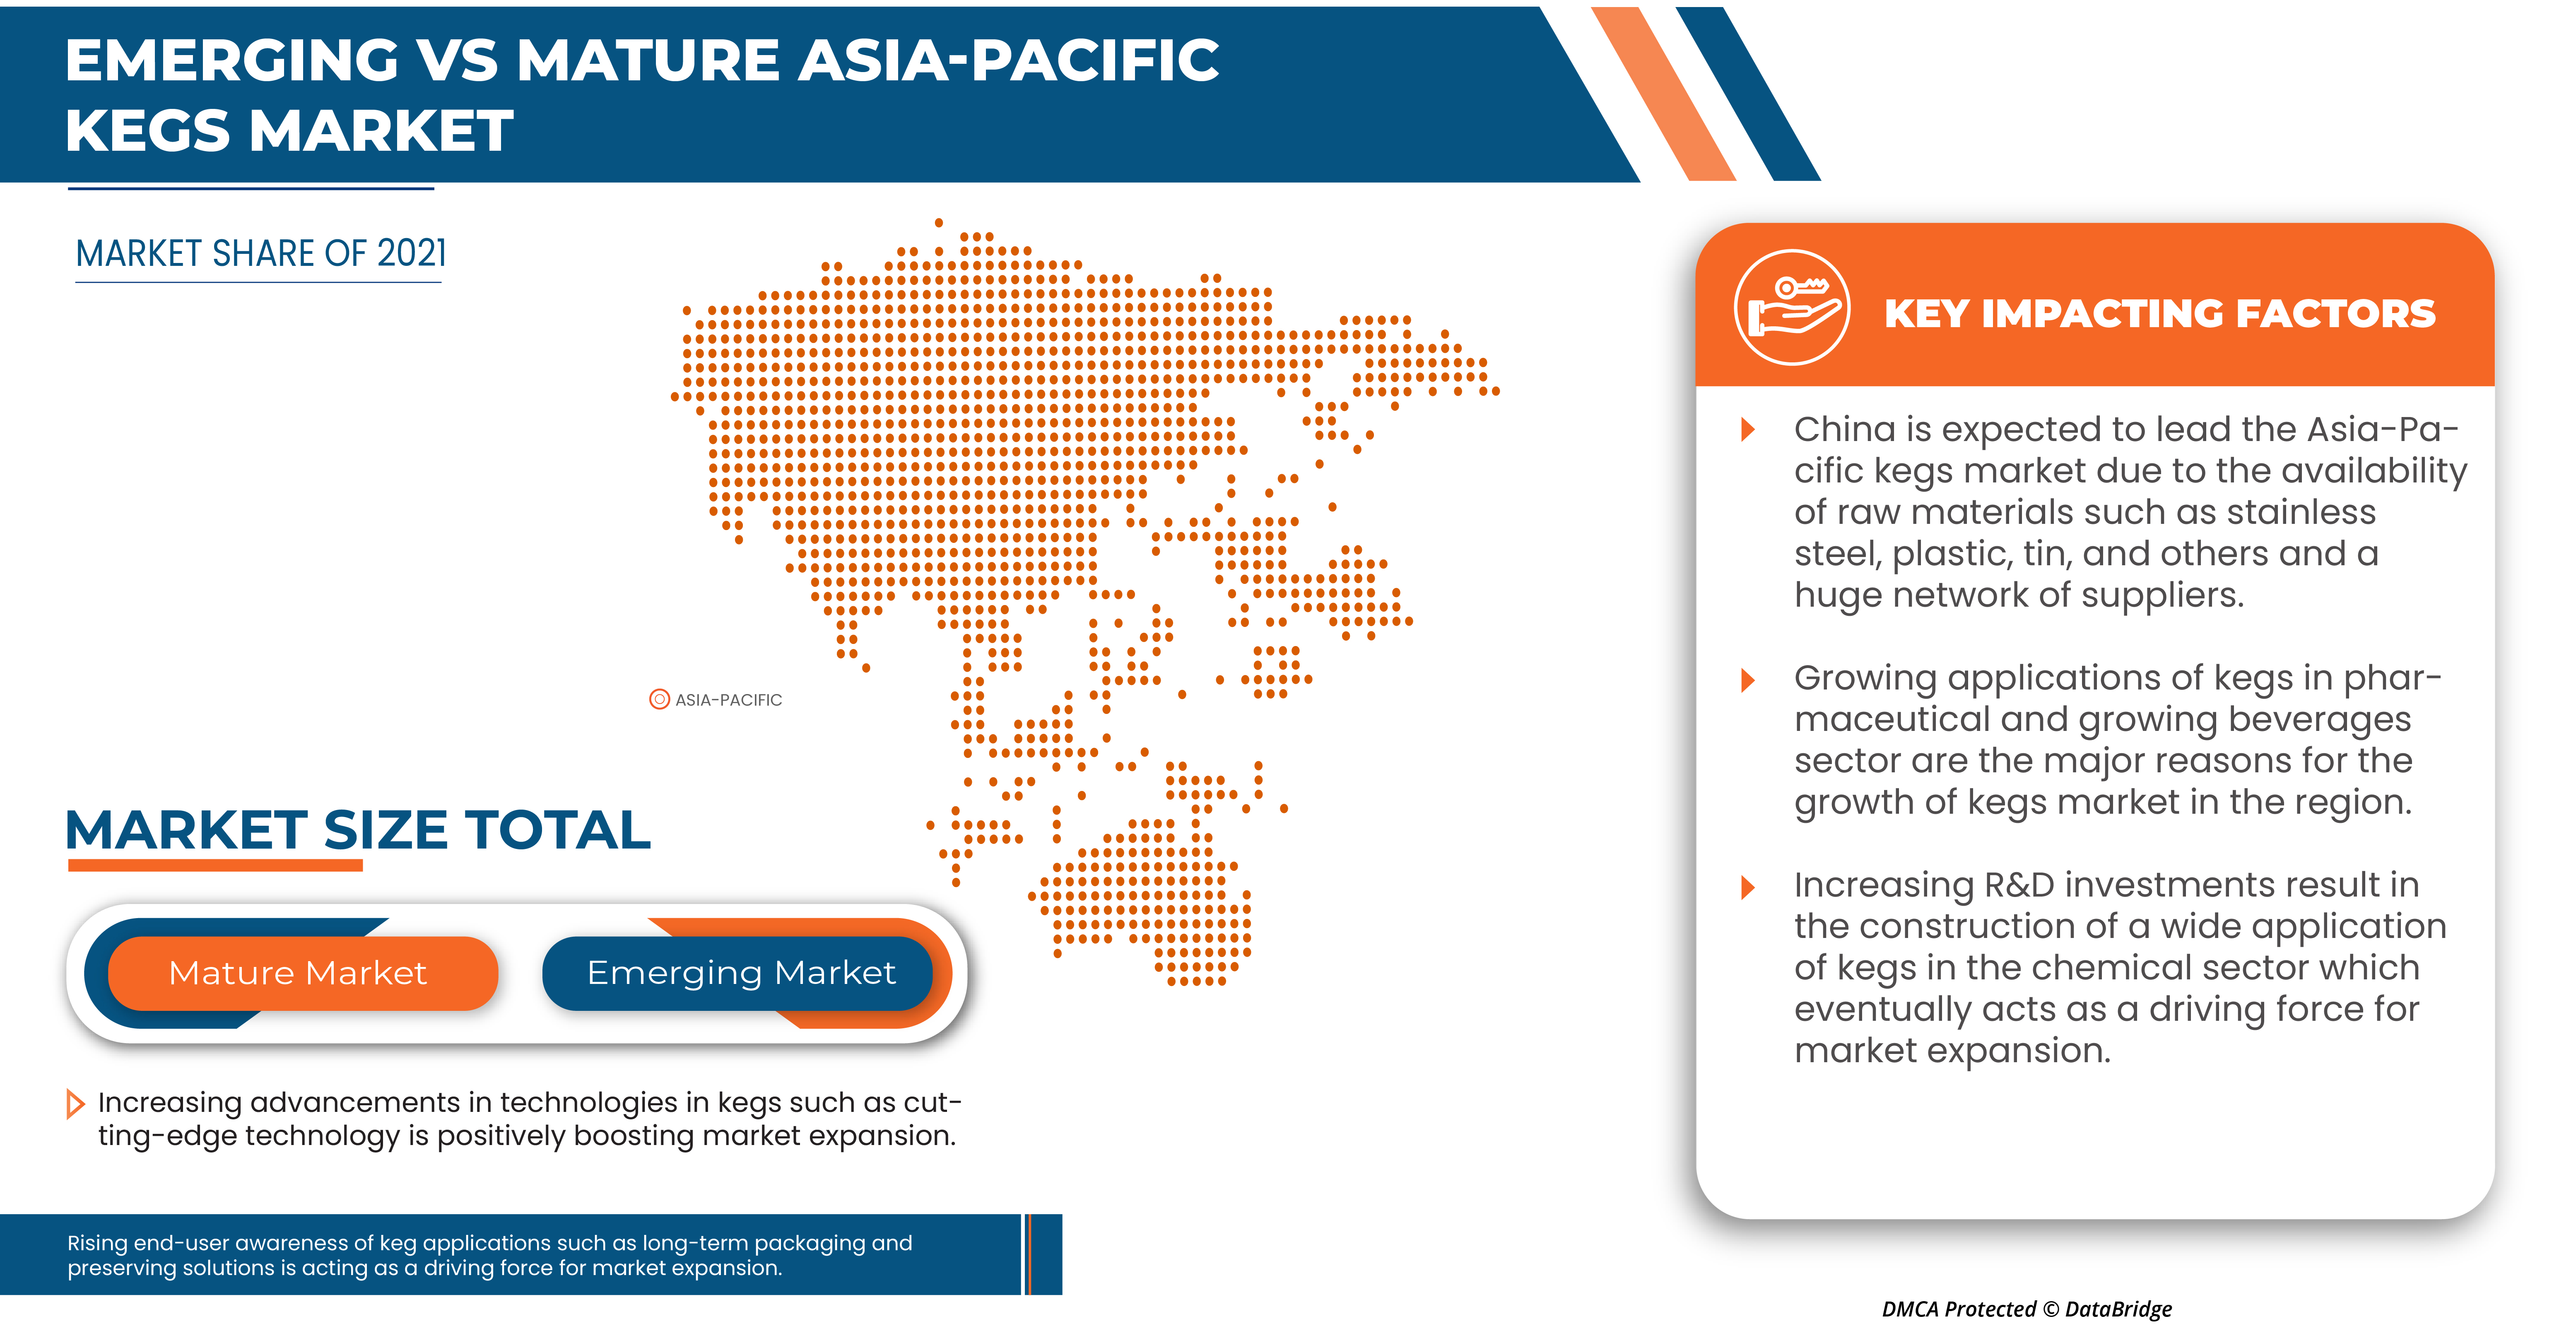
Increasing R&D investments result in the construction of a wide application of kegs in the chemical sector, which eventually acts as a driving force for market expansion.
- Rising trend of long-term packaging and preserving solutions
The use of kegs as a packaging solution in the beverage industry is anticipated to have a promising future. Plastic kegs can be recycled and cost less to send back. On the other hand, keg adoption has expanded as a result of the popularity of kegs encouraging manufacturers to offer kegs for leasing. Single-use kegs are a more economical and effective alternative to traditional steel kegs, and it is anticipated that they will become widely used in near future. Additionally, the microbrew sector is expanding due to consumer enthusiasm for craft ales, which has bolstered the global keg industry. Keg use is anticipated to be encouraged by legislative constraints that favor lower package weight limits. Kegs are also used for preserving the solutions like beverages, oils, and chemicals to preserve the quality and flavor of the product.
For instance,
- In September 2021, Newsmatics Inc. published an article titled “Kegs have Become More Popular as a Promising, Long-term Packaging Solution” and tells that as a packaging option for beverages, kegs are anticipated to have a promising future
Rising end-user awareness of keg applications such as long-term packaging and preserving solutions is driving market growth.
RESTRAINTS
- Slow replacement of kegs due to their prolonged lifespan
Kegs have a longer lifespan, so customers purchase the product less frequently. Since it takes a lot of time to switch from old kegs to new ones, this time lag could act as a barrier to market expansion.
For instance,
- In March 2020, Keg Works published an article entitled “How Long Does a Keg Stay Fresh?”. It mentioned that a keg of pasteurized beer has a shelf life of around 90-120 days (or 3-4 months) and unpasteurized draught beer has a shelf life of about 45-60 days (or 6-8 weeks) when stored at the right temperature
Life span of various kegs is mentioned in the table given below:
|
Product name |
Life span |
|
Wine keg |
6-8 weeks |
|
Unpasteurized beer keg |
6-8 weeks |
|
Pasteurized keg |
3-4 weeks |
|
Cocktail keg |
Approx. 2 months |
|
Cider keg |
6-8 weeks |
Although kegs with a longer lifespan may assist end users, the slowdown replacement of kegs may function as a barrier to the growth of the buying market.
- High cost associated with commercial kegs
A price decline will almost certainly result in new consumers or keg sales. A high price, on the other hand, encourages buyers to buy less products, resulting in loss of sales for the company. The high cost of commercial kegs is a market barrier since end-users cannot afford to continue investing in these commercial kegs. It eventually acts as a barrier to market growth.
For instance,
|
Product name |
Price |
|
Commercial Beer Dispenser Kegerator - 4 Tap Store 4 Kegs |
INR 44,000 |
|
Ball Lock Corny Keg: Home Brew Fermenter |
INR 5,824 |
|
Stainless Steel Beer Barrel Commercial Keg 50 Litres Euro Standard |
USD 55-65/piece |
|
1 galloon, 30 Litres Commercial Brewing Beer Keg with CO2 Regulator |
USD 54.59-56.69/piece |
|
Empty Commercial Brew Customized Keg 30l Stainless Steel Beer Barrel 30l Beer Keg |
USD 44.48-57.65/piece |
The pricing of commercial kegs indicated above is higher, and they are beyond reach for end consumers. As a result, the market expansion will eventually slow down.
OPPORTUNITY
- Increasing advancements in technologies in kegs such as cutting-edge technology
Automation and technological developments have made keg manufacturing more efficient. These facilities may better manage their costs and key systems, thanks to smart keg tracking sensors linked to the Internet of Things (IoT) using both GPS and RFID technology, as well as temperature controls among other things. Keg automation technologies include smart sensors, mobile tablets and smartphones, software, APIs, and cloud databases. Technology-driven automation in kegs among other things enhances fulfillment and improves storage and transportation of alcoholic or non-alcoholic drinks, carbonated or non-carbonated, and other beverages.
The quick increase in R&D and technological progress in keg manufacturing will help in providing an opportunity for market growth and expansion.
As a result, opportunities in the market are anticipated to arise from ongoing technological developments in keg manufacturing.
CHALLENGE
- Growing stiff competition among players
Since there is intense competition among the current kegs industry players, this will result in lower prices and less overall profitability for the sector. Kegs is a highly competitive packaging and container market. The organization's total long-term profitability is affected by this competition. Due to the intense rivalry, businesses primarily concentrate on increasing the number of product releases, campaigns, and marketing to attract consumers. So, this competition among the players will be a challenge for the market.
Companies that produce and supply comparable goods are more competitive with one another, which could threaten the market due to large supply and low demand.
Post-COVID-19 Impact on Asia-Pacific Kegs Market
Post-pandemic, the demand for kegs increased as there were no restrictions on movement, hence, the supply of products was easy. The persistence of COVID-19 for a longer period affected the supply chain as it got disrupted, and it became difficult to supply the food products to the consumers, initially increasing the demand for products. However, post-COVID-19, the demand for kegs increased significantly owing to good nutrient content and other nutritional availability.
Recent Developments
- In May 2021, Lumiere Technologies became BLEFA's new India partner. Lumiere Technologies is based in Bangalore. It is a subsidiary of the SpectraA Group. SpectraA is well-known in the Indian brewery industry because it provides breweries with a complete solution. Similarly, the company provides a comprehensive solution to distilleries, food & beverage establishments, soft drink plants, and other businesses.
Asia-Pacific Kegs Market Scope
The Asia-Pacific kegs market is segmented into four notable segments based on material, capacity, end user, and distribution channel. The growth amongst these segments will help you analyze major growth segments in the industries and provide the users with a valuable market overview and market insights to help them make strategic decisions for identifying core market applications.
Material
- Plastic
- Tin
- Stainless Steel
Based on material, the market is segmented into plastic, tin, and stainless steel.
Capacity
- Up To 20 Litre
- 20 Litre To 40 Litre
- 40 Litre To 60 Litre
- Above 60 Litre
Based on capacity, the market is segmented into up to 20 litre, 20 litre to 40 litre, 40 litre to 60 litre, and above 60 litre.
End User
- Alcoholic Beverages
- Non-Alcoholic Beverages
- Cooking Oil
- Chemicals
- Others
Based on end user, the market is segmented into alcoholic beverages, non-alcoholic beverages, cooking oil, chemicals, and others.
Distribution Channel
- Supermarket/Hypermarket
- Commercial Liquor Store
- Others
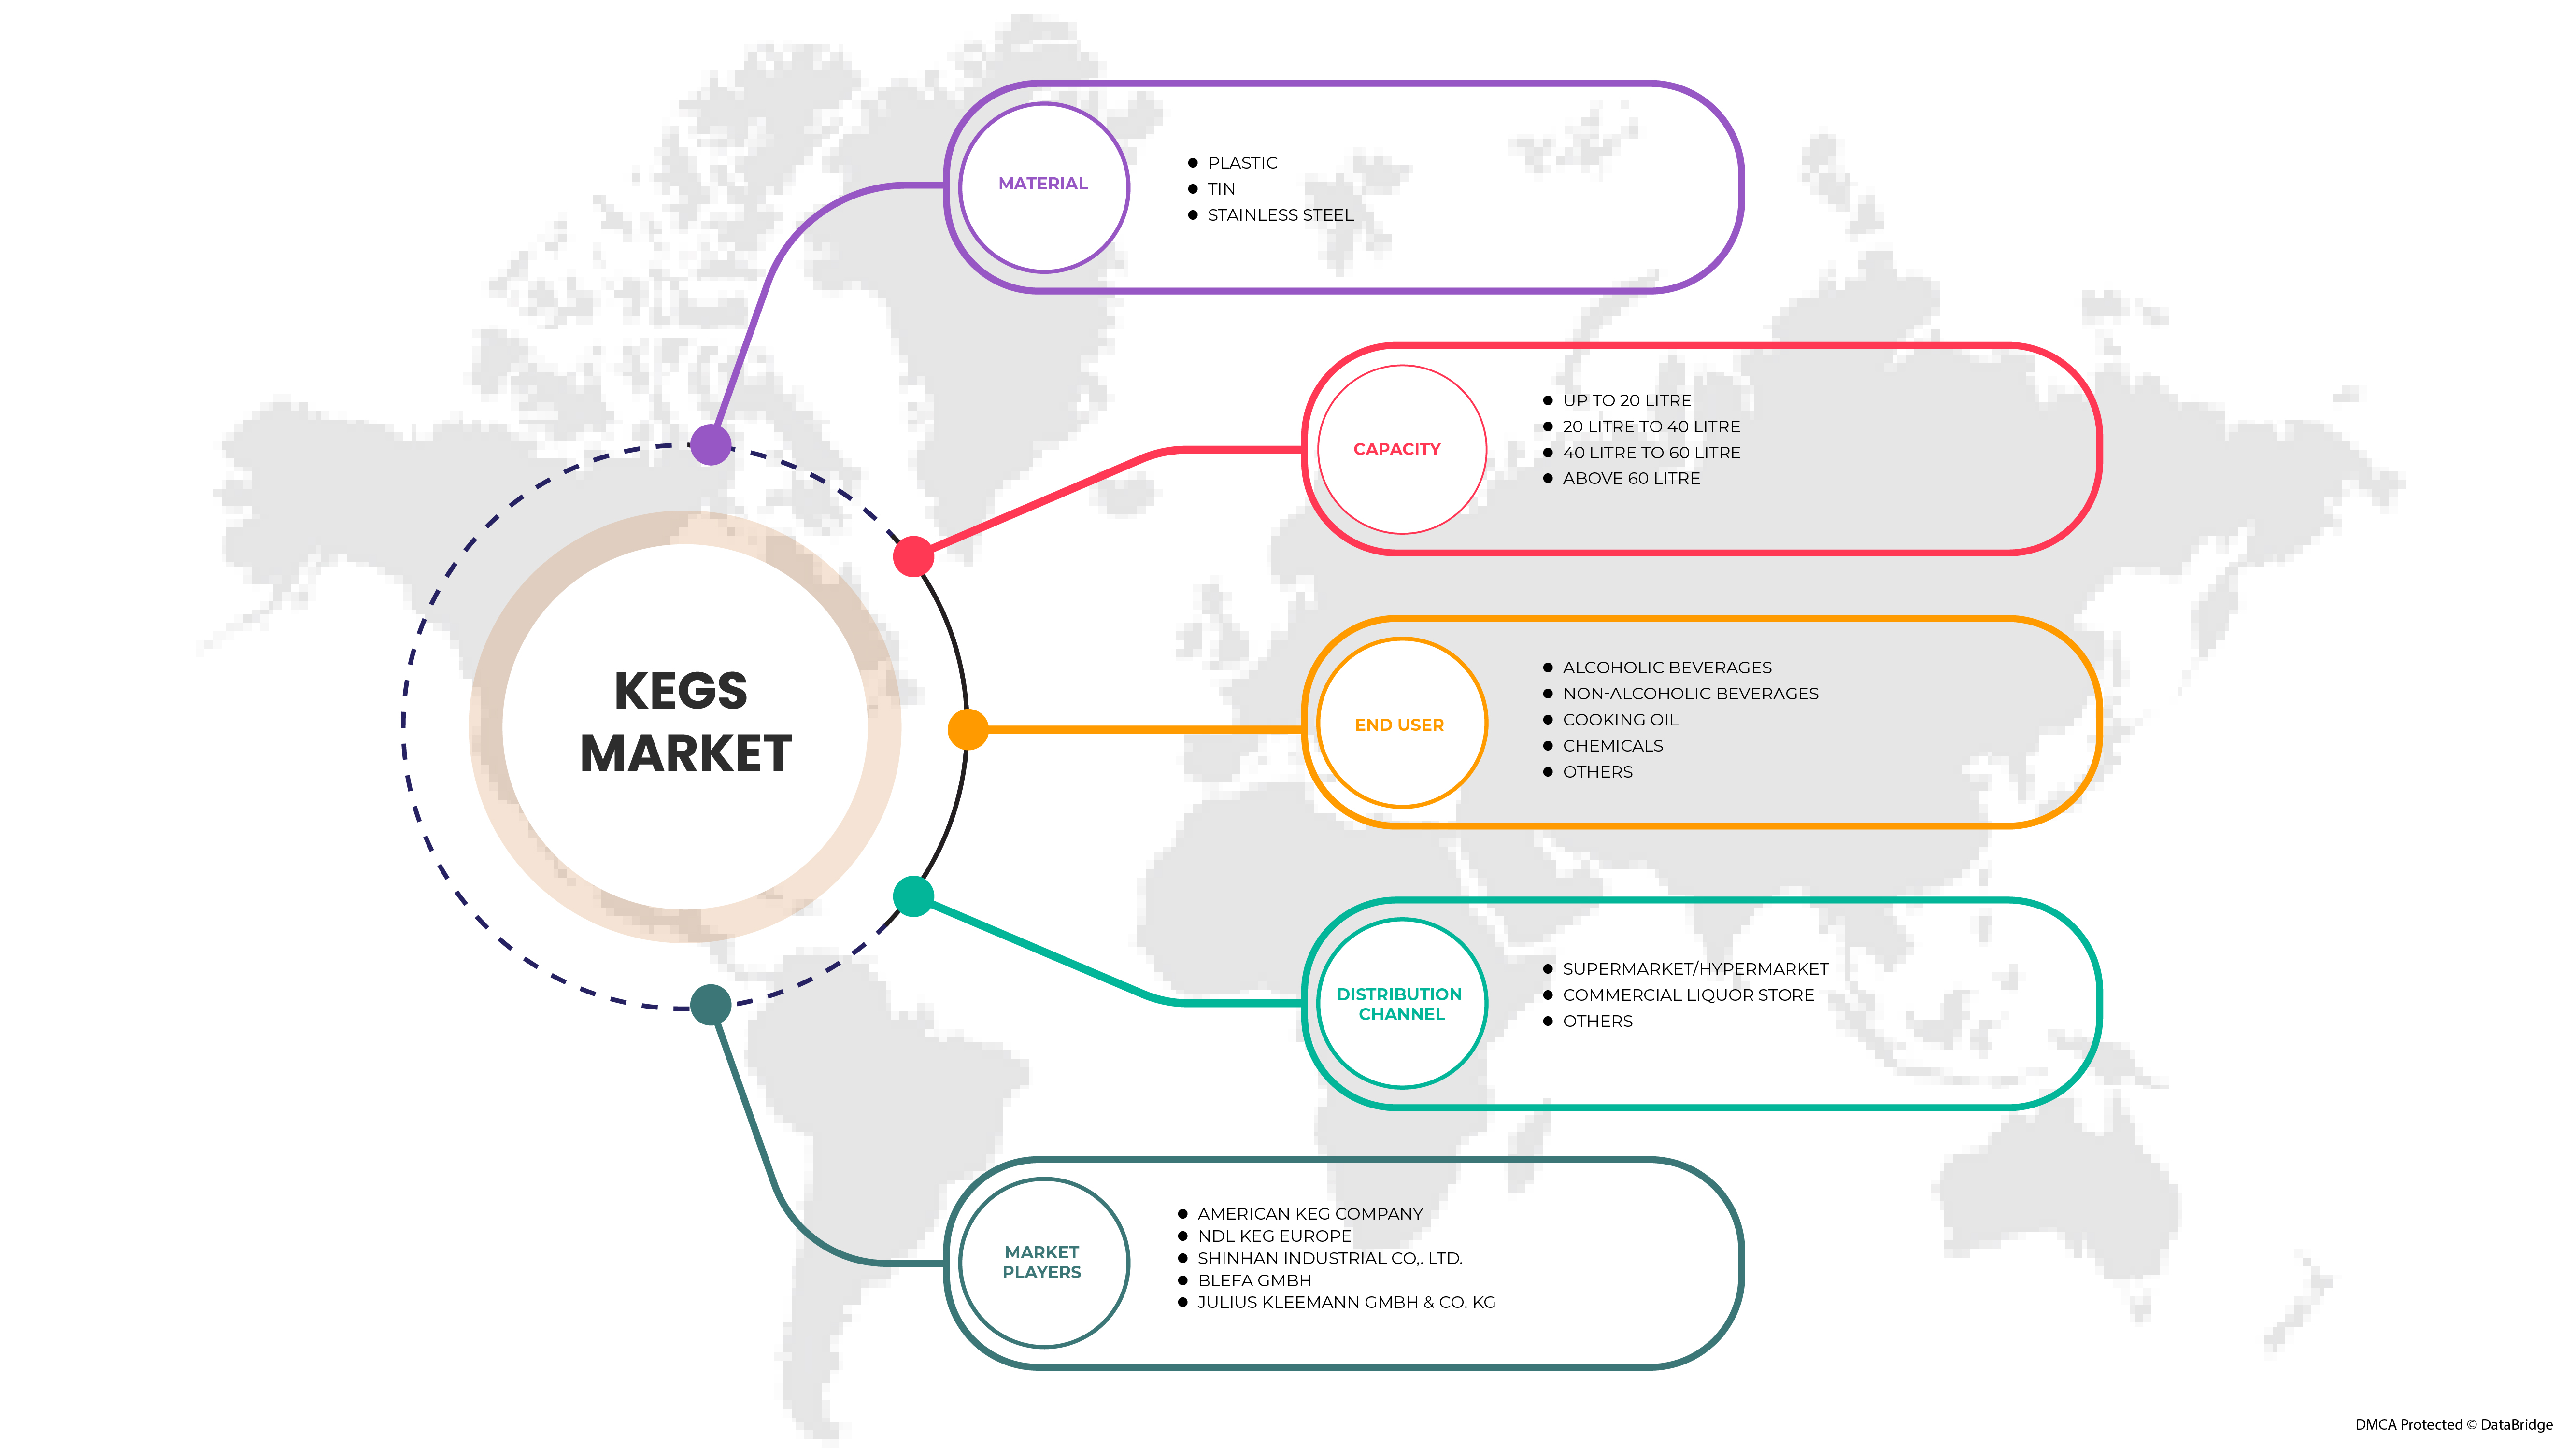
Based on distribution channel, the market is segmented into supermarket/hypermarket, commercial liquor store, and others.
Asia-Pacific Kegs Market Regional Analysis/Insights
The Asia-Pacific kegs market is analyzed and market size insights and trends are provided by country, material, capacity, end user, and distribution channel as referenced above.
The countries covered in this market report are Japan, China, South Korea, India, Australia & New Zealand, Singapore, Thailand, Indonesia, Malaysia, Philippines, Taiwan, Hong Kong, and Rest of Asia-Pacific.
China is dominating the kegs market in Asia-Pacific region. Growing demand for beverages is the major reason for market growth in Asia-Pacific. Moreover, the beverages market is growing progressively in the Asia-Pacific region. The growth of this market will directly impact the growth of the kegs market. However, high cost of commercial kegs is likely to restrict the market growth.
The country section of the report also provides individual market impacting factors and changes in market regulation that impact the current and future trends of the market. Data points like downstream and upstream value chain analysis, technical trends and porter's five forces analysis, and case studies are some of the pointers used to forecast the market scenario for individual countries. Also, the presence and availability of Asia-Pacific brands and the challenges faced due to large or scarce competition from local and domestic brands, and the impact of domestic tariffs and trade routes are considered while providing forecast analysis of the country data.
Competitive Landscape and Asia-Pacific Kegs Market Share Analysis
The Asia-Pacific kegs market competitive landscape provides details by competitor. Details included are company overview, company financials, revenue generated, market potential, investment in R&D, new market initiatives, Asia-Pacific presence, production sites and facilities, production capacities, company strengths and weaknesses, product launch, product width and breadth, and application dominance. The above data points provided are only related to the companies' focus on the market.
Some of the major players operating in the market are SHINHAN INDUSTRIAL CO,. LTD., BLEFA GmbH, and Petainer Ltd. among others.
SKU-
세계 최초의 시장 정보 클라우드 보고서에 온라인으로 접속하세요

- 대화형 데이터 분석 대시보드
- 높은 성장 잠재력 기회를 위한 회사 분석 대시보드
- 사용자 정의 및 질의를 위한 리서치 분석가 액세스
- 대화형 대시보드를 통한 경쟁자 분석
- 최신 뉴스, 업데이트 및 추세 분석
- 포괄적인 경쟁자 추적을 위한 벤치마크 분석의 힘 활용
목차
1 서론
1.1 연구 목적
1.2 시장 정의
1.3 아시아 태평양 케그 시장 개요
1.4 제한 사항
1.5 대상 시장
2 시장 세분화
2.1 대상 시장
2.2 지리적 범위
연구에 2.3년이 고려됨
2.4 통화 및 가격
2.5 DBMR TRIPOD 데이터 검증 모델
2.6 다변량 모델링
2.7 재료 수명선 곡선
2.8 주요 여론 선도자와의 1차 인터뷰
2.9 DBMR 시장 위치 그리드
2.1 공급업체 점유율 분석
2.11 2차 소스
2.12 가정
3 요약
4가지 프리미엄 인사이트
4.1 PESTEL 분석
4.2 포터의 5가지 힘 분석
4.3 수출입 분석
4.4 주요 구매자 목록
4.5 생산 소비 분석
4.6 제조업체의 기술적 발전
4.7 원자재 생산 범위
5 규정 적용 범위
6 기후 변화 시나리오
7 공급망 분석
7.1 원자재
7.2 공급/제조
7.3 배포
7.4 최종 사용자
8 시장 개요
8.1 드라이버
8.1.1 장기 포장 및 보존 솔루션의 증가 추세
8.1.2 점진적인 라이프스타일 변화로 인한 음료 소비 증가
8.1.3 화학 분야에서 케그의 적용 확대
8.2 제약
8.2.1 상업용 통과 관련된 높은 비용
8.2.2 수명이 길어져 케그 교체가 느림
8.3 기회
8.3.1 지속 가능성 추세로 인해 친환경 통에 대한 수요 증가
8.3.2 최첨단 기술과 같은 케그 기술의 발전 증가
8.4 과제
8.4.1 원자재 가격의 급격한 변동
8.4.2 플레이어 간의 치열한 경쟁 증가
9 아시아 태평양 케그 시장, 재료별
9.1 개요
9.2 스테인리스 스틸
9.3 플라스틱
9.4 주석
10 아시아 태평양 케그 시장, 용량별
10.1 개요
10.2 40리터에서 60리터로
10.3 20리터에서 40리터로
10.4 60리터 이상
10.5 최대 20리터
11 아시아 태평양 케그 시장, 최종 사용자별
11.1 개요
11.2 알코올 음료
11.2.1 맥주
11.2.2 와인
11.2.3 영혼
11.2.4 사이다
11.3 비알코올 음료
11.3.1 청량음료
11.3.2 RTD 음료
11.3.3 주스
11.3.4 기타
11.4 화학물질
11.5 식용유
11.6 기타
12 아시아 태평양 케그 시장, 유통 채널별
12.1 개요
12.2 상업용 주류 매장
12.3 슈퍼마켓 / 하이퍼마켓
12.4 기타
13 아시아 태평양 케그 시장, 지역별
13.1 아시아 태평양
13.1.1 중국
13.1.2 호주 및 뉴질랜드
13.1.3 일본
13.1.4 인도
13.1.5 대한민국
13.1.6 태국
13.1.7 필리핀
13.1.8 싱가포르
13.1.9 말레이시아
13.1.10 대만
13.1.11 인도네시아
13.1.12 홍콩
13.1.13 아시아 태평양의 나머지 지역
14 회사 전경
14.1 회사 점유율 분석: 아시아 태평양
15 SWOT 분석
16개 회사 프로필
16.1 블레파 주식회사
16.1.1 회사 스냅샷
16.1.2 회사 점유율 분석
16.1.3 제품 포트폴리오
16.1.4 최근 개발 사항
16.2 페타이너 유한회사
16.2.1 회사 스냅샷
16.2.2 회사 점유율 분석
16.2.3 제품 포트폴리오
16.2.4 최근 개발
16.3 JULIUS KLEEMANN GMBH & CO. KG
16.3.1 회사 스냅샷
16.3.2 회사 점유율 분석
16.3.3 제품 포트폴리오
16.3.4 최근 개발
16.4 NDL 케그 유럽
16.4.1 회사 스냅샷
16.4.2 회사 점유율 분석
16.4.3 제품 포트폴리오
16.4.4 최근 개발
16.5 뉴 메조네브 케그
16.5.1 회사 스냅샷
16.5.2 회사 점유율 분석
16.5.3 제품 포트폴리오
16.5.4 최근 개발
16.6 아메리칸 케그 컴퍼니
16.6.1 회사 스냅샷
16.6.2 제품 포트폴리오
16.6.3 최근 개발
16.7 키케그
16.7.1 회사 스냅샷
16.7.2 제품 포트폴리오
16.7.3 최근 개발 사항
16.8 SCHAEFER 컨테이너 시스템
16.8.1 회사 스냅샷
16.8.2 제품 포트폴리오
16.8.3 최근 개발
16.9 신한산업(주)
16.9.1 회사 스냅샷
16.9.2 제품 포트폴리오
16.9.3 최근 개발
16.1 SUPERMONTE GROUP 이탈리아 주식회사
16.10.1 회사 스냅샷
16.10.2 제품 포트폴리오
16.10.3 최근 개발
16.11 메탈 드럼 회사
16.11.1 회사 스냅샷
16.11.2 제품 포트폴리오
16.11.3 최근 개발
17 설문지
18 관련 보고서
표 목록
표 1 2020-2021년 통 수입량(백만 달러)
표 2 통(나무통, 통, 통통 ...
표 3 아시아 태평양 케그 시장, 재료별, 2020-2029년(백만 달러)
표 4 아시아 태평양 케그 시장, 재료별, 2020-2029(천 개)
표 5 아시아 태평양 스테인리스 스틸 케그 시장, 지역별, 2020-2029 (백만 달러)
표 6 아시아 태평양 스테인리스 스틸 케그 시장, 지역별, 2020-2029 (천 개)
표 7 아시아 태평양 플라스틱 통 시장, 지역별, 2020-2029년(백만 달러)
표 8 아시아 태평양 플라스틱 통 시장, 지역별, 2020-2029 (천 개)
표 9 아시아 태평양 통에 담긴 주석 시장, 지역별, 2020-2029년(백만 달러)
표 10 아시아 태평양 통에 담긴 주석 시장, 지역별, 2020-2029 (천 개)
표 11 아시아 태평양 케그 시장, 용량별, 2020-2029 (백만 달러)
표 12 아시아 태평양 케그 시장, 용량별, 2020-2029 (천 단위)
표 13 아시아 태평양 40리터~60리터 케그 시장, 지역별, 2020-2029년(백만 달러)
표 14 아시아 태평양 40리터~60리터 케그 시장, 지역별, 2020-2029년(천 개)
표 15 아시아 태평양 20리터~40리터 케그 시장, 지역별, 2020~2029년(백만 달러)
표 16 아시아 태평양 20리터~40리터 케그 시장, 지역별, 2020~2029년(천 개)
표 17 아시아 태평양 지역 60리터 이상 케그 시장, 지역별, 2020-2029년(백만 달러)
표 18 아시아 태평양 지역 60리터 이상 케그 시장, 지역별, 2020-2029(천 개)
표 19 아시아 태평양 최대 20리터 케그 시장, 지역별, 2020-2029년(백만 달러)
표 20 아시아 태평양 최대 20리터 케그 시장, 지역별, 2020-2029(천 개)
표 21 아시아 태평양 케그 시장, 최종 사용자별, 2020-2029년(백만 달러)
표 22 아시아 태평양 케그 시장, 최종 사용자별, 2020-2029(천 개)
표 23 아시아 태평양 알코올 음료 케그 시장, 지역별, 2020-2029 (백만 달러)
표 24 아시아 태평양 알코올 음료 케그 시장, 지역별, 2020-2029 (천 단위)
표 25 아시아 태평양 알코올 음료 케그 시장, 최종 사용자별, 2020-2029 (백만 달러)
표 26 아시아 태평양 알코올 음료 케그 시장, 최종 사용자별, 2020-2029(천 단위)
표 27 아시아 태평양 지역 비알코올 음료 케그 시장, 지역별, 2020-2029년(백만 달러)
표 28 아시아 태평양 비알코올 음료 케그 시장, 지역별, 2020-2029 (천 단위)
표 29 아시아 태평양 비알코올 음료 케그 시장, 최종 사용자별, 2020-2029년(백만 달러)
표 30 아시아 태평양 비알코올 음료 케그 시장, 최종 사용자별, 2020-2029(천 단위)
표 31 아시아 태평양 케그 시장 화학 물질, 지역별, 2020-2029 (백만 달러)
표 32 아시아 태평양 케그 시장 화학 물질, 지역별, 2020-2029 (천 단위)
표 33 아시아 태평양 지역별 통 속 식용유 시장, 2020-2029년 (백만 달러)
표 34 아시아 태평양 지역별 통에 담긴 식용유 시장, 2020-2029년(천 단위)
표 35 아시아 태평양 기타 케그 시장, 지역별, 2020-2029 (백만 달러)
표 36 아시아 태평양 기타 케그 시장, 지역별, 2020-2029 (천 개)
표 37 아시아 태평양 케그 시장, 유통 채널별, 2020-2029년(백만 달러)
표 38 아시아 태평양 케그 시장, 유통 채널별, 2020-2029(천 대)
표 39 아시아 태평양 상업용 주류 저장고 시장, 지역별, 2020-2029년 (백만 달러)
표 40 아시아 태평양 상업용 주류 저장고 시장, 지역별, 2020-2029 (천 개)
표 41 아시아 태평양 슈퍼마켓/하이퍼마켓 케그 시장, 지역별, 2020-2029 (백만 달러)
표 42 아시아 태평양 슈퍼마켓/하이퍼마켓 케그 시장, 지역별, 2020-2029 (천 개)
표 43 아시아 태평양 기타 케그 시장, 지역별, 2020-2029 (백만 달러)
표 44 아시아 태평양 기타 케그 시장, 지역별, 2020-2029 (천 개)
표 45 아시아 태평양 케그 시장, 국가별, 2020-2029 (백만 달러)
표 46 아시아 태평양 케그 시장, 국가별, 2020-2029(천 개)
표 47 아시아 태평양 케그 시장, 재료별, 2020-2029년(백만 달러)
표 48 아시아 태평양 케그 시장, 재료별, 2020-2029(천 개)
표 49 아시아 태평양 케그 시장, 용량별, 2020-2029 (백만 달러)
표 50 아시아 태평양 케그 시장, 용량별, 2020-2029 (천 단위)
표 51 아시아 태평양 케그 시장, 최종 사용자별, 2020-2029년(백만 달러)
표 52 아시아 태평양 케그 시장, 최종 사용자별, 2020-2029(천 개)
표 53 아시아 태평양 케그 시장 내 알코올 음료, 최종 사용자별, 2020-2029년(백만 달러)
표 54 아시아 태평양 알코올 음료 케그 시장, 최종 사용자별, 2020-2029(천 단위)
표 55 아시아 태평양 비알코올 음료 케그 시장, 최종 사용자별, 2020-2029년(백만 달러)
표 56 아시아 태평양 비알코올 음료 케그 시장, 최종 사용자별, 2020-2029(천 단위)
표 57 아시아 태평양 케그 시장, 유통 채널별, 2020-2029년(백만 달러)
표 58 아시아 태평양 케그 시장, 유통 채널별, 2020-2029(천 대)
표 59 중국 케그 시장, 재료별, 2020-2029 (백만 달러)
표 60 중국 케그 시장, 재료별, 2020-2029 (천 개)
표 61 중국 케그 시장, 용량별, 2020-2029 (백만 달러)
표 62 중국 케그 시장, 용량별, 2020-2029 (천 단위)
표 63 중국 케그 시장, 최종 사용자별, 2020-2029년(백만 달러)
표 64 중국 케그 시장, 최종 사용자별, 2020-2029(천 개)
표 65 최종 사용자별 케그 시장 내 중국 알코올 음료, 2020-2029년(백만 달러)
표 66 최종 사용자별 케그 시장 내 중국 알코올 음료, 2020-2029년(천 단위)
표 67 최종 사용자별 중국 케그 비알코올 음료 시장, 2020-2029년(백만 달러)
표 68 최종 사용자별 중국 케그 시장 비알코올 음료, 2020-2029(천 단위)
표 69 중국 케그 시장, 유통 채널별, 2020-2029년(백만 달러)
표 70 중국 케그 시장, 유통 채널별, 2020-2029년(천 대)
표 71 호주 및 뉴질랜드 케그 시장, 재료별, 2020-2029(백만 달러)
표 72 호주 및 뉴질랜드 케그 시장, 재료별, 2020-2029(천 개)
표 73 호주 및 뉴질랜드 케그 시장, 용량별, 2020-2029(백만 달러)
표 74 호주 및 뉴질랜드 케그 시장, 용량별, 2020-2029(천 개)
표 75 호주 및 뉴질랜드 케그 시장, 최종 사용자별, 2020-2029(백만 달러)
표 76 호주 및 뉴질랜드 케그 시장, 최종 사용자별, 2020-2029(천 개)
표 77 최종 사용자별 케그 시장 내 호주 및 뉴질랜드 알코올 음료, 2020-2029년(백만 달러)
표 78 최종 사용자별 케그 시장 내 호주 및 뉴질랜드 알코올 음료, 2020-2029(천 단위)
표 79 최종 사용자별 케그 시장의 호주 및 뉴질랜드 비알코올 음료, 2020-2029년(백만 달러)
표 80 최종 사용자별 케그 시장의 호주 및 뉴질랜드 비알코올 음료, 2020-2029년(천 단위)
표 81 호주 및 뉴질랜드 케그 시장, 유통 채널별, 2020-2029년(백만 달러)
표 82 호주 및 뉴질랜드 케그 시장, 유통 채널별, 2020-2029(천 개)
표 83 일본 케그 시장, 재료별, 2020-2029 (백만 달러)
표 84 일본 케그 시장, 재료별, 2020-2029(천 개)
표 85 일본 케그 시장, 용량별, 2020-2029 (백만 달러)
표 86 일본 케그 시장, 용량별, 2020-2029 (천 개)
표 87 최종 사용자별 일본 케그 시장, 2020-2029년(백만 달러)
표 88 최종 사용자별 일본 케그 시장, 2020-2029(천 대)
표 89 최종 사용자별 케그 시장 내 일본 알코올 음료, 2020-2029년(백만 달러)
표 90 최종 사용자별 케그 시장 내 일본 알코올 음료, 2020-2029(천 단위)
표 91 최종 사용자별 케그 시장 내 일본 비알코올 음료, 2020-2029년(백만 달러)
표 92 최종 사용자별 케그 시장 내 일본 비알코올 음료, 2020-2029년(천 개)
표 93 유통 채널별 일본 케그 시장, 2020-2029년(백만 달러)
표 94 일본 케그 시장, 유통 채널별, 2020-2029(천 대)
표 95 인도 케그 시장, 재료별, 2020-2029 (백만 달러)
표 96 인도 케그 시장, 재료별, 2020-2029(천 개)
표 97 인도 케그 시장, 용량별, 2020-2029 (백만 달러)
표 98 인도 케그 시장, 용량별, 2020-2029(천 개)
표 99 인도 케그 시장, 최종 사용자별, 2020-2029년(백만 달러)
표 100 인도 케그 시장, 최종 사용자별, 2020-2029(천 개)
표 101 최종 사용자별 인도 케그 알코올 음료 시장, 2020-2029년(백만 달러)
표 102 최종 사용자별 인도 케그 시장 알코올 음료, 2020-2029(천 단위)
표 103 최종 사용자별 인도 케그 시장 비알코올 음료, 2020-2029년(백만 달러)
표 104 인도 케그 시장 내 비알코올 음료, 최종 사용자별, 2020-2029년(천 개)
표 105 인도 케그 시장, 유통 채널별, 2020-2029년(백만 달러)
표 106 인도 케그 시장, 유통 채널별, 2020-2029년(천 개)
표 107 한국 케그 시장, 재료별, 2020-2029 (백만 달러)
표 108 한국 케그 시장, 재료별, 2020-2029 (천 개)
표 109 한국 케그 시장, 용량별, 2020-2029 (백만 달러)
표 110 한국 케그 시장, 용량별, 2020-2029 (천 단위)
표 111 한국 케그 시장, 최종 사용자별, 2020-2029 (백만 달러)
표 112 최종 사용자별 한국 케그 시장, 2020-2029(천 개)
표 113 최종 사용자별 케그 시장 내 한국 알코올 음료, 2020-2029년(백만 달러)
표 114 한국 알코올 음료 케그 시장, 최종 사용자별, 2020-2029 (천 단위)
표 115 최종 사용자별 케그 시장 내 한국 비알코올 음료, 2020-2029년(백만 달러)
표 116 한국 비알코올 음료 케그 시장, 최종 사용자별, 2020-2029 (천 단위)
표 117 유통 채널별 한국 케그 시장, 2020-2029년(백만 달러)
표 118 유통 채널별 한국 케그 시장, 2020-2029년(천 대)
표 119 태국 케그 시장, 재료별, 2020-2029 (백만 달러)
표 120 태국 케그 시장, 재료별, 2020-2029(천 개)
표 121 태국 케그 시장, 용량별, 2020-2029 (백만 달러)
표 122 태국 케그 시장, 용량별, 2020-2029 (천 개)
표 123 태국 케그 시장, 최종 사용자별, 2020-2029(백만 달러)
표 124 태국 케그 시장, 최종 사용자별, 2020-2029(천 개)
표 125 최종 사용자별 케그 시장 내 태국 알코올 음료, 2020-2029년(백만 달러)
표 126 최종 사용자별 케그 시장 내 태국 알코올 음료, 2020-2029(천 단위)
표 127 태국 케그 시장 내 비알코올 음료, 최종 사용자별, 2020-2029년(백만 달러)
표 128 태국 케그 시장 내 비알코올 음료, 최종 사용자별, 2020-2029년(천 개)
표 129 태국 케그 시장, 유통 채널별, 2020-2029 (백만 달러)
표 130 태국 케그 시장, 유통 채널별, 2020-2029(천 개)
표 131 필리핀 케그 시장, 재료별, 2020-2029 (백만 달러)
표 132 필리핀 케그 시장, 재료별, 2020-2029(천 개)
표 133 필리핀 케그 시장, 용량별, 2020-2029 (백만 달러)
표 134 필리핀 케그 시장, 용량별, 2020-2029 (천 단위)
표 135 필리핀 케그 시장, 최종 사용자별, 2020-2029(백만 달러)
표 136 필리핀 케그 시장, 최종 사용자별, 2020-2029(천 개)
표 137 필리핀 케그 시장 알코올 음료, 최종 사용자별, 2020-2029 (백만 달러)
표 138 필리핀 케그 시장 알코올 음료, 최종 사용자별, 2020-2029(천 단위)
표 139 필리핀 케그 시장 내 비알코올 음료, 최종 사용자별, 2020-2029년(백만 달러)
표 140 필리핀 케그 시장 내 비알코올 음료, 최종 사용자별, 2020-2029년(천 단위)
표 141 필리핀 케그 시장, 유통 채널별, 2020-2029년(백만 달러)
표 142 필리핀 케그 시장, 유통 채널별, 2020-2029(천 개)
표 143 싱가포르 케그 시장, 재료별, 2020-2029 (백만 달러)
표 144 싱가포르 케그 시장, 재료별, 2020-2029(천 개)
표 145 싱가포르 케그 시장, 용량별, 2020-2029 (백만 달러)
표 146 싱가포르 케그 시장, 용량별, 2020-2029 (천 개)
표 147 싱가포르 케그 시장, 최종 사용자별, 2020-2029(백만 달러)
표 148 싱가포르 케그 시장, 최종 사용자별, 2020-2029(천 개)
표 149 싱가포르 케그 시장 알코올 음료, 최종 사용자별, 2020-2029 (백만 달러)
표 150 싱가포르 케그 시장 알코올 음료, 최종 사용자별, 2020-2029(천 단위)
표 151 싱가포르 케그 시장 내 비알코올 음료, 최종 사용자별, 2020-2029년(백만 달러)
표 152 싱가포르 케그 시장 내 비알코올 음료, 최종 사용자별, 2020-2029년(천 단위)
표 153 싱가포르 케그 시장, 유통 채널별, 2020-2029년(백만 달러)
표 154 싱가포르 케그 시장, 유통 채널별, 2020-2029년(천 개)
표 155 말레이시아 케그 시장, 재료별, 2020-2029년(백만 달러)
표 156 말레이시아 케그 시장, 재료별, 2020-2029(천 개)
표 157 말레이시아 케그 시장, 용량별, 2020-2029 (백만 달러)
표 158 말레이시아 케그 시장, 용량별, 2020-2029 (천 개)
표 159 말레이시아 케그 시장, 최종 사용자별, 2020-2029(백만 달러)
표 160 말레이시아 케그 시장, 최종 사용자별, 2020-2029(천 개)
표 161 말레이시아 케그 시장 알코올 음료, 최종 사용자별, 2020-2029년(백만 달러)
표 162 말레이시아 케그 시장 알코올 음료, 최종 사용자별, 2020-2029(천 단위)
표 163 최종 사용자별 말레이시아 케그 비알코올 음료 시장, 2020-2029년(백만 달러)
표 164 말레이시아 케그 시장 내 비알코올 음료, 최종 사용자별, 2020-2029년(천 개)
표 165 말레이시아 케그 시장, 유통 채널별, 2020-2029년(백만 달러)
표 166 말레이시아 케그 시장, 유통 채널별, 2020-2029(천 개)
표 167 대만 케그 시장, 재료별, 2020-2029 (백만 달러)
표 168 대만 케그 시장, 재료별, 2020-2029 (천 개)
표 169 대만 케그 시장, 용량별, 2020-2029 (백만 달러)
표 170 대만 케그 시장, 용량별, 2020-2029 (천 단위)
표 171 대만 케그 시장, 최종 사용자별, 2020-2029(백만 달러)
표 172 대만 케그 시장, 최종 사용자별, 2020-2029(천 개)
표 173 최종 사용자별 대만 케그 시장 알코올 음료, 2020-2029년(백만 달러)
표 174 대만의 케그 시장 알코올 음료, 최종 사용자별, 2020-2029(천 단위)
표 175 대만의 케그 시장 내 비알코올 음료, 최종 사용자별, 2020-2029년(백만 달러)
표 176 대만의 케그 시장 내 비알코올 음료, 최종 사용자별, 2020-2029년(천 개)
표 177 대만 케그 시장, 유통 채널별, 2020-2029년(백만 달러)
표 178 대만 케그 시장, 유통 채널별, 2020-2029 (천 개)
표 179 인도네시아 케그 시장, 재료별, 2020-2029 (백만 달러)
표 180 인도네시아 케그 시장, 재료별, 2020-2029(천 개)
표 181 인도네시아 케그 시장, 용량별, 2020-2029 (백만 달러)
표 182 인도네시아 케그 시장, 용량별, 2020-2029(천 단위)
표 183 인도네시아 케그 시장, 최종 사용자별, 2020-2029(백만 달러)
표 184 인도네시아 케그 시장, 최종 사용자별, 2020-2029(천 개)
표 185 인도네시아 케그 시장 알코올 음료, 최종 사용자별, 2020-2029(백만 달러)
표 186 인도네시아 케그 시장 알코올 음료, 최종 사용자별, 2020-2029(천 단위)
표 187 인도네시아 케그 시장 내 비알코올 음료, 최종 사용자별, 2020-2029년(백만 달러)
표 188 인도네시아 케그 시장 내 비알코올 음료, 최종 사용자별, 2020-2029년(천 단위)
표 189 인도네시아 케그 시장, 유통 채널별, 2020-2029년(백만 달러)
표 190 인도네시아 케그 시장, 유통 채널별, 2020-2029(천 개)
표 191 홍콩 케그 시장, 재료별, 2020-2029 (백만 달러)
표 192 홍콩 케그 시장, 재료별, 2020-2029(천 개)
표 193 홍콩 케그 시장, 용량별, 2020-2029 (백만 달러)
표 194 홍콩 케그 시장, 용량별, 2020-2029 (천 개)
표 195 홍콩 케그 시장, 최종 사용자별, 2020-2029(백만 달러)
표 196 홍콩 케그 시장, 최종 사용자별, 2020-2029(천 개)
표 197 홍콩 케그 시장 내 알코올 음료, 최종 사용자별, 2020-2029년(백만 달러)
표 198 홍콩 케그 시장 내 알코올 음료, 최종 사용자별, 2020-2029년(천 단위)
표 199 홍콩 케그 시장 내 비알코올 음료, 최종 사용자별, 2020-2029년(백만 달러)
표 200 홍콩 케그 시장 내 비알코올 음료, 최종 사용자별, 2020-2029년(천 개)
표 201 홍콩 케그 시장, 유통 채널별, 2020-2029년(백만 달러)
표 202 홍콩 케그 시장, 유통 채널별, 2020-2029 (천 대)
표 203 아시아 태평양 케그 시장 나머지 지역, 재료별, 2020-2029년(백만 달러)
그림 목록
그림 1 아시아 태평양 케그 시장: 세분화
그림 2 아시아 태평양 케그 시장: 데이터 삼각 측량
그림 3 아시아 태평양 케그 시장: DROC 분석
그림 4 아시아 태평양 케그 시장: 아시아 태평양 대 지역 분석
그림 5 아시아 태평양 케그 시장: 회사 연구 분석
그림 6 아시아 태평양 케그 시장: 인터뷰 인구 통계
그림 7 아시아 태평양 케그 시장: DBMR 위치 그리드
그림 8 아시아 태평양 케그 시장: 공급업체 점유율 분석
그림 9 아시아 태평양 케그 시장: 세분화
그림 10 장기 포장 및 보존 솔루션의 상승 추세는 2022년에서 2029년 예측 기간 동안 아시아 태평양 케그 시장을 주도할 것으로 예상됩니다.
그림 11 스테인리스 스틸 세그먼트는 2022년부터 2029년까지의 예측 기간 동안 아시아 태평양 케그 시장에서 가장 큰 점유율을 차지할 것으로 예상됩니다.
그림 12 아시아 태평양 케그 시장의 공급망
그림 13 아시아 태평양 케그 시장의 동인, 제약, 기회 및 과제
그림 14 아시아 태평양 케그 시장, 재료별, 2021
그림 15 아시아 태평양 케그 시장, 용량별, 2021
그림 16 아시아 태평양 케그 시장, 최종 사용자별, 2021
그림 17 아시아 태평양 케그 시장, 유통 채널별, 2021
그림 18 아시아 태평양 케그 시장: 스냅샷(2021)
그림 19 아시아 태평양 케그 시장: 국가별(2021년)
그림 20 아시아 태평양 케그 시장: 국가별(2022년 및 2029년)
그림 21 아시아 태평양 케그 시장: 국가별(2021년 및 2029년)
그림 22 아시아 태평양 케그 시장: 재료별(2022-2029)
그림 23 아시아 태평양 케그 시장: 회사 점유율 2021(%)
연구 방법론
데이터 수집 및 기준 연도 분석은 대규모 샘플 크기의 데이터 수집 모듈을 사용하여 수행됩니다. 이 단계에는 다양한 소스와 전략을 통해 시장 정보 또는 관련 데이터를 얻는 것이 포함됩니다. 여기에는 과거에 수집한 모든 데이터를 미리 검토하고 계획하는 것이 포함됩니다. 또한 다양한 정보 소스에서 발견되는 정보 불일치를 검토하는 것도 포함됩니다. 시장 데이터는 시장 통계 및 일관된 모델을 사용하여 분석하고 추정합니다. 또한 시장 점유율 분석 및 주요 추세 분석은 시장 보고서의 주요 성공 요인입니다. 자세한 내용은 분석가에게 전화를 요청하거나 문의 사항을 드롭하세요.
DBMR 연구팀에서 사용하는 주요 연구 방법론은 데이터 마이닝, 시장에 대한 데이터 변수의 영향 분석 및 주요(산업 전문가) 검증을 포함하는 데이터 삼각 측량입니다. 데이터 모델에는 공급업체 포지셔닝 그리드, 시장 타임라인 분석, 시장 개요 및 가이드, 회사 포지셔닝 그리드, 특허 분석, 가격 분석, 회사 시장 점유율 분석, 측정 기준, 글로벌 대 지역 및 공급업체 점유율 분석이 포함됩니다. 연구 방법론에 대해 자세히 알아보려면 문의를 통해 업계 전문가에게 문의하세요.
사용자 정의 가능
Data Bridge Market Research는 고급 형성 연구 분야의 선두 주자입니다. 저희는 기존 및 신규 고객에게 목표에 맞는 데이터와 분석을 제공하는 데 자부심을 느낍니다. 보고서는 추가 국가에 대한 시장 이해(국가 목록 요청), 임상 시험 결과 데이터, 문헌 검토, 재생 시장 및 제품 기반 분석을 포함하도록 사용자 정의할 수 있습니다. 기술 기반 분석에서 시장 포트폴리오 전략에 이르기까지 타겟 경쟁업체의 시장 분석을 분석할 수 있습니다. 귀하가 원하는 형식과 데이터 스타일로 필요한 만큼 많은 경쟁자를 추가할 수 있습니다. 저희 분석가 팀은 또한 원시 엑셀 파일 피벗 테이블(팩트북)로 데이터를 제공하거나 보고서에서 사용 가능한 데이터 세트에서 프레젠테이션을 만드는 데 도움을 줄 수 있습니다.

