Asia-Pacific Hyperloop Technology Market, By Components (Tube, Capsule, Propulsion System, and Others), Speed (More Than 700 Miles and Less Than 700 Miles), Capacity (Seat Capacity and Carriage Capacity), Route (Intercity and Intracity), Application (Passenger and Cargo/Freight), Country (China, India, Japan, South Korea, Australia, Singapore, Indonesia, Thailand, Malaysia, Philippines, Rest of Asia-Pacific) Industry Trends and Forecast to 2029
 Market Analysis and Insights: Asia-Pacific Hyperloop Technology Market
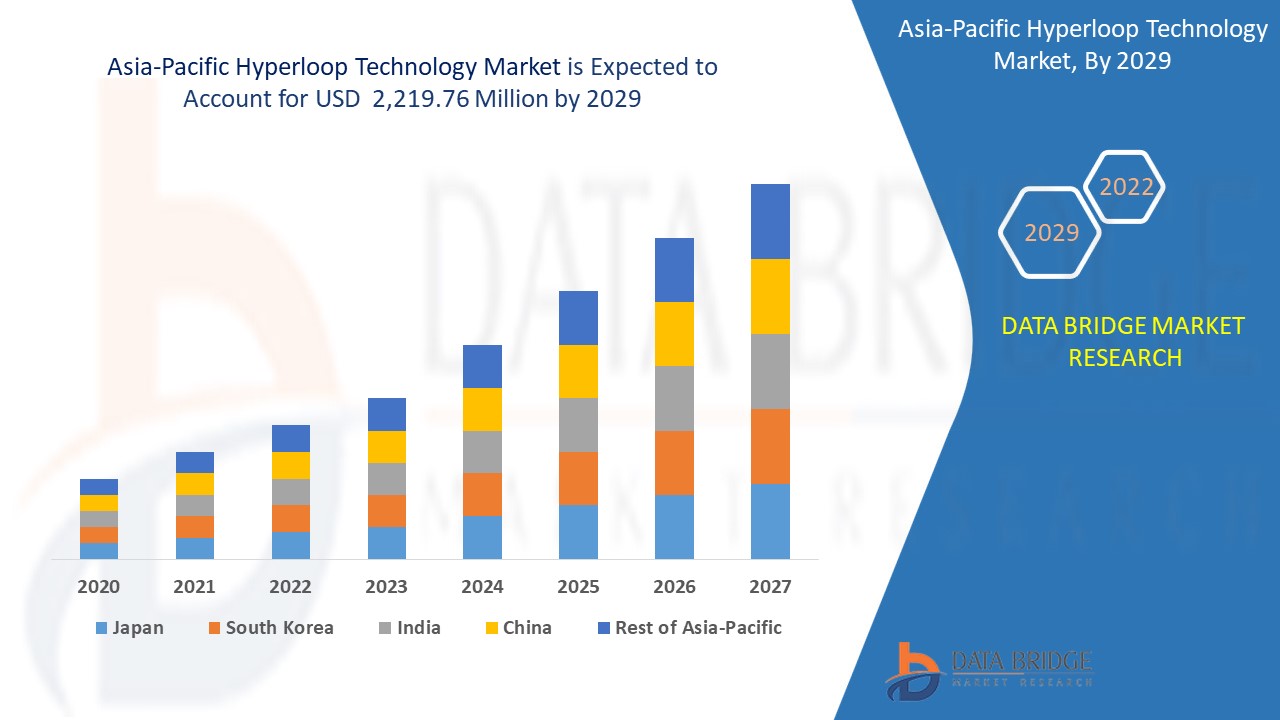
Hyperloop technology market is expected to gain market growth in the forecast period of 2022 to 2029. Data Bridge Market Research analyses that the market is growing with the CAGR of 34.8% in the forecast period of 2022 to 2029 and expected to reach USD 2,219.76 million by 2029. Less expensive (requiring minimal maintenance of facilities) is a factor boosting in market growth. The track of hyperloop doesn't need power continuously unlike rail tracks because the pods can leave every 30 seconds due to which continuous power cost cuts off. Thus, it is observed that the hyperloop technology is less expensive, cost friendly than any other transportation system.
Hyperloops are the magnetic levitation pod kind of structure or can be called trains that operate in a vacuum tube, meaning no friction from tracks and no drag from the air. Hyperloop is a new form of transport technology currently in the development phase by the market players. Hyperloop is proposed to travel at over 700 miles in an hour in a floating pod either above or below ground. There are two significant differences between hyperloop and traditional railways. First, the pod which carries passengers runs through tubes or tunnels.
The hyperloop technology market's growth has been highly boosted by less travel time required and low transport costs. Hyperloop systems have a tolerance to earthquakes and other natural calamities which are promoting the growth of the hyperloop technology market, safety and security concerns of passengers in the hyperloop technology acts as major restraining factors for the hyperloop technology market.
This hyperloop technology market report provides details of market share, new developments, and product pipeline analysis, impact of domestic and localised market players, analyses opportunities in terms of emerging revenue pockets, changes in market regulations, product approvals, strategic decisions, product launches, geographical expansions, and technological innovations in the market. To understand the analysis and the market scenario contact us for an Analyst Brief, our team will help you create a revenue impact solution to achieve your desired goal.
 Asia-Pacific Hyperloop Technology Market Scope and Market Size
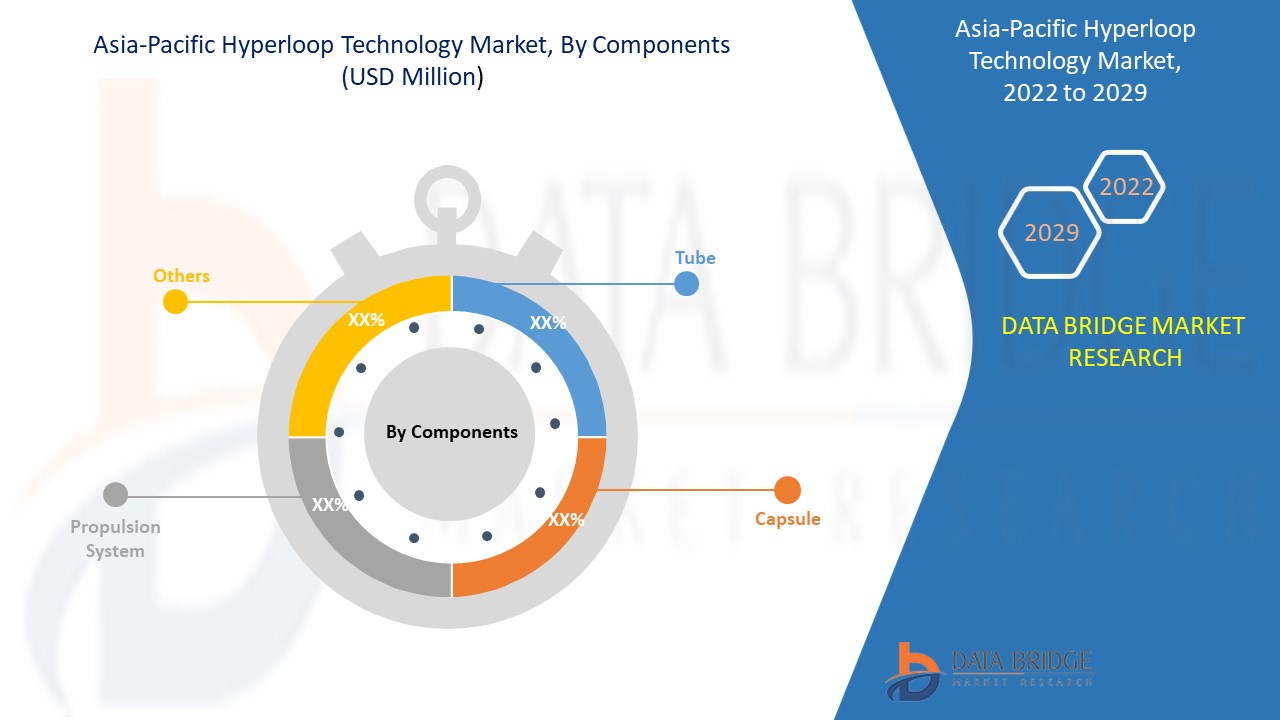
Hyperloop technology market is segmented on the basis components, speed, capacity, route and application. The growth among segments helps you analyse niche pockets of growth and strategies to approach the market and determine your core application areas and the difference in your target markets.
- On the basis of components, the hyperloop technology market has been segmented into tube, capsule, propulsion system, and others. In 2021, tube held largest share in the market, as they enclose the space through which the pods move, effectively allowing the hyperloop system to move at a faster speed.
- On the basis of speed, the hyperloop technology market is segmented into less than 700 miles and more than 700 miles. More than 700 miles held larger share in the market in 2021. This is mainly attributed to surging focus of the market players toward achieving maximum speed of hyperloop pods, in order to reduce the travel time.
- On the basis of capacity, the hyperloop technology market is segmented into seat capacity and carriage capacity. Seat capacity held larger share in the market in 2021, owing to increasing preference toward passenger transportation and increase in number of hyperloop projects.
- On the basis of route, the hyperloop technology market is segmented into intercity and intracity. Intercity held largest share in the hyperloop technology market in 2021. This is mainly due to rise in number of intercity hyperloop projects such as Mumbai-Pune, Vijayawada-Amaravati hyperloop, and others.
- On the basis of application, the hyperloop technology market is segmented into passenger and cargo/freight. Passenger held largest share in the market in 2021. This is mainly attributed to extreme focus toward taking passengers from one place to another in a reduced period of time.
Asia-Pacific Hyperloop Technology Market Country Level Analysis
Asia-Pacific hyperloop technology market is analysed and market size information is provided by country, components, speed, capacity, route and application as referenced above.
The countries covered in the Asia-Pacific hyperloop technology market report are China, India, South Korea, Australia, Japan, Singapore, Malaysia, Thailand, Indonesia, Philippines, and Rest of Asia-Pacific.
China is capturing the largest market share and is expected to dominate the market, due to surging investment toward high-tech infrastructure, high population, focus toward the adoption of improved transportation, and emphasizing toward pollution level control.
The country section of the report also provides individual market impacting factors and changes in regulation in the market domestically that impacts the current and future trends of the market. Data points such as new sales, replacement sales, country demographics, regulatory acts and import-export analysis are some of the major pointers used to forecast the market scenario for individual countries. Also, presence and availability of global brands and their challenges faced due to large or scarce competition from local and domestic brands, impact of sales channels are considered while providing forecast analysis of the country data.
Emphasis on Solar Power for Energy Consumption in the Technology
Hyperloop technology market also provides you with detailed market analysis for every country growth in installed base of different kind of products, impact of technology using life line curves and changes regulatory scenarios and their impact on the hyperloop technology market. The data is available for historic year 2010 to 2020.
Competitive Landscape and Hyperloop Technology Market Share Analysis
Hyperloop technology market competitive landscape provides details by competitor. Details included are company overview, company financials, revenue generated, market potential, investment in research and development, new market initiatives, global presence, production sites and facilities, company strengths and weaknesses, product launch, clinical trials pipelines, brand analysis, product approvals, patents, product width and breadth, application dominance, technology lifeline curve. The above data points provided are only related to the companies’ focus related to hyperloop technology market.
The major players covered in the report are Virgin Hyperloop, Hyperloop Transportation Technologies (HTT), Hardt B.V., Transpod, Zeleros, Aecom, Tesla Inc., Waterloop, Badgerloop, SpaceX Exploration Technologies Corp., Delft Hyperloop, NEXT Prototypes e.V. (TUM HYPERLOOP), VicHyper, Dinclix GroundWorks Private Limited, Washinghton Hyperloop. DBMR analysts understand competitive strengths and provide competitive analysis for each competitor separately.
Many product launch and agreement are also initiated by the companies’ worldwide which are also accelerating the hyperloop technology market.
For instance,
- In July 2018, Hyperloop Transportation Technologies (HTT) and Tongren Transportation & Tourism Investment Group signed an agreement for a hyperloop project in Tongren, China. The first phase of the project includes building of 10-km track in the city.
Partnership, joint ventures and other strategies enhances the company market share with increased coverage and presence. It also provides the benefit for organisation to improve their offering for hyperloop technology market through expanded product range.
SKU-
Obtenha acesso online ao relatório sobre a primeira nuvem de inteligência de mercado do mundo

- Painel interativo de análise de dados
- Painel de análise da empresa para oportunidades de elevado potencial de crescimento
- Acesso de analista de pesquisa para personalização e customização. consultas
- Análise da concorrência com painel interativo
- Últimas notícias, atualizações e atualizações Análise de tendências
- Aproveite o poder da análise de benchmark para um rastreio abrangente da concorrência
Índice
1 INTRODUÇÃO
1.1 OBJETIVOS DO ESTUDO
1.2 DEFINIÇÃO DE MERCADO
1.3 VISÃO GERAL DO MERCADO DE TECNOLOGIA HYPERLOOP DA ÁSIA-PACÍFICO
1.4 MOEDA E PREÇOS
1.5 LIMITAÇÕES
1.6 MERCADOS COBERTOS
2 SEGMENTAÇÃO DE MERCADO
2.1 MERCADOS COBERTOS
2.2 ÂMBITO GEOGRÁFICO
2,3 ANOS CONSIDERADOS PARA O ESTUDO
2.4 MODELO DE VALIDAÇÃO DE DADOS TRIPÉ DBMR
2.5 ENTREVISTAS PRINCIPAIS COM PRINCIPAIS LÍDERES DE OPINIÃO
2.6 GRADE DE POSIÇÃO DE MERCADO DBMR
2.7 ANÁLISE DA PARTICIPAÇÃO DO FORNECEDOR
2.8 MODELAGEM MULTIVARIADA
2.9 CURVA DE LINHA DO TEMPO DOS COMPONENTES
2.1 GRADE DE COBERTURA DE APLICAÇÃO DE MERCADO
2.11 FONTES SECUNDÁRIAS
2.12 PREMISSAS
3 RESUMO EXECUTIVO
4 INSIGHTS PREMIUM
5 VISÃO GERAL DO MERCADO
5.1 MOTORISTAS
5.1.1 REDUÇÃO DO TEMPO DE VIAGEM E DOS CUSTOS DE TRANSPORTE
5.1.2 MENOS CARO (EXIGINDO MANUTENÇÃO MÍNIMA DAS INSTALAÇÕES)
5.1.3 A CRIAÇÃO DE UMA REDE HYPERLOOP REQUER MENOS ÁREA DE TERRA
5.1.4 TOLERÂNCIA A TERREMOTOS E OUTRAS CALAMIDADES NATURAIS
5.1.5 ÊNFASE NA ENERGIA SOLAR PARA CONSUMO DE ENERGIA NA TECNOLOGIA
5.2 RESTRIÇÕES
5.2.1 FALTA DE CONSCIÊNCIA SOBRE A TECNOLOGIA
5.2.2 REGULAMENTAÇÕES AINDA NÃO IMPLEMENTADAS PARA A TECNOLOGIA POR GOVERNOS E BUROCRATAS
5.2.3 PREOCUPAÇÕES COM A SEGURANÇA E A PROTEÇÃO
5.3 OPORTUNIDADES
5.3.1 MENOS DESPESAS COM TRANSPORTE OU VIAGENS
5.3.2 NECESSIDADE DE DESCONGESTIONAMENTO URBANICO
5.3.3 TRANSPORTE COM EFICIÊNCIA ENERGÉTICA
5.4 DESAFIOS
5.4.1 ESCASSEZ DE INVESTIDORES DE CAPITAL E GOVERNO
5.4.2 POSSIBILIDADE DE EMERGÊNCIA PARA PASSAGEIROS DEVIDO À FALTA DE ENERGIA
5.4.3 RISCO DE DESPRESSURIZAÇÃO DA CÁPSULA
5.4.4 QUESTÕES DE TECNICALIDADE DO NOVO SISTEMA DE TRANSPORTE
6 IMPACTO DA COVID-19 NO MERCADO DE TECNOLOGIA HYPERLOOP
6.1 ANÁLISE DO IMPACTO DA COVID-19 NO MERCADO
6.2 CONSEQUÊNCIAS DA COVID-19 E INICIATIVA DO GOVERNO PARA IMPULSIONAR O MERCADO
6.3 DECISÕES ESTRATÉGICAS PARA FABRICANTES APÓS A COVID-19 PARA GANHAR PARTICIPAÇÃO COMPETITIVA NO MERCADO
6.4 IMPACTO NO PREÇO
6.5 IMPACTO NA DEMANDA E NA CADEIA DE SUPRIMENTOS
6.6 CONCLUSÃO
7 MERCADO DE TECNOLOGIA HYPERLOOP DA ÁSIA-PACÍFICO, POR COMPONENTES
7.1 VISÃO GERAL
7.2 TUBO
7.3 CÁPSULA
7.4 SISTEMA DE PROPULSÃO
7.5 OUTROS
8 MERCADO DE TECNOLOGIA HYPERLOOP DA ÁSIA-PACÍFICO, POR VELOCIDADE
8.1 VISÃO GERAL
8.2 MAIS DE 700 MILHAS
8.3 MENOS DE 700 MILHAS
9 MERCADO DE TECNOLOGIA DE HYPERLOOP DA ÁSIA-PACÍFICO, POR CAPACIDADE
9.1 VISÃO GERAL
9.2 CAPACIDADE DE ASSENTOS
9.2.1 MENOS DE 30 PESSOAS
9.2.2 MAIS DE 30 PESSOAS
9.3 CAPACIDADE DE CARRUAGEM
10 MERCADO DE TECNOLOGIA DE HYPERLOOP DA ÁSIA-PACÍFICO, POR ROTA
10.1 VISÃO GERAL
10.2 INTERMUNICIPAL
10.3 INTRACIDADE
11 MERCADO DE TECNOLOGIA DE HYPERLOOP DA ÁSIA-PACÍFICO, POR APLICAÇÃO
11.1 VISÃO GERAL
11.2 PASSAGEIRO
11.3 CARGA/FRETE
12 MERCADOS DE TECNOLOGIA HYPERLOOP DA ÁSIA-PACÍFICO POR REGIÃO
12.1 ÁSIA-PACÍFICO
12.1.1 CHINA
12.1.2 JAPÃO
12.1.3 COREIA DO SUL
12.1.4 AUSTRÁLIA
12.1.5 ÍNDIA
12.1.6 TAILÂNDIA
12.1.7 INDONÉSIA
12.1.8 RESTO DA ÁSIA-PACÍFICO
13 MERCADO DE TECNOLOGIA DE HYPERLOOP DA ÁSIA-PACÍFICO: CENÁRIO DA EMPRESA
13.1 ANÁLISE DE AÇÕES DA EMPRESA: ÁSIA-PACÍFICO
14 ANÁLISE SWOT
15 PERFIL DA EMPRESA
15.1 VIRGEM HYPERLOOP
15.1.1 RESUMO DA EMPRESA
15.1.2 ANÁLISE DAS AÇÕES DA EMPRESA
15.1.3 PORTFÓLIO DE PRODUTOS
15.1.4 DESENVOLVIMENTOS RECENTES
15.2 TECNOLOGIAS DE TRANSPORTE HYPERLOOP
15.2.1 RESUMO DA EMPRESA
15.2.2 ANÁLISE DAS AÇÕES DA EMPRESA
15.2.3 PORTFÓLIO DE PROJETOS
15.2.4 DESENVOLVIMENTOS RECENTES
15.3 HARDT BV
15.3.1 RESUMO DA EMPRESA
15.3.2 ANÁLISE DAS AÇÕES DA EMPRESA
15.3.3 PORTFÓLIO DE PROJETOS
15.3.4 DESENVOLVIMENTOS RECENTES
15.4 TRANSPOD
15.4.1 RESUMO DA EMPRESA
15.4.2 ANÁLISE DAS AÇÕES DA EMPRESA
15.4.3 PORTFÓLIO DE PRODUTOS
15.4.4 DESENVOLVIMENTO RECENTE
15.5 AECOM
15.5.1 RESUMO DA EMPRESA
15.5.2 ANÁLISE DE RECEITA
15.5.3 ANÁLISE DE AÇÕES DA EMPRESA
15.5.4 PORTFÓLIO DE PROJETOS
15.5.5 DESENVOLVIMENTO RECENTE
15.6 BADGERLOOP
15.6.1 RESUMO DA EMPRESA
15.6.2 PORTFÓLIO DE PRODUTOS
15.6.3 DESENVOLVIMENTO RECENTE
15.7 DELFT HYPERLOOP
15.7.1 RESUMO DA EMPRESA
15.7.2 PORTFÓLIO DE PROJETOS
15.7.3 DESENVOLVIMENTO RECENTE
15.8 DINCLIX GROUNDWORKS PRIVATE LIMITED
15.8.1 RESUMO DA EMPRESA
15.8.2 PORTFÓLIO DE MARCAS
15.8.3 DESENVOLVIMENTO RECENTE
15.9 PRÓXIMOS PROTÓTIPOS EV
15.9.1 RESUMO DA EMPRESA
15.9.2 PORTFÓLIO DE PROJETOS
15.9.3 DESENVOLVIMENTO RECENTE
15.1 SPACEX
15.10.1 RESUMO DA EMPRESA
15.10.2 PORTFÓLIO DE PROJETOS
15.10.3 RECENT DEVELOPMENT
15.11 TESLA
15.11.1 COMPANY SNAPSHOT
15.11.2 REVENUE ANALYSIS
15.11.3 PRODUCT PORTFOLIO
15.11.4 RECENT DEVELOPMENT
15.12 VICHYPER
15.12.1 COMPANY SNAPSHOT
15.12.2 PROJECT PORTFOLIO
15.12.3 RECENT DEVELOPMENT
15.13 WASHINGTON HYPERLOOP
15.13.1 COMPANY SNAPSHOT
15.13.2 PROJECT PORTFOLIO
15.13.3 RECENT DEVELOPMENT
15.14 WATERLOOP
15.14.1 COMPANY SNAPSHOT
15.14.2 PROJECT PORTFOLIO
15.14.3 RECENT DEVELOPMENT
15.15 ZELEROS
15.15.1 COMPANY SNAPSHOT
15.15.2 PROJECT PORTFOLIO
15.15.3 RECENT DEVELOPMENTS
16 QUESTIONNAIRE
17 RELATED REPORTS
Lista de Tabela
LISTA DE TABELAS
TABELA 1 TEMPO DE VIAGEM ECONOMIZADO USANDO A TECNOLOGIA HYPERLOOP AO VIAJAR DAS PRINCIPAIS CIDADES DO REINO UNIDO PARA LONDRES
TABELA 2 COMPARAÇÃO DOS CUSTOS DE CAPITAL POR MODALIDADE DE TRANSPORTE
TABELA 3 MERCADO DE TECNOLOGIA HYPERLOOP DA ÁSIA-PACÍFICO, POR COMPONENTES, PREVISÃO DE MERCADO 2022-2029 (US$ MILHÕES)
TABELA 4 MERCADO DE TECNOLOGIA DE TUBOS DA ÁSIA-PACÍFICO NO HYPERLOOP, POR REGIÃO, 2022-2029 (US$ MILHÕES)
TABELA 5 CÁPSULAS DA ÁSIA-PACÍFICO NO MERCADO DE TECNOLOGIA HYPERLOOP, POR REGIÃO, 2022-2029 (US$ MILHÕES)
TABELA 6 SISTEMA DE PROPULSÃO DA ÁSIA-PACÍFICO NO MERCADO DE TECNOLOGIA HYPERLOOP, POR REGIÃO, 2022-2029 (US$ MILHÕES)
TABELA 7 OUTROS INGRESSOS NA ÁSIA-PACÍFICO NO MERCADO DE TECNOLOGIA HYPERLOOP, POR REGIÃO, 2022-2029 (US$ MILHÕES)
TABELA 8 MERCADO DE TECNOLOGIA HYPERLOOP DA ÁSIA-PACÍFICO, POR VELOCIDADE, PREVISÃO DE MERCADO 2022-2029 (US$ MILHÕES)
TABELA 9 ÁSIA-PACÍFICO MAIS DE 700 MILHAS NO MERCADO DE TECNOLOGIA HYPERLOOP, POR REGIÃO, 2022-2029 (US$ MILHÕES)
TABELA 10 ÁSIA-PACÍFICO MENOS DE 700 MILHAS NO MERCADO DE TECNOLOGIA HYPERLOOP, POR REGIÃO, 2022-2029 (US$ MILHÕES)
TABELA 11 MERCADO DE TECNOLOGIA HYPERLOOP DA ÁSIA-PACÍFICO, POR CAPACIDADE, PREVISÃO DE MERCADO 2022-2029 (US$ MILHÕES)
TABELA 12 CAPACIDADE DE ASSENTOS NA ÁSIA-PACÍFICO NO MERCADO DE TECNOLOGIA HYPERLOOP, POR REGIÃO, 2022-2029 (US$ MILHÕES)
TABELA 13 CAPACIDADE DE TRANSPORTE NA ÁSIA-PACÍFICO NO MERCADO DE TECNOLOGIA HYPERLOOP, POR REGIÃO, 2022-2029 (US$ MILHÕES)
TABELA 14 MERCADO DE TECNOLOGIA HYPERLOOP DA ÁSIA-PACÍFICO, POR ROTA, PREVISÃO DE MERCADO 2022-2029 (US$ MILHÕES)
TABELA 15 MERCADO DE TECNOLOGIA HYPERLOOP INTERURBANO DA ÁSIA-PACÍFICO, POR REGIÃO, 2022-2029 (US$ MILHÕES)
TABELA 16 INTRACIDADE DA ÁSIA-PACÍFICO NO MERCADO DE TECNOLOGIA HYPERLOOP, POR REGIÃO, 2022-2029 (US$ MILHÕES)
TABELA 17 MERCADO DE TECNOLOGIA HYPERLOOP DA ÁSIA-PACÍFICO, POR APLICAÇÃO, PREVISÃO DE MERCADO 2022-2029 (US$ MILHÕES)
TABELA 18 PASSAGEIROS DA ÁSIA-PACÍFICO NO MERCADO DE TECNOLOGIA HYPERLOOP, POR REGIÃO, 2022-2029 (US$ MILHÕES)
TABELA 19 CARGA/FRETE NA ÁSIA-PACÍFICO NO MERCADO DE TECNOLOGIA HYPERLOOP, POR REGIÃO, 2022-2029 (US$ MILHÕES)
TABELA 20 MERCADO DE TECNOLOGIA HYPERLOOP DA ÁSIA-PACÍFICO, POR PAÍS, 2020-2029 (US$ MILHÕES)
TABELA 21 MERCADO DE TECNOLOGIA HYPERLOOP DA ÁSIA-PACÍFICO, POR COMPONENTES, 2020-2029 (US$ MILHÕES)
TABELA 22 MERCADO DE TECNOLOGIA HYPERLOOP DA ÁSIA-PACÍFICO, POR VELOCIDADE, 2020-2029 (US$ MILHÕES)
TABELA 23 MERCADO DE TECNOLOGIA HYPERLOOP DA ÁSIA-PACÍFICO, POR CAPACIDADE, 2020-2029 (US$ MILHÕES)
TABELA 24 CAPACIDADE DE ASSENTOS NA ÁSIA-PACÍFICO NO MERCADO DE TECNOLOGIA HYPERLOOP, POR TIPO, 2020-2029 (US$ MILHÕES)
TABELA 25 MERCADO DE TECNOLOGIA HYPERLOOP DA ÁSIA-PACÍFICO, POR ROTA, 2020-2029 (US$ MILHÕES)
TABELA 26 MERCADO DE TECNOLOGIA HYPERLOOP DA ÁSIA-PACÍFICO, POR APLICAÇÃO, 2020-2029 (US$ MILHÕES)
TABELA 27 MERCADO DE TECNOLOGIA HYPERLOOP DA CHINA, POR COMPONENTES, 2020-2029 (US$ MILHÕES)
TABELA 28 MERCADO DE TECNOLOGIA HYPERLOOP DA CHINA, POR VELOCIDADE, 2020-2029 (US$ MILHÕES)
TABELA 29 MERCADO DE TECNOLOGIA HYPERLOOP DA CHINA, POR CAPACIDADE, 2020-2029 (US$ MILHÕES)
TABELA 30 CAPACIDADE DE ASSENTOS NA CHINA NO MERCADO DE TECNOLOGIA HYPERLOOP, POR TIPO, 2020-2029 (US$ MILHÕES)
TABELA 31 MERCADO DE TECNOLOGIA HYPERLOOP DA CHINA, POR ROTA, 2020-2029 (US$ MILHÕES)
TABELA 32 MERCADO DE TECNOLOGIA HYPERLOOP DA CHINA, POR APLICAÇÃO, 2020-2029 (US$ MILHÕES)
TABELA 33 MERCADO DE TECNOLOGIA HYPERLOOP DO JAPÃO, POR COMPONENTES, 2020-2029 (US$ MILHÕES)
TABELA 34 MERCADO DE TECNOLOGIA HYPERLOOP DO JAPÃO, POR VELOCIDADE, 2020-2029 (US$ MILHÕES)
TABELA 35 MERCADO DE TECNOLOGIA HYPERLOOP DO JAPÃO, POR CAPACIDADE, 2020-2029 (US$ MILHÕES)
TABELA 36 CAPACIDADE DE ASSENTOS NO MERCADO DE TECNOLOGIA HYPERLOOP DO JAPÃO, POR TIPO, 2020-2029 (US$ MILHÕES)
TABELA 37 MERCADO DE TECNOLOGIA HYPERLOOP DO JAPÃO, POR ROTA, 2020-2029 (US$ MILHÕES)
TABELA 38 MERCADO DE TECNOLOGIA HYPERLOOP DO JAPÃO, POR APLICAÇÃO, 2020-2029 (US$ MILHÕES)
TABELA 39 MERCADO DE TECNOLOGIA HYPERLOOP DA COREIA DO SUL, POR COMPONENTES, 2020-2029 (US$ MILHÕES)
TABELA 40 MERCADO DE TECNOLOGIA HYPERLOOP DA COREIA DO SUL, POR VELOCIDADE, 2020-2029 (US$ MILHÕES)
TABELA 41 MERCADO DE TECNOLOGIA HYPERLOOP DA COREIA DO SUL, POR CAPACIDADE, 2020-2029 (US$ MILHÕES)
TABELA 42 CAPACIDADE DE ASSENTOS NA COREIA DO SUL NO MERCADO DE TECNOLOGIA HYPERLOOP, POR TIPO, 2020-2029 (US$ MILHÕES)
TABELA 43 MERCADO DE TECNOLOGIA HYPERLOOP DA COREIA DO SUL, POR ROTA, 2020-2029 (US$ MILHÕES)
TABELA 44 MERCADO DE TECNOLOGIA HYPERLOOP DA COREIA DO SUL, POR APLICAÇÃO, 2020-2029 (US$ MILHÕES)
TABELA 45 MERCADO DE TECNOLOGIA HYPERLOOP DA AUSTRÁLIA, POR COMPONENTES, 2020-2029 (US$ MILHÕES)
TABELA 46 MERCADO DE TECNOLOGIA HYPERLOOP DA AUSTRÁLIA, POR VELOCIDADE, 2020-2029 (US$ MILHÕES)
TABELA 47 MERCADO DE TECNOLOGIA HYPERLOOP DA AUSTRÁLIA, POR CAPACIDADE, 2020-2029 (US$ MILHÕES)
TABELA 48 CAPACIDADE DE ASSENTOS NO MERCADO DE TECNOLOGIA HYPERLOOP DA AUSTRÁLIA, POR TIPO, 2020-2029 (US$ MILHÕES)
TABELA 49 MERCADO DE TECNOLOGIA HYPERLOOP DA AUSTRÁLIA, POR ROTA, 2020-2029 (US$ MILHÕES)
TABELA 50 MERCADO DE TECNOLOGIA HYPERLOOP DA AUSTRÁLIA, POR APLICAÇÃO, 2020-2029 (US$ MILHÕES)
TABELA 51 MERCADO DE TECNOLOGIA HYPERLOOP DA ÍNDIA, POR COMPONENTES, 2020-2029 (US$ MILHÕES)
TABELA 52 MERCADO DE TECNOLOGIA HYPERLOOP DA ÍNDIA, POR VELOCIDADE, 2020-2029 (US$ MILHÕES)
TABELA 53 MERCADO DE TECNOLOGIA HYPERLOOP DA ÍNDIA, POR CAPACIDADE, 2020-2029 (US$ MILHÕES)
TABELA 54 CAPACIDADE DE ASSENTOS NO MERCADO DE TECNOLOGIA HYPERLOOP DA ÍNDIA, POR TIPO, 2020-2029 (US$ MILHÕES)
TABELA 55 MERCADO DE TECNOLOGIA HYPERLOOP DA ÍNDIA, POR ROTA, 2020-2029 (US$ MILHÕES)
TABELA 56 MERCADO DE TECNOLOGIA HYPERLOOP DA ÍNDIA, POR APLICAÇÃO, 2020-2029 (US$ MILHÕES)
TABELA 57 MERCADO DE TECNOLOGIA HYPERLOOP DA TAILÂNDIA, POR COMPONENTES, 2020-2029 (US$ MILHÕES)
TABELA 58 MERCADO DE TECNOLOGIA HYPERLOOP DA TAILÂNDIA, POR VELOCIDADE, 2020-2029 (US$ MILHÕES)
TABELA 59 MERCADO DE TECNOLOGIA HYPERLOOP DA TAILÂNDIA, POR CAPACIDADE, 2020-2029 (US$ MILHÕES)
TABELA 60 CAPACIDADE DE ASSENTOS NA TAILÂNDIA NO MERCADO DE TECNOLOGIA HYPERLOOP, POR TIPO, 2020-2029 (US$ MILHÕES)
TABELA 61 MERCADO DE TECNOLOGIA HYPERLOOP DA TAILÂNDIA, POR ROTA, 2020-2029 (US$ MILHÕES)
TABELA 62 MERCADO DE TECNOLOGIA HYPERLOOP DA TAILÂNDIA, POR APLICAÇÃO, 2020-2029 (US$ MILHÕES)
TABELA 63 MERCADO DE TECNOLOGIA HYPERLOOP DA INDONÉSIA, POR COMPONENTES, 2020-2029 (US$ MILHÕES)
TABELA 64 MERCADO DE TECNOLOGIA HYPERLOOP DA INDONÉSIA, POR VELOCIDADE, 2020-2029 (US$ MILHÕES)
TABELA 65 MERCADO DE TECNOLOGIA HYPERLOOP DA INDONÉSIA, POR CAPACIDADE, 2020-2029 (US$ MILHÕES)
TABELA 66 CAPACIDADE DE ASSENTOS NO MERCADO DE TECNOLOGIA HYPERLOOP DA INDONÉSIA, POR TIPO, 2020-2029 (US$ MILHÕES)
TABELA 67 MERCADO DE TECNOLOGIA HYPERLOOP DA INDONÉSIA, POR ROTA, 2020-2029 (US$ MILHÕES)
TABELA 68 MERCADO DE TECNOLOGIA HYPERLOOP DA INDONÉSIA, POR APLICAÇÃO, 2020-2029 (US$ MILHÕES)
TABELA 69 MERCADO DE TECNOLOGIA HYPERLOOP DO RESTO DA ÁSIA-PACÍFICO, POR COMPONENTES, 2020-2029 (US$ MILHÕES)
Lista de Figura
LISTA DE FIGURAS
FIGURA 1 MERCADO DE TECNOLOGIA HYPERLOOP DA ÁSIA-PACÍFICO: SEGMENTAÇÃO
FIGURA 2 MERCADO DE TECNOLOGIA HYPERLOOP DA ÁSIA-PACÍFICO: TRIANGULAÇÃO DE DADOS
FIGURA 3 MERCADO DE TECNOLOGIA HYPERLOOP DA ÁSIA-PACÍFICO: ANÁLISE DROC
FIGURA 4 MERCADO DE TECNOLOGIA HYPERLOOP DA ÁSIA-PACÍFICO: ANÁLISE DE MERCADO DA ÁSIA-PACÍFICO VS MERCADO REGIONAL
FIGURA 5 MERCADO DE TECNOLOGIA HYPERLOOP DA ÁSIA-PACÍFICO: ANÁLISE DE PESQUISA DA EMPRESA
FIGURA 6 MERCADO DE TECNOLOGIA HYPERLOOP DA ÁSIA-PACÍFICO: DEMOGRAFIA DA ENTREVISTA
FIGURA 7 MERCADO DE TECNOLOGIA HYPERLOOP DA ÁSIA-PACÍFICO: GRADE DE POSIÇÃO DE MERCADO DBMR
FIGURA 8 MERCADO DE TECNOLOGIA HYPERLOOP DA ÁSIA-PACÍFICO: ANÁLISE DA PARTICIPAÇÃO DE FORNECEDORES
FIGURA 9 MERCADO DE TECNOLOGIA HYPERLOOP DA ÁSIA-PACÍFICO: GRADE DE COBERTURA DE APLICAÇÕES DE MERCADO
FIGURA 10 MERCADO DE TECNOLOGIA HYPERLOOP DA ÁSIA-PACÍFICO: SEGMENTAÇÃO
FIGURA 11 A REDUÇÃO DO TEMPO DE VIAGEM E DOS CUSTOS DE TRANSPORTE DEVE IMPULSIONAR O MERCADO DE TECNOLOGIA HYPERLOOP DA ÁSIA-PACÍFICO NO PERÍODO PREVISTO DE 2022 A 2029
FIGURA 12 O SEGMENTO DE COMPONENTES DEVE SER REPRESENTANTE DA MAIOR PARCIALIDADE DO MERCADO DE TECNOLOGIA HYPERLOOP DA ÁSIA-PACÍFICO EM 2021 E 2029
FIGURA 13 MOTIVADORES, RESTRIÇÕES, OPORTUNIDADES E DESAFIOS DO MERCADO DE TECNOLOGIA HYPERLOOP DA ÁSIA-PACÍFICO
FIGURA 14 MERCADO DE TECNOLOGIA HYPERLOOP DA ÁSIA-PACÍFICO: POR COMPONENTES, 2021
FIGURA 15 MERCADO DE TECNOLOGIA HYPERLOOP DA ÁSIA-PACÍFICO: POR VELOCIDADE, 2021
FIGURA 16 MERCADO DE TECNOLOGIA HYPERLOOP DA ÁSIA-PACÍFICO: POR CAPACIDADE, 2021
FIGURA 17 MERCADO DE TECNOLOGIA HYPERLOOP DA ÁSIA-PACÍFICO: POR ROTA, 2021
FIGURA 18 MERCADO DE TECNOLOGIA HYPERLOOP DA ÁSIA-PACÍFICO: POR APLICAÇÃO, 2021
FIGURA 19 MERCADO DE TECNOLOGIA HYPERLOOP DA ÁSIA-PACÍFICO: INSTANTÂNEO (2021)
FIGURA 20 MERCADO DE TECNOLOGIA HYPERLOOP DA ÁSIA-PACÍFICO: POR PAÍS (2021)
FIGURA 21 MERCADO DE TECNOLOGIA HYPERLOOP DA ÁSIA-PACÍFICO: POR PAÍS (2022 E 2029)
FIGURA 22 MERCADO DE TECNOLOGIA HYPERLOOP DA ÁSIA-PACÍFICO: POR PAÍS (2020 E 2029)
FIGURA 23 MERCADO DE TECNOLOGIA HYPERLOOP DA ÁSIA-PACÍFICO: POR COMPONENTES (2022-2029)
FIGURA 24 MERCADO DE TECNOLOGIA HYPERLOOP DA ÁSIA-PACÍFICO: PARTICIPAÇÃO DA EMPRESA EM 2021 (%)
Metodologia de Investigação
A recolha de dados e a análise do ano base são feitas através de módulos de recolha de dados com amostras grandes. A etapa inclui a obtenção de informações de mercado ou dados relacionados através de diversas fontes e estratégias. Inclui examinar e planear antecipadamente todos os dados adquiridos no passado. Da mesma forma, envolve o exame de inconsistências de informação observadas em diferentes fontes de informação. Os dados de mercado são analisados e estimados utilizando modelos estatísticos e coerentes de mercado. Além disso, a análise da quota de mercado e a análise das principais tendências são os principais fatores de sucesso no relatório de mercado. Para saber mais, solicite uma chamada de analista ou abra a sua consulta.
A principal metodologia de investigação utilizada pela equipa de investigação do DBMR é a triangulação de dados que envolve a mineração de dados, a análise do impacto das variáveis de dados no mercado e a validação primária (especialista do setor). Os modelos de dados incluem grelha de posicionamento de fornecedores, análise da linha de tempo do mercado, visão geral e guia de mercado, grelha de posicionamento da empresa, análise de patentes, análise de preços, análise da quota de mercado da empresa, normas de medição, análise global versus regional e de participação dos fornecedores. Para saber mais sobre a metodologia de investigação, faça uma consulta para falar com os nossos especialistas do setor.
Personalização disponível
A Data Bridge Market Research é líder em investigação formativa avançada. Orgulhamo-nos de servir os nossos clientes novos e existentes com dados e análises que correspondem e atendem aos seus objetivos. O relatório pode ser personalizado para incluir análise de tendências de preços de marcas-alvo, compreensão do mercado para países adicionais (solicite a lista de países), dados de resultados de ensaios clínicos, revisão de literatura, mercado remodelado e análise de base de produtos . A análise de mercado dos concorrentes-alvo pode ser analisada desde análises baseadas em tecnologia até estratégias de carteira de mercado. Podemos adicionar quantos concorrentes necessitar de dados no formato e estilo de dados que procura. A nossa equipa de analistas também pode fornecer dados em tabelas dinâmicas de ficheiros Excel em bruto (livro de factos) ou pode ajudá-lo a criar apresentações a partir dos conjuntos de dados disponíveis no relatório.

