
 Market Analysis and Insights: Asia-Pacific Hyperloop Technology Market
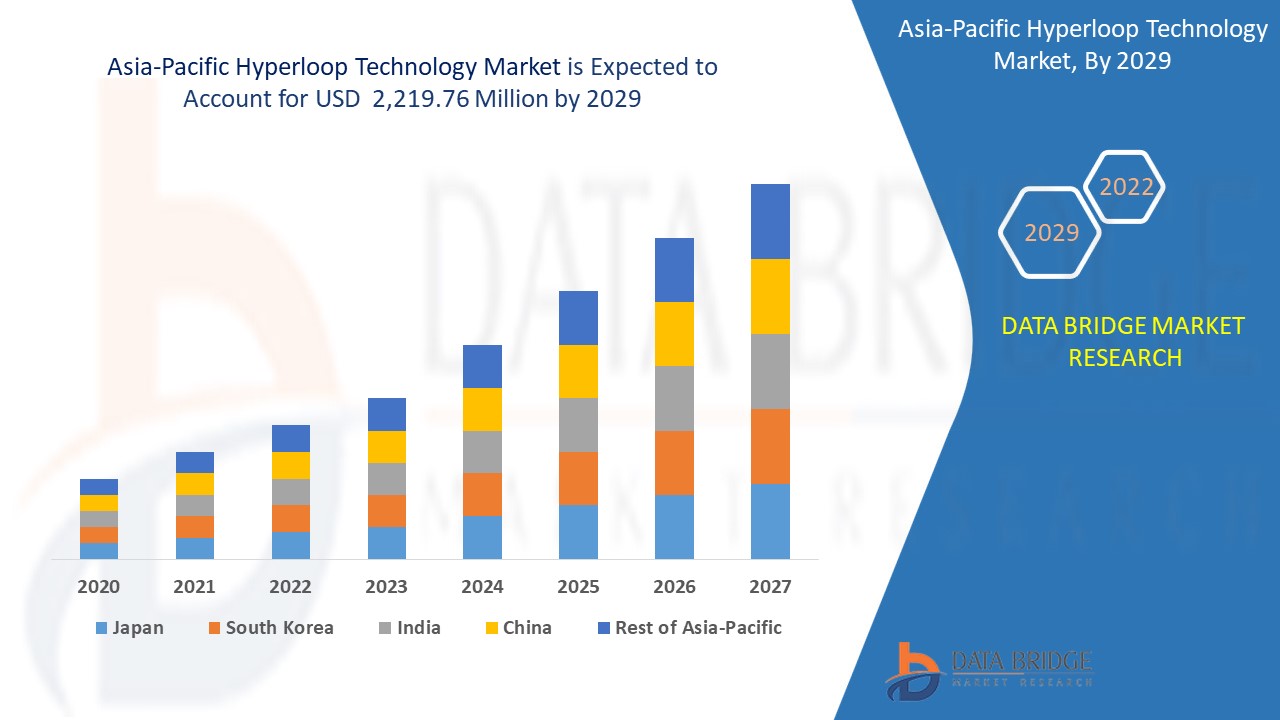
Hyperloop technology market is expected to gain market growth in the forecast period of 2022 to 2029. Data Bridge Market Research analyses that the market is growing with the CAGR of 34.8% in the forecast period of 2022 to 2029 and expected to reach USD 2,219.76 million by 2029. Less expensive (requiring minimal maintenance of facilities) is a factor boosting in market growth. The track of hyperloop doesn't need power continuously unlike rail tracks because the pods can leave every 30 seconds due to which continuous power cost cuts off. Thus, it is observed that the hyperloop technology is less expensive, cost friendly than any other transportation system.
Hyperloops are the magnetic levitation pod kind of structure or can be called trains that operate in a vacuum tube, meaning no friction from tracks and no drag from the air. Hyperloop is a new form of transport technology currently in the development phase by the market players. Hyperloop is proposed to travel at over 700 miles in an hour in a floating pod either above or below ground. There are two significant differences between hyperloop and traditional railways. First, the pod which carries passengers runs through tubes or tunnels.
The hyperloop technology market's growth has been highly boosted by less travel time required and low transport costs. Hyperloop systems have a tolerance to earthquakes and other natural calamities which are promoting the growth of the hyperloop technology market, safety and security concerns of passengers in the hyperloop technology acts as major restraining factors for the hyperloop technology market.
This hyperloop technology market report provides details of market share, new developments, and product pipeline analysis, impact of domestic and localised market players, analyses opportunities in terms of emerging revenue pockets, changes in market regulations, product approvals, strategic decisions, product launches, geographical expansions, and technological innovations in the market. To understand the analysis and the market scenario contact us for an Analyst Brief, our team will help you create a revenue impact solution to achieve your desired goal.
 Asia-Pacific Hyperloop Technology Market Scope and Market Size
Hyperloop technology market is segmented on the basis components, speed, capacity, route and application. The growth among segments helps you analyse niche pockets of growth and strategies to approach the market and determine your core application areas and the difference in your target markets.
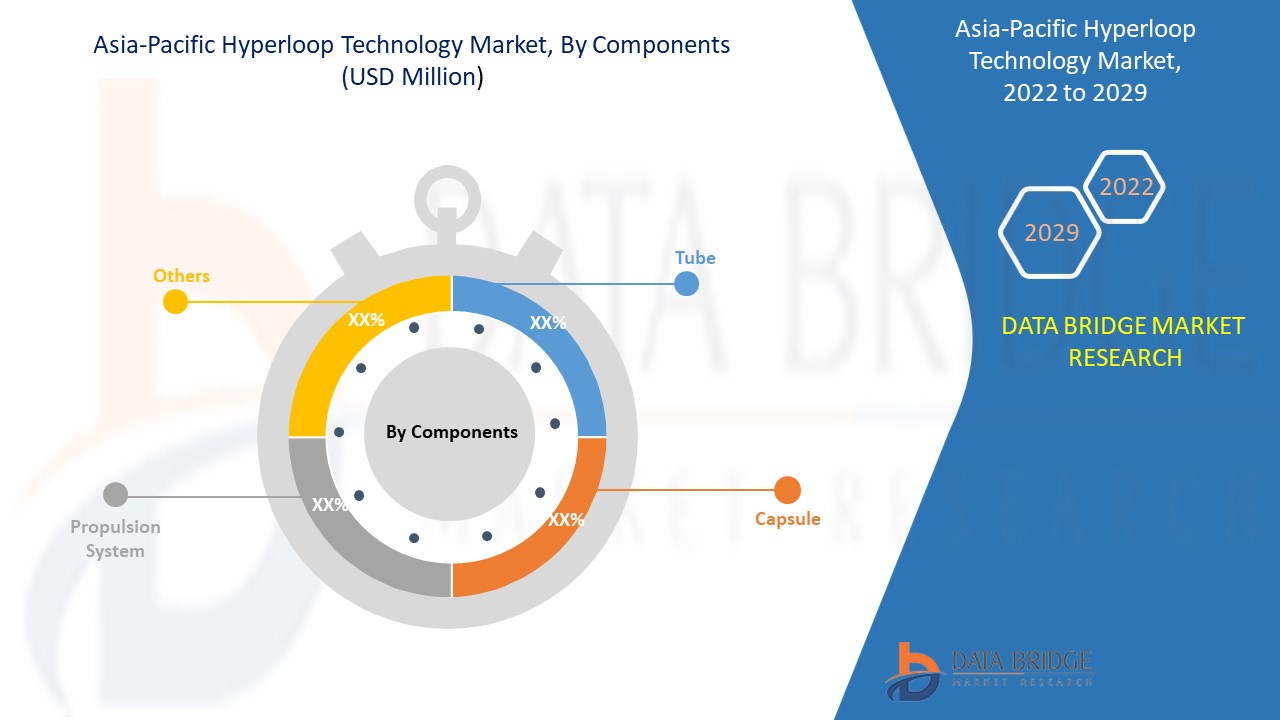
- On the basis of components, the hyperloop technology market has been segmented into tube, capsule, propulsion system, and others. In 2021, tube held largest share in the market, as they enclose the space through which the pods move, effectively allowing the hyperloop system to move at a faster speed.
- On the basis of speed, the hyperloop technology market is segmented into less than 700 miles and more than 700 miles. More than 700 miles held larger share in the market in 2021. This is mainly attributed to surging focus of the market players toward achieving maximum speed of hyperloop pods, in order to reduce the travel time.
- On the basis of capacity, the hyperloop technology market is segmented into seat capacity and carriage capacity. Seat capacity held larger share in the market in 2021, owing to increasing preference toward passenger transportation and increase in number of hyperloop projects.
- On the basis of route, the hyperloop technology market is segmented into intercity and intracity. Intercity held largest share in the hyperloop technology market in 2021. This is mainly due to rise in number of intercity hyperloop projects such as Mumbai-Pune, Vijayawada-Amaravati hyperloop, and others.
- On the basis of application, the hyperloop technology market is segmented into passenger and cargo/freight. Passenger held largest share in the market in 2021. This is mainly attributed to extreme focus toward taking passengers from one place to another in a reduced period of time.
Asia-Pacific Hyperloop Technology Market Country Level Analysis
Asia-Pacific hyperloop technology market is analysed and market size information is provided by country, components, speed, capacity, route and application as referenced above.
The countries covered in the Asia-Pacific hyperloop technology market report are China, India, South Korea, Australia, Japan, Singapore, Malaysia, Thailand, Indonesia, Philippines, and Rest of Asia-Pacific.
China is capturing the largest market share and is expected to dominate the market, due to surging investment toward high-tech infrastructure, high population, focus toward the adoption of improved transportation, and emphasizing toward pollution level control.
The country section of the report also provides individual market impacting factors and changes in regulation in the market domestically that impacts the current and future trends of the market. Data points such as new sales, replacement sales, country demographics, regulatory acts and import-export analysis are some of the major pointers used to forecast the market scenario for individual countries. Also, presence and availability of global brands and their challenges faced due to large or scarce competition from local and domestic brands, impact of sales channels are considered while providing forecast analysis of the country data.
Emphasis on Solar Power for Energy Consumption in the Technology
Hyperloop technology market also provides you with detailed market analysis for every country growth in installed base of different kind of products, impact of technology using life line curves and changes regulatory scenarios and their impact on the hyperloop technology market. The data is available for historic year 2010 to 2020.
Competitive Landscape and Hyperloop Technology Market Share Analysis
Hyperloop technology market competitive landscape provides details by competitor. Details included are company overview, company financials, revenue generated, market potential, investment in research and development, new market initiatives, global presence, production sites and facilities, company strengths and weaknesses, product launch, clinical trials pipelines, brand analysis, product approvals, patents, product width and breadth, application dominance, technology lifeline curve. The above data points provided are only related to the companies’ focus related to hyperloop technology market.
The major players covered in the report are Virgin Hyperloop, Hyperloop Transportation Technologies (HTT), Hardt B.V., Transpod, Zeleros, Aecom, Tesla Inc., Waterloop, Badgerloop, SpaceX Exploration Technologies Corp., Delft Hyperloop, NEXT Prototypes e.V. (TUM HYPERLOOP), VicHyper, Dinclix GroundWorks Private Limited, Washinghton Hyperloop. DBMR analysts understand competitive strengths and provide competitive analysis for each competitor separately.
Many product launch and agreement are also initiated by the companies’ worldwide which are also accelerating the hyperloop technology market.
For instance,
- In July 2018, Hyperloop Transportation Technologies (HTT) and Tongren Transportation & Tourism Investment Group signed an agreement for a hyperloop project in Tongren, China. The first phase of the project includes building of 10-km track in the city.
Partnership, joint ventures and other strategies enhances the company market share with increased coverage and presence. It also provides the benefit for organisation to improve their offering for hyperloop technology market through expanded product range.
SKU-

- Interactive Data Analysis Dashboard
- Company Analysis Dashboard for high growth potential opportunities
- Research Analyst Access for customization & queries
- Competitor Analysis with Interactive dashboard
- Latest News, Updates & Trend analysis
- Harness the Power of Benchmark Analysis for Comprehensive Competitor Tracking
Table of Content
1 INTRODUCTION
1.1 OBJECTIVES OF THE STUDY
1.2 MARKET DEFINITION
1.3 OVERVIEW OF ASIA-PACIFIC HYPERLOOP TECHNOLOGY MARKET
1.4 CURRENCY AND PRICING
1.5 LIMITATIONS
1.6 MARKETS COVERED
2 MARKET SEGMENTATION
2.1 MARKETS COVERED
2.2 GEOGRAPHICAL SCOPE
2.3 YEARS CONSIDERED FOR THE STUDY
2.4 DBMR TRIPOD DATA VALIDATION MODEL
2.5 PRIMARY INTERVIEWS WITH KEY OPINION LEADERS
2.6 DBMR MARKET POSITION GRID
2.7 VENDOR SHARE ANALYSIS
2.8 MULTIVARIATE MODELING
2.9 COMPONENTS TIMELINE CURVE
2.1 MARKET APPLICATION COVERAGE GRID
2.11 SECONDARY SOURCES
2.12 ASSUMPTIONS
3 EXECUTIVE SUMMARY
4 PREMIUM INSIGHTS
5 MARKET OVERVIEW
5.1 DRIVERS
5.1.1 DECREASED TRAVEL TIME AND TRANSPORT COSTS
5.1.2 LESS EXPENSIVE (REQUIRING MINIMAL MAINTENANCE OF FACILITIES)
5.1.3 CREATION OF HYPERLOOP NETWORK REQUIRES LESS LAND AREA
5.1.4 TOLERANCE TO EARTHQUAKES AND OTHER NATURAL CALAMITIES
5.1.5 EMPHASIS ON SOLAR POWER FOR ENERGY CONSUMPTION IN THE TECHNOLOGY
5.2 RESTRAINTS
5.2.1 LACK OF AWARENESS REGARDING THE TECHNOLOGY
5.2.2 REGULATIONS NOT YET IMPLEMENTED FOR THE TECHNOLOGY BY GOVERNMENTS AND BUREAUCRATS
5.2.3 SAFETY AND SECURITY CONCERNS
5.3 OPPORTUNITIES
5.3.1 LESS EXPENSES IN TRANSPORTATION OR TRAVELLING
5.3.2 NEED FOR URBAN DECONGESTION
5.3.3 ENERGY-EFFICIENT TRANSPORTATION
5.4 CHALLENGES
5.4.1 SHORTAGES OF CAPITAL INVESTORS AND GOVERNMENT
5.4.2 POSSIBILITY OF EMERGENCY FOR PASSENGERS DUE TO POWER OUTAGE
5.4.3 CAPSULE DEPRESSURIZATION RISK
5.4.4 TECHNICALITY ISSUES OF NEW TRANSPORT SYSTEM
6 COVID-19 IMPACT ON HYPERLOOP TECHNOLOGY MARKET
6.1 ANALYSIS ON IMPACT OF COVID-19 ON THE MARKET
6.2 AFTERMATH OF COVID-19 AND GOVERNMENT INITIATIVE TO BOOST THE MARKET
6.3 STRATEGIC DECISIONS FOR MANUFACTURERS AFTER COVID-19 TO GAIN COMPETITIVE MARKET SHARE
6.4 PRICE IMPACT
6.5 IMPACT ON DEMAND AND SUPPLY CHAIN
6.6 CONCLUSION
7 ASIA-PACIFIC HYPERLOOP TECHNOLOGY MARKET, BY COMPONENTS
7.1 OVERVIEW
7.2 TUBE
7.3 CAPSULE
7.4 PROPULSION SYSTEM
7.5 OTHERS
8 ASIA-PACIFIC HYPERLOOP TECHNOLOGY MARKET, BY SPEED
8.1 OVERVIEW
8.2 MORE THAN 700 MILES
8.3 LESS THAN 700 MILES
9 ASIA-PACIFIC HYPERLOOP TECHNOLOGY MARKET, BY CAPACITY
9.1 OVERVIEW
9.2 SEAT CAPACITY
9.2.1 LESS THAN 30 PERSONS
9.2.2 MORE THAN 30 PERSONS
9.3 CARRIAGE CAPACITY
10 ASIA-PACIFIC HYPERLOOP TECHNOLOGY MARKET, BY ROUTE
10.1 OVERVIEW
10.2 INTERCITY
10.3 INTRACITY
11 ASIA-PACIFIC HYPERLOOP TECHNOLOGY MARKET, BY APPLICATION
11.1 OVERVIEW
11.2 PASSENGER
11.3 CARGO/FREIGHT
12 ASIA-PACIFIC HYPERLOOP TECHNOLOGY MARKET BY REGION
12.1 ASIA PACIFIC
12.1.1 CHINA
12.1.2 JAPAN
12.1.3 SOUTH KOREA
12.1.4 AUSTRALIA
12.1.5 INDIA
12.1.6 THAILAND
12.1.7 INDONESIA
12.1.8 REST OF ASIA PACIFIC
13 ASIA-PACIFIC HYPERLOOP TECHNOLOGY MARKET: COMPANY LANDSCAPE
13.1 COMPANY SHARE ANALYSIS: ASIA-PACIFIC
14 SWOT ANALYSIS
15 COMPANY PROFILE
15.1 VIRGIN HYPERLOOP
15.1.1 COMPANY SNAPSHOT
15.1.2 COMPANY SHARE ANALYSIS
15.1.3 PRODUCT PORTFOLIO
15.1.4 RECENT DEVELOPMENTS
15.2 HYPERLOOP TRANSPORTATION TECHNOLOGIES
15.2.1 COMPANY SNAPSHOT
15.2.2 COMPANY SHARE ANALYSIS
15.2.3 PROJECT PORTFOLIO
15.2.4 RECENT DEVELOPMENTS
15.3 HARDT B.V.
15.3.1 COMPANY SNAPSHOT
15.3.2 COMPANY SHARE ANALYSIS
15.3.3 PROJECT PORTFOLIO
15.3.4 RECENT DEVELOPMENTS
15.4 TRANSPOD
15.4.1 COMPANY SNAPSHOT
15.4.2 COMPANY SHARE ANALYSIS
15.4.3 PRODUCT PORTFOLIO
15.4.4 RECENT DEVELOPMENT
15.5 AECOM
15.5.1 COMPANY SNAPSHOT
15.5.2 REVENUE ANALYSIS
15.5.3 COMPANY SHARE ANALYSIS
15.5.4 PROJECT PORTFOLIO
15.5.5 RECENT DEVELOPMENT
15.6 BADGERLOOP
15.6.1 COMPANY SNAPSHOT
15.6.2 PRODUCT PORTFOLIO
15.6.3 RECENT DEVELOPMENT
15.7 DELFT HYPERLOOP
15.7.1 COMPANY SNAPSHOT
15.7.2 PROJECT PORTFOLIO
15.7.3 RECENT DEVELOPMENT
15.8 DINCLIX GROUNDWORKS PRIVATE LIMITED
15.8.1 COMPANY SNAPSHOT
15.8.2 BRAND PORTFOLIO
15.8.3 RECENT DEVELOPMENT
15.9 NEXT PROTOTYPES E.V.
15.9.1 COMPANY SNAPSHOT
15.9.2 PROJECT PORTFOLIO
15.9.3 RECENT DEVELOPMENT
15.1 SPACEX
15.10.1 COMPANY SNAPSHOT
15.10.2 PROJECT PORTFOLIO
15.10.3 RECENT DEVELOPMENT
15.11 TESLA
15.11.1 COMPANY SNAPSHOT
15.11.2 REVENUE ANALYSIS
15.11.3 PRODUCT PORTFOLIO
15.11.4 RECENT DEVELOPMENT
15.12 VICHYPER
15.12.1 COMPANY SNAPSHOT
15.12.2 PROJECT PORTFOLIO
15.12.3 RECENT DEVELOPMENT
15.13 WASHINGTON HYPERLOOP
15.13.1 COMPANY SNAPSHOT
15.13.2 PROJECT PORTFOLIO
15.13.3 RECENT DEVELOPMENT
15.14 WATERLOOP
15.14.1 COMPANY SNAPSHOT
15.14.2 PROJECT PORTFOLIO
15.14.3 RECENT DEVELOPMENT
15.15 ZELEROS
15.15.1 COMPANY SNAPSHOT
15.15.2 PROJECT PORTFOLIO
15.15.3 RECENT DEVELOPMENTS
16 QUESTIONNAIRE
17 RELATED REPORTS
List of Table
LIST OF TABLES
TABLE 1 TRAVEL TIME SAVED USING HYPERLOOP TECHNOLOGY WHILE TRAVELLING FROM MAJOR CITIES ACROSS THE U.K. TO LONDON
TABLE 2 COMPARISON OF CAPITAL COSTS BY TRANSPORTATION MODE
TABLE 3 ASIA-PACIFIC HYPERLOOP TECHNOLOGY MARKET, BY COMPONENTS, MARKET FORECAST 2022-2029 (USD MILLION)
TABLE 4 ASIA-PACIFIC TUBE IN HYPERLOOP TECHNOLOGY MARKET, BY REGION,2022-2029, (USD MILLION)
TABLE 5 ASIA-PACIFIC CAPSULE IN HYPERLOOP TECHNOLOGY MARKET, BY REGION,2022-2029, (USD MILLION)
TABLE 6 ASIA-PACIFIC PROPULSION SYSTEM IN HYPERLOOP TECHNOLOGY MARKET, BY REGION,2022-2029, (USD MILLION)
TABLE 7 ASIA-PACIFIC OTHERS IN HYPERLOOP TECHNOLOGY MARKET, BY REGION,2022-2029, (USD MILLION)
TABLE 8 ASIA-PACIFIC HYPERLOOP TECHNOLOGY MARKET, BY SPEED, MARKET FORECAST 2022-2029 (USD MILLION)
TABLE 9 ASIA-PACIFIC MORE THAN 700 MILES IN HYPERLOOP TECHNOLOGY MARKET, BY REGION,2022-2029, (USD MILLION)
TABLE 10 ASIA-PACIFIC LESS THAN 700 MILES IN HYPERLOOP TECHNOLOGY MARKET, BY REGION,2022-2029, (USD MILLION)
TABLE 11 ASIA-PACIFIC HYPERLOOP TECHNOLOGY MARKET, BY CAPACITY, MARKET FORECAST 2022-2029 (USD MILLION)
TABLE 12 ASIA-PACIFIC SEAT CAPACITY IN HYPERLOOP TECHNOLOGY MARKET, BY REGION,2022-2029, (USD MILLION)
TABLE 13 ASIA-PACIFIC CARRIAGE CAPACITY IN HYPERLOOP TECHNOLOGY MARKET, BY REGION,2022-2029, (USD MILLION)
TABLE 14 ASIA-PACIFIC HYPERLOOP TECHNOLOGY MARKET, BY ROUTE, MARKET FORECAST 2022-2029 (USD MILLION)
TABLE 15 ASIA-PACIFIC INTERCITY IN HYPERLOOP TECHNOLOGY MARKET, BY REGION,2022-2029, (USD MILLION)
TABLE 16 ASIA-PACIFIC INTRACITY IN HYPERLOOP TECHNOLOGY MARKET, BY REGION,2022-2029, (USD MILLION)
TABLE 17 ASIA-PACIFIC HYPERLOOP TECHNOLOGY MARKET, BY APPLICATION, MARKET FORECAST 2022-2029 (USD MILLION)
TABLE 18 ASIA-PACIFIC PASSENGER IN HYPERLOOP TECHNOLOGY MARKET, BY REGION,2022-2029, (USD MILLION)
TABLE 19 ASIA-PACIFIC CARGO/FREIGHT IN HYPERLOOP TECHNOLOGY MARKET, BY REGION,2022-2029, (USD MILLION)
TABLE 20 ASIA PACIFIC HYPERLOOP TECHNOLOGY MARKET, BY COUNTRY, 2020-2029 (USD MILLION)
TABLE 21 ASIA PACIFIC HYPERLOOP TECHNOLOGY MARKET, BY COMPONENTS, 2020-2029 (USD MILLION)
TABLE 22 ASIA PACIFIC HYPERLOOP TECHNOLOGY MARKET, BY SPEED, 2020-2029 (USD MILLION)
TABLE 23 ASIA PACIFIC HYPERLOOP TECHNOLOGY MARKET, BY CAPACITY, 2020-2029 (USD MILLION)
TABLE 24 ASIA PACIFIC SEAT CAPACITY IN HYPERLOOP TECHNOLOGY MARKET, BY TYPE, 2020-2029 (USD MILLION)
TABLE 25 ASIA PACIFIC HYPERLOOP TECHNOLOGY MARKET, BY ROUTE, 2020-2029 (USD MILLION)
TABLE 26 ASIA PACIFIC HYPERLOOP TECHNOLOGY MARKET, BY APPLICATION, 2020-2029 (USD MILLION)
TABLE 27 CHINA HYPERLOOP TECHNOLOGY MARKET, BY COMPONENTS, 2020-2029 (USD MILLION)
TABLE 28 CHINA HYPERLOOP TECHNOLOGY MARKET, BY SPEED, 2020-2029 (USD MILLION)
TABLE 29 CHINA HYPERLOOP TECHNOLOGY MARKET, BY CAPACITY, 2020-2029 (USD MILLION)
TABLE 30 CHINA SEAT CAPACITY IN HYPERLOOP TECHNOLOGY MARKET, BY TYPE, 2020-2029 (USD MILLION)
TABLE 31 CHINA HYPERLOOP TECHNOLOGY MARKET, BY ROUTE, 2020-2029 (USD MILLION)
TABLE 32 CHINA HYPERLOOP TECHNOLOGY MARKET, BY APPLICATION, 2020-2029 (USD MILLION)
TABLE 33 JAPAN HYPERLOOP TECHNOLOGY MARKET, BY COMPONENTS, 2020-2029 (USD MILLION)
TABLE 34 JAPAN HYPERLOOP TECHNOLOGY MARKET, BY SPEED, 2020-2029 (USD MILLION)
TABLE 35 JAPAN HYPERLOOP TECHNOLOGY MARKET, BY CAPACITY, 2020-2029 (USD MILLION)
TABLE 36 JAPAN SEAT CAPACITY IN HYPERLOOP TECHNOLOGY MARKET, BY TYPE, 2020-2029 (USD MILLION)
TABLE 37 JAPAN HYPERLOOP TECHNOLOGY MARKET, BY ROUTE, 2020-2029 (USD MILLION)
TABLE 38 JAPAN HYPERLOOP TECHNOLOGY MARKET, BY APPLICATION, 2020-2029 (USD MILLION)
TABLE 39 SOUTH KOREA HYPERLOOP TECHNOLOGY MARKET, BY COMPONENTS, 2020-2029 (USD MILLION)
TABLE 40 SOUTH KOREA HYPERLOOP TECHNOLOGY MARKET, BY SPEED, 2020-2029 (USD MILLION)
TABLE 41 SOUTH KOREA HYPERLOOP TECHNOLOGY MARKET, BY CAPACITY, 2020-2029 (USD MILLION)
TABLE 42 SOUTH KOREA SEAT CAPACITY IN HYPERLOOP TECHNOLOGY MARKET, BY TYPE, 2020-2029 (USD MILLION)
TABLE 43 SOUTH KOREA HYPERLOOP TECHNOLOGY MARKET, BY ROUTE, 2020-2029 (USD MILLION)
TABLE 44 SOUTH KOREA HYPERLOOP TECHNOLOGY MARKET, BY APPLICATION, 2020-2029 (USD MILLION)
TABLE 45 AUSTRALIA HYPERLOOP TECHNOLOGY MARKET, BY COMPONENTS, 2020-2029 (USD MILLION)
TABLE 46 AUSTRALIA HYPERLOOP TECHNOLOGY MARKET, BY SPEED, 2020-2029 (USD MILLION)
TABLE 47 AUSTRALIA HYPERLOOP TECHNOLOGY MARKET, BY CAPACITY, 2020-2029 (USD MILLION)
TABLE 48 AUSTRALIA SEAT CAPACITY IN HYPERLOOP TECHNOLOGY MARKET, BY TYPE, 2020-2029 (USD MILLION)
TABLE 49 AUSTRALIA HYPERLOOP TECHNOLOGY MARKET, BY ROUTE, 2020-2029 (USD MILLION)
TABLE 50 AUSTRALIA HYPERLOOP TECHNOLOGY MARKET, BY APPLICATION, 2020-2029 (USD MILLION)
TABLE 51 INDIA HYPERLOOP TECHNOLOGY MARKET, BY COMPONENTS, 2020-2029 (USD MILLION)
TABLE 52 INDIA HYPERLOOP TECHNOLOGY MARKET, BY SPEED, 2020-2029 (USD MILLION)
TABLE 53 INDIA HYPERLOOP TECHNOLOGY MARKET, BY CAPACITY, 2020-2029 (USD MILLION)
TABLE 54 INDIA SEAT CAPACITY IN HYPERLOOP TECHNOLOGY MARKET, BY TYPE, 2020-2029 (USD MILLION)
TABLE 55 INDIA HYPERLOOP TECHNOLOGY MARKET, BY ROUTE, 2020-2029 (USD MILLION)
TABLE 56 INDIA HYPERLOOP TECHNOLOGY MARKET, BY APPLICATION, 2020-2029 (USD MILLION)
TABLE 57 THAILAND HYPERLOOP TECHNOLOGY MARKET, BY COMPONENTS, 2020-2029 (USD MILLION)
TABLE 58 THAILAND HYPERLOOP TECHNOLOGY MARKET, BY SPEED, 2020-2029 (USD MILLION)
TABLE 59 THAILAND HYPERLOOP TECHNOLOGY MARKET, BY CAPACITY, 2020-2029 (USD MILLION)
TABLE 60 THAILAND SEAT CAPACITY IN HYPERLOOP TECHNOLOGY MARKET, BY TYPE, 2020-2029 (USD MILLION)
TABLE 61 THAILAND HYPERLOOP TECHNOLOGY MARKET, BY ROUTE, 2020-2029 (USD MILLION)
TABLE 62 THAILAND HYPERLOOP TECHNOLOGY MARKET, BY APPLICATION, 2020-2029 (USD MILLION)
TABLE 63 INDONESIA HYPERLOOP TECHNOLOGY MARKET, BY COMPONENTS, 2020-2029 (USD MILLION)
TABLE 64 INDONESIA HYPERLOOP TECHNOLOGY MARKET, BY SPEED, 2020-2029 (USD MILLION)
TABLE 65 INDONESIA HYPERLOOP TECHNOLOGY MARKET, BY CAPACITY, 2020-2029 (USD MILLION)
TABLE 66 INDONESIA SEAT CAPACITY IN HYPERLOOP TECHNOLOGY MARKET, BY TYPE, 2020-2029 (USD MILLION)
TABLE 67 INDONESIA HYPERLOOP TECHNOLOGY MARKET, BY ROUTE, 2020-2029 (USD MILLION)
TABLE 68 INDONESIA HYPERLOOP TECHNOLOGY MARKET, BY APPLICATION, 2020-2029 (USD MILLION)
TABLE 69 REST OF ASIA PACIFIC HYPERLOOP TECHNOLOGY MARKET, BY COMPONENTS, 2020-2029 (USD MILLION)
List of Figure
LIST OF FIGURES
FIGURE 1 ASIA-PACIFIC HYPERLOOP TECHNOLOGY MARKET: SEGMENTATION
FIGURE 2 ASIA-PACIFIC HYPERLOOP TECHNOLOGY MARKET: DATA TRIANGULATION
FIGURE 3 ASIA-PACIFIC HYPERLOOP TECHNOLOGY MARKET: DROC ANALYSIS
FIGURE 4 ASIA-PACIFIC HYPERLOOP TECHNOLOGY MARKET: ASIA-PACIFIC VS REGIONAL MARKET ANALYSIS
FIGURE 5 ASIA-PACIFIC HYPERLOOP TECHNOLOGY MARKET: COMPANY RESEARCH ANALYSIS
FIGURE 6 ASIA-PACIFIC HYPERLOOP TECHNOLOGY MARKET: INTERVIEW DEMOGRAPHICS
FIGURE 7 ASIA-PACIFIC HYPERLOOP TECHNOLOGY MARKET: DBMR MARKET POSITION GRID
FIGURE 8 ASIA-PACIFIC HYPERLOOP TECHNOLOGY MARKET: VENDOR SHARE ANALYSIS
FIGURE 9 ASIA-PACIFIC HYPERLOOP TECHNOLOGY MARKET: MARKET APPLICATION COVERAGE GRID
FIGURE 10 ASIA-PACIFIC HYPERLOOP TECHNOLOGY MARKET: SEGMENTATION
FIGURE 11 DECREASED TRAVEL TIME AND TRANSPORT COSTS IS EXPECTED TO DRIVE ASIA-PACIFIC HYPERLOOP TECHNOLOGY MARKET IN THE FORECAST PERIOD OF 2022 TO 2029
FIGURE 12 COMPONENTS SEGMENT IS EXPECTED TO ACCOUNT FOR THE LARGEST SHARE OF ASIA-PACIFIC HYPERLOOP TECHNOLOGY MARKET IN 2021 & 2029
FIGURE 13 DRIVERS, RESTRAINTS, OPPORTUNITIES AND CHALLENGES OF ASIA-PACIFIC HYPERLOOP TECHNOLOGY MARKET
FIGURE 14 ASIA-PACIFIC HYPERLOOP TECHNOLOGY MARKET: BY COMPONENTS, 2021
FIGURE 15 ASIA-PACIFIC HYPERLOOP TECHNOLOGY MARKET: BY SPEED, 2021
FIGURE 16 ASIA-PACIFIC HYPERLOOP TECHNOLOGY MARKET: BY CAPACITY, 2021
FIGURE 17 ASIA-PACIFIC HYPERLOOP TECHNOLOGY MARKET: BY ROUTE, 2021
FIGURE 18 ASIA-PACIFIC HYPERLOOP TECHNOLOGY MARKET: BY APPLICATION, 2021
FIGURE 19 ASIA PACIFIC HYPERLOOP TECHNOLOGY MARKET: SNAPSHOT (2021)
FIGURE 20 ASIA PACIFIC HYPERLOOP TECHNOLOGY MARKET: BY COUNTRY (2021)
FIGURE 21 ASIA PACIFIC HYPERLOOP TECHNOLOGY MARKET: BY COUNTRY (2022 & 2029)
FIGURE 22 ASIA PACIFIC HYPERLOOP TECHNOLOGY MARKET: BY COUNTRY (2020 & 2029)
FIGURE 23 ASIA PACIFIC HYPERLOOP TECHNOLOGY MARKET: BY COMPONENTS (2022-2029)
FIGURE 24 ASIA-PACIFIC HYPERLOOP TECHNOLOGY MARKET: COMPANY SHARE 2021 (%)
Data collection and base year analysis are done using data collection modules with large sample sizes. The stage includes obtaining market information or related data through various sources and strategies. It includes examining and planning all the data acquired from the past in advance. It likewise envelops the examination of information inconsistencies seen across different information sources. The market data is analysed and estimated using market statistical and coherent models. Also, market share analysis and key trend analysis are the major success factors in the market report. To know more, please request an analyst call or drop down your inquiry.
The key research methodology used by DBMR research team is data triangulation which involves data mining, analysis of the impact of data variables on the market and primary (industry expert) validation. Data models include Vendor Positioning Grid, Market Time Line Analysis, Market Overview and Guide, Company Positioning Grid, Patent Analysis, Pricing Analysis, Company Market Share Analysis, Standards of Measurement, Global versus Regional and Vendor Share Analysis. To know more about the research methodology, drop in an inquiry to speak to our industry experts.
Data Bridge Market Research is a leader in advanced formative research. We take pride in servicing our existing and new customers with data and analysis that match and suits their goal. The report can be customized to include price trend analysis of target brands understanding the market for additional countries (ask for the list of countries), clinical trial results data, literature review, refurbished market and product base analysis. Market analysis of target competitors can be analyzed from technology-based analysis to market portfolio strategies. We can add as many competitors that you require data about in the format and data style you are looking for. Our team of analysts can also provide you data in crude raw excel files pivot tables (Fact book) or can assist you in creating presentations from the data sets available in the report.


