Mercado europeu de caulim, por grau (calcinado, hidratado, delaminado, tratado de superfície e estruturado), processo (lavado com água, flutuador de ar, calcinado, delaminado e modificado de superfície e não processado), aplicação (Papel, Cerâmica, Tintas e Revestimentos, Fibra de Vidro, Plástico,Borracha, Produtos farmacêuticos e médicos, cosméticos e outros) Tendências e previsões da indústria para 2029
Qual é a dimensão e a taxa de crescimento do mercado do caulim europeu
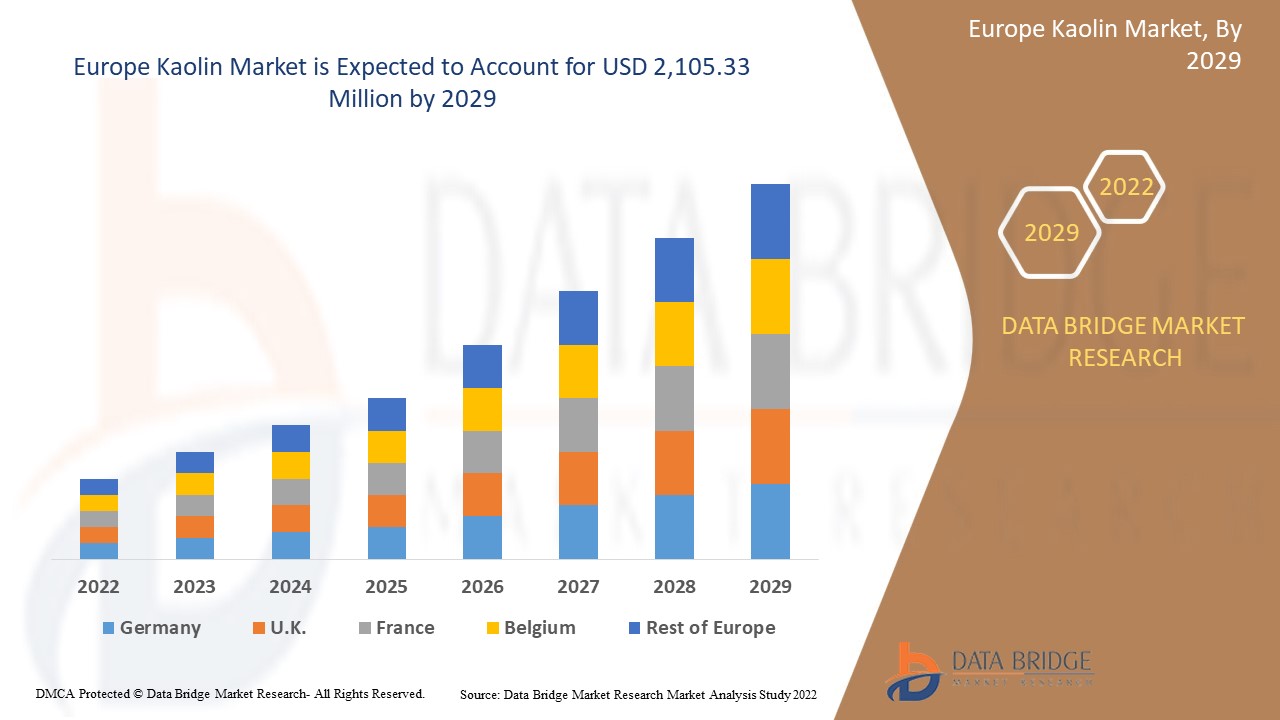
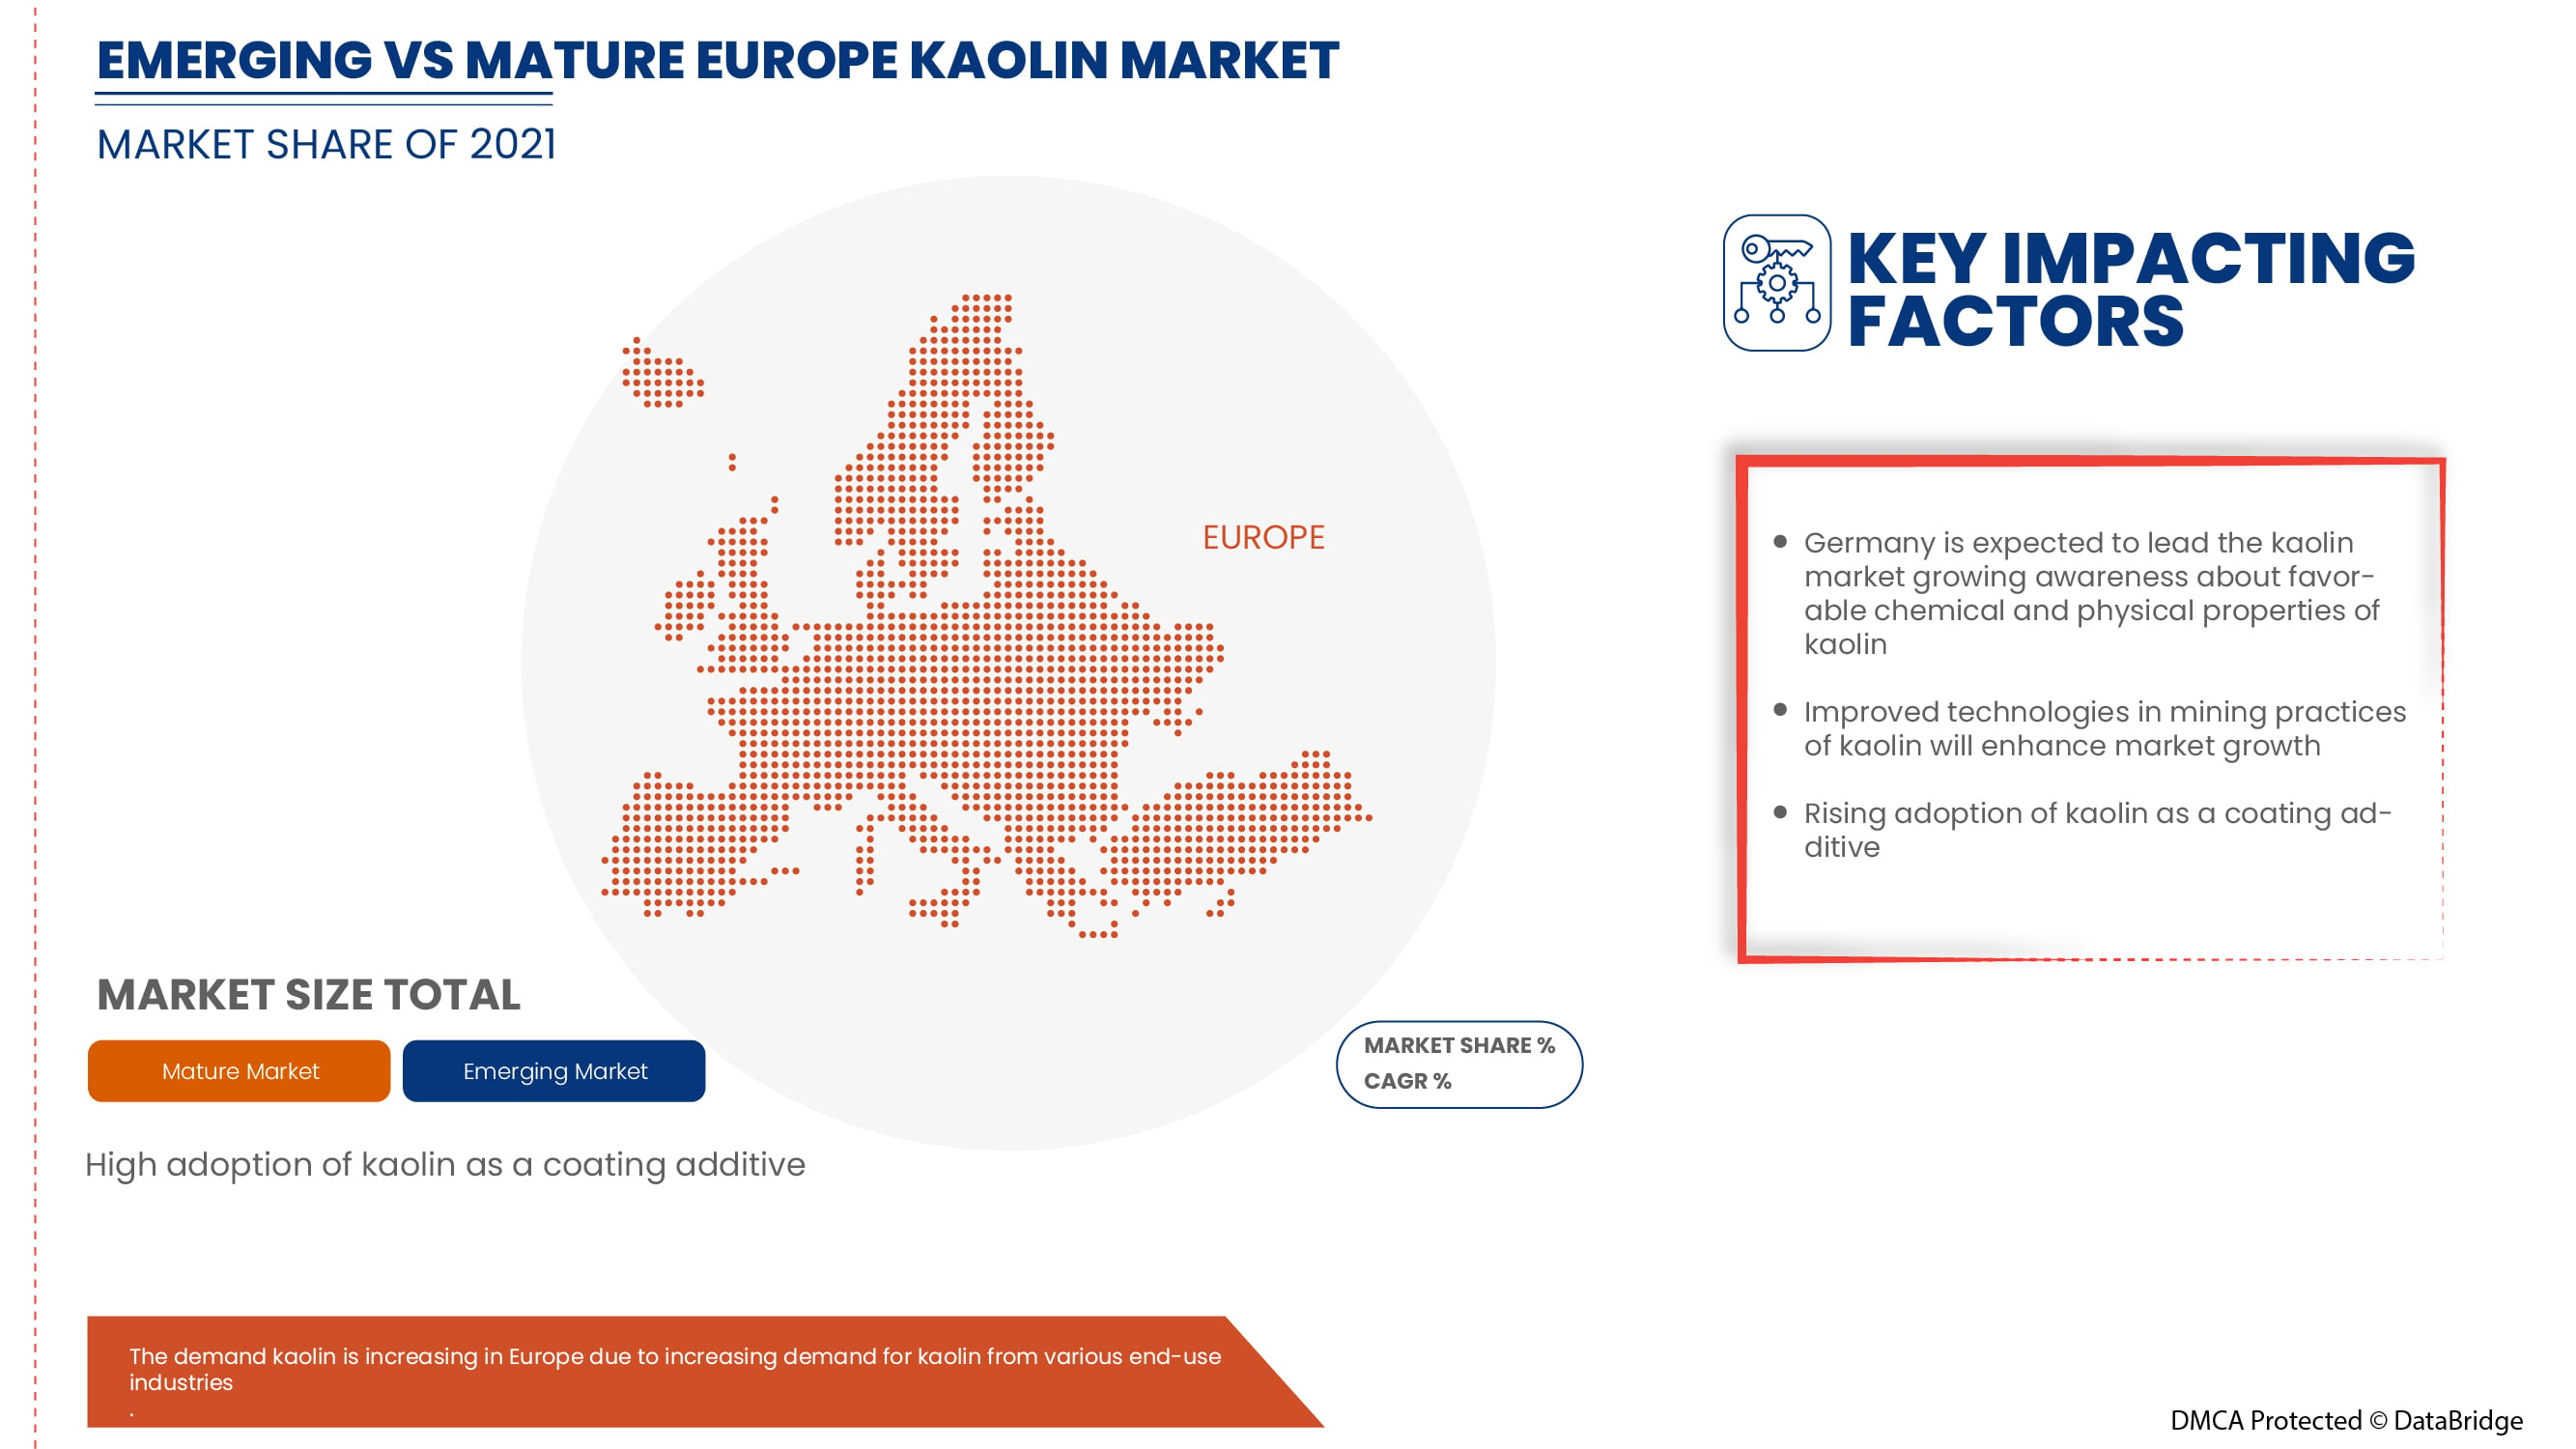
Prevê-se que o mercado europeu de caulino cresça significativamente no período previsto de 2022 a 2029. Data Bridge Market Research analisa que o mercado está crescendo com um CAGR de 4,7% no período de previsão de 2022 a 2029 e que deverá chegar a USD 2,105,33 milhões até 2029. O principal factor que impulsiona o crescimento do mercado do caulim é o aumento doconstruçãoatividades em todo o mundo, propriedades químicas e físicas favoráveis do caulim, aumento da demanda por caulim de diversas indústrias de uso final, e alta adoção do caulim comorevestimentoaditivo.
As indústrias estão cada vez mais adotando o caulim como matéria-prima para a produção de medicamentos e cosméticos de importância comercial. Além disso, a propriedade química, como a adsorção de proteínas, lipídios e óleos, aumentou o uso de caulim para produzir lavagens faciais, máscaras faciais, sacos de lama, esfregantes corporais e outros produtos cosméticos. Medicamentos, tais como enxaguantes bucais, almofadas cirúrgicas, agentes de secagem e protetores temporários contra a erupção de fraldas, usam o caulim como ingrediente chave devido às suas propriedades químicas favoráveis. Portanto, o uso extensivo de caulim em aplicações e indústrias variadas pode impulsionar o crescimento do mercado europeu de caulim.
O relatório de mercado do caulim europeu fornece detalhes sobre a quota de mercado, novos desenvolvimentos e o impacto de intervenientes nacionais e localizados no mercado, analisa as oportunidades em termos de bolsas de receitas emergentes, mudanças na regulamentação do mercado, aprovações de produtos, decisões estratégicas, lançamentos de produtos, expansões geográficas e inovações tecnológicas no mercado. Para entender a análise e o cenário de mercado, entre em contato conosco para um breve analista. Nossa equipe irá ajudá-lo a criar uma solução de impacto de receita para alcançar seu objetivo desejado.
|
Metric de Relatório |
Detalhes |
|
Período de previsão |
2022 a 2029 |
|
Ano de base |
2021 |
|
Anos Históricos |
2020 (Alfândega até 2019 - 2014) |
|
Unidades quantitativas |
Receitas em milhões de dólares |
|
Segmentos Cobertos |
Por grau (Calcinado, Hidros, Delaminado, Tratamento de Superfície e Estruturado), Processo (Washed de Água, Airfloat, Calcinado, Delaminado, e Superfície-Modificada e Não Processada), Aplicação (Papel, Cerâmica, Tintas e Revestimentos, Fibra de Vidro, Plástico, Borracha, Farmacêutica e Médica, Cosméticos e Outros) |
|
Países abrangidos |
Reino Unido, Rússia, França, Espanha, Itália, Alemanha, Turquia, Países Baixos, Suíça, Bélgica e o resto da Europa. |
|
Jogadores de mercado cobertos |
Quartz Works GmbH, LB MINERALS, Ltd., KaMin LLC. / CADAM, Imerys S.A., SIbelCO, Ashapura Group, Thiele Kaolin Company, BASF SE |
Definição do mercado
O caulim, também chamado de argila de porcelana, é uma argila branca macia usada como ingrediente necessário na fabricação de papel, borracha, cosméticos e outros. O caulim é usado como um agente de enchimento na indústria do papel com adesivo, o que melhora a aparência do papel, dando-lhe brilho variado, suavidade, brilho, opacidade e impressão. Além disso, o produto aumenta a impressão do papel, proporcionando absorção de tinta, retenção de pigmento de tinta e maior rugosidade. É altamente utilizado na indústria cerâmica para a fabricação de porcelana e refratária. O caulim melhora a resistência mecânica e à abrasão na indústria da borracha.
Dinâmica do mercado de caulino europeu
Esta seção trata da compreensão dos motoristas de mercado, restrições, oportunidades e desafios. Tudo isso é discutido em detalhes abaixo:
Controladores
- Ascensão em atividades de construção em todo o mundo
O aumento das atividades de construção em economias em desenvolvimento tem sido apoiado por maior migração da população rural para centros urbanos e aumento do investimento no desenvolvimento de infraestrutura. A crescente demanda de produtos devido às crescentes práticas de remodelação residencial em vários países, como os EUA, à deriva foco consumidor para substituir pisos de madeira com telhas cerâmicas, impulsiona o crescimento do mercado de caulim. Além disso, espera-se que a Europa testemunhe também um ritmo rápido devido ao aumento da produção e do consumo de cerâmica nos seus países.
- Propriedades químicas e físicas favoráveis do caulim
O caulim é preferido como um metal de escolha em várias indústrias de aplicação e uso final devido às suas propriedades químicas e físicas desejadas e favoráveis que executa quando usado. Há uma demanda crescente de argila de caulim na indústria de plásticos, pois seu uso aumenta seu desempenho elétrico, durabilidade e resistência. Além disso, a crescente adoção de cerâmica se deve à opacidade, inerte química, textura não abrasiva e forma plana de argila de caulim. Além disso, o uso de caulim em concreto e argamassa está aumentando devido à sua estabilidade térmica. Alguns graus de caulim têm tamanhos de partículas finas, alta adsorção e propriedades de suspensão.
- Aumento da procura de caulino de várias indústrias de utilização final
Muitas variáveis e propriedades significativas que atuam em favor do caulim e da crescente demanda por produtos feitos de caulim têm mantido o mercado de caulim crescendo constantemente em todo o mundo. A aplicação mais comum do caulim é no setor de papel, permitindo que ele seja utilizado como um revestimento de papel com uma textura suave e opacidade adequada. O aumento deve-se ao aumento da procura de papel de várias indústrias de utilização final, tais como embalagens e impressão. Além disso, este material é amplamente utilizado para encher e cobrir peças, pois reduz o tamanho das partículas e aumenta a resistência. O caulim é frequentemente utilizado na indústria do papel porque oferece uma variedade de qualidades, incluindo boa receptividade à tinta, suavidade ao papel e a opacidade ideal para a fabricação de papel.
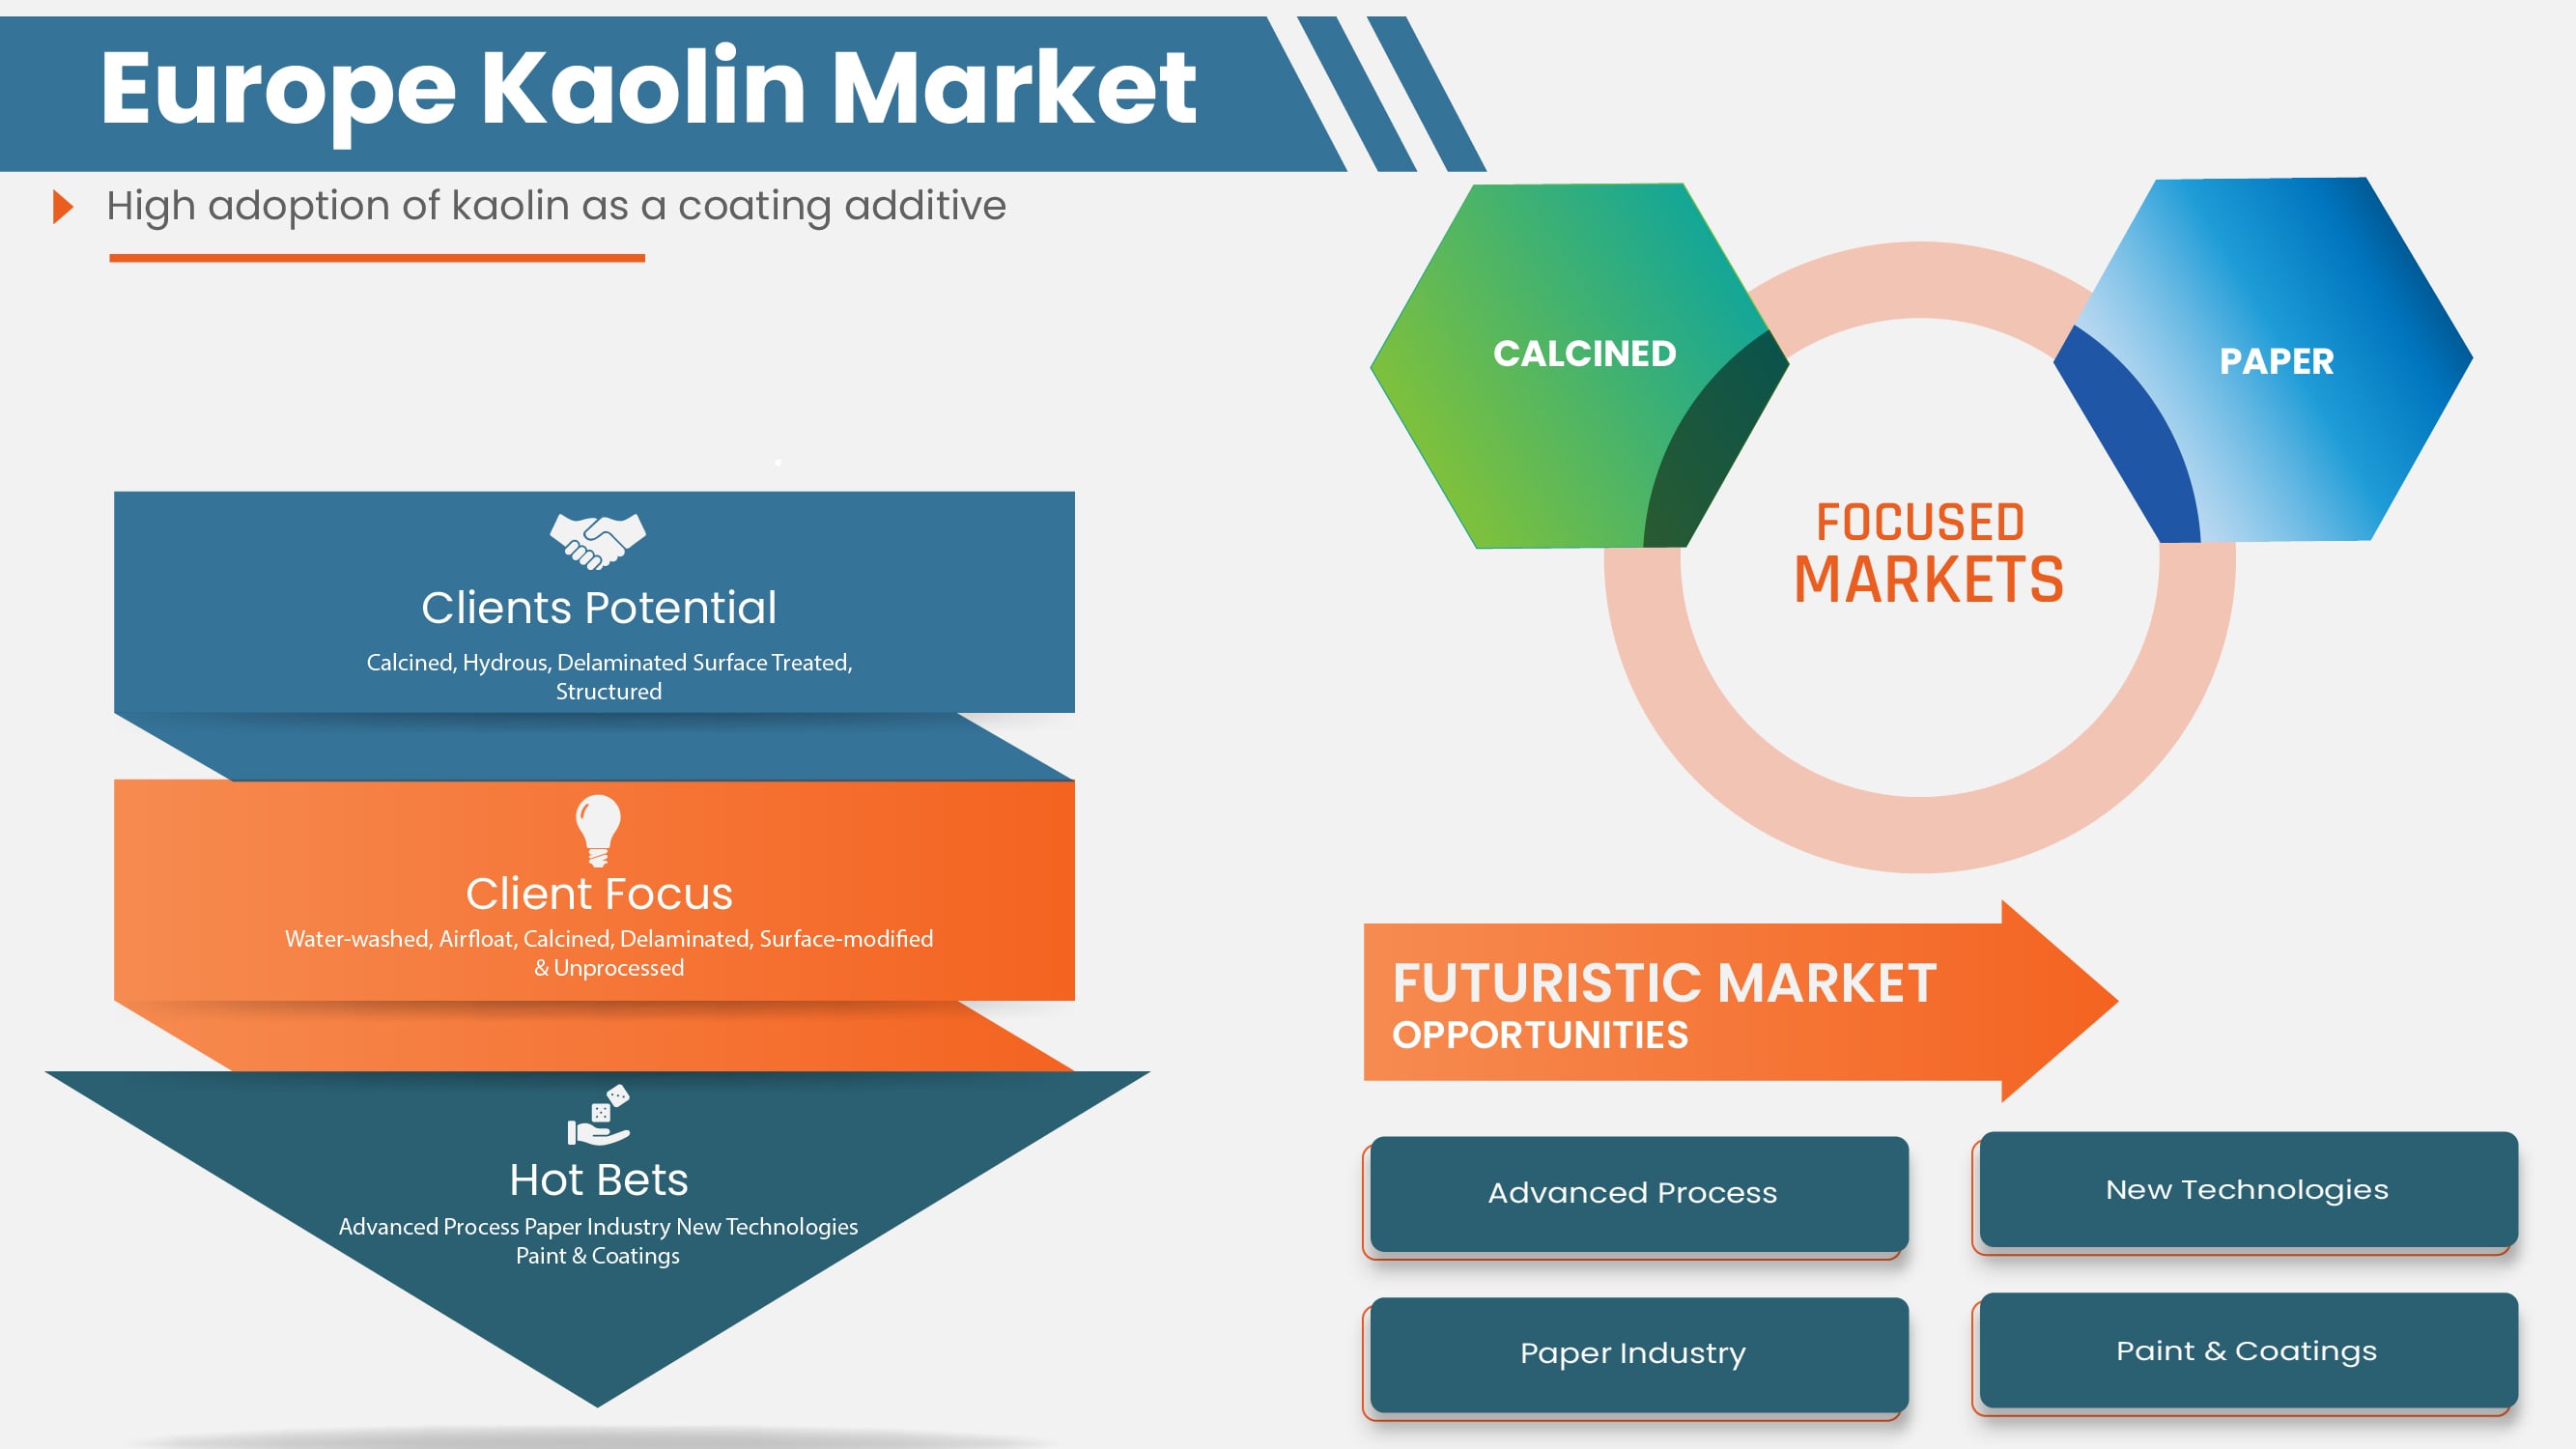
- Alta adoção de caulim como aditivo de revestimento
A indústria de papel e tintas e revestimentos estão entre os principais usuários de caulim em seus produtos. O caulim é utilizado para melhorar o desempenho das tintas na forma de melhores propriedades de suspensão, dispersão rápida, resistência à corrosão, resistência à água superior e viscosidades reduzidas. Além disso, o caulim é empregado como agente de revestimento e enchimento quando combinado com adesivos em revestimento de papel para fornecer sua opacidade, cor e impressão. O caulim é o mineral particulado mais utilizado no papel de enchimento e revestimento. Melhora a aparência do papel, caracterizada pelo brilho, suavidade, brilho e opacidade, e de maior importância, melhora a imprimibilidade. O papel também é preenchido com caulim para estender a fibra.
Oportunidades
- Iniciativas estratégicas-chave implementadas por empresas líderes
O mercado europeu de caulim teve um efeito negativo inesperado devido ao surgimento de COVID-10 e bloqueios nacionais e restrições de movimento. Por conseguinte, os fabricantes concentram-se principalmente em manter o fluxo de liquidez para evitar novas perdas. Além disso, os principais intervenientes no mercado do caulim têm vindo a implementar várias iniciativas estratégicas e desenvolvimentos para ganhar uma quota de mercado importante e dominante e melhorar as suas operações.
- Tecnologias melhoradas nas práticas de mineração de caulim
O desenvolvimento tecnológico para o processamento de caulino é essencialmente o desenvolvimento de uma folha de fluxo sequentilizado para sua beneficiação de modo que todas as impurezas indesejadas sejam removidas, e as propriedades requeridas do material processado são asseguradas por dimensionamento adequado, melhoria de brilho, modificações de superfície e outras operações. Métodos modernos de beneficiação de caulino (via úmida) utilizam técnicas como esmagamento/atrição, blunging, triagem ou classificação mecânica, separações centrífugas, separação magnética, floculação seletiva, flotação por espuma e branqueamento oxidativo e redutor. Técnicas adicionais, como atrito/delaminação, pugging, calcinação, modificação de superfície, etc., também são empregadas para melhorar as propriedades do produto final.
Restrições/Desafios
- Efeito negativo na indústria do papel devido ao surgimento de covid-19
O surto de COVID-19 interrompeu a fabricação e o fornecimento do mercado de caulim, atrasando a expansão da indústria mundial. Muitas empresas de caulino estão empregando formas de evitar perdas de tempo de parada, que são cada vez mais preocupantes à medida que os efeitos da pandemia persistem. O desempenho do caulim em aplicações de enchimento de papel foi corroído pela concorrência de materiais alternativos, particularmente carbonatos de cálcio. O crescimento lento da produção de papel revestido limitará os avanços do caulim no futuro, restringindo assim o desenvolvimento do mercado europeu do caulim.
- A mineração de caulim causa inúmeros riscos ambientais e para a saúde
Do ponto de vista ambiental, o problema ambiental mais significativo surge porque as operações extrativas de caulim criam superfícies com alta suscetibilidade ao escoamento superficial e à erosão da água, com alto potencial para efeitos ambientais no local e fora do local. Além disso, o caulim mineiro tem impactos negativos a longo prazo no meio ambiente, como desequilíbrios ambientais e agrícolas, erosão, silting de rios e lagos e desmatamento. Devido à remoção de vegetação para o processo de escavação e remoção de argila, parte do solo local está desprotegida, causando processos de compactação em determinadas situações e lixiviação. Uma vez que o solo lixiviado se torna inadequado para a agricultura, a terra utilizada para extração de argila acaba sendo abandonada pelos proprietários. Por conseguinte, o caulim mineiro resulta na degradação do ambiente e da saúde humana, que deverá conter o crescimento e o desenvolvimento do mercado europeu de caulim.
- Fácil disponibilidade de substitutos
Alguns outros substitutos facilmente disponíveis no mercado são argila bentonita. A argila bentonita tem poderosas propriedades de absorção de óleo e pode absorver mais do que sua massa corporal em água. Isso o torna um excelente ingrediente para pessoas com pele extremamente oleosa e impulsiona seu uso em produtos cosméticos. A argila bentonita é composta por montmorillonita, um tipo de argila esmecita. Tem alto teor de água e incha quando entra em contato com água. Isto torna-o eficaz para extrair impurezas da pele. Outra alternativa é a terra de Fuller, que também é usada para cuidados com a pele e desintoxicação. Além disso, a argila rhassoul é uma argila que é minada nas Montanhas Atlas em Marrocos. É rico em minerais, tem propriedades de limpeza e condicionamento, e é uma ótima alternativa à argila de caulim.
- Aumento no preço do caulim
As empresas e os intervenientes que operam no mercado europeu do caulim estão focados no aumento dos preços do caulim para garantir a sustentabilidade a longo prazo do negócio. Estes jogadores anunciaram um aumento de preços em 2021 para diferentes aplicações, em que o papel estava entre as principais aplicações. A maioria das empresas experimentou inflação em vários aspectos do negócio, incluindo inflação em produtos químicos e custos de carga. Além disso, a descida causada pela fuga da pandemia dos principais sectores de aplicação afectou directamente os rendimentos dos principais participantes no mercado.
Desenvolvimento recente
- Em julho de 2022, a Thiele Kaolin Company anunciou um aumento de preços de 9% para todas as categorias de produtos devido ao atual clima econômico da Europa, o que resultou em aumento de custos para operações de fabricação em todo o mundo. Para a empresa, esses aumentos de custos impactaram energia, produtos químicos, mão de obra, mineração, manutenção e outros insumos necessários para produzir produtos de qualidade
- Em novembro de 2021, KaMin LLC / CADAM concordou em adquirir o negócio mineral de caulim da BASF SE. O negócio de minerais de caulim faz parte da divisão de Performance Chemicals da BASF. Isso fortalece muito o negócio de caulim da empresa em todo o mundo
Âmbito de aplicação do mercado de caulino europeu
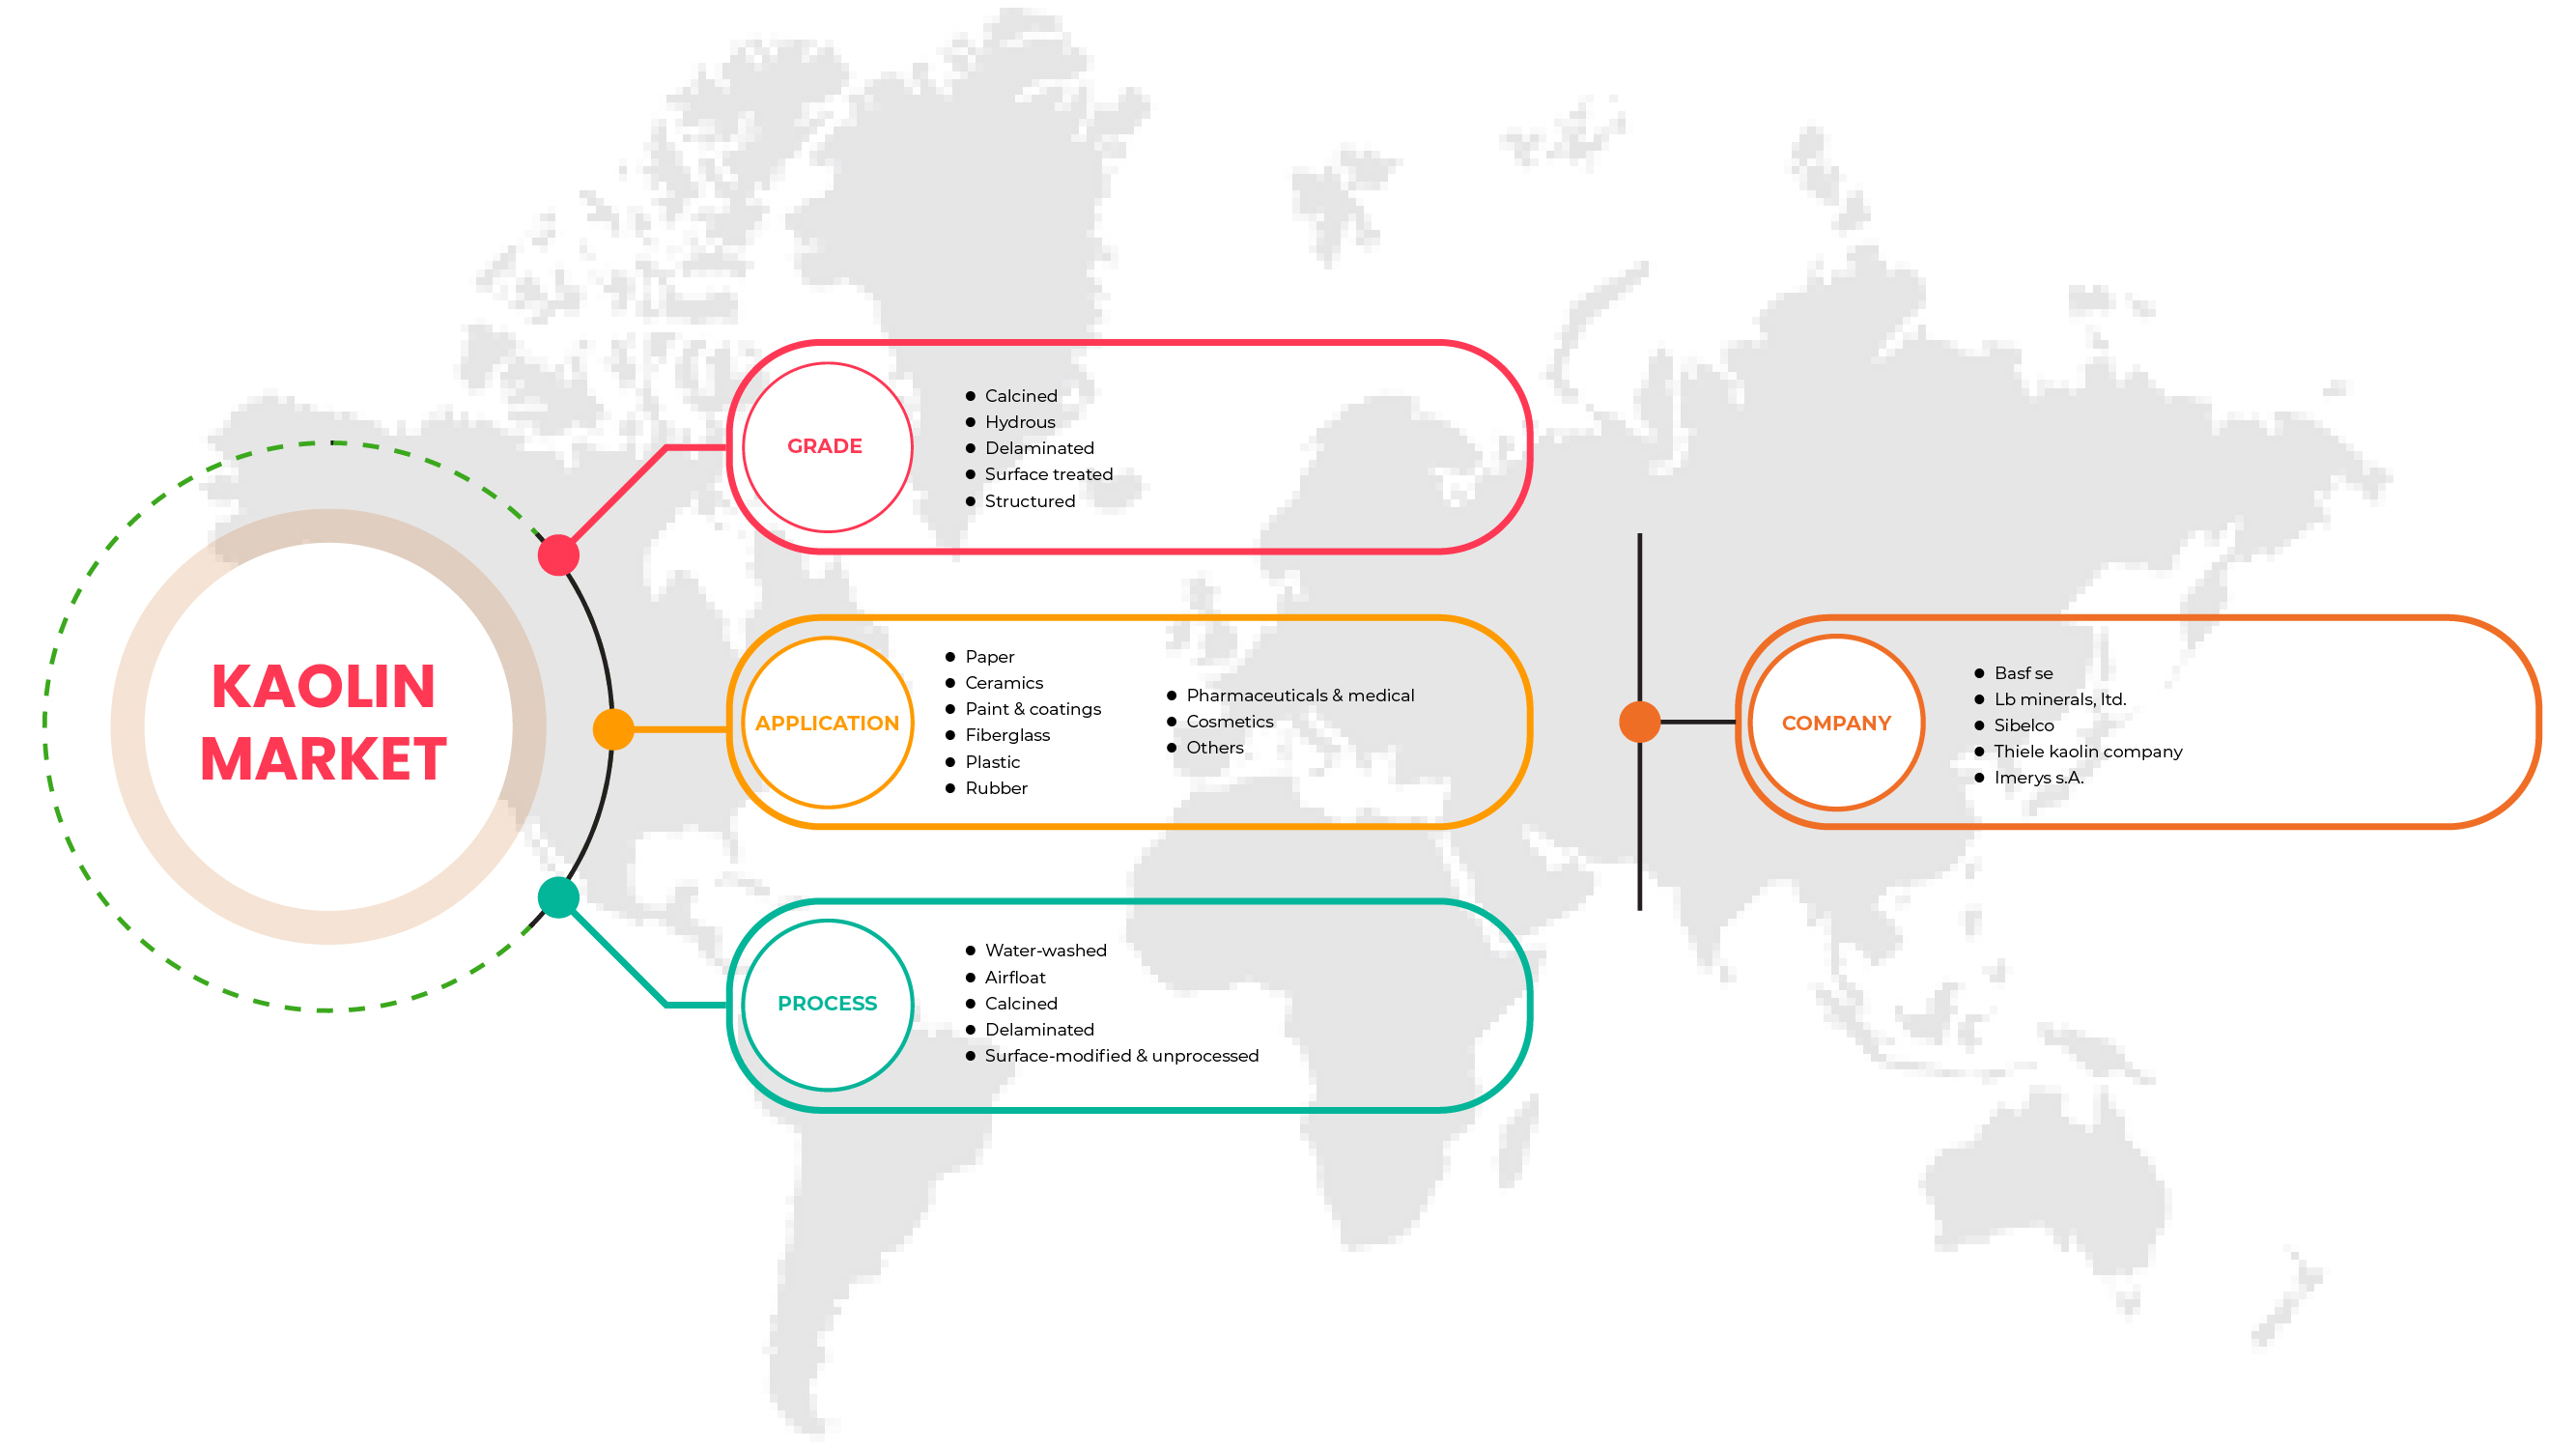
O mercado europeu de caulim é categorizado com base em grau, processo e aplicação. O crescimento entre esses segmentos irá ajudá-lo a analisar os principais segmentos de crescimento nas indústrias e fornecer aos usuários uma visão geral de mercado valiosa e insights de mercado para tomar decisões estratégicas para identificar as principais aplicações do mercado.
Grau
- Calcinado
- Hidróxido
- Delaminado
- Superfície tratada
- Estruturado
Com base no grau, o mercado europeu de caulim é classificado em cinco segmentos, nomeadamente calcinado, hydrous, delaminado, superfície tratada e estruturado.
Processo
- Lavagem de água
- Flutuante aéreo
- Calcinado
- Delaminado
- Modificado à superfície e não processado
Com base no processo, o mercado europeu de caulim é classificado em cinco segmentos lavados a água, flutuado a ar, calcinado, delaminado e modificado à superfície e não processado.
Aplicação
- Papel
- Cerâmica
- Tinta e revestimentos
- Fibra de vidro
- Plástico
- Borracha
- Farmacêuticos e médicos
- Cosméticos
- Outros
Com base na aplicação, o mercado europeu de caulim é classificado em nove segmentos de papel, cerâmica, tintas e revestimentos, fibra de vidro, plástico, borracha, medicamentos e cosméticos, entre outros.
Análise/Insights Regionais do Mercado de Caulim da Europa
O mercado europeu de caulim é segmentado com base em grau, processo e aplicação.
Os países do mercado europeu de caulin são o Reino Unido, Rússia, França, Espanha, Itália, Alemanha, Turquia, Países Baixos, Suíça, Bélgica e o resto da Europa. A Alemanha está a dominar o mercado europeu do caulim em termos de quota de mercado e de receitas de mercado, devido à crescente sensibilização para as excelentes características e propriedades do caulim na região.
A secção «país» do relatório também fornece factores individuais de impacto no mercado e alterações na regulamentação do mercado que afectam as tendências actuais e futuras do mercado. Análise de dados a jusante e a montante da cadeia de valor, tendências tecnológicas, análise de cinco forças de porter e estudos de caso são alguns indicadores usados para prever o cenário de mercado para cada país. Além disso, a presença e a disponibilidade das marcas europeias e os seus desafios enfrentados devido à grande ou escassa concorrência das marcas locais e nacionais, ao impacto das tarifas nacionais e das rotas comerciais são considerados ao mesmo tempo que fornece uma análise de previsão dos dados do país.
Análise competitiva do mercado de caulino e da Europa
A paisagem competitiva do mercado europeu de caulim fornece detalhes pelos concorrentes. Detalhes incluídos são visão geral da empresa, finanças da empresa, receita gerada, potencial de mercado, investimento em pesquisa e desenvolvimento, novas iniciativas de mercado, locais e instalações de produção, pontos fortes e fracos da empresa, lançamento de produtos, testes de produtos pipelines, aprovações de produtos, patentes, largura e amplitude do produto, dominância de aplicação, curva de linha de vida tecnológica. Os pontos de dados acima mencionados estão relacionados apenas com as empresas focadas no mercado europeu de caulim.
Alguns dos principais participantes no mercado europeu de caulino são:
- Quartz Works GmbH
- LB MINERALS, Ltd.
- KaMin LLC. / CADAM
- Imerys S.A.
- SIBELCO
- Grupo Ashapura
- Thiele Kaolin Company
- BASF SE
Metodologia da Pesquisa
A coleta de dados e a análise do ano de base são realizadas utilizando módulos de coleta de dados com grandes tamanhos de amostra. Os dados de mercado são analisados e estimados utilizando modelos estatísticos e coerentes de mercado. Além disso, a análise das quotas de mercado e a análise das tendências fundamentais são os principais factores de sucesso do relatório de mercado. A principal metodologia de pesquisa utilizada pela equipe de pesquisa da DBRM é a triangulação de dados que envolve a mineração de dados, análise do impacto das variáveis de dados no mercado e validação primária (perito em indústria). Os modelos de dados incluem grades de posicionamento do fornecedor, análise da linha de tempo do mercado, visão geral do mercado e guia, grades de posicionamento da empresa, análise de market share da empresa, padrões de medição, análise regional e do fornecedor da Europa. Por favor, solicite uma chamada de analista em caso de investigação adicional.
SKU-
Obtenha acesso online ao relatório sobre a primeira nuvem de inteligência de mercado do mundo

- Painel interativo de análise de dados
- Painel de análise da empresa para oportunidades de elevado potencial de crescimento
- Acesso de analista de pesquisa para personalização e customização. consultas
- Análise da concorrência com painel interativo
- Últimas notícias, atualizações e atualizações Análise de tendências
- Aproveite o poder da análise de benchmark para um rastreio abrangente da concorrência
Índice
1 INTRODUÇÃO
1.1 OBJETIVOS DO ESTUDO
1.2 DEFINIÇÃO DE MERCADO
1.3 VISÃO GERAL DO MERCADO EUROPEU DE CAULIM
1.4 LIMITAÇÕES
1.5 MERCADOS COBERTOS
2 SEGMENTAÇÃO DE MERCADO
2.1 MERCADOS COBERTOS
2.2 ESCOPO GEOGRÁFICO
2,3 ANOS CONSIDERADOS PARA O ESTUDO
2.4 MOEDA E PREÇOS
2.5 MODELO DE VALIDAÇÃO DE DADOS DE TRIPÉ DBMR
2.6 CURVA DA LINHA DE VIDA DO PRODUTO
2.7 MODELAGEM MULTIVARIADA
2.8 ENTREVISTAS PRIMÁRIAS COM PRINCIPAIS LÍDERES DE OPINIÃO
2.9 GRADE DE POSIÇÃO DE MERCADO DBMR
2.1 GRADE DE COBERTURA DE APLICAÇÕES DE MERCADO
2.11 MATRIZ DE DESAFIOS DE MERCADO DBMR
2.12 ANÁLISE DE PARTICIPAÇÃO DO FORNECEDOR DBMR
2.13 DADOS DE IMPORTAÇÃO-EXPORTAÇÃO
2.14 FONTES SECUNDÁRIAS
2.15 PREMISSAS
3 RESUMO EXECUTIVO
4 INSIGHTS PREMIUM
4.1 ANÁLISE DO PILÃO
4.1.1 FATORES POLÍTICOS
4.1.2 FATORES ECONÔMICOS
4.1.3 FATORES SOCIAIS
4.1.4 FATORES TECNOLÓGICOS
4.1.5 FATORES LEGAIS
4.1.6 FATORES AMBIENTAIS
4.2 CINCO FORÇAS DE PORTEIRO:
4.2.1 AMEAÇA DE NOVOS ENTRADAS:
4.2.2 AMEAÇA DE SUBSTITUTOS:
4.2.3 PODER DE NEGOCIAÇÃO DO CLIENTE:
4.2.4 PODER DE NEGOCIAÇÃO DO FORNECEDOR:
4.2.5 COMPETIÇÃO INTERNA (RIVALIDADE):
4.3 CRITÉRIOS CRÍTICOS DE SELEÇÃO PARA DECISÃO EMPRESARIAL
4.4 CENÁRIO DE IMPORTAÇÃO/EXPORTAÇÃO
4.5 PROCESSO DE FABRICAÇÃO: MERCADO EUROPEU DE CAULIM
4.6 MUDANÇAS DE MERCADO / EVENTOS ATUAIS
4.7 CAPACIDADE DE PRODUÇÃO DOS FABRICANTES: MERCADO EUROPEU DE CAULIM
4.8 ANÁLISE DA CADEIA DE FORNECIMENTO - MERCADO EUROPEU DE CAULIM
4.8.1 VISÃO GERAL
4.8.2 CENÁRIO DE CUSTOS LOGÍSTICOS
4.8.3 IMPORTÂNCIA DOS PRESTADORES DE SERVIÇOS DE LOGÍSTICA
4.9 VISÃO GERAL DAS TECNOLOGIAS
4.1 CRITÉRIOS DE SELEÇÃO DE FORNECEDORES
4.11 CENÁRIO DE ANÁLISE DE PREÇOS
4.11.1 ANÁLISE DE PREÇOS DE MATÉRIAS-PRIMAS
4.11.2 ESTATÍSTICAS DE PREÇOS ATUAIS
4.11.3 PREVISÕES DE PREÇOS
4.12 ANÁLISE DE CONSUMO DA PRODUÇÃO
4.13 COBERTURA DA REGULAÇÃO
4.14 CENÁRIO DE CUSTO DE FABRICAÇÃO E IMPACTO FUTURO
5 VISÃO GERAL DO MERCADO
5.1 MOTORISTAS
5.1.1 AUMENTO DAS ATIVIDADES DE CONSTRUÇÃO EM TODO O GLOBO
5.1.2 PROPRIEDADES QUÍMICAS E FÍSICAS FAVORÁVEIS DO CAULIM
5.1.3 AUMENTO DA DEMANDA DE CAULIM POR DIVERSAS INDÚSTRIAS DE USO FINAL
5.1.4 ALTA ADOÇÃO DE CAULIM COMO ADITIVO DE REVESTIMENTO
5.2 ERRO! REFERÊNCIA DE HIPERLINK NÃO VÁLIDA.RESTRIÇÕES
5.2.1 EFEITO NEGATIVO NA INDÚSTRIA DE PAPEL DEVIDO À EMERGÊNCIA DA COVID-19
5.2.2 A MINERAÇÃO DE CAOLIM CAUSA NÚMEROS PERIGOS AMBIENTAIS E À SAÚDE
5.3 OPORTUNIDADES
5.3.1 PRINCIPAIS INICIATIVAS ESTRATÉGICAS IMPLEMENTADAS POR EMPRESAS LÍDERES
5.3.2 TECNOLOGIAS MELHORADAS NAS PRÁTICAS DE MINERAÇÃO DE CAULIM
5.4 DESAFIOS
5.4.1 FÁCIL DISPONIBILIDADE DE SUBSTITUTOS
5.4.2 AUMENTO DO PREÇO DO CAULIM
6 MERCADO EUROPEU DE CAULIM, POR GRAU
6.1 VISÃO GERAL
6.2 CALCINADO
6.3 HIDRO
6.4 DELAMINADO
6.5 SUPERFÍCIE TRATADA
6.6 ESTRUTURADO
7 MERCADO EUROPEU DE CAULIM, POR PROCESSO
7.1 VISÃO GERAL
7.2 LAVADO COM ÁGUA
7.3 AEROFLUTUANTE
7.4 CALCINADO
7.5 DELAMINADO
7.6 SUPERFÍCIE MODIFICADA E NÃO PROCESSADA
8 MERCADO EUROPEU DE CAULIM, POR APLICAÇÃO
8.1 VISÃO GERAL
8.2 PAPEL
8.3 CERÂMICA
8.4 TINTAS E REVESTIMENTOS
8.5 FIBRA DE VIDRO
8.6 PLÁSTICO
8.7 BORRACHA
8.8 FARMACÊUTICOS E MÉDICOS
8.9 COSMÉTICOS
8.1 OUTROS
9 MERCADO EUROPEU DE CAULIM, POR REGIÃO
9.1 EUROPA
9.1.1 ALEMANHA
9.1.2 Reino Unido
9.1.3 FRANÇA
9.1.4 ITÁLIA
9.1.5 ESPANHA
9.1.6 RÚSSIA
9.1.7 SUÍÇA
9.1.8 TURQUIA
9.1.9 BÉLGICA
9.1.10 HOLANDA
9.1.11 RESTO DA EUROPA
10 MERCADO EUROPEU DE CAULIM: PAISAGEM DA EMPRESA
10.1 ANÁLISE DE AÇÕES DA EMPRESA: EUROPA
10.2 DESINVESTIMENTO
10.3 AUMENTO DE PREÇO
10.4 AQUISIÇÃO
10.5 EXPANSÃO DA INSTALAÇÃO
11 ANÁLISE SWOT
12 PERFIS DE EMPRESAS
12.1 IMERYS S.A.
12.1.1 INSTANTÂNEO DA EMPRESA
12.1.2 ANÁLISE DE RECEITAS
12.1.3 ANÁLISE DE AÇÕES DA EMPRESA
12.1.4 PORTFÓLIO DE PRODUTOS
12.1.5 DESENVOLVIMENTO RECENTE
12.2 SIBELCO
12.2.1 INSTANTÂNEO DA EMPRESA
12.2.2 ANÁLISE DE RECEITAS
12.2.3 ANÁLISE DE AÇÕES DA EMPRESA
12.2.4 PORTFÓLIO DE PRODUTOS
12.2.5 DESENVOLVIMENTO RECENTE
12.3 BASF SE
12.3.1 INSTANTÂNEO DA EMPRESA
12.3.2 ANÁLISE DE RECEITAS
12.3.3 ANÁLISE DE AÇÕES DA EMPRESA
12.3.4 PORTFÓLIO DE PRODUTOS
12.3.5 DESENVOLVIMENTO RECENTE
12.4 KAMIN LLC. /CADAM
12.4.1 INSTANTÂNEO DA EMPRESA
12.4.2 ANÁLISE DE AÇÕES DA SOCIEDADE
12.4.3 PORTFÓLIO DE PRODUTOS
12.4.4 DESENVOLVIMENTOS RECENTES
12.5 EMPRESA THIELE CAOLIM
12.5.1 INSTANTÂNEO DA EMPRESA
12.5.2 ANÁLISE DE AÇÕES DA EMPRESA
12.5.3 PORTFÓLIO DE PRODUTOS
12.5.4 DESENVOLVIMENTOS RECENTES
12.6 GRUPO ASHAPURA
12.6.1 INSTANTÂNEO DA EMPRESA
12.6.2 ANÁLISE DE RECEITAS
12.6.3 PORTFÓLIO DE PRODUTOS
12.6.4 DESENVOLVIMENTOS RECENTES
12.7 EICL
12.7.1 INSTANTÂNEO DA EMPRESA
12.7.2 ANÁLISE DE RECEITAS
12.7.3 PORTFÓLIO DE PRODUTOS
12.7.4 DESENVOLVIMENTOS RECENTES
12.8 I-MINERALSINC.
12.8.1 INSTANTÂNEO DA EMPRESA
12.8.2 ANÁLISE DE RECEITAS
12.8.3 PORTFÓLIO DE PRODUTOS
12.8.4 DESENVOLVIMENTOS RECENTES
12,9 LB MINERAIS, LTD.
12.9.1 INSTANTÂNEO DA EMPRESA
12.9.2 PORTFÓLIO DE PRODUTOS
12.9.3 DESENVOLVIMENTOS RECENTES
12.1 QUARTZ WORKS GMBH
12.10.1 INSTANTÂNEO DA EMPRESA
12.10.2 PORTFÓLIO DE PRODUTOS
12.10.3 DESENVOLVIMENTOS RECENTES
13 QUESTIONÁRIO
14 RELATÓRIOS RELACIONADOS
Lista de Tabela
TABELA 1 DADOS DE IMPORTAÇÃO DE CAULIM E OUTRAS ARGILAS CAULÍNICAS, CALCINADAS OU NÃO; CÓDIGO SH – 2507 (MIL USD)
TABELA 2 DADOS DE EXPORTAÇÃO DE CAULIM E OUTRAS ARGILAS CAULÍNICAS, CALCINADAS OU NÃO; CÓDIGO SH – 2507 (MIL USD)
TABELA 3 A TABELA A SEGUIR MOSTRA AS CAPACIDADES DE PRODUÇÃO DE DIVERSAS EMPRESAS QUE OPERAM NO MERCADO EUROPEU DE CAULIM.
TABELA 4 QUADRO REGULAMENTAR
TABELA 5 MERCADO DE CAULIM NA EUROPA, POR GRAU, 2020-2029 (US$ MILHÕES)
TABELA 6 MERCADO DE CAULIM NA EUROPA, POR GRAU, 2020-2029 (QUILO TONELADAS)
TABELA 7 MERCADO DE CAULIM CALCINADO NA EUROPA, POR REGIÃO, 2020-2029 (US$ MILHÕES)
TABELA 8 MERCADO DE CAULIM CALCINADO NA EUROPA, POR REGIÃO, 2020-2029 (QUILO TONELADAS)
TABELA 9 HIDRADO NA EUROPA NO MERCADO DE CAULIM, POR REGIÃO, 2020-2029 (US$ MILHÕES)
TABELA 10 HIDRADO NA EUROPA NO MERCADO DE CAULIM, POR REGIÃO, 2020-2029 (QUILO TONELADAS)
TABELA 11 EUROPA DELAMINADA NO MERCADO EUROPEU DE CAULIM, POR REGIÃO, 2020-2029 (US$ MILHÕES)
TABELA 12 EUROPA DELAMINADA NO MERCADO DE CAULIM DA EUROPA, POR REGIÃO, 2020-2029 (QUILO TONELADAS)
TABELA 13 SUPERFÍCIES TRATADAS NO MERCADO EUROPEU DE CAULIM, POR REGIÃO, 2020-2029 (US$ MILHÕES)
TABELA 14 SUPERFÍCIES TRATADAS NO MERCADO EUROPEU DE CAULIM, POR REGIÃO, 2020-2029 (QUILO TONELADAS)
TABELA 15 ESTRUTURA DO MERCADO DE CAULIM NA EUROPA, POR REGIÃO, 2020-2029 (US$ MILHÕES)
TABELA 16 ESTRUTURA DO MERCADO DE CAULIM NA EUROPA, POR REGIÃO, 2020-2029 (QUILO TONELADAS)
TABELA 17 MERCADO DE CAULIM NA EUROPA, POR PROCESSO, 2020-2029 (US$ MILHÕES)
TABELA 18 MERCADO DE CAULIM NA EUROPA, POR GRAU, 2020-2029 (QUILO TONELADAS)
TABELA 19 MERCADO DE CAULIM LAVADO COM ÁGUA NA EUROPA, POR REGIÃO, 2020-2029 (US$ MILHÕES)
TABELA 20 MERCADO DE CAULIM LAVADO COM ÁGUA NA EUROPA, POR REGIÃO, 2020-2029 (QUILO TONELADAS)
TABELA 21 EUROPA AIRFLOAT NO MERCADO EUROPEU DE CAULIM, POR REGIÃO, 2020-2029 (US$ MILHÕES)
TABELA 22 EUROPA AIRFLOAT NO MERCADO EUROPEU DE CAULIM, POR REGIÃO, 2020-2029 (QUILO TONELADAS)
TABELA 23 MERCADO EUROPEU DE CAULIM CALCINADO, POR REGIÃO, 2020-2029 (US$ MILHÕES)
TABELA 24 MERCADO DE CAULIM CALCINADO NA EUROPA, POR REGIÃO, 2020-2029 (QUILO TONELADAS)
TABELA 25 EUROPA DELAMINADA NO MERCADO EUROPEU DE CAULIM, POR REGIÃO, 2020-2029 (US$ MILHÕES)
TABELA 26 EUROPA DELAMINADA NO MERCADO DE CAULIM DA EUROPA, POR REGIÃO, 2020-2029 (QUILO TONELADAS)
TABELA 27 MERCADO EUROPEU DE CAULIM COM SUPERFÍCIE MODIFICADA E NÃO PROCESSADA, POR REGIÃO, 2020-2029 (US$ MILHÕES)
TABELA 28 MERCADO EUROPEU DE CAULIM COM SUPERFÍCIE MODIFICADA E NÃO PROCESSADA, POR REGIÃO, 2020-2029 (QUILO TONELADAS)
TABELA 29 MERCADO DE CAULIM NA EUROPA, POR APLICAÇÃO, 2020-2029 (MILHÕES DE DÓLARES)
TABELA 30 MERCADO DE CAULIM NA EUROPA, POR APLICAÇÃO, 2020-2029 (QUILO TONELADAS)
TABELA 31 MERCADO DE PAPEL NO CAULIM DA EUROPA, POR REGIÃO, 2020-2029 (US$ MILHÕES)
TABELA 32 MERCADO DE PAPEL NA EUROPA NO CAULIM, POR REGIÃO, 2020-2029 (QUILO TONELADAS)
TABELA 33 CERÂMICAS EUROPEIAS NO MERCADO EUROPEU DE CAULIM, POR REGIÃO, 2020-2029 (US$ MILHÕES)
TABELA 34 CERÂMICAS EUROPEIAS NO MERCADO DE CAULIM DA EUROPA, POR REGIÃO, 2020-2029 (QUILO TONELADAS)
TABELA 35 TINTAS E REVESTIMENTOS NA EUROPA NO MERCADO DE CAULIM, POR REGIÃO, 2020-2029 (US$ MILHÕES)
TABELA 36 TINTAS E REVESTIMENTOS NO MERCADO EUROPEU DE CAULIM, POR REGIÃO, 2020-2029 (QUILO TONELADAS)
TABELA 37 FIBRA DE VIDRO NO MERCADO EUROPEU DE CAULIM, POR REGIÃO, 2020-2029 (US$ MILHÕES)
TABELA 38 FIBRA DE VIDRO NO MERCADO DE CAULIM DA EUROPA, POR REGIÃO, 2020-2029 (QUILO TONELADAS)
TABELA 39 PLÁSTICO EUROPEU NO MERCADO EUROPEU DE CAULIM, POR REGIÃO, 2020-2029 (US$ MILHÕES)
TABELA 40 PLÁSTICO EUROPEU NO MERCADO EUROPEU DE CAULIM, POR REGIÃO, 2020-2029 (QUILO TONELADAS)
TABELA 41 BORRACHA EUROPEIA NO MERCADO EUROPEU DE CAULIM, POR REGIÃO, 2020-2029 (US$ MILHÕES)
TABELA 42 BORRACHA NA EUROPA NO MERCADO DE CAULIM DA EUROPA, POR REGIÃO, 2020-2029 (QUILO TONELADAS)
TABELA 43 PRODUTOS FARMACÊUTICOS E MÉDICOS NA EUROPA NO MERCADO DE CAULIM, POR REGIÃO, 2020-2029 (MILHÕES DE DÓLARES)
TABELA 44 PRODUTOS FARMACÊUTICOS E MÉDICOS NA EUROPA MERCADO DE CAULIM, POR REGIÃO, 2020-2029 (QUILO TONELADAS)
TABELA 45 COSMÉTICOS EUROPEUS NO MERCADO EUROPEU DE CAULIM, POR REGIÃO, 2020-2029 (US$ MILHÕES)
TABELA 46 COSMÉTICOS EUROPEUS NO MERCADO DE CAULIM DA EUROPA, POR REGIÃO, 2020-2029 (QUILO TONELADAS)
TABELA 47 OUTROS NO MERCADO DE CAULIM DA EUROPA, POR REGIÃO, 2020-2029 (US$ MILHÕES)
TABELA 48 OUTROS MERCADOS DE CAULIM NA EUROPA, POR REGIÃO, 2020-2029 (QUILO TONELADAS)
TABELA 49 MERCADO DE CAULIM NA EUROPA, POR PAÍS, 2020-2029 (US$ MILHÕES)
TABELA 50 MERCADO DE CAULIM NA EUROPA, POR PAÍS, 2020-2029 (QUILO TONELADAS)
TABELA 51 MERCADO DE CAULIM NA EUROPA, POR GRAU, 2020-2029 (MILHÕES DE DÓLARES)
TABELA 52 MERCADO DE CAULIM NA EUROPA, POR GRAU, 2020-2029 (QUILO TONELADAS)
TABELA 53 MERCADO DE CAULIM NA EUROPA, POR PROCESSO, 2020-2029 (US$ MILHÕES)
TABELA 54 MERCADO DE CAULIM NA EUROPA, POR PROCESSO, 2020-2029 (QUILO TONELADAS)
TABELA 55 MERCADO DE CAULIM NA EUROPA, POR APLICAÇÃO, 2020-2029 (MILHÕES DE DÓLARES)
TABELA 56 MERCADO DE CAULIM NA EUROPA, POR APLICAÇÃO, 2020-2029 (QUILO TONELADAS)
TABELA 57 MERCADO DE CAULIM DA ALEMANHA, POR GRAU, 2020-2029 (US$ MILHÕES)
TABELA 58 MERCADO DE CAULIM DA ALEMANHA, POR GRAU, 2020-2029 (QUILO TONELADAS)
TABELA 59 MERCADO DE CAULIM DA ALEMANHA, POR PROCESSO, 2020-2029 (US$ MILHÕES)
TABELA 60 MERCADO DE CAULIM DA ALEMANHA, POR PROCESSO, 2020-2029 (QUILO TONELADAS)
TABELA 61 MERCADO DE CAULIM NA ALEMANHA, POR APLICAÇÃO, 2020-2029 (US$ MILHÕES)
TABELA 62 MERCADO DE CAULIM NA ALEMANHA, POR APLICAÇÃO, 2020-2029 (QUILO TONELADAS)
TABELA 63 MERCADO DE CAULIM NO REINO UNIDO, POR GRAU, 2020-2029 (US$ MILHÕES)
TABELA 64 MERCADO DE CAULIM DO REINO UNIDO, POR GRAU, 2020-2029 (QUILO TONELADAS)
TABELA 65 MERCADO DE CAULIM DO REINO UNIDO, POR PROCESSO, 2020-2029 (MILHÕES DE DÓLARES)
TABELA 66 MERCADO DE CAULIM NO REINO UNIDO, POR PROCESSO, 2020-2029 (QUILO TONELADAS)
TABELA 67 MERCADO DE CAULIM NO REINO UNIDO, POR APLICAÇÃO, 2020-2029 (MILHÕES DE DÓLARES)
TABELA 68 MERCADO DE CAULIM NO REINO UNIDO, POR APLICAÇÃO, 2020-2029 (QUILO TONELADAS)
TABELA 69 MERCADO DE CAULIM DA FRANÇA, POR GRAU, 2020-2029 (US$ MILHÕES)
TABELA 70 MERCADO DE CAULIM NA FRANÇA, POR GRAU, 2020-2029 (QUILO TONELADAS)
TABELA 71 MERCADO DE CAULIM DA FRANÇA, POR PROCESSO, 2020-2029 (US$ MILHÕES)
TABELA 72 MERCADO DE CAULIM NA FRANÇA, POR PROCESSO, 2020-2029 (QUILO TONELADAS)
TABELA 73 MERCADO DE CAULIM NA FRANÇA, POR APLICAÇÃO, 2020-2029 (US$ MILHÕES)
TABELA 74 MERCADO DE CAULIM NA FRANÇA, POR APLICAÇÃO, 2020-2029 (QUILO TONELADAS)
TABELA 75 MERCADO DE CAULIM DA ITÁLIA, POR GRAU, 2020-2029 (US$ MILHÕES)
TABELA 76 MERCADO DE CAULIM NA ITÁLIA, POR GRAU, 2020-2029 (QUILO TONELADAS)
TABELA 77 MERCADO DE CAULIM DA ITÁLIA, POR PROCESSO, 2020-2029 (US$ MILHÕES)
TABELA 78 MERCADO DE CAULIM NA ITÁLIA, POR PROCESSO, 2020-2029 (QUILO TONELADAS)
TABELA 79 MERCADO DE CAULIM NA ITÁLIA, POR APLICAÇÃO, 2020-2029 (US$ MILHÕES)
TABELA 80 MERCADO DE CAULIM NA ITÁLIA, POR APLICAÇÃO, 2020-2029 (QUILO TONELADAS)
TABELA 81 MERCADO DE CAULIM NA ESPANHA, POR GRAU, 2020-2029 (US$ MILHÕES)
TABELA 82 MERCADO DE CAULIM NA ESPANHA, POR GRAU, 2020-2029 (QUILO TONELADAS)
TABELA 83 MERCADO DE CAULIM NA ESPANHA, POR PROCESSO, 2020-2029 (US$ MILHÕES)
TABELA 84 MERCADO DE CAULIM NA ESPANHA, POR PROCESSO, 2020-2029 (QUILO TONELADAS)
TABELA 85 MERCADO DE CAULIM NA ESPANHA, POR APLICAÇÃO, 2020-2029 (US$ MILHÕES)
TABELA 86 MERCADO DE CAULIM NA ESPANHA, POR APLICAÇÃO, 2020-2029 (QUILO TONELADAS)
TABELA 87 MERCADO DE CAULIM DA RÚSSIA, POR GRAU, 2020-2029 (US$ MILHÕES)
TABELA 88 MERCADO DE CAULIM DA RÚSSIA, POR GRAU, 2020-2029 (QUILO TONELADAS)
TABELA 89 MERCADO DE CAULIM DA RÚSSIA, POR PROCESSO, 2020-2029 (US$ MILHÕES)
TABELA 90 MERCADO DE CAULIM DA RÚSSIA, POR PROCESSO, 2020-2029 (QUILO TONELADAS)
TABELA 91 MERCADO DE CAULIM DA RÚSSIA, POR APLICAÇÃO, 2020-2029 (US$ MILHÕES)
TABELA 92 MERCADO DE CAULIM DA RÚSSIA, POR APLICAÇÃO, 2020-2029 (QUILO TONELADAS)
TABELA 93 MERCADO DE CAULIM NA SUÍÇA, POR GRAU, 2020-2029 (US$ MILHÕES)
TABELA 94 MERCADO DE CAULIM NA SUÍÇA, POR GRAU, 2020-2029 (QUILO TONELADAS)
TABELA 95 MERCADO DE CAULIM DA SUÍÇA, POR PROCESSO, 2020-2029 (US$ MILHÕES)
TABELA 96 MERCADO DE CAULIM NA SUÍÇA, POR PROCESSO, 2020-2029 (QUILO TONELADAS)
TABELA 97 MERCADO DE CAULIM DA SUÍÇA, POR APLICAÇÃO, 2020-2029 (US$ MILHÕES)
TABELA 98 MERCADO DE CAULIM DA SUÍÇA, POR APLICAÇÃO, 2020-2029 (QUILO TONELADAS)
TABELA 99 MERCADO DE CAULIM DA TURQUIA, POR GRAU, 2020-2029 (US$ MILHÕES)
TABELA 100 MERCADO DE CAULIM DA TURQUIA, POR GRAU, 2020-2029 (QUILO TONELADAS)
TABELA 101 MERCADO DE CAULIM DA TURQUIA, POR PROCESSO, 2020-2029 (US$ MILHÕES)
TABELA 102 MERCADO DE CAULIM DA TURQUIA, POR PROCESSO, 2020-2029 (QUILO TONELADAS)
TABELA 103 MERCADO DE CAULIM DA TURQUIA, POR APLICAÇÃO, 2020-2029 (US$ MILHÕES)
TABELA 104 MERCADO DE CAULIM DA TURQUIA, POR APLICAÇÃO, 2020-2029 (QUILO TONELADAS)
TABELA 105 MERCADO DE CAULIM DA BÉLGICA, POR GRAU, 2020-2029 (US$ MILHÕES)
TABELA 106 MERCADO DE CAULIM DA BÉLGICA, POR GRAU, 2020-2029 (QUILO TONELADAS)
TABELA 107 MERCADO DE CAULIM DA BÉLGICA, POR PROCESSO, 2020-2029 (US$ MILHÕES)
TABELA 108 MERCADO DE CAULIM DA BÉLGICA, POR PROCESSO, 2020-2029 (QUILO TONELADAS)
TABELA 109 MERCADO DE CAULIM DA BÉLGICA, POR APLICAÇÃO, 2020-2029 (US$ MILHÕES)
TABELA 110 MERCADO DE CAULIM DA BÉLGICA, POR APLICAÇÃO, 2020-2029 (QUILO TONELADAS)
TABELA 111 MERCADO DE CAULIM HOLANDÊS, POR GRAU, 2020-2029 (US$ MILHÕES)
TABELA 112 MERCADO DE CAULIM HOLANDÊS, POR GRAU, 2020-2029 (QUILO TONELADAS)
TABELA 113 MERCADO DE CAULIM HOLANDÊS, POR PROCESSO, 2020-2029 (US$ MILHÕES)
TABELA 114 MERCADO DE CAULIM HOLANDÊS, POR PROCESSO, 2020-2029 (QUILO TONELADAS)
TABELA 115 MERCADO HOLANDÊS DE CAULIM, POR APLICAÇÃO, 2020-2029 (US$ MILHÕES)
TABELA 116 MERCADO HOLANDÊS DE CAULIM, POR APLICAÇÃO, 2020-2029 (QUILO TONELADAS)
TABELA 117 MERCADO DE CAULIM NO RESTO DA EUROPA, POR GRAU, 2020-2029 (US$ MILHÕES)
TABELA 118 MERCADO DE CAULIM NO RESTO DA EUROPA, POR GRAU, 2020-2029 (QUILO TONELADAS)
Lista de Figura
FIGURA 1 MERCADO EUROPEU DE CAULIM
FIGURA 2 MERCADO EUROPEU DE CAULIM: TRIANGULAÇÃO DE DADOS
FIGURA 3 MERCADO EUROPEU DE CAULIM: ANÁLISE DE DROC
FIGURA 4 MERCADO EUROPEU DE CAULIM: ANÁLISE EUROPA VS MERCADO REGIONAL
FIGURA 5 MERCADO EUROPEU DE CAULIM: ANÁLISE DE PESQUISA DA EMPRESA
FIGURA 6 MERCADO EUROPEU DE CAULIM: A CURVA DA LINHA DE VIDA DO PRODUTO
FIGURA 7 MERCADO EUROPEU DE CAULIM: MODELAGEM MULTIVARIADA
FIGURA 8 MERCADO EUROPEU DE CAULIM: ENTREVISTA DEMOGRÁFICA
FIGURA 9 MERCADO EUROPEU DE CAOLIM: GRADE DE POSIÇÃO DE MERCADO DBMR
FIGURA 10 MERCADO EUROPEU DE CAULIM: GRADE DE COBERTURA DE APLICAÇÕES DE MERCADO
FIGURA 11 MERCADO EUROPEU DE CAULIM: A MATRIZ DO DESAFIO DO MERCADO
FIGURA 12 MERCADO EUROPEU DE CAULIM: ANÁLISE DE PARTICIPAÇÃO DO FORNECEDOR
FIGURA 13 MERCADO EUROPEU DE CAULIM: SEGMENTAÇÃO
FIGURA 14 ESPERA-SE QUE O AUMENTO DAS ATIVIDADES DE CONSTRUÇÃO EM TODO O MUNDO IMPULSIONE O MERCADO EUROPEU DE CAULIM NO PERÍODO DE PREVISÃO
ESPERA-SE QUE A FIGURA 15 SEGMENTO CALCINADO RESPONSABILIZE A MAIOR PARTE DO MERCADO EUROPEU DE CAULIM EM 2022 e 2029
FIGURA 16 CENÁRIO DE IMPORTAÇÃO-EXPORTAÇÃO (US$ MIL)
FIGURA 17 ESTATÍSTICAS DE PREÇOS ATUAIS (POR KG)
FIGURA 18 PREVISÕES DE PREÇO (POR KG)
FIGURA 19 ANÁLISE DE CONSUMO DE PRODUÇÃO
FIGURA 20 DRIVERS, RESTRIÇÕES, OPORTUNIDADES E DESAFIOS DO MERCADO EUROPEU DE CAULIM
FIGURA 21 MERCADO EUROPEU DE CAULIM: POR GRAU, 2021
FIGURA 22 MERCADO EUROPEU DE CAULIM: POR PROCESSO, 2021
FIGURA 23 MERCADO EUROPEU DE CAULIM: POR APLICAÇÃO, 2021
FIGURA 24 MERCADO EUROPEU DE CAOLIM: INSTANTÂNEO (2021)
FIGURA 25 MERCADO EUROPEU DE CAULIM: POR PAÍS (2021)
FIGURA 26 MERCADO EUROPEU DE CAULIM: POR PAÍS (2022 e 2029)
FIGURA 27 MERCADO EUROPEU DE CAULIM: POR PAÍS (2021 e 2029)
FIGURA 28 MERCADO EUROPEU DE CAULIM: POR GRAU (2022-2029)
FIGURA 29 MERCADO EUROPEU DE CAULIM: PARTICIPAÇÃO DA EMPRESA 2021 (%)
Metodologia de Investigação
A recolha de dados e a análise do ano base são feitas através de módulos de recolha de dados com amostras grandes. A etapa inclui a obtenção de informações de mercado ou dados relacionados através de diversas fontes e estratégias. Inclui examinar e planear antecipadamente todos os dados adquiridos no passado. Da mesma forma, envolve o exame de inconsistências de informação observadas em diferentes fontes de informação. Os dados de mercado são analisados e estimados utilizando modelos estatísticos e coerentes de mercado. Além disso, a análise da quota de mercado e a análise das principais tendências são os principais fatores de sucesso no relatório de mercado. Para saber mais, solicite uma chamada de analista ou abra a sua consulta.
A principal metodologia de investigação utilizada pela equipa de investigação do DBMR é a triangulação de dados que envolve a mineração de dados, a análise do impacto das variáveis de dados no mercado e a validação primária (especialista do setor). Os modelos de dados incluem grelha de posicionamento de fornecedores, análise da linha de tempo do mercado, visão geral e guia de mercado, grelha de posicionamento da empresa, análise de patentes, análise de preços, análise da quota de mercado da empresa, normas de medição, análise global versus regional e de participação dos fornecedores. Para saber mais sobre a metodologia de investigação, faça uma consulta para falar com os nossos especialistas do setor.
Personalização disponível
A Data Bridge Market Research é líder em investigação formativa avançada. Orgulhamo-nos de servir os nossos clientes novos e existentes com dados e análises que correspondem e atendem aos seus objetivos. O relatório pode ser personalizado para incluir análise de tendências de preços de marcas-alvo, compreensão do mercado para países adicionais (solicite a lista de países), dados de resultados de ensaios clínicos, revisão de literatura, mercado remodelado e análise de base de produtos . A análise de mercado dos concorrentes-alvo pode ser analisada desde análises baseadas em tecnologia até estratégias de carteira de mercado. Podemos adicionar quantos concorrentes necessitar de dados no formato e estilo de dados que procura. A nossa equipa de analistas também pode fornecer dados em tabelas dinâmicas de ficheiros Excel em bruto (livro de factos) ou pode ajudá-lo a criar apresentações a partir dos conjuntos de dados disponíveis no relatório.

