Global Fibrotic Diseases Treatment Market
Tamanho do mercado em biliões de dólares
CAGR :
% 
 USD
5.79 Billion
USD
10.35 Billion
2024
2032
USD
5.79 Billion
USD
10.35 Billion
2024
2032
| 2025 –2032 | |
| USD 5.79 Billion | |
| USD 10.35 Billion | |
| % | |
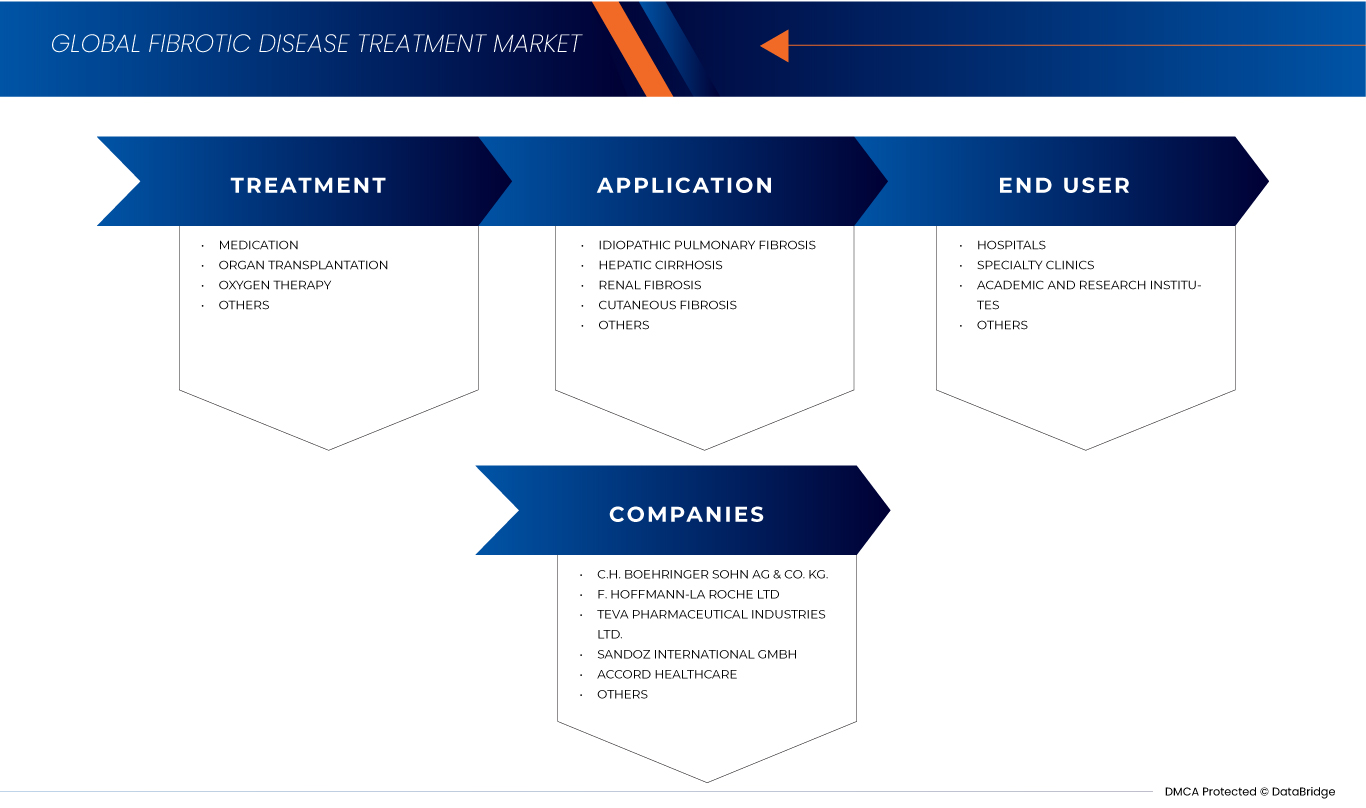
Global Fibrotic Diseases Treatment Market, By Treatment (Medication, Organ Transplantation, Oxygen Therapy, and Others), Application (Idiopathic Pulmonary Fibrosis, Hepatic Cirrhosis, Renal Fibrosis, Cutaneous Fibrosis, and Others), End User (Hospitals, Specialty Clinics, Academic and Research Institutes, and Others) - Industry Trends and Forecast to 2032
Global Fibrotic Diseases Treatment Market Analysis
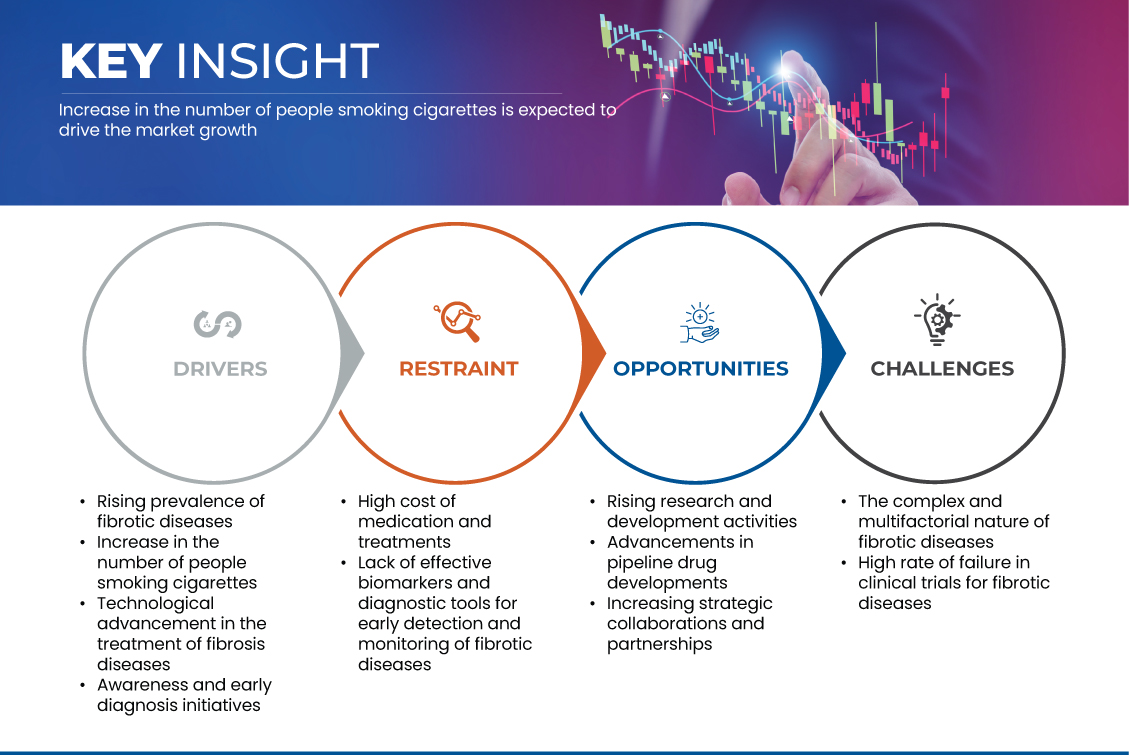
The rising prevalence of fibrotic diseases, such as idiopathic pulmonary fibrosis, hepatic cirrhosis, and renal fibrosis, is a significant driver of the global fibrotic diseases treatment Market. Factors such as aging populations, lifestyle changes, and increasing rates of chronic conditions like diabetes and hypertension are contributing to a higher incidence of these diseases. As the number of affected individuals grows, the demand for effective treatments intensifies, driving the need for advanced therapies, including antifibrotic drugs and biologics. Healthcare systems face growing pressure to manage chronic fibrotic conditions, driving demand for more effective treatments and fueling market growth.
Global Fibrotic Diseases Treatment Market Size
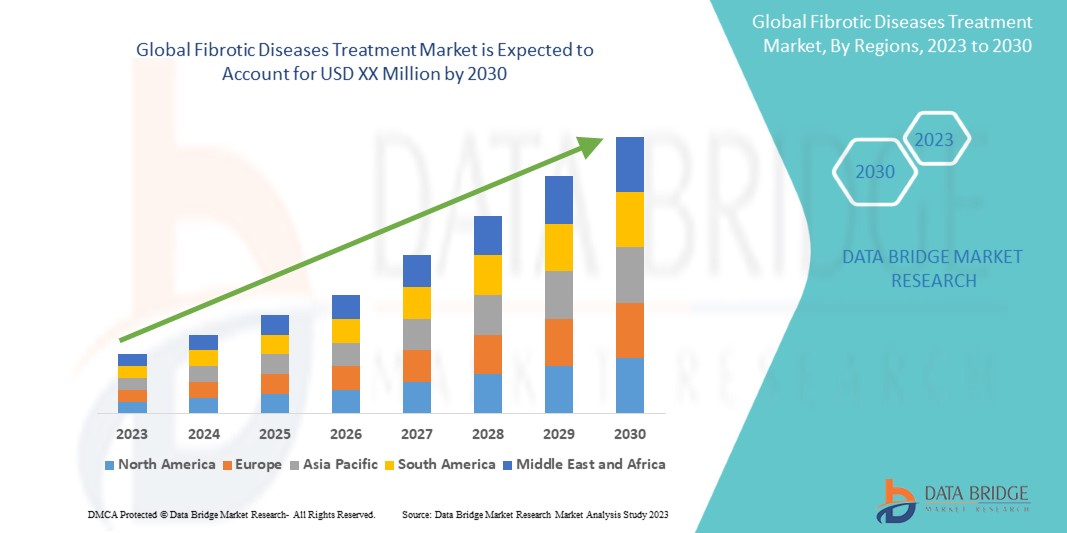
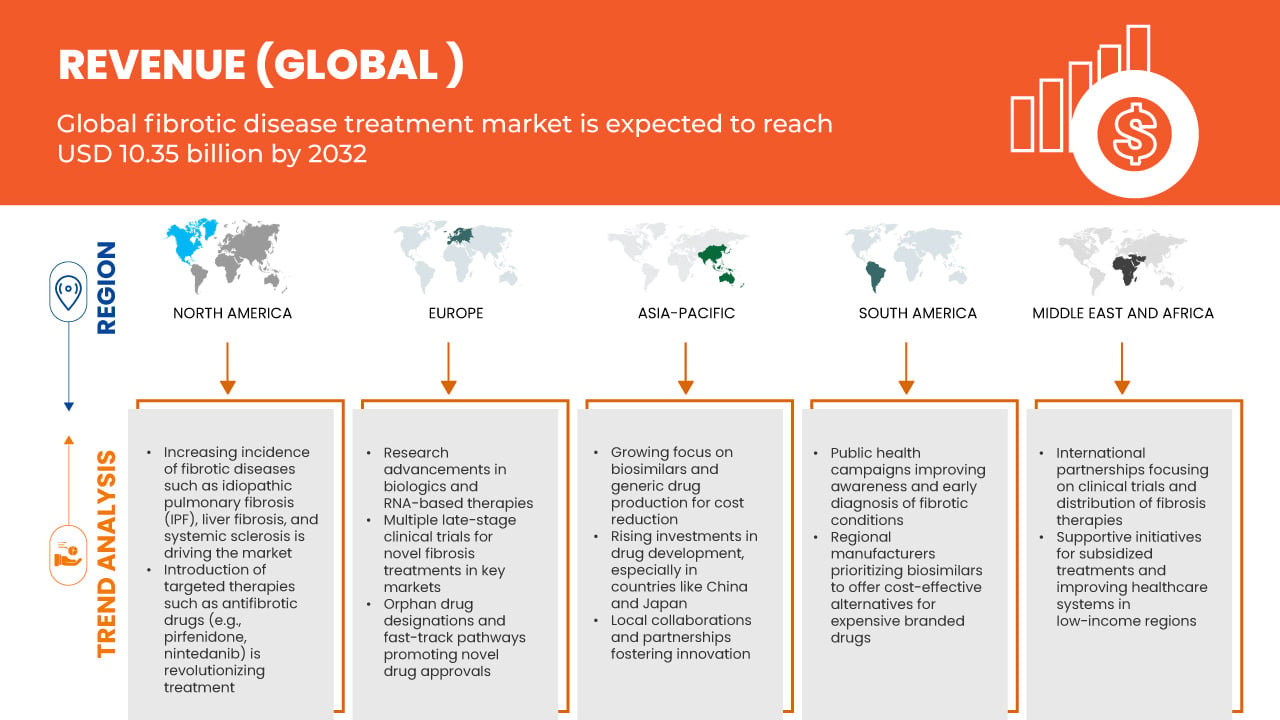
Data Bridge Market Research analyzes that the global fibrotic diseases treatment market is expected to reach USD 10.35 billion by 2032 from USD 5.79 billion in 2024, growing with CAGR of 7.6% during forecast period of 2025 to 2032.
Global Fibrotic Diseases Treatment Market Trends
“Rising Adoption of Biomarker-Based Diagnostics”
The use of biomarker-based diagnostics in Testicular Germ Cell Tumors (TGCT) is becoming more prevalent, with biomarkers such as alpha-fetoprotein (AFP), beta-human chorionic gonadotropin (β-hCG), and lactate dehydrogenase (LDH) playing a crucial role in clinical practice. These biomarkers enable clinicians to achieve early detection, monitor disease progression, and tailor treatments to the individual characteristics of each patient. This trend reflects advancements in precision medicine and is leading to more accurate staging and risk stratification of TGCT. As research continues to identify additional biomarkers, the integration of these diagnostic tools is becoming a standard approach, enhancing treatment protocols and improving patient outcomes.
Global Fibrotic Diseases Treatment Market Segmentation
|
Attributes |
Global Fibrotic Diseases Treatment Market Insights |
|
Segments Covered |
|
|
Countries Covered |
U.S, Canada, Mexico, Dominican Republic, Jamaica, Panama, Germany, France, U.K., Italy, Spain, Russia, Turkey, Netherlands, Switzerland, Hungary, Lithuania, Austria, Ireland, Norway, Poland, Rest of Europe, Japan, China, India, South Korea, Australia, Singapore, Thailand, Malaysia, Indonesia, Philippines, Vietnam, Taiwan, Rest of Asia-Pacific, Brazil, Ecuador, Chile, Colombia, Venezuela, Argentina, Peru, Curaçao, Paraguay, Uruguay, Trinidad And Tobago, Rest of South America, South Africa, Saudi Arabia, U.A.E., Egypt, Kuwait, Israel, Bahrain, and Rest of Middle East and Africa |
|
Key Market Players |
C.H. Boehringer Sohn AG & Co. KG. (Germany), F. Hoffmann-La Roche Ltd (Switzerland), Teva Pharmaceutical Industries Ltd. (Israel), Sandoz International GmbH (Germany), Accord Healthcare (U.K.), AbbVie Inc. (U.S.), Redx Pharma Pic (U.K.), Bristol-Myers Squibb Company (U.S.), BioMX (U.S.), KITHER BIOTECH S.R.L. (Italy), Verona Pharma pic (U.K.), Intercept Pharmaceuticals, Inc. (U.S.) |
|
Market Opportunities |
|
|
Value Added Data Infosets |
In addition to the insights on market scenarios such as market value, growth rate, segmentation, geographical coverage, and major players, the market reports curated by the Data Bridge Market Research also include import export analysis, production capacity overview, production consumption analysis, price trend analysis, climate change scenario, supply chain analysis, value chain analysis, raw material/consumables overview, vendor selection criteria, PESTLE Analysis, Porter Analysis, and regulatory framework. |
Global Fibrotic Diseases Treatment Market Definition
Fibrotic diseases is a condition where excessive fibrous connective tissue (fibrosis) forms, often as a result of chronic inflammation or tissue injury. This abnormal tissue build-up disrupts the normal function of organs, commonly affecting the lungs (pulmonary fibrosis), liver (liver fibrosis), heart, kidneys, and skin.
Treatment for fibrotic diseases focuses on slowing or halting the progression of fibrosis, reducing inflammation, and managing symptoms. Approaches may include anti-fibrotic drugs, immunosuppressive agents, lifestyle modifications, and in advanced cases, surgical options like organ transplantation. Newer treatments explore targeted therapies that block specific pathways responsible for fibrosis development.
Global Fibrotic Diseases Treatment Market Dynamics
Drivers
- Rising Prevalence of Fibrotic Diseases
The rising prevalence of fibrotic diseases, such as idiopathic pulmonary fibrosis, hepatic cirrhosis, and renal fibrosis, is a significant driver of the Global Fibrotic Diseases Treatment Market. Factors such as aging populations, lifestyle changes, and increasing rates of chronic conditions like diabetes and hypertension are contributing to a higher incidence of these diseases. As the number of affected individuals grows, the demand for effective treatments intensifies, driving the need for advanced therapies, including antifibrotic drugs and biologics. Healthcare systems face growing pressure to manage chronic fibrotic conditions, driving demand for more effective treatments and fueling market growth.
For instance,
- In January 2023, according to an article published by PubMed Central, the incidence and prevalence of idiopathic pulmonary fibrosis (IPF) are rising globally, no longer fitting its rare disease classification. In North America, prevalence rates range from 2.4 to 2.98 per 10,000 people, with South Korea having the highest prevalence at 4.51 per 10,000
The rising prevalence of fibrotic diseases significantly fuels market expansion by highlighting the need for better, more accessible treatment solutions, while also encouraging increased research and development in the field.
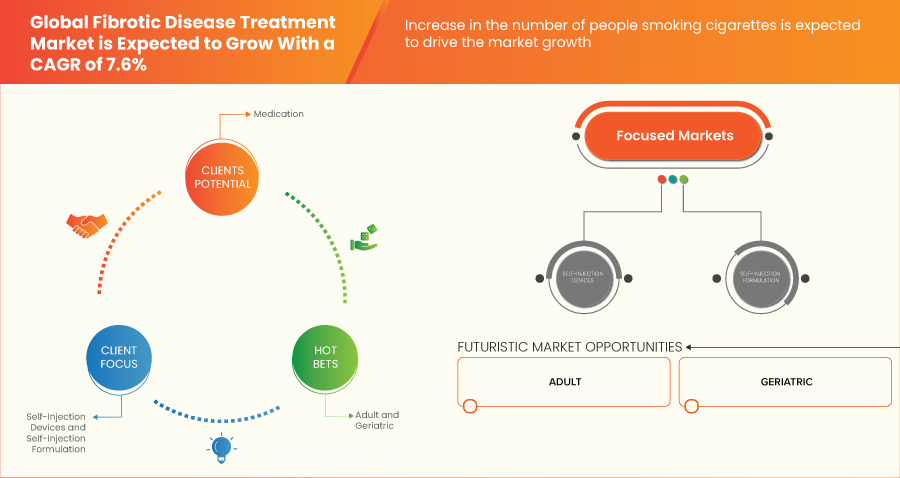
- Increase in the Number of People Smoking Cigarettes
Cigarette smoking is one of the most recognized risk factors for development of idiopathic pulmonary fibrosis (IPF). Furthermore, recent work suggests that smoking may have a detrimental effect on survival of patients with IPF. The mechanism by which smoking may contribute to the pathogenesis of IPF is largely unknown. However, accumulating evidence suggests that increased oxidative stress might promote disease progression in IPF patients who are current and former smokers.
For instance,
- In June 2023, according to an article published by NCBI, smoking is a key risk factor for interstitial lung diseases (ILDs) like idiopathic pulmonary fibrosis (IPF), with studies indicating that 41% to 83% of IPF patients have a smoking history and a 60% higher risk
- In May 2022, according to the article published in National Center for Biotechnology Information (NCBI), Smoking has been considered an important risk factor for idiopathic pulmonary fibrosis (IPF) incidence. According to the study conducted in the article the risk of IPF was significantly higher in current and former smokers than in never smokers, with an aHR of 1.66 (95% CI 1.61 to 1.72) and 1.42 (95% CI 1.37 to 1.48), respectively. Current smokers had a higher risk of IPF than former smokers (aHR 1.17, 95% CI 1.13 to 1.21). The risk of IPF development increased as the smoking intensity and duration increased
Opportunities
- Rising Research and Development Activities
The increasing prevalence of fibrotic diseases and the demand for more effective treatments are prompting pharmaceutical and biotech companies to boost their R&D investments. These efforts aim to develop innovative therapies, including new antifibrotic drugs, biologics, and gene therapies targeting the underlying causes of fibrosis. Additionally, advancements in personalized medicine and diagnostic technologies are expected to improve treatment outcomes and overall patient care. As R&D progresses, new therapeutic options will emerge, boosting market growth and improving the management of fibrotic diseases.
For instance,
- In May 2024, according to Boehringer Ingelheim International GmbH, Boehringer Ingelheim has secured a license agreement to develop a first-in-class treatment for fibro-inflammatory diseases, reinforcing its commitment to breakthrough therapies aimed at improving patient outcomes
- In July 2021, according to the article published by Moez Ghumman et.al, existing oral therapies, pirfenidone and nintedanib, may attempt to improve the patients’ quality of life by mitigating symptoms and slowing disease progression, however chronic doses and systemic deliveries of these drugs can lead to severe side effects. The lack of effective treatment options calls for further investigation of restorative as well as additional palliative therapies for IPF. Nanoparticle-based sustained drug delivery strategies can be utilized to ensure targeted delivery for site-specific treatment as well as long-acting therapy, improving overall patient compliance
The rise in R&D activities presents a major opportunity to accelerate market expansion by fostering innovation and enhancing treatment strategies.
- Advancements in Pipeline Drug Developments
A growing number of promising therapies, including new antifibrotic drugs, biologics, and gene therapies, are currently in various stages of development. These drugs aim to target the underlying causes of fibrotic diseases, offering the potential for more effective treatments and improved patient outcomes, particularly for conditions like idiopathic pulmonary fibrosis, hepatic cirrhosis, and renal fibrosis. The successful approval and commercialization of these drugs will expand the range of therapeutic options available, meet the increasing demand for better treatments, and foster market growth.
For instance,
- In September 2024, according to an article published by the Pulmonary Fibrosis Foundation, drugs like AP01, BBT-877, GKT137831, and others are currently in Phase 2 of development for fibrotic diseases
- In February 2022, according to NCBI, a Phase I/II clinical trial, started in February 2021, is testing Imatinib (200mg/day) for advanced liver fibrosis (grades 3-4) at Taleghani Hospital in Tehran. The trial compares Imatinib with standard treatment and a placebo over 24 weeks
This study underscores the advancement in pipeline drug development, potentially introducing a novel treatment for liver fibrosis, which could fuel growth in the global fibrotic diseases treatment market
The advancements in pipeline drug developments are poised to significantly drive market expansion by offering innovative solutions for the management of fibrotic diseases.
Restraints/Challenges
- High Cost of Medication and Treatments
Fibrotic disease treatments have become increasingly expensive due to the growing number of patients suffering from fibrosis and the risen prices of medical devices and medications. The modern technological devices used in fibrosis treatment is also playing significant role in high prices of treatments, and high accuracy, provide a definitive diagnosis for idiopathic pulmonary fibrosis (IPF). Therefore, the high cost of medications and treatment procedure for fibrotic disease is hampering the growth of the market.
For instance,
- In October 2022, according to an article published by PubMed Central, therapeutic options for IPF are limited, with only two approved antifibrotic drugs—pirfenidone and nintedanib—available for mild to moderate cases. These drugs are costly, ranging from USD2,000 to USD14,000 per person monthly, depending on the country
- In September 2022, according to the article published by Alan Katz et.al, cost per treatment of the hyperbaric oxygen therapy will generally range between USD 250-USD 600 per treatment depending on a few factors, including the number of sessions and location of services
- In January 2022, according to an article published in BMC Pulmonary Medicine reported that the annual list price of pirfenidone was approximately USD 36,070.80, whereas the annual cost for both pirfenidone and nintedanib in the U.S. exceeds USD 100,000, and in Belgium, the annual list price of nintedanib is around USD 28,910. This high cost of medications and treatments is expected to act as a restraint for the global fibrotic diseases treatment market, limiting access to these therapies and placing financial strain on patients and healthcare systems
The Complex and Multifactorial Nature of Fibrotic Diseases
Fibrosis is driven by a variety of factors, including genetic predispositions, environmental exposures, and underlying chronic conditions, making it difficult to pinpoint a single cause or develop a one-size-fits-all treatment. This complexity complicates the development of effective therapies that can address the diverse mechanisms involved in fibrosis. Additionally, the progressive and often asymptomatic nature of these diseases until advanced stages further complicates early diagnosis and treatment, leading to delayed interventions.
For instance,
- In January 2023, according to an article published by PubMed Central, in IPF, normal lung tissue is replaced by abnormal matrix build up, impairing alveolar function and leading to respiratory failure. Repeated micro-injuries and disrupted cell repair drive irreversible lung damage
The multifaceted nature of fibrotic diseases requires a highly tailored approach to treatment, posing a challenge for pharmaceutical companies to develop universally effective therapies and strategies to manage these conditions.
Global Fibrotic Diseases Treatment Market Scope
The market is segmented on the basis of treatment, application, and end user. The growth amongst these segments will help you analyze meagre growth segments in the industries and provide the users with a valuable market overview and market insights to help them make strategic decisions for identifying core market applications.
By Treatment
- Medication
- Nintedanib (OFEV)
- Pirfenidone (ESBRIET)
- Organ Transplantation
- Oxygen Therapy
- Others
By Application
- Idiopathic Pulmonary Fibrosis
- Hepatic Cirrhosis
- Renal Fibrosis
- Cutaneous Fibrosis
- Others
By End User
- Hospitals
- Specialty Clinics
- Academic and Research Institutes
- Others
Global Fibrotic Diseases Treatment Market Regional Analysis
The market is analyzed and market size insights and trends are provided, treatment, application, and end user.
The countries covered in the market are U.S, Canada, Mexico, Dominican Republic, Jamaica, Panama, Germany, France, U.K., Italy, Spain, Russia, Turkey, Netherlands, Switzerland, Hungary, Lithuania, Austria, Ireland, Norway, Poland, rest of Europe, Japan, China, India, South Korea, Australia, Singapore, Thailand, Malaysia, Indonesia, Philippines, Vietnam, Taiwan, rest of Asia-Pacific, Brazil, Ecuador, Chile, Colombia, Venezuela, Argentina, Peru, Curaçao, Paraguay, Uruguay, Trinidad And Tobago, rest of South America, South Africa, Saudi Arabia, U.A.E., Egypt, Kuwait, Israel, Bahrain, and rest of Middle East and Africa.
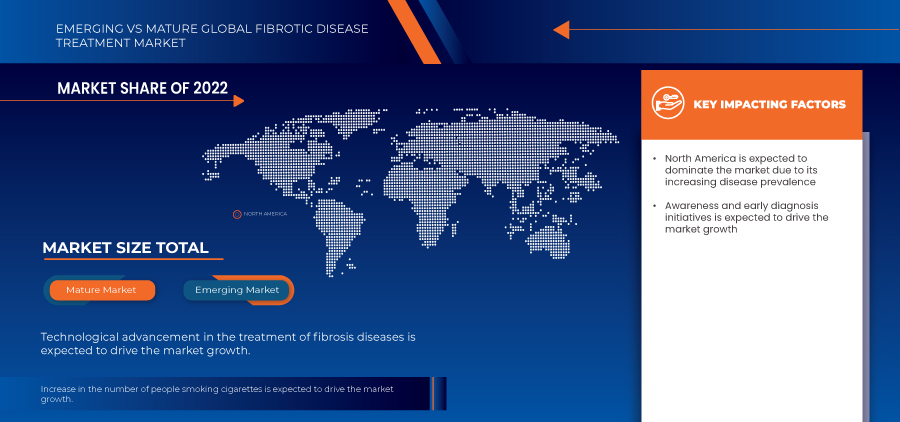
North America is expected to dominate due to its well-established healthcare infrastructure, high prevalence of fibrotic diseases such as idiopathic pulmonary fibrosis and liver fibrosis, and robust investment in research and development. Asia-Pacific is expected to be the fastest growing region due to increasing healthcare investments, rising awareness about fibrotic diseases, and improving access to advanced medical therapies. The region's large and aging population, combined with a growing burden of chronic conditions linked to fibrosis, such as diabetes and liver diseases, further drives demand for effective treatments.
The country section of the report also provides individual market impacting factors and changes in regulation in the market domestically that impacts the current and future trends of the market. Data points like down-stream and upstream value chain analysis, technical trends and porter's five forces analysis, case studies are some of the pointers used to forecast the market scenario for individual countries. Also, the presence and availability of global brands and their challenges faced due to large or scarce competition from local and domestic brands, impact of domestic tariffs and trade routes are considered while providing forecast analysis of the country data.
Global Fibrotic Diseases Treatment Market Share
The market competitive landscape provides details by competitor. Details included are company overview, company financials, revenue generated, market potential, investment in research and development, new market initiatives, global presence, production sites and facilities, production capacities, company strengths and weaknesses, product launch, product width and breadth, application dominance. The above data points provided are only related to the companies' focus related to market.
Global Fibrotic Diseases Treatment Market Leaders Operating in the Market Are:
- C.H. Boehringer Sohn AG & Co. KG. (Germany)
- F. Hoffmann-La Roche Ltd (Switzerland)
- Teva Pharmaceutical Industries Ltd. (Israel)
- Sandoz International GmbH (Germany)
- Accord Healthcare (U.K.)
Latest Developments in Global Fibrotic Diseases Treatment Market
- In September 2024, Boehringer Ingelheim International GmbH announced that the FIBRONEER-IPF trial met its primary endpoint of FVC improvement at week 52, and it plans to submit a new drug application for nerandomilast for IPF treatment to the FDA and other global authorities. This successful trial and upcoming submission will strengthen Boehringer Ingelheim’s position in the competitive IPF market, potentially expanding its respiratory drug portfolio
- In July 2024, Teva and Sanofi announced an updated timeline for the anti-TL1A program, duvakitug, a monoclonal antibody targeting TL1A for moderate-to-severe IBD. Advancing this program strengthens both companies’ positions in the IBD treatment market, potentially expanding their offerings in immunology
- In November 2022, Teva Pharmaceuticals, a U.S. affiliate of Teva Pharmaceutical Industries Ltd. announced a new collaboration with Rimidi, a leading clinical management platform designed to optimize clinical workflows, enhance patient experiences and achieve quality objectives. This has helped the company to expand globally
- In March 2022, Genentech, a member of the Roche Group announced that the Phase III SKYSCRAPER-02 study, evaluating the investigational anti-TIGIT immunotherapy tiragolumab plus Tecentriq (atezolizumab) and chemotherapy (carboplatin and etoposide) as an initial (first-line) treatment for people with extensive-stage small cell lung cancer (ES-SCLC), did not meet its co-primary endpoint of progression-free survival. This has helped the company to expand globally
SKU-
Obtenha acesso online ao relatório sobre a primeira nuvem de inteligência de mercado do mundo

- Painel interativo de análise de dados
- Painel de análise da empresa para oportunidades de elevado potencial de crescimento
- Acesso de analista de pesquisa para personalização e customização. consultas
- Análise da concorrência com painel interativo
- Últimas notícias, atualizações e atualizações Análise de tendências
- Aproveite o poder da análise de benchmark para um rastreio abrangente da concorrência
Índice
1 INTRODUCTION
1.1 OBJECTIVES OF THE STUDY
1.2 MARKET DEFINITION
1.3 OVERVIEW OF THE GLOBAL FIBROTIC DISEASE TREATMENT MARKET
1.4 CURRENCY AND PRICING
1.5 LIMITATIONS
1.6 MARKETS COVERED
2 MARKET SEGMENTATION
2.1 MARKETS COVERED
2.2 GEOGRAPHICAL SCOPE
2.3 YEARS CONSIDERED FOR THE STUDY
2.4 DBMR TRIPOD DATA VALIDATION MODEL
2.5 PRIMARY INTERVIEWS WITH KEY OPINION LEADERS
2.6 MULTIVARIATE MODELLING
2.7 MARKET APPLICATION COVERAGE GRID
2.8 PRODUCT LIFELINE CURVE
2.9 DBMR MARKET POSITION GRID
2.1 VENDOR SHARE ANALYSIS
2.11 SECONDARY SOURCES
2.12 ASSUMPTIONS
3 EXECUTIVE SUMMARY
4 PREMIUM INSIGHTS
4.1 PORTER’S FIVE FORCES
4.2 PESTEL ANALYSIS
5 GLOBAL FIBROTIC DISEASES TREATMENT MARKET, REGULATIONS
5.1 NORTH AMERICA
5.1.1 U.S.
5.1.2 CANADA
5.2 EUROPE
5.2.1 EUROPEAN UNION (EMA - EUROPEAN MEDICINES AGENCY)
5.2.2 GERMANY (FEDERAL INSTITUTE FOR DRUGS AND MEDICAL DEVICES - BFARM)
5.2.3 UNITED KINGDOM (MEDICINES AND HEALTHCARE PRODUCTS REGULATORY AGENCY - MHRA)
5.3 ASIA-PACIFIC
5.3.1 JAPAN (PMDA - PHARMACEUTICALS AND MEDICAL DEVICES AGENCY)
5.3.2 CHINA (NMPA - NATIONAL MEDICAL PRODUCTS ADMINISTRATION)
5.3.3 AUSTRALIA (TGA - THERAPEUTIC GOODS ADMINISTRATION)
5.4 LATIN AMERICA
5.4.1 BRAZIL (ANVISA - BRAZILIAN HEALTH REGULATORY AGENCY)
5.4.2 ARGENTINA (ADMINISTRACIÓN NACIONAL DE MEDICAMENTOS, ALIMENTOS Y TECNOLOGÍA MÉDICA - ANMAT)
5.5 MIDDLE EAST AND AFRICA (MEA)
5.5.1 UNITED ARAB EMIRATES (UAE - MINISTRY OF HEALTH AND PREVENTION)
6 MARKET OVERVIEW
6.1 DRIVERS
6.1.1 RISING PREVALENCE OF FIBROTIC DISEASES
6.1.2 INCREASE IN THE NUMBER OF PEOPLE SMOKING CIGARETTES
6.1.3 TECHNOLOGICAL ADVANCEMENT IN THE TREATMENT OF FIBROSIS DISEASES
6.1.4 AWARENESS AND EARLY DIAGNOSIS INITIATIVES
6.2 RESTRAINTS
6.2.1 HIGH COST OF MEDICATION AND TREATMENTS
6.2.2 LACK OF EFFECTIVE BIOMARKERS AND DIAGNOSTIC TOOLS FOR EARLY DETECTION AND MONITORING OF FIBROTIC DISEASES
6.3 OPPORTUNITIES
6.3.1 RISING RESEARCH AND DEVELOPMENT ACTIVITIES
6.3.2 ADVANCEMENTS IN PIPELINE DRUG DEVELOPMENTS
6.3.3 INCREASING STRATEGIC COLLABORATIONS AND PARTNERSHIPS
6.4 CHALLENGES
6.4.1 THE COMPLEX AND MULTIFACTORIAL NATURE OF FIBROTIC DISEASES.
6.4.2 HIGH RATE OF FAILURE IN CLINICAL TRIALS FOR FIBROTIC DISEASES,
7 GLOBAL FIBROTIC DISEASE TREATMENT MARKET, BY TREATMENT
7.1 OVERVIEW
7.2 MEDICATION
7.2.1 MEDICATION, BY TREATMENT
7.2.2 MEDICATION, BY DISTRIBUTION CHANNEL
7.3 ORGAN TRANSPLANT
7.4 OXYGEN THERAPY
7.5 OTHERS
8 GLOBAL FIBROTIC DISEASE TREATMENT MARKET, BY APPLICATION
8.1 OVERVIEW
8.2 IDIOPATHIC PULMONARY FIBROSIS
8.3 HEPATIC CIRRHOSIS
8.4 RENAL FIBROSIS
8.5 CUTANEOUS FIBROSIS
8.6 OTHERS
9 GLOBAL FIBROTIC DISEASE TREATMENT MARKET, BY END USER
9.1 OVERVIEW
9.2 HOSPITALS
9.3 SPECIALTY CLINICS
9.4 ACADEMIC AND RESEARCH INSTITUTES
9.5 OTHERS
10 MERCADO GLOBAL DE TRATAMENTO DE DOENÇAS FIBRÓTICAS, POR REGIÃO
10.1 VISÃO GERAL
10.2 AMÉRICA DO NORTE
10.3 EUROPA
10.4 ÁSIA-PACÍFICO
10,5 AMÉRICA DO SUL
10.6 ORIENTE MÉDIO E ÁFRICA
11 MERCADO GLOBAL DE TRATAMENTO DE DOENÇAS FIBRÓTICAS, CENÁRIO DA EMPRESA
11.1 ANÁLISE DE AÇÕES DA EMPRESA: GLOBAL
11.2 ANÁLISE DE AÇÕES DA EMPRESA: AMÉRICA DO NORTE
11.3 ANÁLISE DE AÇÕES DA EMPRESA: EUROPA
11.4 ANÁLISE DE AÇÕES DA EMPRESA: ÁSIA-PACÍFICO
12 ANÁLISE SWOT
13 PERFIL DA EMPRESA
13.1 BOEHRINGER INGELHEIM INTERNATIONAL GMBH
13.1.1 RESUMO DA EMPRESA
13.1.2 ANÁLISE DE RECEITA
13.1.3 ANÁLISE DAS AÇÕES DA EMPRESA
13.1.4 PORTFÓLIO DE PRODUTOS
13.1.5 DESENVOLVIMENTOS RECENTES
13.2 GENENTECH, INC. (UMA SUBSIDIÁRIA DA F. HOFFMANN-LA ROCHE LTD)
13.2.1 RESUMO DA EMPRESA
13.2.2 ANÁLISE DAS AÇÕES DA EMPRESA
13.2.3 PORTFÓLIO DE PRODUTOS
13.2.4 DESENVOLVIMENTOS RECENTES
13.3 TEVA PHARMACEUTICAL INDUSTRIES LTD.
13.3.1 RESUMO DA EMPRESA
13.3.2 ANÁLISE DE RECEITA
13.3.3 ANÁLISE DE AÇÕES DA EMPRESA
13.3.4 PORTFÓLIO DE PRODUTOS
13.3.5 DESENVOLVIMENTOS RECENTES
13.4 SANDOZ INTERNATIONAL GMBH
13.4.1 RESUMO DA EMPRESA
13.4.2 ANÁLISE DAS AÇÕES DA EMPRESA
13.4.3 PORTFÓLIO DE PRODUTOS
13.4.4 DESENVOLVIMENTOS RECENTES
13.5 ACCORD SAÚDE
13.5.1 RESUMO DA EMPRESA
13.5.2 ANÁLISE DAS AÇÕES DA EMPRESA
13.5.3 PORTFÓLIO DE PRODUTOS
13.5.4 DESENVOLVIMENTOS RECENTES
13.6 ABBVIE INC.
13.6.1 RESUMO DA EMPRESA
13.6.2 ANÁLISE DE RECEITA
13.6.3 PORTFÓLIO DE PRODUTOS
13.6.4 DESENVOLVIMENTOS RECENTES
13.7 BRISTOL-MYERS SQUIBB COMPANY.
13.7.1 RESUMO DA EMPRESA
13.7.2 ANÁLISE DE RECEITA
13.7.3 PORTFÓLIO DE PRODUTOS
13.7.4 DESENVOLVIMENTOS RECENTES
13.8 BIOMX.
13.8.1 RESUMO DA EMPRESA
13.8.2 PORTFÓLIO DE PRODUTOS
13.8.3 DESENVOLVIMENTOS RECENTES
13.9 INTERCEPT PHARMACEUTICALS, INC.
13.9.1 RESUMO DA EMPRESA
13.9.2 ANÁLISE DE RECEITA
13.9.3 PORTFÓLIO DE PRODUTOS
13.9.4 DESENVOLVIMENTOS RECENTES
13.1 KITHER BIOTECH SRL
13.10.1 RESUMO DA EMPRESA
13.10.2 PORTFÓLIO DE PRODUTOS
13.10.3 DESENVOLVIMENTOS RECENTES
13.11 REDX PHARMA PLC.
13.11.1 RESUMO DA EMPRESA
13.11.2 ANÁLISE DE RECEITA
13.11.3 PORTFÓLIO DE PRODUTOS
13.11.4 DESENVOLVIMENTOS RECENTES
13.12 VERONA PHARMA PLC
13.12.1 RESUMO DA EMPRESA
13.12.2 ANÁLISE DE RECEITA
13.12.3 PORTFÓLIO DE PRODUTOS
13.12.4 DESENVOLVIMENTOS RECENTES
14 QUESTIONÁRIO
15 RELATÓRIOS RELACIONADOS
Lista de Tabela
TABELA 1 MERCADO GLOBAL DE TRATAMENTO DE DOENÇAS FIBRÓTICAS, POR TRATAMENTO, 2018-2032 (MIL USD)
TABELA 2 MERCADO GLOBAL DE MEDICAMENTOS NO TRATAMENTO DE DOENÇAS FIBRÓTICAS, POR REGIÃO, 2018-2032 (MIL USD)
TABELA 3 MERCADO GLOBAL DE MEDICAMENTOS NO TRATAMENTO DE DOENÇAS FIBRÓTICAS, POR TRATAMENTO, 2018-2032 (MIL USD)
TABELA 4 MERCADO GLOBAL DE MEDICAMENTOS NO TRATAMENTO DE DOENÇAS FIBRÓTICAS: POR TRATAMENTO, 2018-2032 (VOLUME)
TABELA 5 MERCADO GLOBAL DE MEDICAMENTOS NO TRATAMENTO DE DOENÇAS FIBRÓTICAS: POR TRATAMENTO, 2018-2032 (ASP)
TABELA 6 MERCADO GLOBAL DE MEDICAMENTOS NO TRATAMENTO DE DOENÇAS FIBRÓTICAS, POR CANAL DE DISTRIBUIÇÃO, 2018-2032 (MIL USD)
TABELA 7 MERCADO GLOBAL DE TRANSPLANTE DE ÓRGÃOS NO TRATAMENTO DE DOENÇAS FIBRÓTICAS, POR REGIÃO, 2018-2032 (MIL USD)
TABELA 8 MERCADO GLOBAL DE OXIGÊNIOTERAPIA NO TRATAMENTO DE DOENÇAS FIBRÓTICAS, POR REGIÃO, 2018-2032 (MIL USD)
TABELA 9 OUTROS INDICADOS NO MERCADO GLOBAL DE TRATAMENTO DE DOENÇAS FIBRÓTICAS, POR REGIÃO, 2018-2032 (MIL USD)
TABELA 10 MERCADO GLOBAL DE TRATAMENTO DE DOENÇAS FIBRÓTICAS, POR APLICAÇÃO, 2018-2032 (MIL USD)
TABELA 11 FIBROSE PULMONAR IDIOPÁTICA NO MERCADO GLOBAL DE TRATAMENTO DE DOENÇAS FIBRÓTICAS, POR REGIÃO, 2018-2032 (MIL USD)
TABELA 12 CIRROSE HEPÁTICA NO MERCADO GLOBAL DE TRATAMENTO DE DOENÇAS FIBRÓTICAS, POR REGIÃO, 2018-2032 (MIL USD)
TABELA 13 MERCADO GLOBAL DE TRATAMENTO DE FIBROSE RENAL NO TRATAMENTO DE DOENÇAS FIBRÓTICAS, POR REGIÃO, 2018-2032 (MIL USD)
TABELA 14 MERCADO GLOBAL DE TRATAMENTO DE FIBROSE CUTÂNEA NO TRATAMENTO DE DOENÇAS FIBRÓTICAS, POR REGIÃO, 2018-2032 (MIL USD)
TABELA 15 OUTROS INDICADOS NO MERCADO GLOBAL DE TRATAMENTO DE DOENÇAS FIBRÓTICAS, POR REGIÃO, 2018-2032 (MIL USD)
TABELA 16 MERCADO GLOBAL DE TRATAMENTO DE DOENÇAS FIBRÓTICAS, POR USUÁRIO FINAL, 2018-2032 (MIL USD)
TABELA 17 HOSPITAIS GLOBAIS NO MERCADO DE TRATAMENTO DE DOENÇAS FIBRÓTICAS, POR REGIÃO, 2018-2032 (MIL USD)
TABELA 18 CLÍNICAS ESPECIALIZADAS GLOBAIS NO MERCADO DE TRATAMENTO DE DOENÇAS FIBRÓTICAS, POR REGIÃO, 2018-2032 (MIL USD)
TABELA 19 INSTITUTOS ACADÊMICOS E DE PESQUISA GLOBAIS NO MERCADO DE TRATAMENTO DE DOENÇAS FIBRÓTICAS, POR REGIÃO, 2018-2032 (MIL USD)
TABELA 20 OUTROS USOS FINALIZADOS NO MERCADO GLOBAL DE TRATAMENTO DE DOENÇAS FIBRÓTICAS, POR REGIÃO, 2018-2032 (MIL USD)
TABELA 21 MERCADO GLOBAL DE TRATAMENTO DE DOENÇAS FIBRÓTICAS, POR REGIÃO, 2018-2032 (MIL USD)
TABELA 22 MERCADO DE TRATAMENTO DE DOENÇA FIBRÓTICA NA AMÉRICA DO NORTE, POR PAÍS, 2018-2032 (MIL DÓLARES)
TABELA 23 MERCADO DE TRATAMENTO DE DOENÇA FIBRÓTICA NA AMÉRICA DO NORTE, POR TRATAMENTO, 2018-2032 (MIL USD)
TABELA 24 MEDICAMENTOS NA AMÉRICA DO NORTE NO MERCADO DE TRATAMENTO DE DOENÇAS FIBRÓTICAS, POR TRATAMENTO, 2018-2032 (MIL USD)
TABELA 25 MEDICAMENTOS NA AMÉRICA DO NORTE NO MERCADO DE TRATAMENTO DE DOENÇAS FIBRÓTICAS, POR TRATAMENTO, 2018-2032 (VOLUME)
TABELA 26 MEDICAMENTOS NA AMÉRICA DO NORTE NO MERCADO DE TRATAMENTO DE DOENÇAS FIBRÓTICAS, POR TRATAMENTO, 2018-2032 (ASP)
TABELA 27 MERCADO DE TRATAMENTO DE DOENÇAS FIBRÓTICAS NA AMÉRICA DO NORTE, POR APLICAÇÃO, 2018-2032 (MIL USD)
TABELA 28 MERCADO DE TRATAMENTO DE DOENÇAS FIBRÓTICAS NA AMÉRICA DO NORTE, POR USUÁRIO FINAL, 2018-2032 (MIL USD)
TABELA 29 MEDICAMENTOS NA AMÉRICA DO NORTE NO MERCADO DE TRATAMENTO DE DOENÇAS FIBRÓTICAS, POR CANAL DE DISTRIBUIÇÃO, 2018-2032 (MIL USD)
TABELA 30 MERCADO DE TRATAMENTO DE DOENÇAS FIBRÓTICAS NOS EUA, POR TRATAMENTO, 2018-2032 (MIL USD)
TABELA 31 MEDICAMENTOS NO MERCADO DE TRATAMENTO DE DOENÇAS FIBRÓTICAS NOS EUA, POR TRATAMENTO, 2018-2032 (MIL USD)
TABELA 32 MEDICAMENTOS NO MERCADO DE TRATAMENTO DE DOENÇAS FIBRÓTICAS NOS EUA, POR TRATAMENTO, 2018-2032 (VOLUME)
TABELA 33 MEDICAMENTOS NO MERCADO DE TRATAMENTO DE DOENÇAS FIBRÓTICAS NOS EUA, POR TRATAMENTO, 2018-2032 (ASP)
TABELA 34 MERCADO DE TRATAMENTO DE DOENÇAS FIBRÓTICAS NOS EUA, POR APLICAÇÃO, 2018-2032 (MIL USD)
TABELA 35 MERCADO DE TRATAMENTO DE DOENÇAS FIBRÓTICAS NOS EUA, POR USUÁRIO FINAL, 2018-2032 (MIL USD)
TABELA 36 MEDICAMENTOS NO MERCADO DE TRATAMENTO DE DOENÇAS FIBRÓTICAS NOS EUA, POR CANAL DE DISTRIBUIÇÃO, 2018-2032 (MIL USD)
TABELA 37 MERCADO CANADÁ DE TRATAMENTO DE DOENÇAS FIBRÓTICAS, POR TRATAMENTO, 2018-2032 (MIL USD)
TABELA 38 MEDICAMENTOS NO MERCADO CANADÁ DE TRATAMENTO DE DOENÇAS FIBRÓTICAS, POR TRATAMENTO, 2018-2032 (MIL USD)
TABELA 39 MEDICAMENTOS NO MERCADO CANADÁ DE TRATAMENTO DE DOENÇAS FIBRÓTICAS, POR TRATAMENTO, 2018-2032 (VOLUME)
TABELA 40 MEDICAMENTOS NO MERCADO CANADÁ DE TRATAMENTO DE DOENÇAS FIBRÓTICAS, POR TRATAMENTO, 2018-2032 (ASP)
TABELA 41 MERCADO CANADÁ DE TRATAMENTO DE DOENÇAS FIBRÓTICAS, POR APLICAÇÃO, 2018-2032 (MIL USD)
TABELA 42 MERCADO CANADÁ DE TRATAMENTO DE DOENÇAS FIBRÓTICAS, POR USUÁRIO FINAL, 2018-2032 (MIL USD)
TABELA 43 MEDICAMENTOS NO MERCADO CANADÁ DE TRATAMENTO DE DOENÇAS FIBRÓTICAS, POR CANAL DE DISTRIBUIÇÃO, 2018-2032 (MIL USD)
TABELA 44 MERCADO DE TRATAMENTO DE DOENÇAS FIBRÓTICAS NO MÉXICO, POR TRATAMENTO, 2018-2032 (MIL USD)
TABELA 45 MEDICAMENTOS NO MERCADO DE TRATAMENTO DE DOENÇAS FIBRÓTICAS NO MÉXICO, POR TRATAMENTO, 2018-2032 (MIL USD)
TABELA 46 MEDICAMENTOS NO MERCADO DE TRATAMENTO DE DOENÇAS FIBRÓTICAS NO MÉXICO, POR TRATAMENTO, 2018-2032 (VOLUME)
TABELA 47 MEDICAMENTOS NO MERCADO DE TRATAMENTO DE DOENÇAS FIBRÓTICAS NO MÉXICO, POR TRATAMENTO, 2018-2032 (ASP)
TABELA 48 MERCADO DE TRATAMENTO DE DOENÇAS FIBRÓTICAS NO MÉXICO, POR APLICAÇÃO, 2018-2032 (MIL USD)
TABELA 49 MERCADO DE TRATAMENTO DE DOENÇAS FIBRÓTICAS NO MÉXICO, POR USUÁRIO FINAL, 2018-2032 (MIL USD)
TABELA 50 MEDICAMENTOS NO MERCADO DE TRATAMENTO DE DOENÇAS FIBRÓTICAS NO MÉXICO, POR CANAL DE DISTRIBUIÇÃO, 2018-2032 (MIL USD)
TABELA 51 MERCADO DE TRATAMENTO DE DOENÇA FIBRÓTICA NA REPÚBLICA DOMINICANA, POR TRATAMENTO, 2018-2032 (MIL USD)
TABELA 52 MEDICAMENTOS DA REPÚBLICA DOMINICANA NO MERCADO DE TRATAMENTO DE DOENÇAS FIBRÓTICAS, POR TRATAMENTO, 2018-2032 (MIL USD)
TABELA 53 MEDICAMENTOS DA REPÚBLICA DOMINICANA NO MERCADO DE TRATAMENTO DE DOENÇAS FIBRÓTICAS, POR TRATAMENTO, 2018-2032 (VOLUME)
TABELA 54 MEDICAMENTOS DA REPÚBLICA DOMINICANA NO MERCADO DE TRATAMENTO DE DOENÇAS FIBRÓTICAS, POR TRATAMENTO, 2018-2032 (ASP)
TABELA 55 MERCADO DE TRATAMENTO DE DOENÇA FIBRÓTICA DA REPÚBLICA DOMINICANA, POR APLICAÇÃO, 2018-2032 (MIL USD)
TABELA 56 MERCADO DE TRATAMENTO DE DOENÇA FIBRÓTICA DA REPÚBLICA DOMINICANA, POR USUÁRIO FINAL, 2018-2032 (MIL USD)
TABELA 57 MEDICAMENTOS DA REPÚBLICA DOMINICANA NO MERCADO DE TRATAMENTO DE DOENÇAS FIBRÓTICAS, POR CANAL DE DISTRIBUIÇÃO, 2018-2032 (MIL USD)
TABELA 58 MERCADO DE TRATAMENTO DE DOENÇAS FIBRÓTICAS NA JAMAICA, POR TRATAMENTO, 2018-2032 (MIL USD)
TABELA 59 MEDICAMENTOS NA JAMAICA NO MERCADO DE TRATAMENTO DE DOENÇAS FIBRÓTICAS, POR TRATAMENTO, 2018-2032 (MIL USD)
TABELA 60 MEDICAMENTOS NA JAMAICA NO MERCADO DE TRATAMENTO DE DOENÇAS FIBRÓTICAS, POR TRATAMENTO, 2018-2032 (VOLUME)
TABELA 61 MEDICAMENTOS NA JAMAICA NO MERCADO DE TRATAMENTO DE DOENÇAS FIBRÓTICAS, POR TRATAMENTO, 2018-2032 (ASP)
TABELA 62 MERCADO DE TRATAMENTO DE DOENÇAS FIBRÓTICAS DA JAMAICA, POR APLICAÇÃO, 2018-2032 (MIL USD)
TABELA 63 MERCADO DE TRATAMENTO DE DOENÇAS FIBRÓTICAS DA JAMAICA, POR USUÁRIO FINAL, 2018-2032 (MIL USD)
TABELA 64 MEDICAMENTOS NA JAMAICA NO MERCADO DE TRATAMENTO DE DOENÇAS FIBRÓTICAS, POR CANAL DE DISTRIBUIÇÃO, 2018-2032 (MIL USD)
TABELA 65 MERCADO DE TRATAMENTO DE DOENÇA FIBRÓTICA DO PANAMÁ, POR TRATAMENTO, 2018-2032 (MIL USD)
TABELA 66 MEDICAMENTOS NO PANAMÁ NO MERCADO DE TRATAMENTO DE DOENÇAS FIBRÓTICAS, POR TRATAMENTO, 2018-2032 (MIL USD)
TABELA 67 MEDICAMENTOS NO PANAMÁ NO MERCADO DE TRATAMENTO DE DOENÇAS FIBRÓTICAS, POR TRATAMENTO, 2018-2032 (VOLUME)
TABELA 68 MEDICAMENTOS NO PANAMÁ NO MERCADO DE TRATAMENTO DE DOENÇAS FIBRÓTICAS, POR TRATAMENTO, 2018-2032 (ASP)
TABELA 69 MERCADO DE TRATAMENTO DE DOENÇAS FIBRÓTICAS DO PANAMÁ, POR APLICAÇÃO, 2018-2032 (MIL USD)
TABELA 70 MERCADO DE TRATAMENTO DE DOENÇAS FIBRÓTICAS DO PANAMÁ, POR USUÁRIO FINAL, 2018-2032 (MIL USD)
TABELA 71 MEDICAMENTOS NO PANAMÁ NO MERCADO DE TRATAMENTO DE DOENÇAS FIBRÓTICAS, POR CANAL DE DISTRIBUIÇÃO, 2018-2032 (MIL USD)
TABELA 72 MERCADO EUROPEU DE TRATAMENTO DE DOENÇAS FIBRÓTICAS, POR PAÍS, 2018-2032 (MIL USD)
TABELA 73 MERCADO EUROPEU DE TRATAMENTO DE DOENÇAS FIBRÓTICAS, POR TRATAMENTO, 2018-2032 (MIL USD)
TABELA 74 MEDICAMENTOS NA EUROPA NO MERCADO DE TRATAMENTO DE DOENÇAS FIBRÓTICAS, POR TRATAMENTO, 2018-2032 (MIL USD)
TABELA 75 MEDICAMENTOS NA EUROPA NO MERCADO DE TRATAMENTO DE DOENÇAS FIBRÓTICAS, POR TRATAMENTO, 2018-2032 (VOLUME)
TABELA 76 MEDICAMENTOS NA EUROPA NO MERCADO DE TRATAMENTO DE DOENÇAS FIBRÓTICAS, POR TRATAMENTO, 2018-2032 (ASP)
TABELA 77 MERCADO EUROPEU DE TRATAMENTO DE DOENÇAS FIBRÓTICAS, POR APLICAÇÃO, 2018-2032 (MIL USD)
TABELA 78 MERCADO EUROPEU DE TRATAMENTO DE DOENÇAS FIBRÓTICAS, POR USUÁRIO FINAL, 2018-2032 (MIL USD)
TABELA 79 MEDICAMENTOS NA EUROPA NO MERCADO DE TRATAMENTO DE DOENÇAS FIBRÓTICAS, POR CANAL DE DISTRIBUIÇÃO, 2018-2032 (MIL USD)
TABELA 80 MERCADO DE TRATAMENTO DE DOENÇAS FIBRÓTICAS NA ALEMANHA, POR TRATAMENTO, 2018-2032 (MIL USD)
TABELA 81 MEDICAMENTOS NA ALEMANHA NO MERCADO DE TRATAMENTO DE DOENÇAS FIBRÓTICAS, POR TRATAMENTO, 2018-2032 (MIL USD)
TABELA 82 MEDICAMENTOS NA ALEMANHA NO MERCADO DE TRATAMENTO DE DOENÇAS FIBRÓTICAS, POR TRATAMENTO, 2018-2032 (VOLUME)
TABELA 83 MEDICAMENTOS NA ALEMANHA NO MERCADO DE TRATAMENTO DE DOENÇAS FIBRÓTICAS, POR TRATAMENTO, 2018-2032 (ASP)
TABELA 84 MERCADO DE TRATAMENTO DE DOENÇAS FIBRÓTICAS NA ALEMANHA, POR APLICAÇÃO, 2018-2032 (MIL USD)
TABELA 85 MERCADO DE TRATAMENTO DE DOENÇAS FIBRÓTICAS NA ALEMANHA, POR USUÁRIO FINAL, 2018-2032 (MIL USD)
TABELA 86 MEDICAMENTOS NA ALEMANHA NO MERCADO DE TRATAMENTO DE DOENÇAS FIBRÓTICAS, POR CANAL DE DISTRIBUIÇÃO, 2018-2032 (MIL USD)
TABELA 87 MERCADO DE TRATAMENTO DE DOENÇAS FIBRÓTICAS NA FRANÇA, POR TRATAMENTO, 2018-2032 (MIL USD)
TABELA 88 FRANÇA MEDICAMENTOS NO MERCADO DE TRATAMENTO DE DOENÇAS FIBRÓTICAS, POR TRATAMENTO, 2018-2032 (MIL USD)
TABELA 89 FRANÇA MEDICAMENTOS NO MERCADO DE TRATAMENTO DE DOENÇAS FIBRÓTICAS, POR TRATAMENTO, 2018-2032 (VOLUME)
TABELA 90 MEDICAMENTOS NA FRANÇA NO MERCADO DE TRATAMENTO DE DOENÇAS FIBRÓTICAS, POR TRATAMENTO, 2018-2032 (ASP)
TABELA 91 MERCADO DE TRATAMENTO DE DOENÇAS FIBRÓTICAS NA FRANÇA, POR APLICAÇÃO, 2018-2032 (MIL USD)
TABELA 92 MERCADO DE TRATAMENTO DE DOENÇAS FIBRÓTICAS NA FRANÇA, POR USUÁRIO FINAL, 2018-2032 (MIL USD)
TABELA 93 FRANÇA MEDICAMENTOS NO MERCADO DE TRATAMENTO DE DOENÇAS FIBRÓTICAS, POR CANAL DE DISTRIBUIÇÃO, 2018-2032 (MIL USD)
TABELA 94 MERCADO DE TRATAMENTO DE DOENÇAS FIBRÓTICAS NO REINO UNIDO, POR TRATAMENTO, 2018-2032 (MIL USD)
TABELA 95 MEDICAMENTOS NO MERCADO DO REINO UNIDO PARA TRATAMENTO DE DOENÇAS FIBRÓTICAS, POR TRATAMENTO, 2018-2032 (MIL USD)
TABELA 96 MEDICAMENTOS NO MERCADO DE TRATAMENTO DE DOENÇAS FIBRÓTICAS NO REINO UNIDO, POR TRATAMENTO, 2018-2032 (VOLUME)
TABELA 97 MEDICAMENTOS NO MERCADO DO REINO UNIDO PARA TRATAMENTO DE DOENÇAS FIBRÓTICAS, POR TRATAMENTO, 2018-2032 (ASP)
TABELA 98 MERCADO DE TRATAMENTO DE DOENÇAS FIBRÓTICAS NO REINO UNIDO, POR APLICAÇÃO, 2018-2032 (MIL USD)
TABELA 99 MERCADO DE TRATAMENTO DE DOENÇAS FIBRÓTICAS NO REINO UNIDO, POR USUÁRIO FINAL, 2018-2032 (MIL USD)
TABELA 100 MEDICAMENTOS NO MERCADO DE TRATAMENTO DE DOENÇAS FIBRÓTICAS DO REINO UNIDO, POR CANAL DE DISTRIBUIÇÃO, 2018-2032 (MIL USD)
TABELA 101 MERCADO DE TRATAMENTO DE DOENÇAS FIBRÓTICAS NA ITÁLIA, POR TRATAMENTO, 2018-2032 (MIL USD)
TABELA 102 MEDICAMENTOS NA ITÁLIA NO MERCADO DE TRATAMENTO DE DOENÇAS FIBRÓTICAS, POR TRATAMENTO, 2018-2032 (MIL USD)
TABELA 103 MEDICAMENTOS NA ITÁLIA NO MERCADO DE TRATAMENTO DE DOENÇAS FIBRÓTICAS, POR TRATAMENTO, 2018-2032 (VOLUME)
TABELA 104 MEDICAMENTOS NA ITÁLIA NO MERCADO DE TRATAMENTO DE DOENÇAS FIBRÓTICAS, POR TRATAMENTO, 2018-2032 (ASP)
TABELA 105 MERCADO DE TRATAMENTO DE DOENÇAS FIBRÓTICAS NA ITÁLIA, POR APLICAÇÃO, 2018-2032 (MIL USD)
TABELA 106 MERCADO DE TRATAMENTO DE DOENÇAS FIBRÓTICAS NA ITÁLIA, POR USUÁRIO FINAL, 2018-2032 (MIL USD)
TABELA 107 MEDICAMENTOS NA ITÁLIA NO MERCADO DE TRATAMENTO DE DOENÇAS FIBRÓTICAS, POR CANAL DE DISTRIBUIÇÃO, 2018-2032 (MIL USD)
TABELA 108 MERCADO ESPANHA DE TRATAMENTO DE DOENÇAS FIBRÓTICAS, POR TRATAMENTO, 2018-2032 (MIL USD)
TABELA 109 MEDICAMENTOS NA ESPANHA NO MERCADO DE TRATAMENTO DE DOENÇAS FIBRÓTICAS, POR TRATAMENTO, 2018-2032 (MIL USD)
TABELA 110 MEDICAMENTOS NA ESPANHA NO MERCADO DE TRATAMENTO DE DOENÇAS FIBRÓTICAS, POR TRATAMENTO, 2018-2032 (VOLUME)
TABELA 111 MEDICAMENTOS NA ESPANHA NO MERCADO DE TRATAMENTO DE DOENÇAS FIBRÓTICAS, POR TRATAMENTO, 2018-2032 (ASP)
TABELA 112 MERCADO ESPANHA DE TRATAMENTO DE DOENÇAS FIBRÓTICAS, POR APLICAÇÃO, 2018-2032 (MIL USD)
TABELA 113 MERCADO ESPANHA DE TRATAMENTO DE DOENÇAS FIBRÓTICAS, POR USUÁRIO FINAL, 2018-2032 (MIL USD)
TABELA 114 MEDICAMENTOS NA ESPANHA NO MERCADO DE TRATAMENTO DE DOENÇAS FIBRÓTICAS, POR CANAL DE DISTRIBUIÇÃO, 2018-2032 (MIL USD)
TABELA 115 MERCADO DE TRATAMENTO DE DOENÇAS FIBRÓTICAS NA RÚSSIA, POR TRATAMENTO, 2018-2032 (MIL USD)
TABELA 116 MEDICAMENTOS DA RÚSSIA NO MERCADO DE TRATAMENTO DE DOENÇAS FIBRÓTICAS, POR TRATAMENTO, 2018-2032 (MIL USD)
TABELA 117 MEDICAMENTOS DA RÚSSIA NO MERCADO DE TRATAMENTO DE DOENÇAS FIBRÓTICAS, POR TRATAMENTO, 2018-2032 (VOLUME)
TABELA 118 MEDICAMENTOS DA RÚSSIA NO MERCADO DE TRATAMENTO DE DOENÇAS FIBRÓTICAS, POR TRATAMENTO, 2018-2032 (ASP)
TABELA 119 MERCADO DE TRATAMENTO DE DOENÇAS FIBRÓTICAS NA RÚSSIA, POR APLICAÇÃO, 2018-2032 (MIL USD)
TABELA 120 MERCADO DE TRATAMENTO DE DOENÇAS FIBRÓTICAS NA RÚSSIA, POR USUÁRIO FINAL, 2018-2032 (MIL USD)
TABELA 121 MEDICAMENTOS DA RÚSSIA NO MERCADO DE TRATAMENTO DE DOENÇAS FIBRÓTICAS, POR CANAL DE DISTRIBUIÇÃO, 2018-2032 (MIL USD)
TABELA 122 MERCADO DE TRATAMENTO DE DOENÇA FIBRÓTICA NA TURQUIA, POR TRATAMENTO, 2018-2032 (MIL USD)
TABELA 123 MEDICAMENTOS NA TURQUIA NO MERCADO DE TRATAMENTO DE DOENÇAS FIBRÓTICAS, POR TRATAMENTO, 2018-2032 (MIL USD)
TABELA 124 MEDICAMENTOS NA TURQUIA NO MERCADO DE TRATAMENTO DE DOENÇAS FIBRÓTICAS, POR TRATAMENTO, 2018-2032 (VOLUME)
TABELA 125 MEDICAMENTOS DA TURQUIA NO MERCADO DE TRATAMENTO DE DOENÇAS FIBRÓTICAS, POR TRATAMENTO, 2018-2032 (ASP)
TABELA 126 MERCADO DE TRATAMENTO DE DOENÇA FIBRÓTICA NA TURQUIA, POR APLICAÇÃO, 2018-2032 (MIL USD)
TABELA 127 MERCADO DE TRATAMENTO DE DOENÇA FIBRÓTICA NA TURQUIA, POR USUÁRIO FINAL, 2018-2032 (MIL USD)
TABELA 128 MEDICAMENTOS DA TURQUIA NO MERCADO DE TRATAMENTO DE DOENÇAS FIBRÓTICAS, POR CANAL DE DISTRIBUIÇÃO, 2018-2032 (MIL USD)
TABELA 129 MERCADO HOLANDÊS DE TRATAMENTO DE DOENÇA FIBRÓTICA, POR TRATAMENTO, 2018-2032 (MIL USD)
TABELA 130 MEDICAMENTOS HOLANDESES NO MERCADO DE TRATAMENTO DE DOENÇAS FIBRÓTICAS, POR TRATAMENTO, 2018-2032 (MIL USD)
TABELA 131 MEDICAMENTOS HOLANDESES NO MERCADO DE TRATAMENTO DE DOENÇAS FIBRÓTICAS, POR TRATAMENTO, 2018-2032 (VOLUME)
TABELA 132 MEDICAMENTOS HOLANDESES NO MERCADO DE TRATAMENTO DE DOENÇAS FIBRÓTICAS, POR TRATAMENTO, 2018-2032 (ASP)
TABELA 133 MERCADO HOLANDÊS DE TRATAMENTO DE DOENÇAS FIBRÓTICAS, POR APLICAÇÃO, 2018-2032 (MIL USD)
TABELA 134 MERCADO HOLANDÊS DE TRATAMENTO DE DOENÇAS FIBRÓTICAS, POR USUÁRIO FINAL, 2018-2032 (MIL USD)
TABELA 135 MEDICAMENTOS HOLANDESES NO MERCADO DE TRATAMENTO DE DOENÇAS FIBRÓTICAS, POR CANAL DE DISTRIBUIÇÃO, 2018-2032 (MIL USD)
TABELA 136 MERCADO DE TRATAMENTO DE DOENÇA FIBRÓTICA NA SUÍÇA, POR TRATAMENTO, 2018-2032 (MIL USD)
TABELA 137 MEDICAMENTOS NA SUÍÇA NO MERCADO DE TRATAMENTO DE DOENÇAS FIBRÓTICAS, POR TRATAMENTO, 2018-2032 (MIL USD)
TABELA 138 MERCADO DE MEDICAMENTOS NA SUÍÇA NO TRATAMENTO DE DOENÇAS FIBRÓTICAS, POR TRATAMENTO, 2018-2032 (VOLUME)
TABELA 139 MERCADO DE MEDICAMENTOS NA SUÍÇA NO TRATAMENTO DE DOENÇAS FIBRÓTICAS, POR TRATAMENTO, 2018-2032 (ASP)
TABELA 140 MERCADO DE TRATAMENTO DE DOENÇAS FIBRÓTICAS NA SUÍÇA, POR APLICAÇÃO, 2018-2032 (MIL USD)
TABELA 141 MERCADO DE TRATAMENTO DE DOENÇAS FIBRÓTICAS NA SUÍÇA, POR USUÁRIO FINAL, 2018-2032 (MIL USD)
TABELA 142 MEDICAMENTOS NA SUÍÇA NO MERCADO DE TRATAMENTO DE DOENÇAS FIBRÓTICAS, POR CANAL DE DISTRIBUIÇÃO, 2018-2032 (MIL USD)
TABELA 143 MERCADO DE TRATAMENTO DE DOENÇAS FIBRÓTICAS DA HUNGRIA, POR TRATAMENTO, 2018-2032 (MIL USD)
TABELA 144 MEDICAMENTOS NA HUNGRIA NO MERCADO DE TRATAMENTO DE DOENÇAS FIBRÓTICAS, POR TRATAMENTO, 2018-2032 (MIL USD)
TABELA 145 MEDICAMENTOS NA HUNGRIA NO MERCADO DE TRATAMENTO DE DOENÇAS FIBRÓTICAS, POR TRATAMENTO, 2018-2032 (VOLUME)
TABELA 146 MEDICAMENTOS NA HUNGRIA NO MERCADO DE TRATAMENTO DE DOENÇAS FIBRÓTICAS, POR TRATAMENTO, 2018-2032 (ASP)
TABELA 147 MERCADO DE TRATAMENTO DE DOENÇAS FIBRÓTICAS DA HUNGRIA, POR APLICAÇÃO, 2018-2032 (MIL USD)
TABELA 148 MERCADO DE TRATAMENTO DE DOENÇAS FIBRÓTICAS DA HUNGRIA, POR USUÁRIO FINAL, 2018-2032 (MIL USD)
TABELA 149 HUNGRIA MEDICAMENTOS NO MERCADO DE TRATAMENTO DE DOENÇAS FIBRÓTICAS, POR CANAL DE DISTRIBUIÇÃO, 2018-2032 (MIL USD)
TABELA 150 MERCADO DE TRATAMENTO DE DOENÇAS FIBRÓTICAS DA LITUÂNIA, POR TRATAMENTO, 2018-2032 (MIL USD)
TABELA 151 MEDICAMENTOS DA LITUÂNIA NO MERCADO DE TRATAMENTO DE DOENÇAS FIBRÓTICAS, POR TRATAMENTO, 2018-2032 (MIL USD)
TABELA 152 MEDICAMENTOS NA LITUÂNIA NO MERCADO DE TRATAMENTO DE DOENÇAS FIBRÓTICAS, POR TRATAMENTO, 2018-2032 (VOLUME)
TABELA 153 MEDICAMENTOS NA LITUÂNIA NO MERCADO DE TRATAMENTO DE DOENÇAS FIBRÓTICAS, POR TRATAMENTO, 2018-2032 (ASP)
TABELA 154 MERCADO DE TRATAMENTO DE DOENÇAS FIBRÓTICAS DA LITUÂNIA, POR APLICAÇÃO, 2018-2032 (MIL USD)
TABELA 155 MERCADO DE TRATAMENTO DE DOENÇAS FIBRÓTICAS DA LITUÂNIA, POR USUÁRIO FINAL, 2018-2032 (MIL USD)
TABELA 156 MEDICAMENTOS DA LITUÂNIA NO MERCADO DE TRATAMENTO DE DOENÇAS FIBRÓTICAS, POR CANAL DE DISTRIBUIÇÃO, 2018-2032 (MIL USD)
TABELA 157 MERCADO DE TRATAMENTO DE DOENÇAS FIBRÓTICAS NA ÁUSTRIA, POR TRATAMENTO, 2018-2032 (MIL USD)
TABELA 158 MEDICAMENTOS NA ÁUSTRIA NO MERCADO DE TRATAMENTO DE DOENÇAS FIBRÓTICAS, POR TRATAMENTO, 2018-2032 (MIL USD)
TABELA 159 ÁUSTRIA MEDICAMENTOS NO MERCADO DE TRATAMENTO DE DOENÇAS FIBRÓTICAS, POR TRATAMENTO, 2018-2032 (VOLUME)
TABELA 160 MEDICAMENTOS NA ÁUSTRIA NO MERCADO DE TRATAMENTO DE DOENÇAS FIBRÓTICAS, POR TRATAMENTO, 2018-2032 (ASP)
TABELA 161 MERCADO DE TRATAMENTO DE DOENÇAS FIBRÓTICAS NA ÁUSTRIA, POR APLICAÇÃO, 2018-2032 (MIL USD)
TABELA 162 MERCADO DE TRATAMENTO DE DOENÇAS FIBRÓTICAS NA ÁUSTRIA, POR USUÁRIO FINAL, 2018-2032 (MIL USD)
TABELA 163 MEDICAMENTOS NA ÁUSTRIA NO MERCADO DE TRATAMENTO DE DOENÇAS FIBRÓTICAS, POR CANAL DE DISTRIBUIÇÃO, 2018-2032 (MIL USD)
TABELA 164 MERCADO DE TRATAMENTO DE DOENÇA FIBRÓTICA DA IRLANDA, POR TRATAMENTO, 2018-2032 (MIL USD)
TABELA 165 MEDICAMENTOS NA IRLANDA NO MERCADO DE TRATAMENTO DE DOENÇAS FIBRÓTICAS, POR TRATAMENTO, 2018-2032 (MIL USD)
TABELA 166 MEDICAMENTOS NA IRLANDA NO MERCADO DE TRATAMENTO DE DOENÇAS FIBRÓTICAS, POR TRATAMENTO, 2018-2032 (VOLUME)
TABELA 167 MEDICAMENTOS NA IRLANDA NO MERCADO DE TRATAMENTO DE DOENÇAS FIBRÓTICAS, POR TRATAMENTO, 2018-2032 (ASP)
TABELA 168 MERCADO DE TRATAMENTO DE DOENÇAS FIBRÓTICAS DA IRLANDA, POR APLICAÇÃO, 2018-2032 (MIL USD)
TABELA 169 MERCADO DE TRATAMENTO DE DOENÇAS FIBRÓTICAS DA IRLANDA, POR USUÁRIO FINAL, 2018-2032 (MIL USD)
TABELA 170 MEDICAMENTOS DA IRLANDA NO MERCADO DE TRATAMENTO DE DOENÇAS FIBRÓTICAS, POR CANAL DE DISTRIBUIÇÃO, 2018-2032 (MIL USD)
TABELA 171 MERCADO DE TRATAMENTO DE DOENÇA FIBRÓTICA DA NORUEGA, POR TRATAMENTO, 2018-2032 (MIL USD)
TABELA 172 MEDICAMENTOS DA NORUEGA NO MERCADO DE TRATAMENTO DE DOENÇAS FIBRÓTICAS, POR TRATAMENTO, 2018-2032 (MIL USD)
TABELA 173 MEDICAMENTOS DA NORUEGA NO MERCADO DE TRATAMENTO DE DOENÇAS FIBRÓTICAS, POR TRATAMENTO, 2018-2032 (VOLUME)
TABELA 174 MEDICAMENTOS DA NORUEGA NO MERCADO DE TRATAMENTO DE DOENÇAS FIBRÓTICAS, POR TRATAMENTO, 2018-2032 (ASP)
TABELA 175 MERCADO DE TRATAMENTO DE DOENÇAS FIBRÓTICAS DA NORUEGA, POR APLICAÇÃO, 2018-2032 (MIL USD)
TABELA 176 MERCADO DE TRATAMENTO DE DOENÇAS FIBRÓTICAS DA NORUEGA, POR USUÁRIO FINAL, 2018-2032 (MIL USD)
TABELA 177 MEDICAMENTOS DA NORUEGA NO MERCADO DE TRATAMENTO DE DOENÇAS FIBRÓTICAS, POR CANAL DE DISTRIBUIÇÃO, 2018-2032 (MIL USD)
TABELA 178 MERCADO DE TRATAMENTO DE DOENÇAS FIBRÓTICAS DA POLÔNIA, POR TRATAMENTO, 2018-2032 (MIL USD)
TABELA 179 MEDICAMENTOS NA POLÔNIA NO MERCADO DE TRATAMENTO DE DOENÇAS FIBRÓTICAS, POR TRATAMENTO, 2018-2032 (MIL USD)
TABELA 180 MEDICAMENTOS NA POLÔNIA NO MERCADO DE TRATAMENTO DE DOENÇAS FIBRÓTICAS, POR TRATAMENTO, 2018-2032 (VOLUME)
TABELA 181 MEDICAMENTOS NA POLÔNIA NO MERCADO DE TRATAMENTO DE DOENÇAS FIBRÓTICAS, POR TRATAMENTO, 2018-2032 (ASP)
TABELA 182 MERCADO DE TRATAMENTO DE DOENÇAS FIBRÓTICAS DA POLÔNIA, POR APLICAÇÃO, 2018-2032 (MIL USD)
TABELA 183 MERCADO DE TRATAMENTO DE DOENÇAS FIBRÓTICAS DA POLÔNIA, POR USUÁRIO FINAL, 2018-2032 (MIL USD)
TABELA 184 MEDICAMENTOS NA POLÔNIA NO MERCADO DE TRATAMENTO DE DOENÇAS FIBRÓTICAS, POR CANAL DE DISTRIBUIÇÃO, 2018-2032 (MIL USD)
TABELA 185 MERCADO DE TRATAMENTO DE DOENÇAS FIBRÓTICAS NO RESTANTE DA EUROPA, POR TRATAMENTO, 2018-2032 (MIL USD)
TABELA 186 MERCADO DE TRATAMENTO DE DOENÇAS FIBRÓTICAS NA ÁSIA-PACÍFICO, POR PAÍS, 2018-2032 (MIL USD)
TABELA 187 MERCADO DE TRATAMENTO DE DOENÇAS FIBRÓTICAS NA ÁSIA-PACÍFICO, POR TRATAMENTO, 2018-2032 (MIL USD)
TABELA 188 MEDICAMENTOS NA ÁSIA-PACÍFICO NO MERCADO DE TRATAMENTO DE DOENÇAS FIBRÓTICAS, POR TRATAMENTO, 2018-2032 (MIL USD)
TABELA 189 MEDICAMENTOS NA ÁSIA-PACÍFICO NO MERCADO DE TRATAMENTO DE DOENÇAS FIBRÓTICAS, POR TRATAMENTO, 2018-2032 (VOLUME)
TABELA 190 MEDICAMENTOS NA ÁSIA-PACÍFICO NO MERCADO DE TRATAMENTO DE DOENÇAS FIBRÓTICAS, POR TRATAMENTO, 2018-2032 (ASP)
TABELA 191 MERCADO DE TRATAMENTO DE DOENÇAS FIBRÓTICAS NA ÁSIA-PACÍFICO, POR APLICAÇÃO, 2018-2032 (MIL USD)
TABELA 192 MERCADO DE TRATAMENTO DE DOENÇAS FIBRÓTICAS NA ÁSIA-PACÍFICO, POR USUÁRIO FINAL, 2018-2032 (MIL USD)
TABELA 193 MEDICAMENTOS NA ÁSIA-PACÍFICO NO MERCADO DE TRATAMENTO DE DOENÇAS FIBRÓTICAS, POR CANAL DE DISTRIBUIÇÃO, 2018-2032 (MIL USD)
TABELA 194 MERCADO DE TRATAMENTO DE DOENÇAS FIBRÓTICAS NO JAPÃO, POR TRATAMENTO, 2018-2032 (MIL USD)
TABELA 195 MEDICAMENTOS NO MERCADO DE TRATAMENTO DE DOENÇAS FIBRÓTICAS DO JAPÃO, POR TRATAMENTO, 2018-2032 (MIL USD)
TABELA 196 MEDICAMENTOS NO MERCADO DE TRATAMENTO DE DOENÇAS FIBRÓTICAS NO JAPÃO, POR TRATAMENTO, 2018-2032 (VOLUME)
TABELA 197 MEDICAMENTOS NO MERCADO DE TRATAMENTO DE DOENÇAS FIBRÓTICAS NO JAPÃO, POR TRATAMENTO, 2018-2032 (ASP)
TABELA 198 MERCADO DE TRATAMENTO DE DOENÇAS FIBRÓTICAS NO JAPÃO, POR APLICAÇÃO, 2018-2032 (MIL USD)
TABELA 199 MERCADO DE TRATAMENTO DE DOENÇAS FIBRÓTICAS NO JAPÃO, POR USUÁRIO FINAL, 2018-2032 (MIL USD)
TABELA 200 MEDICAMENTOS NO MERCADO DE TRATAMENTO DE DOENÇAS FIBRÓTICAS NO JAPÃO, POR CANAL DE DISTRIBUIÇÃO, 2018-2032 (MIL USD)
TABELA 201 MERCADO DE TRATAMENTO DE DOENÇAS FIBRÓTICAS NA CHINA, POR TRATAMENTO, 2018-2032 (MIL USD)
TABELA 202 MEDICAMENTOS DA CHINA NO MERCADO DE TRATAMENTO DE DOENÇAS FIBRÓTICAS, POR TRATAMENTO, 2018-2032 (MIL USD)
TABELA 203 MEDICAMENTOS DA CHINA NO MERCADO DE TRATAMENTO DE DOENÇAS FIBRÓTICAS, POR TRATAMENTO, 2018-2032 (VOLUME)
TABELA 204 MEDICAMENTOS DA CHINA NO MERCADO DE TRATAMENTO DE DOENÇAS FIBRÓTICAS, POR TRATAMENTO, 2018-2032 (ASP)
TABELA 205 MERCADO CHINÊS DE TRATAMENTO DE DOENÇAS FIBRÓTICAS, POR APLICAÇÃO, 2018-2032 (MIL USD)
TABELA 206 MERCADO DE TRATAMENTO DE DOENÇAS FIBRÓTICAS NA CHINA, POR USUÁRIO FINAL, 2018-2032 (MIL USD)
TABELA 207 MEDICAMENTOS DA CHINA NO MERCADO DE TRATAMENTO DE DOENÇAS FIBRÓTICAS, POR CANAL DE DISTRIBUIÇÃO, 2018-2032 (MIL USD)
TABELA 208 MERCADO DE TRATAMENTO DE DOENÇAS FIBRÓTICAS NA ÍNDIA, POR TRATAMENTO, 2018-2032 (MIL USD)
TABELA 209 MEDICAMENTOS NA ÍNDIA NO MERCADO DE TRATAMENTO DE DOENÇAS FIBRÓTICAS, POR TRATAMENTO, 2018-2032 (MIL USD)
TABELA 210 MEDICAMENTOS NA ÍNDIA NO MERCADO DE TRATAMENTO DE DOENÇAS FIBRÓTICAS, POR TRATAMENTO, 2018-2032 (VOLUME)
TABELA 211 MEDICAMENTOS NA ÍNDIA NO MERCADO DE TRATAMENTO DE DOENÇAS FIBRÓTICAS, POR TRATAMENTO, 2018-2032 (ASP)
TABELA 212 MERCADO DE TRATAMENTO DE DOENÇAS FIBRÓTICAS NA ÍNDIA, POR APLICAÇÃO, 2018-2032 (MIL USD)
TABELA 213 MERCADO DE TRATAMENTO DE DOENÇAS FIBRÓTICAS NA ÍNDIA, POR USUÁRIO FINAL, 2018-2032 (MIL USD)
TABELA 214 MEDICAMENTOS NA ÍNDIA NO MERCADO DE TRATAMENTO DE DOENÇAS FIBRÓTICAS, POR CANAL DE DISTRIBUIÇÃO, 2018-2032 (MIL USD)
TABELA 215 MERCADO DE TRATAMENTO DE DOENÇAS FIBRÓTICAS DA COREIA DO SUL, POR TRATAMENTO, 2018-2032 (MIL USD)
TABELA 216 MEDICAMENTOS DA COREIA DO SUL NO MERCADO DE TRATAMENTO DE DOENÇAS FIBRÓTICAS, POR TRATAMENTO, 2018-2032 (MIL USD)
TABELA 217 MEDICAMENTOS DA COREIA DO SUL NO MERCADO DE TRATAMENTO DE DOENÇAS FIBRÓTICAS, POR TRATAMENTO, 2018-2032 (VOLUME)
TABELA 218 MEDICAMENTOS DA COREIA DO SUL NO MERCADO DE TRATAMENTO DE DOENÇAS FIBRÓTICAS, POR TRATAMENTO, 2018-2032 (ASP)
TABELA 219 MERCADO DE TRATAMENTO DE DOENÇAS FIBRÓTICAS DA COREIA DO SUL, POR APLICAÇÃO, 2018-2032 (MIL USD)
TABELA 220 MERCADO DE TRATAMENTO DE DOENÇAS FIBRÓTICAS DA COREIA DO SUL, POR USUÁRIO FINAL, 2018-2032 (MIL USD)
TABELA 221 MEDICAMENTOS NA COREIA DO SUL NO MERCADO DE TRATAMENTO DE DOENÇAS FIBRÓTICAS, POR CANAL DE DISTRIBUIÇÃO, 2018-2032 (MIL USD)
TABELA 222 MERCADO DE TRATAMENTO DE DOENÇAS FIBRÓTICAS NA AUSTRÁLIA, POR TRATAMENTO, 2018-2032 (MIL USD)
TABELA 223 MEDICAMENTOS NA AUSTRÁLIA NO MERCADO DE TRATAMENTO DE DOENÇAS FIBRÓTICAS, POR TRATAMENTO, 2018-2032 (MIL USD)
TABELA 224 MEDICAMENTOS NA AUSTRÁLIA NO MERCADO DE TRATAMENTO DE DOENÇAS FIBRÓTICAS, POR TRATAMENTO, 2018-2032 (VOLUME)
TABELA 225 MEDICAMENTOS NA AUSTRÁLIA NO MERCADO DE TRATAMENTO DE DOENÇAS FIBRÓTICAS, POR TRATAMENTO, 2018-2032 (ASP)
TABELA 226 MERCADO DE TRATAMENTO DE DOENÇAS FIBRÓTICAS NA AUSTRÁLIA, POR APLICAÇÃO, 2018-2032 (MIL USD)
TABELA 227 MERCADO DE TRATAMENTO DE DOENÇAS FIBRÓTICAS NA AUSTRÁLIA, POR USUÁRIO FINAL, 2018-2032 (MIL USD)
TABELA 228 MEDICAMENTOS NA AUSTRÁLIA NO MERCADO DE TRATAMENTO DE DOENÇAS FIBRÓTICAS, POR CANAL DE DISTRIBUIÇÃO, 2018-2032 (MIL USD)
TABELA 229 MERCADO DE TRATAMENTO DE DOENÇAS FIBRÓTICAS DE SINGAPURA, POR TRATAMENTO, 2018-2032 (MIL USD)
TABELA 230 MEDICAMENTOS DE SINGAPURA NO MERCADO DE TRATAMENTO DE DOENÇAS FIBRÓTICAS, POR TRATAMENTO, 2018-2032 (MIL USD)
TABELA 231 MEDICAMENTOS EM SINGAPURA NO MERCADO DE TRATAMENTO DE DOENÇAS FIBRÓTICAS, POR TRATAMENTO, 2018-2032 (VOLUME)
TABELA 232 MEDICAMENTOS EM SINGAPURA NO MERCADO DE TRATAMENTO DE DOENÇAS FIBRÓTICAS, POR TRATAMENTO, 2018-2032 (ASP)
TABELA 233 MERCADO DE TRATAMENTO DE DOENÇAS FIBRÓTICAS DE SINGAPURA, POR APLICAÇÃO, 2018-2032 (MIL USD)
TABELA 234 MERCADO DE TRATAMENTO DE DOENÇAS FIBRÓTICAS DE SINGAPURA, POR USUÁRIO FINAL, 2018-2032 (MIL USD)
TABELA 235 MEDICAMENTOS DE SINGAPURA NO MERCADO DE TRATAMENTO DE DOENÇAS FIBRÓTICAS, POR CANAL DE DISTRIBUIÇÃO, 2018-2032 (MIL USD)
TABELA 236 MERCADO DE TRATAMENTO DE DOENÇA FIBRÓTICA NA TAILÂNDIA, POR TRATAMENTO, 2018-2032 (MIL USD)
TABELA 237 MEDICAMENTOS NA TAILÂNDIA NO MERCADO DE TRATAMENTO DE DOENÇAS FIBRÓTICAS, POR TRATAMENTO, 2018-2032 (MIL USD)
TABELA 238 MEDICAMENTOS NA TAILÂNDIA NO MERCADO DE TRATAMENTO DE DOENÇAS FIBRÓTICAS, POR TRATAMENTO, 2018-2032 (VOLUME)
TABELA 239 MEDICAMENTOS NA TAILÂNDIA NO MERCADO DE TRATAMENTO DE DOENÇAS FIBRÓTICAS, POR TRATAMENTO, 2018-2032 (ASP)
TABELA 240 MERCADO DE TRATAMENTO DE DOENÇAS FIBRÓTICAS NA TAILÂNDIA, POR APLICAÇÃO, 2018-2032 (MIL USD)
TABELA 241 MERCADO DE TRATAMENTO DE DOENÇAS FIBRÓTICAS NA TAILÂNDIA, POR USUÁRIO FINAL, 2018-2032 (MIL USD)
TABELA 242 MEDICAMENTOS NA TAILÂNDIA NO MERCADO DE TRATAMENTO DE DOENÇAS FIBRÓTICAS, POR CANAL DE DISTRIBUIÇÃO, 2018-2032 (MIL USD)
TABELA 243 MERCADO DE TRATAMENTO DE DOENÇA FIBRÓTICA DA MALÁSIA, POR TRATAMENTO, 2018-2032 (MIL USD)
TABELA 244 MEDICAMENTOS DA MALÁSIA NO MERCADO DE TRATAMENTO DE DOENÇAS FIBRÓTICAS, POR TRATAMENTO, 2018-2032 (MIL USD)
TABELA 245 MEDICAMENTOS DA MALÁSIA NO MERCADO DE TRATAMENTO DE DOENÇAS FIBRÓTICAS, POR TRATAMENTO, 2018-2032 (VOLUME)
TABELA 246 MEDICAMENTOS DA MALÁSIA NO MERCADO DE TRATAMENTO DE DOENÇAS FIBRÓTICAS, POR TRATAMENTO, 2018-2032 (ASP)
TABELA 247 MERCADO DE TRATAMENTO DE DOENÇAS FIBRÓTICAS DA MALÁSIA, POR APLICAÇÃO, 2018-2032 (MIL USD)
TABELA 248 MERCADO DE TRATAMENTO DE DOENÇAS FIBRÓTICAS DA MALÁSIA, POR USUÁRIO FINAL, 2018-2032 (MIL USD)
TABELA 249 MEDICAMENTOS DA MALÁSIA NO MERCADO DE TRATAMENTO DE DOENÇAS FIBRÓTICAS, POR CANAL DE DISTRIBUIÇÃO, 2018-2032 (MIL USD)
TABELA 250 MERCADO DE TRATAMENTO DE DOENÇAS FIBRÓTICAS NA INDONÉSIA, POR TRATAMENTO, 2018-2032 (MIL USD)
TABELA 251 MEDICAMENTOS NA INDONÉSIA NO MERCADO DE TRATAMENTO DE DOENÇAS FIBRÓTICAS, POR TRATAMENTO, 2018-2032 (MIL USD)
TABELA 252 MEDICAMENTOS NA INDONÉSIA NO MERCADO DE TRATAMENTO DE DOENÇAS FIBRÓTICAS, POR TRATAMENTO, 2018-2032 (VOLUME)
TABELA 253 MEDICAMENTOS NA INDONÉSIA NO MERCADO DE TRATAMENTO DE DOENÇAS FIBRÓTICAS, POR TRATAMENTO, 2018-2032 (ASP)
TABELA 254 MERCADO DE TRATAMENTO DE DOENÇAS FIBRÓTICAS DA INDONÉSIA, POR APLICAÇÃO, 2018-2032 (MIL USD)
TABELA 255 MERCADO DE TRATAMENTO DE DOENÇAS FIBRÓTICAS NA INDONÉSIA, POR USUÁRIO FINAL, 2018-2032 (MIL USD)
TABELA 256 MEDICAMENTOS NA INDONÉSIA NO MERCADO DE TRATAMENTO DE DOENÇAS FIBRÓTICAS, POR CANAL DE DISTRIBUIÇÃO, 2018-2032 (MIL USD)
TABELA 257 MERCADO DE TRATAMENTO DE DOENÇAS FIBRÓTICAS NAS FILIPINAS, POR TRATAMENTO, 2018-2032 (MIL USD)
TABELA 258 MEDICAMENTOS NAS FILIPINAS NO MERCADO DE TRATAMENTO DE DOENÇAS FIBRÓTICAS, POR TRATAMENTO, 2018-2032 (MIL USD)
TABELA 259 MEDICAMENTOS NAS FILIPINAS NO MERCADO DE TRATAMENTO DE DOENÇAS FIBRÓTICAS, POR TRATAMENTO, 2018-2032 (VOLUME)
TABELA 260 MEDICAMENTOS NAS FILIPINAS NO MERCADO DE TRATAMENTO DE DOENÇAS FIBRÓTICAS, POR TRATAMENTO, 2018-2032 (ASP)
TABELA 261 MERCADO DE TRATAMENTO DE DOENÇAS FIBRÓTICAS NAS FILIPINAS, POR APLICAÇÃO, 2018-2032 (MIL USD)
TABELA 262 MERCADO DE TRATAMENTO DE DOENÇAS FIBRÓTICAS NAS FILIPINAS, POR USUÁRIO FINAL, 2018-2032 (MIL USD)
TABELA 263 MEDICAMENTOS NAS FILIPINAS NO MERCADO DE TRATAMENTO DE DOENÇAS FIBRÓTICAS, POR CANAL DE DISTRIBUIÇÃO, 2018-2032 (MIL USD)
TABELA 264 MERCADO DE TRATAMENTO DE DOENÇAS FIBRÓTICAS NO VIETNÃ, POR TRATAMENTO, 2018-2032 (MIL USD)
TABELA 265 MEDICAMENTOS NO VIETNÃ NO MERCADO DE TRATAMENTO DE DOENÇAS FIBRÓTICAS, POR TRATAMENTO, 2018-2032 (MIL USD)
TABELA 266 MEDICAMENTOS NO VIETNÃ NO MERCADO DE TRATAMENTO DE DOENÇAS FIBRÓTICAS, POR TRATAMENTO, 2018-2032 (VOLUME)
TABELA 267 MEDICAMENTOS NO VIETNÃ NO MERCADO DE TRATAMENTO DE DOENÇAS FIBRÓTICAS, POR TRATAMENTO, 2018-2032 (ASP)
TABELA 268 MERCADO DE TRATAMENTO DE DOENÇAS FIBRÓTICAS NO VIETNÃ, POR APLICAÇÃO, 2018-2032 (MIL USD)
TABELA 269 MERCADO DE TRATAMENTO DE DOENÇAS FIBRÓTICAS NO VIETNÃ, POR USUÁRIO FINAL, 2018-2032 (MIL USD)
TABELA 270 MEDICAMENTOS NO VIETNÃ NO MERCADO DE TRATAMENTO DE DOENÇAS FIBRÓTICAS, POR CANAL DE DISTRIBUIÇÃO, 2018-2032 (MIL USD)
TABELA 271 MERCADO DE TRATAMENTO DE DOENÇAS FIBRÓTICAS DE TAIWAN, POR TRATAMENTO, 2018-2032 (MIL USD)
TABELA 272 MEDICAMENTOS DE TAIWAN NO MERCADO DE TRATAMENTO DE DOENÇAS FIBRÓTICAS, POR TRATAMENTO, 2018-2032 (MIL USD)
TABELA 273 MEDICAMENTOS DE TAIWAN NO MERCADO DE TRATAMENTO DE DOENÇAS FIBRÓTICAS, POR TRATAMENTO, 2018-2032 (VOLUME)
TABELA 274 MEDICAMENTOS DE TAIWAN NO MERCADO DE TRATAMENTO DE DOENÇAS FIBRÓTICAS, POR TRATAMENTO, 2018-2032 (ASP)
TABELA 275 MERCADO DE TRATAMENTO DE DOENÇAS FIBRÓTICAS DE TAIWAN, POR APLICAÇÃO, 2018-2032 (MIL USD)
TABELA 276 MERCADO DE TRATAMENTO DE DOENÇAS FIBRÓTICAS DE TAIWAN, POR USUÁRIO FINAL, 2018-2032 (MIL USD)
TABELA 277 MEDICAMENTOS DE TAIWAN NO MERCADO DE TRATAMENTO DE DOENÇAS FIBRÓTICAS, POR CANAL DE DISTRIBUIÇÃO, 2018-2032 (MIL USD)
TABELA 278 RESTANTE DO MERCADO DE TRATAMENTO DE DOENÇAS FIBRÓTICAS NA ÁSIA-PACÍFICO, POR TRATAMENTO, 2018-2032 (MIL USD)
TABELA 279 MERCADO DE TRATAMENTO DE DOENÇAS FIBRÓTICAS NA AMÉRICA DO SUL, POR PAÍS, 2018-2032 (MIL DÓLARES AMERICANOS)
TABELA 280 MERCADO DE TRATAMENTO DE DOENÇA FIBRÓTICA NA AMÉRICA DO SUL, POR TRATAMENTO, 2018-2032 (MIL USD)
TABELA 281 MERCADO DE MEDICAMENTOS NA AMÉRICA DO SUL NO TRATAMENTO DE DOENÇAS FIBRÓTICAS, POR TRATAMENTO, 2018-2032 (MIL USD)
TABELA 282 MERCADO DE MEDICAMENTOS NA AMÉRICA DO SUL NO TRATAMENTO DE DOENÇAS FIBRÓTICAS, POR TRATAMENTO, 2018-2032 (VOLUME)
TABELA 283 MERCADO DE MEDICAMENTOS NA AMÉRICA DO SUL NO TRATAMENTO DE DOENÇAS FIBRÓTICAS, POR TRATAMENTO, 2018-2032 (ASP)
TABELA 284 MERCADO DE TRATAMENTO DE DOENÇAS FIBRÓTICAS NA AMÉRICA DO SUL, POR APLICAÇÃO, 2018-2032 (MIL USD)
TABELA 285 MERCADO DE TRATAMENTO DE DOENÇAS FIBRÓTICAS NA AMÉRICA DO SUL, POR USUÁRIO FINAL, 2018-2032 (MIL USD)
TABELA 286 MERCADO DE MEDICAMENTOS NA AMÉRICA DO SUL PARA TRATAMENTO DE DOENÇAS FIBRÓTICAS, POR CANAL DE DISTRIBUIÇÃO, 2018-2032 (MIL USD)
TABELA 287 MERCADO BRASILEIRO DE TRATAMENTO DE DOENÇA FIBRÓTICA, POR TRATAMENTO, 2018-2032 (USD MIL)
TABELA 288 MERCADO BRASILEIRO DE MEDICAMENTOS NO TRATAMENTO DE DOENÇAS FIBRÓTICAS, POR TRATAMENTO, 2018-2032 (USD MIL)
TABELA 289 MERCADO BRASILEIRO DE MEDICAMENTOS NO TRATAMENTO DE DOENÇAS FIBRÓTICAS, POR TRATAMENTO, 2018-2032 (VOLUME)
TABELA 290 MERCADO BRASILEIRO DE MEDICAMENTOS NO TRATAMENTO DE DOENÇAS FIBRÓTICAS, POR TRATAMENTO, 2018-2032 (ASP)
TABELA 291 MERCADO BRASILEIRO DE TRATAMENTO DE DOENÇAS FIBRÓTICAS, POR APLICAÇÃO, 2018-2032 (USD MIL)
TABELA 292 MERCADO BRASILEIRO DE TRATAMENTO DE DOENÇAS FIBRÓTICAS, POR USUÁRIO FINAL, 2018-2032 (MIL USD)
TABELA 293 MERCADO BRASILEIRO DE MEDICAMENTOS NO TRATAMENTO DE DOENÇAS FIBRÓTICAS, POR CANAL DE DISTRIBUIÇÃO, 2018-2032 (USD MIL)
TABELA 294 MERCADO DE TRATAMENTO DE DOENÇAS FIBRÓTICAS DO EQUADOR, POR TRATAMENTO, 2018-2032 (MIL USD)
TABELA 295 MEDICAMENTOS NO MERCADO DE TRATAMENTO DE DOENÇAS FIBRÓTICAS DO EQUADOR, POR TRATAMENTO, 2018-2032 (MIL USD)
TABELA 296 MEDICAMENTOS NO MERCADO DE TRATAMENTO DE DOENÇAS FIBRÓTICAS DO EQUADOR, POR TRATAMENTO, 2018-2032 (VOLUME)
TABELA 297 MEDICAMENTOS NO MERCADO DE TRATAMENTO DE DOENÇAS FIBRÓTICAS DO EQUADOR, POR TRATAMENTO, 2018-2032 (ASP)
TABELA 298 MERCADO DE TRATAMENTO DE DOENÇAS FIBRÓTICAS DO EQUADOR, POR APLICAÇÃO, 2018-2032 (MIL USD)
TABELA 299 MERCADO DE TRATAMENTO DE DOENÇAS FIBRÓTICAS DO EQUADOR, POR USUÁRIO FINAL, 2018-2032 (MIL USD)
TABLE 300 ECUADOR MEDICATION IN FIBROTIC DISEASE TREATMENT MARKET, BY DISTRIBUTION CHANNEL, 2018-2032 (USD THOUSAND)
TABLE 301 CHILE FIBROTIC DISEASE TREATMENT MARKET, BY TREATMENT, 2018-2032 (USD THOUSAND)
TABLE 302 CHILE MEDICATION IN FIBROTIC DISEASE TREATMENT MARKET, BY TREATMENT, 2018-2032 (USD THOUSAND)
TABLE 303 CHILE MEDICATION IN FIBROTIC DISEASE TREATMENT MARKET, BY TREATMENT, 2018-2032 (VOLUME)
TABLE 304 CHILE MEDICATION IN FIBROTIC DISEASE TREATMENT MARKET, BY TREATMENT, 2018-2032 (ASP)
TABLE 305 CHILE FIBROTIC DISEASE TREATMENT MARKET, BY APPLICATION, 2018-2032 (USD THOUSAND)
TABLE 306 CHILE FIBROTIC DISEASE TREATMENT MARKET, BY END USER, 2018-2032 (USD THOUSAND)
TABLE 307 CHILE MEDICATION IN FIBROTIC DISEASE TREATMENT MARKET, BY DISTRIBUTION CHANNEL, 2018-2032 (USD THOUSAND)
TABLE 308 COLUMBIA FIBROTIC DISEASE TREATMENT MARKET, BY TREATMENT, 2018-2032 (USD THOUSAND)
TABLE 309 COLUMBIA MEDICATION IN FIBROTIC DISEASE TREATMENT MARKET, BY TREATMENT, 2018-2032 (USD THOUSAND)
TABLE 310 COLUMBIA MEDICATION IN FIBROTIC DISEASE TREATMENT MARKET, BY TREATMENT, 2018-2032 (VOLUME)
TABLE 311 COLUMBIA MEDICATION IN FIBROTIC DISEASE TREATMENT MARKET, BY TREATMENT, 2018-2032 (ASP)
TABLE 312 COLUMBIA FIBROTIC DISEASE TREATMENT MARKET, BY APPLICATION, 2018-2032 (USD THOUSAND)
TABLE 313 COLUMBIA FIBROTIC DISEASE TREATMENT MARKET, BY END USER, 2018-2032 (USD THOUSAND)
TABLE 314 COLUMBIA MEDICATION IN FIBROTIC DISEASE TREATMENT MARKET, BY DISTRIBUTION CHANNEL, 2018-2032 (USD THOUSAND)
TABLE 315 VENEZUELA FIBROTIC DISEASE TREATMENT MARKET, BY TREATMENT, 2018-2032 (USD THOUSAND)
TABLE 316 VENEZUELA MEDICATION IN FIBROTIC DISEASE TREATMENT MARKET, BY TREATMENT, 2018-2032 (USD THOUSAND)
TABLE 317 VENEZUELA MEDICATION IN FIBROTIC DISEASE TREATMENT MARKET, BY TREATMENT, 2018-2032 (VOLUME)
TABLE 318 VENEZUELA MEDICATION IN FIBROTIC DISEASE TREATMENT MARKET, BY TREATMENT, 2018-2032 (ASP)
TABLE 319 VENEZUELA FIBROTIC DISEASE TREATMENT MARKET, BY APPLICATION, 2018-2032 (USD THOUSAND)
TABLE 320 VENEZUELA FIBROTIC DISEASE TREATMENT MARKET, BY END USER, 2018-2032 (USD THOUSAND)
TABLE 321 VENEZUELA MEDICATION IN FIBROTIC DISEASE TREATMENT MARKET, BY DISTRIBUTION CHANNEL, 2018-2032 (USD THOUSAND)
TABLE 322 ARGENTINA FIBROTIC DISEASE TREATMENT MARKET, BY TREATMENT, 2018-2032 (USD THOUSAND)
TABLE 323 ARGENTINA MEDICATION IN FIBROTIC DISEASE TREATMENT MARKET, BY TREATMENT, 2018-2032 (USD THOUSAND)
TABLE 324 ARGENTINA MEDICATION IN FIBROTIC DISEASE TREATMENT MARKET, BY TREATMENT, 2018-2032 (VOLUME)
TABLE 325 ARGENTINA MEDICATION IN FIBROTIC DISEASE TREATMENT MARKET, BY TREATMENT, 2018-2032 (ASP)
TABLE 326 ARGENTINA FIBROTIC DISEASE TREATMENT MARKET, BY APPLICATION, 2018-2032 (USD THOUSAND)
TABLE 327 ARGENTINA FIBROTIC DISEASE TREATMENT MARKET, BY END USER, 2018-2032 (USD THOUSAND)
TABLE 328 ARGENTINA MEDICATION IN FIBROTIC DISEASE TREATMENT MARKET, BY DISTRIBUTION CHANNEL, 2018-2032 (USD THOUSAND)
TABLE 329 PERU FIBROTIC DISEASE TREATMENT MARKET, BY TREATMENT, 2018-2032 (USD THOUSAND)
TABELA 330 MEDICAMENTOS NO PERU NO MERCADO DE TRATAMENTO DE DOENÇAS FIBRÓTICAS, POR TRATAMENTO, 2018-2032 (MIL USD)
TABELA 331 MEDICAMENTOS NO PERU NO MERCADO DE TRATAMENTO DE DOENÇAS FIBRÓTICAS, POR TRATAMENTO, 2018-2032 (VOLUME)
TABELA 332 MEDICAMENTOS NO PERU NO MERCADO DE TRATAMENTO DE DOENÇAS FIBRÓTICAS, POR TRATAMENTO, 2018-2032 (ASP)
TABELA 333 MERCADO DE TRATAMENTO DE DOENÇAS FIBRÓTICAS NO PERU, POR APLICAÇÃO, 2018-2032 (MIL USD)
TABELA 334 MERCADO DE TRATAMENTO DE DOENÇAS FIBRÓTICAS NO PERU, POR USUÁRIO FINAL, 2018-2032 (MIL USD)
TABELA 335 MEDICAMENTOS NO PERU NO MERCADO DE TRATAMENTO DE DOENÇAS FIBRÓTICAS, POR CANAL DE DISTRIBUIÇÃO, 2018-2032 (MIL USD)
TABELA 336 MERCADO DE TRATAMENTO DE DOENÇA FIBRÓTICA DE CURAÇAO, POR TRATAMENTO, 2018-2032 (MIL USD)
TABELA 337 MEDICAMENTOS DE CURAÇAO NO MERCADO DE TRATAMENTO DE DOENÇAS FIBRÓTICAS, POR TRATAMENTO, 2018-2032 (MIL USD)
TABELA 338 MEDICAMENTOS DE CURAÇAO NO MERCADO DE TRATAMENTO DE DOENÇAS FIBRÓTICAS, POR TRATAMENTO, 2018-2032 (VOLUME)
TABELA 339 MEDICAMENTOS DE CURAÇAO NO MERCADO DE TRATAMENTO DE DOENÇAS FIBRÓTICAS, POR TRATAMENTO, 2018-2032 (ASP)
TABELA 340 MERCADO DE TRATAMENTO DE DOENÇAS FIBRÓTICAS DE CURAÇAO, POR APLICAÇÃO, 2018-2032 (MIL USD)
TABELA 341 MERCADO DE TRATAMENTO DE DOENÇAS FIBRÓTICAS DE CURAÇAO, POR USUÁRIO FINAL, 2018-2032 (MIL USD)
TABELA 342 MEDICAMENTOS DE CURAÇAO NO MERCADO DE TRATAMENTO DE DOENÇAS FIBRÓTICAS, POR CANAL DE DISTRIBUIÇÃO, 2018-2032 (MIL USD)
TABELA 343 MERCADO DE TRATAMENTO DE DOENÇA FIBRÓTICA DO PARAGUAI, POR TRATAMENTO, 2018-2032 (MIL USD)
TABELA 344 MEDICAMENTOS PARAGUAI NO MERCADO DE TRATAMENTO DE DOENÇAS FIBRÓTICAS, POR TRATAMENTO, 2018-2032 (MIL USD)
TABELA 345 MEDICAMENTOS PARAGUAI NO MERCADO DE TRATAMENTO DE DOENÇAS FIBRÓTICAS, POR TRATAMENTO, 2018-2032 (VOLUME)
TABELA 346 MEDICAMENTOS PARAGUAI NO MERCADO DE TRATAMENTO DE DOENÇAS FIBRÓTICAS, POR TRATAMENTO, 2018-2032 (ASP)
TABELA 347 MERCADO DE TRATAMENTO DE DOENÇAS FIBRÓTICAS DO PARAGUAI, POR APLICAÇÃO, 2018-2032 (MIL USD)
TABELA 348 MERCADO DE TRATAMENTO DE DOENÇA FIBRÓTICA DO PARAGUAI, POR USUÁRIO FINAL, 2018-2032 (MIL USD)
TABELA 349 MEDICAMENTOS PARAGUAI NO MERCADO DE TRATAMENTO DE DOENÇAS FIBRÓTICAS, POR CANAL DE DISTRIBUIÇÃO, 2018-2032 (MIL USD)
TABELA 350 MERCADO DE TRATAMENTO DE DOENÇA FIBRÓTICA DO URUGUAI, POR TRATAMENTO, 2018-2032 (MIL USD)
TABELA 351 MEDICAMENTOS NO URUGUAI NO MERCADO DE TRATAMENTO DE DOENÇAS FIBRÓTICAS, POR TRATAMENTO, 2018-2032 (MIL USD)
TABELA 352 MEDICAMENTOS NO URUGUAI NO MERCADO DE TRATAMENTO DE DOENÇAS FIBRÓTICAS, POR TRATAMENTO, 2018-2032 (VOLUME)
TABELA 353 MEDICAMENTOS NO URUGUAI NO MERCADO DE TRATAMENTO DE DOENÇAS FIBRÓTICAS, POR TRATAMENTO, 2018-2032 (ASP)
TABELA 354 MERCADO DE TRATAMENTO DE DOENÇAS FIBRÓTICAS DO URUGUAI, POR APLICAÇÃO, 2018-2032 (MIL USD)
TABELA 355 MERCADO DE TRATAMENTO DE DOENÇAS FIBRÓTICAS NO URUGUAI, POR USUÁRIO FINAL, 2018-2032 (MIL USD)
TABELA 356 MEDICAMENTOS NO URUGUAI NO MERCADO DE TRATAMENTO DE DOENÇAS FIBRÓTICAS, POR CANAL DE DISTRIBUIÇÃO, 2018-2032 (MIL USD)
TABELA 357 MERCADO DE TRATAMENTO DE DOENÇAS FIBRÓTICAS EM TRINIDAD E TOBAGO, POR TRATAMENTO, 2018-2032 (MIL USD)
TABELA 358 MEDICAMENTOS EM TRINIDAD E TOBAGO NO MERCADO DE TRATAMENTO DE DOENÇAS FIBRÓTICAS, POR TRATAMENTO, 2018-2032 (MIL USD)
TABELA 359 MEDICAMENTOS EM TRINIDAD E TOBAGO NO MERCADO DE TRATAMENTO DE DOENÇAS FIBRÓTICAS, POR TRATAMENTO, 2018-2032 (VOLUME)
TABELA 360 MEDICAMENTOS EM TRINIDAD E TOBAGO NO MERCADO DE TRATAMENTO DE DOENÇAS FIBRÓTICAS, POR TRATAMENTO, 2018-2032 (ASP)
TABELA 361 MERCADO DE TRATAMENTO DE DOENÇAS FIBRÓTICAS EM TRINIDAD E TOBAGO, POR APLICAÇÃO, 2018-2032 (MIL USD)
TABELA 362 MERCADO DE TRATAMENTO DE DOENÇAS FIBRÓTICAS EM TRINIDAD E TOBAGO, POR USUÁRIO FINAL, 2018-2032 (MIL USD)
TABELA 363 MEDICAMENTOS EM TRINIDAD E TOBAGO NO MERCADO DE TRATAMENTO DE DOENÇAS FIBRÓTICAS, POR CANAL DE DISTRIBUIÇÃO, 2018-2032 (MIL USD)
TABELA 364 MERCADO DE TRATAMENTO DE DOENÇAS FIBRÓTICAS NO RESTANTE DA AMÉRICA DO SUL, POR TRATAMENTO, 2018-2032 (MIL USD)
TABELA 365 MERCADO DE TRATAMENTO DE DOENÇAS FIBRÓTICAS NO ORIENTE MÉDIO E ÁFRICA, POR PAÍS, 2018-2032 (MIL USD)
TABELA 366 MERCADO DE TRATAMENTO DE DOENÇAS FIBRÓTICAS NO ORIENTE MÉDIO E ÁFRICA, POR TRATAMENTO, 2018-2032 (MIL USD)
TABELA 367 MEDICAMENTOS NO ORIENTE MÉDIO E ÁFRICA NO MERCADO DE TRATAMENTO DE DOENÇAS FIBRÓTICAS, POR TRATAMENTO, 2018-2032 (MIL USD)
TABELA 368 MEDICAMENTOS NO ORIENTE MÉDIO E ÁFRICA NO MERCADO DE TRATAMENTO DE DOENÇAS FIBRÓTICAS, POR TRATAMENTO, 2018-2032 (VOLUME)
TABELA 369 MEDICAMENTOS NO ORIENTE MÉDIO E ÁFRICA NO MERCADO DE TRATAMENTO DE DOENÇAS FIBRÓTICAS, POR TRATAMENTO, 2018-2032 (ASP)
TABELA 370 MERCADO DE TRATAMENTO DE DOENÇAS FIBRÓTICAS NO ORIENTE MÉDIO E ÁFRICA, POR APLICAÇÃO, 2018-2032 (MIL USD)
TABELA 371 MERCADO DE TRATAMENTO DE DOENÇAS FIBRÓTICAS NO ORIENTE MÉDIO E ÁFRICA, POR USUÁRIO FINAL, 2018-2032 (MIL USD)
TABELA 372 MEDICAMENTOS NO ORIENTE MÉDIO E ÁFRICA NO MERCADO DE TRATAMENTO DE DOENÇAS FIBRÓTICAS, POR CANAL DE DISTRIBUIÇÃO, 2018-2032 (MIL USD)
TABELA 373 MERCADO DE TRATAMENTO DE DOENÇAS FIBRÓTICAS NA ÁFRICA DO SUL, POR TRATAMENTO, 2018-2032 (MIL USD)
TABELA 374 MEDICAMENTOS NA ÁFRICA DO SUL NO MERCADO DE TRATAMENTO DE DOENÇAS FIBRÓTICAS, POR TRATAMENTO, 2018-2032 (MIL USD)
TABELA 375 MEDICAMENTOS NA ÁFRICA DO SUL NO MERCADO DE TRATAMENTO DE DOENÇAS FIBRÓTICAS, POR TRATAMENTO, 2018-2032 (VOLUME)
TABELA 376 MEDICAMENTOS NA ÁFRICA DO SUL NO MERCADO DE TRATAMENTO DE DOENÇAS FIBRÓTICAS, POR TRATAMENTO, 2018-2032 (ASP)
TABELA 377 MERCADO DE TRATAMENTO DE DOENÇAS FIBRÓTICAS NA ÁFRICA DO SUL, POR APLICAÇÃO, 2018-2032 (MIL USD)
TABELA 378 MERCADO DE TRATAMENTO DE DOENÇAS FIBRÓTICAS NA ÁFRICA DO SUL, POR USUÁRIO FINAL, 2018-2032 (MIL USD)
TABELA 379 MEDICAMENTOS NA ÁFRICA DO SUL NO MERCADO DE TRATAMENTO DE DOENÇAS FIBRÓTICAS, POR CANAL DE DISTRIBUIÇÃO, 2018-2032 (MIL USD)
TABELA 380 MERCADO DE TRATAMENTO DE DOENÇAS FIBRÓTICAS NA ARÁBIA SAUDITA, POR TRATAMENTO, 2018-2032 (MIL USD)
TABELA 381 MEDICAMENTOS DA ARÁBIA SAUDITA NO MERCADO DE TRATAMENTO DE DOENÇAS FIBRÓTICAS, POR TRATAMENTO, 2018-2032 (MIL USD)
TABELA 382 MEDICAMENTOS DA ARÁBIA SAUDITA NO MERCADO DE TRATAMENTO DE DOENÇAS FIBRÓTICAS, POR TRATAMENTO, 2018-2032 (VOLUME)
TABELA 383 MEDICAMENTOS DA ARÁBIA SAUDITA NO MERCADO DE TRATAMENTO DE DOENÇAS FIBRÓTICAS, POR TRATAMENTO, 2018-2032 (ASP)
TABELA 384 MERCADO DE TRATAMENTO DE DOENÇAS FIBRÓTICAS DA ARÁBIA SAUDITA, POR APLICAÇÃO, 2018-2032 (MIL USD)
TABELA 385 MERCADO DE TRATAMENTO DE DOENÇAS FIBRÓTICAS NA ARÁBIA SAUDITA, POR USUÁRIO FINAL, 2018-2032 (MIL USD)
TABELA 386 MEDICAMENTOS DA ARÁBIA SAUDITA NO MERCADO DE TRATAMENTO DE DOENÇAS FIBRÓTICAS, POR CANAL DE DISTRIBUIÇÃO, 2018-2032 (MIL USD)
TABELA 387 MERCADO DE TRATAMENTO DE DOENÇAS FIBRÓTICAS NOS EAU, POR TRATAMENTO, 2018-2032 (MIL USD)
TABELA 388 MEDICAMENTOS NOS EAU NO MERCADO DE TRATAMENTO DE DOENÇAS FIBRÓTICAS, POR TRATAMENTO, 2018-2032 (MIL USD)
TABELA 389 MEDICAMENTOS NOS EAU NO MERCADO DE TRATAMENTO DE DOENÇAS FIBRÓTICAS, POR TRATAMENTO, 2018-2032 (VOLUME)
TABELA 390 MEDICAMENTOS NOS EAU NO MERCADO DE TRATAMENTO DE DOENÇAS FIBRÓTICAS, POR TRATAMENTO, 2018-2032 (ASP)
TABELA 391 MERCADO DE TRATAMENTO DE DOENÇAS FIBRÓTICAS NOS EAU, POR APLICAÇÃO, 2018-2032 (MIL USD)
TABELA 392 MERCADO DE TRATAMENTO DE DOENÇAS FIBRÓTICAS NOS EAU, POR USUÁRIO FINAL, 2018-2032 (MIL USD)
TABELA 393 MEDICAMENTOS NOS EAU NO MERCADO DE TRATAMENTO DE DOENÇAS FIBRÓTICAS, POR CANAL DE DISTRIBUIÇÃO, 2018-2032 (MIL USD)
TABELA 394 MERCADO DE TRATAMENTO DE DOENÇAS FIBRÓTICAS NO EGITO, POR TRATAMENTO, 2018-2032 (MIL USD)
TABELA 395 MEDICAMENTOS NO EGITO NO MERCADO DE TRATAMENTO DE DOENÇAS FIBRÓTICAS, POR TRATAMENTO, 2018-2032 (MIL USD)
TABELA 396 MEDICAMENTOS NO EGITO NO MERCADO DE TRATAMENTO DE DOENÇAS FIBRÓTICAS, POR TRATAMENTO, 2018-2032 (VOLUME)
TABELA 397 EGITO MEDICAMENTOS NO MERCADO DE TRATAMENTO DE DOENÇAS FIBRÓTICAS, POR TRATAMENTO, 2018-2032 (ASP)
TABELA 398 MERCADO DE TRATAMENTO DE DOENÇAS FIBRÓTICAS NO EGITO, POR APLICAÇÃO, 2018-2032 (MIL USD)
TABELA 399 MERCADO DE TRATAMENTO DE DOENÇAS FIBRÓTICAS NO EGITO, POR USUÁRIO FINAL, 2018-2032 (MIL USD)
TABELA 400 MEDICAMENTOS NO EGITO NO MERCADO DE TRATAMENTO DE DOENÇAS FIBRÓTICAS, POR CANAL DE DISTRIBUIÇÃO, 2018-2032 (MIL USD)
TABELA 401 MERCADO DE TRATAMENTO DE DOENÇA FIBRÓTICA DO KUWAIT, POR TRATAMENTO, 2018-2032 (MIL USD)
TABELA 402 MEDICAMENTOS DO KUWAIT NO MERCADO DE TRATAMENTO DE DOENÇAS FIBRÓTICAS, POR TRATAMENTO, 2018-2032 (MIL USD)
TABELA 403 MEDICAMENTOS DO KUWAIT NO MERCADO DE TRATAMENTO DE DOENÇAS FIBRÓTICAS, POR TRATAMENTO, 2018-2032 (VOLUME)
TABELA 404 MEDICAMENTOS DO KUWAIT NO MERCADO DE TRATAMENTO DE DOENÇAS FIBRÓTICAS, POR TRATAMENTO, 2018-2032 (ASP)
TABELA 405 MERCADO DE TRATAMENTO DE DOENÇAS FIBRÓTICAS DO KUWAIT, POR APLICAÇÃO, 2018-2032 (MIL USD)
TABELA 406 MERCADO DE TRATAMENTO DE DOENÇAS FIBRÓTICAS DO KUWAIT, POR USUÁRIO FINAL, 2018-2032 (MIL USD)
TABELA 407 MEDICAMENTOS DO KUWAIT NO MERCADO DE TRATAMENTO DE DOENÇAS FIBRÓTICAS, POR CANAL DE DISTRIBUIÇÃO, 2018-2032 (MIL USD)
TABELA 408 MERCADO DE TRATAMENTO DE DOENÇAS FIBRÓTICAS EM ISRAEL, POR TRATAMENTO, 2018-2032 (MIL USD)
TABELA 409 MEDICAMENTOS DE ISRAEL NO MERCADO DE TRATAMENTO DE DOENÇAS FIBRÓTICAS, POR TRATAMENTO, 2018-2032 (MIL USD)
TABELA 410 MEDICAMENTOS DE ISRAEL NO MERCADO DE TRATAMENTO DE DOENÇAS FIBRÓTICAS, POR TRATAMENTO, 2018-2032 (VOLUME)
TABELA 411 MEDICAMENTOS DE ISRAEL NO MERCADO DE TRATAMENTO DE DOENÇAS FIBRÓTICAS, POR TRATAMENTO, 2018-2032 (ASP)
TABELA 412 MERCADO DE TRATAMENTO DE DOENÇAS FIBRÓTICAS EM ISRAEL, POR APLICAÇÃO, 2018-2032 (MIL USD)
TABELA 413 MERCADO DE TRATAMENTO DE DOENÇAS FIBRÓTICAS EM ISRAEL, POR USUÁRIO FINAL, 2018-2032 (MIL USD)
TABELA 414 MEDICAMENTOS DE ISRAEL NO MERCADO DE TRATAMENTO DE DOENÇAS FIBRÓTICAS, POR CANAL DE DISTRIBUIÇÃO, 2018-2032 (MIL USD)
TABELA 415 MERCADO DE TRATAMENTO DE DOENÇAS FIBRÓTICAS NO BAHREIN, POR TRATAMENTO, 2018-2032 (MIL USD)
TABELA 416 MEDICAMENTOS NO MERCADO DE TRATAMENTO DE DOENÇAS FIBRÓTICAS NO BAHREIN, POR TRATAMENTO, 2018-2032 (MIL USD)
TABELA 417 MEDICAMENTOS NO MERCADO DE TRATAMENTO DE DOENÇAS FIBRÓTICAS DO BAHREIN, POR TRATAMENTO, 2018-2032 (VOLUME)
TABLE 418 BAHRAIN MEDICATION IN FIBROTIC DISEASE TREATMENT MARKET, BY TREATMENT, 2018-2032 (ASP)
TABLE 419 BAHRAIN FIBROTIC DISEASE TREATMENT MARKET, BY APPLICATION, 2018-2032 (USD THOUSAND)
TABLE 420 BAHRAIN FIBROTIC DISEASE TREATMENT MARKET, BY END USER, 2018-2032 (USD THOUSAND)
TABLE 421 BAHRAIN MEDICATION IN FIBROTIC DISEASE TREATMENT MARKET, BY DISTRIBUTION CHANNEL, 2018-2032 (USD THOUSAND)
TABLE 422 REST OF MIDDLE EAST AND AFRICA FIBROTIC DISEASE TREATMENT MARKET, BY TREATMENT, 2018-2032 (USD THOUSAND)
Lista de Figura
FIGURE 1 GLOBAL FIBROTIC DISEASE TREATMENT MARKET: SEGMENTATION
FIGURE 2 GLOBAL FIBROTIC DISEASE TREATMENT MARKET: DATA TRIANGULATION
FIGURE 3 GLOBAL FIBROTIC DISEASE TREATMENT MARKET: DROC ANALYSIS
FIGURE 4 GLOBAL FIBROTIC DISEASE TREATMENT MARKET: GLOBAL VS REGIONAL MARKET ANALYSIS
FIGURE 5 GLOBAL FIBROTIC DISEASE TREATMENT MARKET: COMPANY RESEARCH ANALYSIS
FIGURE 6 GLOBAL FIBROTIC DISEASE TREATMENT MARKET: INTERVIEW DEMOGRAPHICS
FIGURE 7 GLOBAL FIBROTIC DISEASE TREATMENT MARKET: MARKET APPLICATION COVERAGE GRID
FIGURE 8 GLOBAL FIBROTIC DISEASE TREATMENT MARKET: DBMR MARKET POSITION GRID
FIGURE 9 GLOBAL FIBROTIC DISEASE TREATMENT MARKET: VENDOR SHARE ANALYSIS
FIGURE 10 GLOBAL FIBROTIC DISEASE TREATMENT MARKET: SEGMENTATION
FIGURE 11 EXECUTIVE SUMMARY
FIGURE 12 STRATEGIC DECISIONS
FIGURE 13 INCREASING PREVALENCE OF CHRONIC DISEASES IS DRIVING THE GROWTH OF THE GLOBAL FIBROTIC DISEASE TREATMENT MARKET FROM 2025 TO 2032
FIGURE 14 THE MEDICATION SEGMENT IS EXPECTED TO ACCOUNT FOR THE LARGEST SHARE OF THE GLOBAL FIBROTIC DISEASE TREATMENT MARKET IN 2025 AND 2032
FIGURE 15 NORTH AMERICA IS EXPECTED TO DOMINATE THE GLOBAL FIBROTIC DISEASE TREATMENT MARKET AND ASIA-PACIFIC IS EXPECTED TO GROW WITH THE HIGHEST CAGR IN THE FORECAST PERIOD OF 2025 TO 2032
FIGURE 16 ASIA-PACIFIC IS THE FASTEST-GROWING REGION FOR FIBROTIC DISEASE TREATMENT MARKET MANUFACTURERS IN THE FORECAST PERIOD OF 2025 TO 2032
FIGURE 17 MARKET OVERVIEW
FIGURE 18 GLOBAL FIBROTIC DISEASE TREATMENT MARKET: BY TREATMENT, 2024
FIGURE 19 GLOBAL FIBROTIC DISEASE TREATMENT MARKET: BY TREATMENT, 2025-2032 (USD THOUSAND)
FIGURE 20 GLOBAL FIBROTIC DISEASE TREATMENT MARKET: BY TREATMENT, CAGR (2025-2032)
FIGURE 21 GLOBAL FIBROTIC DISEASE TREATMENT MARKET: BY TREATMENT, LIFELINE CURVE
FIGURE 22 GLOBAL FIBROTIC DISEASE TREATMENT MARKET: BY APPLICATION, 2024
FIGURE 23 GLOBAL FIBROTIC DISEASE TREATMENT MARKET: BY APPLICATION, 2025-2032 (USD THOUSAND)
FIGURE 24 GLOBAL FIBROTIC DISEASE TREATMENT MARKET: BY APPLICATION, CAGR (2025-2032)
FIGURE 25 GLOBAL FIBROTIC DISEASE TREATMENT MARKET: BY APPLICATION, LIFELINE CURVE
FIGURE 26 GLOBAL FIBROTIC DISEASE TREATMENT MARKET: BY END USER, 2024
FIGURE 27 GLOBAL FIBROTIC DISEASE TREATMENT MARKET: BY END USER, 2025-2032 (USD THOUSAND)
FIGURE 28 GLOBAL FIBROTIC DISEASE TREATMENT MARKET: BY END USER, CAGR (2025-2032)
FIGURE 29 GLOBAL FIBROTIC DISEASE TREATMENT MARKET: BY END USER, LIFELINE CURVE
FIGURE 30 GLOBAL FIBROTIC DISEASE TREATMENT MARKET: SNAPSHOT (2024)
FIGURE 31 GLOBAL FIBROTIC DISEASE TREATMENT MARKET: COMPANY SHARE 2024 (%)
FIGURE 32 NORTH AMERICA FIBROTIC DISEASE TREATMENT MARKET: COMPANY SHARE 2024 (%)
FIGURE 33 EUROPE FIBROTIC DISEASE TREATMENT MARKET: COMPANY SHARE 2024 (%)
FIGURE 34 ASIA-PACIFIC FIBROTIC DISEASE TREATMENT MARKET: COMPANY SHARE 2024 (%)
Metodologia de Investigação
A recolha de dados e a análise do ano base são feitas através de módulos de recolha de dados com amostras grandes. A etapa inclui a obtenção de informações de mercado ou dados relacionados através de diversas fontes e estratégias. Inclui examinar e planear antecipadamente todos os dados adquiridos no passado. Da mesma forma, envolve o exame de inconsistências de informação observadas em diferentes fontes de informação. Os dados de mercado são analisados e estimados utilizando modelos estatísticos e coerentes de mercado. Além disso, a análise da quota de mercado e a análise das principais tendências são os principais fatores de sucesso no relatório de mercado. Para saber mais, solicite uma chamada de analista ou abra a sua consulta.
A principal metodologia de investigação utilizada pela equipa de investigação do DBMR é a triangulação de dados que envolve a mineração de dados, a análise do impacto das variáveis de dados no mercado e a validação primária (especialista do setor). Os modelos de dados incluem grelha de posicionamento de fornecedores, análise da linha de tempo do mercado, visão geral e guia de mercado, grelha de posicionamento da empresa, análise de patentes, análise de preços, análise da quota de mercado da empresa, normas de medição, análise global versus regional e de participação dos fornecedores. Para saber mais sobre a metodologia de investigação, faça uma consulta para falar com os nossos especialistas do setor.
Personalização disponível
A Data Bridge Market Research é líder em investigação formativa avançada. Orgulhamo-nos de servir os nossos clientes novos e existentes com dados e análises que correspondem e atendem aos seus objetivos. O relatório pode ser personalizado para incluir análise de tendências de preços de marcas-alvo, compreensão do mercado para países adicionais (solicite a lista de países), dados de resultados de ensaios clínicos, revisão de literatura, mercado remodelado e análise de base de produtos . A análise de mercado dos concorrentes-alvo pode ser analisada desde análises baseadas em tecnologia até estratégias de carteira de mercado. Podemos adicionar quantos concorrentes necessitar de dados no formato e estilo de dados que procura. A nossa equipa de analistas também pode fornecer dados em tabelas dinâmicas de ficheiros Excel em bruto (livro de factos) ou pode ajudá-lo a criar apresentações a partir dos conjuntos de dados disponíveis no relatório.

