Middle East And Africa Medical Carts Market
Tamanho do mercado em biliões de dólares
CAGR :
% 
 USD
156.00 Million
USD
570.66 Million
2025
2033
USD
156.00 Million
USD
570.66 Million
2025
2033
| 2026 –2033 | |
| USD 156.00 Million | |
| USD 570.66 Million | |
| % | |
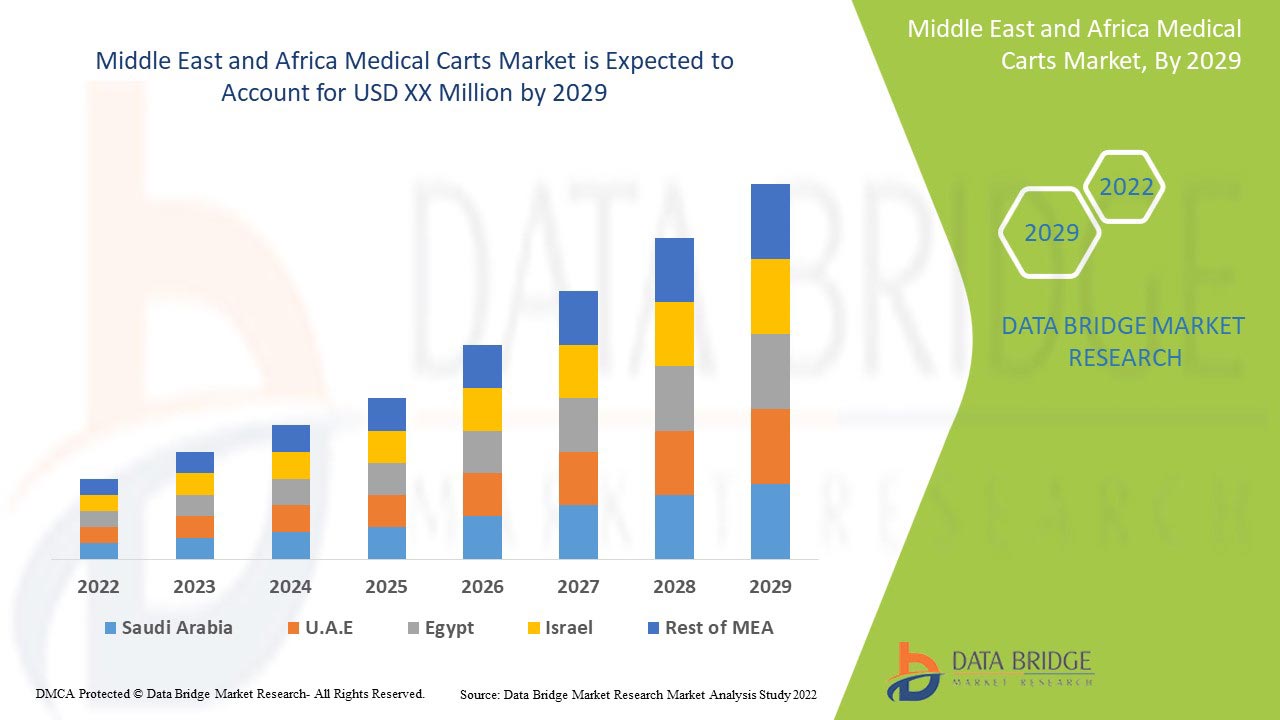
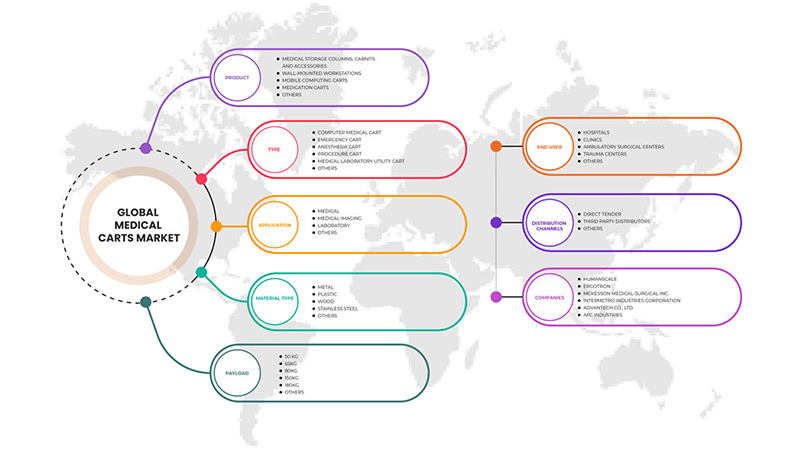
Middle East and Africa Medical Carts Market, By Product (Mobile Computing Carts, Medical Storage Columns, Cabinets and Accessories, Medication Carts, Wall-Mounted Workstations and Other), Type (Computer Medical Cart, Emergency Cart, Procedure Cart, Anesthesia Cart, Medical Laboratory Utility Cart, and Others), Application (Medical, Medical Imaging, Laboratory, and Others), Material Type (Plastic, Wood, Stainless Steel, Metal and Others), Payload (50 kg, 65 kg, 80 kg, 150 kg, 180 kg and Others), End User (Hospitals, Clinics, Ambulatory Surgical Centers, Trauma Centers, and Others), Distribution Channel (Direct Tender, Third Party Distributors and Others) – Industry Trends and Forecast to 2029.
Middle East and Africa Medical Carts Market Analysis and Insights
Middle East and Africa medical carts market is expected to grow due to improving healthcare facilities and infrastructures and adopting electronic medical records at the hospital, which can drive the market's growth. The other factors which are anticipated to propel the growth of the medical carts market include the rising cases of musculoskeletal injuries and surgeries.
The other factors, such as the lack of skilled professionals and the high cost of customized medical carts, hamper the growth of the Middle East and Africa medical carts market. On the other hand, the increased healthcare expenditure and emerging countries with developed hospitals act as an opportunity for the growth of the Middle East and Africa medical carts market.
Data Bridge Market Research analyzes that the Middle East and Africa medical carts market will grow at a CAGR of 5.6% during the forecast period of 2022 to 2029.
|
Report Metric |
Details |
|
Forecast Period |
2022 to 2029 |
|
Base Year |
2021 |
|
Historic Years |
2020 (Customizable to 2019-2014) |
|
Quantitative Units |
Revenue in USD Million, Volumes in Units, Pricing in USD |
|
Segments Covered |
By Product (Mobile Computing Carts, Medical Storage Columns, Cabinets and Accessories, Medication Carts, Wall-Mounted Workstations and Other), Type (Computer Medical Cart, Emergency Cart, Procedure Cart, Anesthesia Cart, Medical Laboratory Utility Cart, and Others), Application (Medical, Medical Imaging, Laboratory, and Others), Material Type (Plastic, Wood, Stainless Steel, Metal and Others), Payload (50 kg, 65 kg, 80 kg, 150 kg, 180 kg and Others), End User (Hospitals, Clinics, Ambulatory Surgical Centers, Trauma Centers, and Others), Distribution Channel (Direct Tender, Third Party Distributors and Others) |
|
Countries Covered |
South Africa, Saudi Arabia, U.A.E, Egypt, Israel and Rest of Middle East and Africa |
|
Market Players Covered |
ITD Gmbh, Omnicell Inc., Midmark Corporation, Herman Miller, Inc., and AMD Telemedicine, among others. |
Market Definition of Middle East and Africa Medical Carts Market
Medical carts are light weighted mobile carts that are used in the medical facility for various applications. They are widely used for storing and transporting medications, emergency equipment, and medical supplies. Medication carts are typically rectangular or square units with swivel caster wheels and specific compartments for holding numerous medical supplies. They are made to be convenient for nurses, doctors, and healthcare professionals to constantly administer patients' medication routine during their hospital stay. Their frame is mostly made of stainless steel or steel alloy. Crash carts are positioned throughout hospitals, enabling access at any time of emergency. Each cart drawer is properly labeled for healthcare personnel to find the equipment easily in a hurry. Some other medical carts include anesthesia carts, medical utility carts, procedure carts, and wall-mounted carts. Some medical carts, like portable ultrasound machine mobile carts, feature advanced technologies like a pneumatic lever for easy height adjustment. They are enabled with holders for ultrasound probes, clinical wipes, ultrasound gel dispensers, hygienic gloves dispenser, and come with a heavy-duty caster.
Middle East and Africa Medical Carts Market Dynamics
Drivers
- Improving healthcare facilities and infrastructure
Healthcare facilities, hospitals, clinics, outpatient care centers, specialized care centers, birthing centers, and psychiatric care centers are increasing in the Middle East and Africa due to rising cases of chronic diseases and infectious diseases with their requirement of hospital admissions and stays. The pandemic condition significantly increased the demand for medical carts, with Intensive Care Units (ICUs) for the treatment of patients. Many developing countries are taking various solutions and strategies to improve the healthcare facilities of their countries.
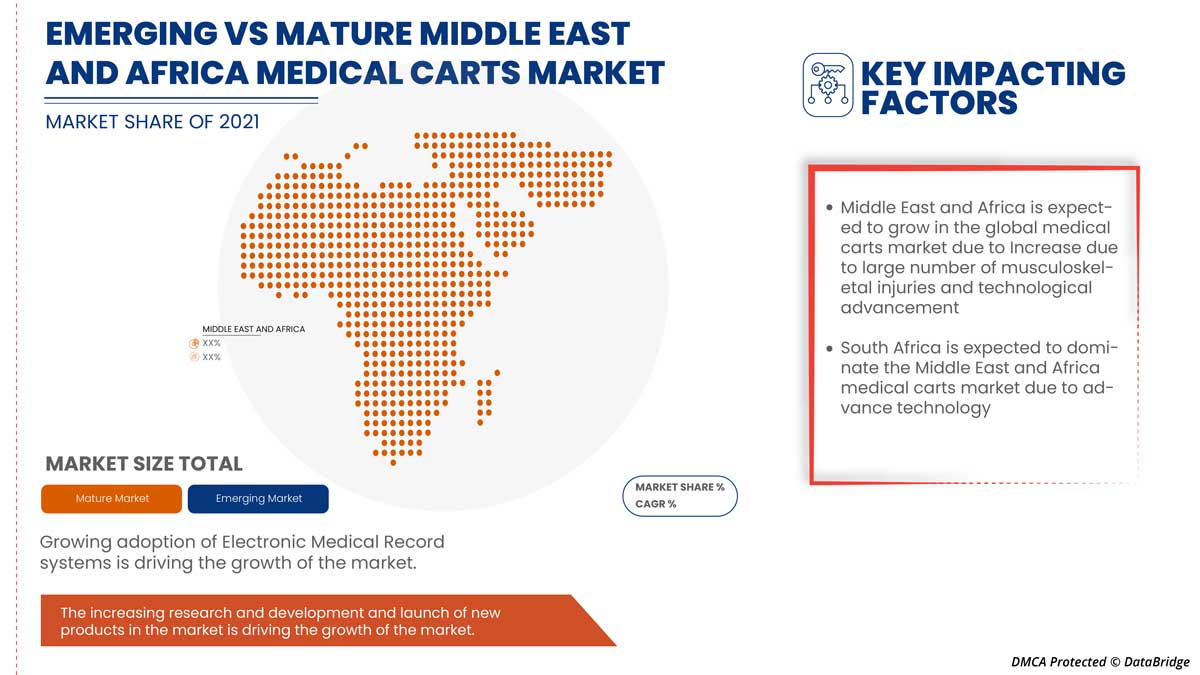
- Adoption of Electronic Medical RecordS (EMR) at hospitals
Many healthcare sectors are informed to mandatorily set EMRs in their hospitals or clinics to convert all medical charts into digital format, primarily incorporated in medical carts for easy access. Any hospital that doesn’t enable EMR will be considered to have data or record illegible and incomplete.
- Advanced medical carts application
The recently manufactured medical carts are incorporated with numerous IT solutions to enable easy medical storage and access. Most devices come with touch panels with slim designs for easy usage. They are lightweight with smooth wheels enabling easy mobility with significantly little pressure by nurses to prevent muscular pains. These touch panels can improve the quality of care and eliminate disastrous human consequences, which can cause an error in treatment dosage and supply. Many manufacturers are trying to innovate new advancements in their medical carts.
Opportunities
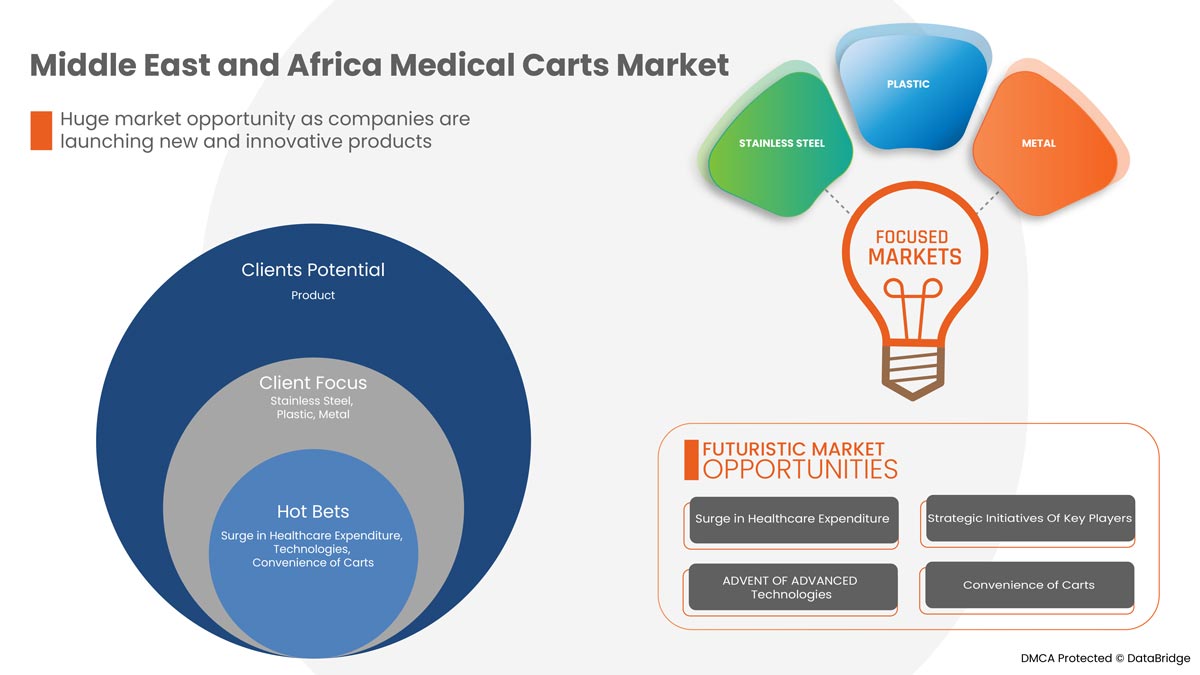
- surge in healthcare expenditure
The amount of money used by a country on its healthcare and its growth rate over time is inclined by a wide variety of economic and social factors, including the financing arrangements and structure of the health system organization. In particular, there is a strong association between the whole income level and how much the population of that country spends on health care.
Healthcare expenditure has increased across developed countries, and emerging economies as the disposable income of people are growing. Moreover, to accomplish the population requirements, the government bodies and healthcare organizations in different regions are taking the initiative by virtue of accelerating healthcare expenditure. The rise in healthcare expenditure helps healthcare organizations improve their facilities and equipment, including medical carts.
- Strategic initiatives by key market players
Strategic initiatives such as acquisition, partnership, contract agreement, and conference participation provide opportunities to flourish their customer base. Moreover, through such initiative strategies, both companies expand their reach through new geographic or industry markets, access to new products or services, or new types of customers. Both the market players open the door to additional or new resources such as technology and talent.
- Convenience of carts
The medical carts are helping the medical and surgical staff hustle-free with the convenient application. Many healthcare providers have shifted to medical carts with EMR systems to store medical data and maintain on-spot to have continuous vision over the treatment progress. These have helped healthcare providers eliminate the mountain of paper works of medical data. The burden has been reduced with one touch panel to store and access multiple data on EMR medical carts. In cases of emergency, these carts with EMR allow rapid search and visualization of records instantly.
- Emerging countries with developed hospitals
Developing countries such as India, China, and Argentina, among others, are improving the healthcare facilities in their countries. The rising cases of non-communicable chronic diseases, cardiac arrests, diabetes, and others demand high requirements for hospital facilities with rising hospital admission and treatments. The high disease rates in developing countries also enhance the opportunity for market players to distribute their products at a good pace. The root reason for their disease burden is the consequences of poverty, such as poor nutrition, air pollution, and unsanitary food habits and lifestyle. Hence, this rises the requirement for high facilitated hospitals in these developing countries.
Restraints/Challenges
- heavy workstation on wheels
Most medical carts used in hospitals or medical wards must be ergonomically designed to prevent weightage issues for any healthcare professional who uses them. Heavy workstation on wheels always takes a toll on nurses who push the cart.
- stringent regulatory framework
The use of medical carts with numerous specificity and advancements across hospitals is rapidly increasing, with the growth of the aged population and several carcinogenic diseases requiring long hospital stays and routine medical maintenance. At the same time, the players of the medical cart manufacturers in the market have to follow specific regulations to get approval from the upper authorities to launch the product in the market. These stringent guidelines need to be followed, and this is one of the most challenging tasks among all the steps. The pre-market approval of various medical devices varies from one country to another. The U.S. FDA regulates the medical carts in the U.S. The European Union (EU) holds in Europe. However, the rapid development of privacy policies and regulations are being made in Asia-Pacific, Europe, Middle East, and Africa, including India, Russia, China, South Korea, Singapore, Hong Kong, and Australia.
Post COVID-19 Impact on Middle East and Africa Medical Carts Market
COVID-19 created a major impact on the Middle East and Africa medical carts market. COVID-19 has not deleteriously affected the price and demand of medical carts products at a higher level because of progressive online sales and innovative delivery alternatives available with utmost safety concerns to major healthcare centers, hospitals, clinics, and ambulatory surgical centers. However, the growing chronic diseases, surgical cases, and hospital admissions have significantly grown medical cart usage in the Middle East and Africa. During and after the COVID-19, medical carts were in increased demand due to rising hospital requirements in various regions and advancements in research and development in medical equipment have rushed the market's growth in the Middle East and Africa. The demand for medical carts has risen in the past few years as medical carts are growing in hospitals, clinics, trauma centers, and ambulatory surgical centers. Hence, medical carts demand has always stayed high as many hospitals increased with the requirement for better equipment facilities. The COVID-19 pandemic outbreak positively impacted the market's growth owing to the high requirement for medical carts, especially in various hospitals, but the supply chain disruption has been challenging. However, many other medical carts used in surgeries and Emergency intensive care unit wards are made available for hospitals using innovative transportation and online sales. The current priority in most hospitals is given to COVID-19 treatments as the surge of COVID-19 cases is still persistent, which also increases the usage of medical carts for numerous medication supplies. Moreover, many international governments and healthcare organizations have supported the supply of these products due to their high priority in crucial cases.
Recent Developments
- In September 2021, Omnicell, Inc. announced that it had completed the previously announced acquisition of FDS Amplicare. The acquisition adds a comprehensive and complementary suite of SaaS financial management, analytics, and population health solutions to Omnicell’s EnlivenHealth division which impacts the market growth of the company
- In September 2020, Midmark Corp announced that it had acquired Schroer Manufacturing Company (“Shor-Line”), an animal health equipment manufacturer based in Kansas City, Kansas. The acquisition adds to Midmark’s portfolio and positions the company as a preferred design partner for animal care professionals
Middle East and Africa Medical Carts Market Scope
Middle East and Africa medical carts market is categorized into seven notable segments based on product, type, application, material type, payload, end user, and distribution channel. The growth amongst these segments will help to analyze market growth segments in the industries and provide the users with a valuable market overview and market insights to help them make strategic decisions for identifying core market applications.
Product
- Mobile Computing Carts
- Medical storage Columns
- Cabinets and Accessories
- Medication Carts
- Wall-Mounted Workstations
- Other
Based on product, the medical carts market is segmented into mobile computing carts, medical storage columns, cabinets and accessories, medication carts, wall-mounted workstations, and others.
Type
- Computer Medical Cart
- Emergency Cart
- Procedure Cart
- Anesthesia Cart
- Medical Laboratory Utility Cart
- Others
Based on type, the medical carts market is segmented into computer medical cart, emergency cart, procedure cart, anesthesia cart, medical laboratory utility carts, and others.
Application
- Medical
- Medical Imaging
- Laboratory
- Others
Based on application, the medical carts market is segmented into medical, medical imaging, laboratory, and others.
Material Type
- Plastic
- Wood
- Stainless Steel
- Metal
- Others
Based on material type, the medical carts market is segmented into plastic, wood, stainless steel, metal, and others.
Payload
- 50 kg
- 65 kg
- 80 kg
- 150 kg
- 180 kg
- Others
Based on payload, the medical carts market is segmented into 50 kg, 65 kg, 80 kg, 150 kg, 180 kg, and others.
End User
- Hospitals
- Clinics
- Ambulatory Surgical Centers
- Trauma Centers
- Others.
Based on end user, the medical carts market is segmented into hospitals, clinics, ambulatory surgical centers, trauma centers, and others.
Distribution Channel
- Direct Tender
- Third-Party Distributors
- Others
Based on the distribution channel, the medical carts market is segmented into direct tender, third party distributors, and others.
The Middle East and Africa Medical Carts Market Regional Analysis/Insights
Middle East and Africa medical carts market is analyzed. Market size insights and trends are based on product, type, application, material type, payload, end user, and distribution channel.
The countries covered in the Middle East and Africa medical carts market report are South Africa, Saudi Arabia, U.A.E, Egypt, Israel and Rest of Middle East and Africa.
South Africa dominates the Middle East and Africa medical carts market with a CAGR of around 7.4% in terms of market share and market revenue. It will continue to flourish its dominance during the forecast period. This is due to the rising cases of musculoskeletal injuries, surgeries, and the adoption electronic medical records at the hospital.
The country section of the report also provides individual market impacting factors and changes in market regulation that impact the current and future trends of the market. Data points such as down-stream and upstream value chain analysis, technical trends and porter's five forces analysis, case studies are some of the pointers used to forecast the market scenario for individual countries. Also, the presence and availability of brands and their challenges faced due to large or scarce competition from local and domestic brands, impact of domestic tariffs and trade routes are considered while providing forecast analysis of the country data.
Competitive Landscape and Middle East and Africa Medical Carts Market Share Analysis
Middle East and Africa medical carts market competitive landscape provides details about the competitor. Details included are company overview, company financials, revenue generated, market potential, investment in research and development, new market initiatives, Middle East and Africa presence, production sites and facilities, company strengths and weaknesses, product launch, regulatory guidelines, brand analysis, product approvals, product payload, application dominance, technology lifeline curve. The above data points provided are only related to the companies’ focus related to the Middle East and Africa medical carts market.
Some of the major players operating in the Middle East and Africa medical carts market are ITD Gmbh, Omnicell Inc., Midmark Corporation, Herman Miller, Inc., and AMD Telemedicine, among others.
SKU-
Obtenha acesso online ao relatório sobre a primeira nuvem de inteligência de mercado do mundo

- Painel interativo de análise de dados
- Painel de análise da empresa para oportunidades de elevado potencial de crescimento
- Acesso de analista de pesquisa para personalização e customização. consultas
- Análise da concorrência com painel interativo
- Últimas notícias, atualizações e atualizações Análise de tendências
- Aproveite o poder da análise de benchmark para um rastreio abrangente da concorrência
Índice
1 INTRODUÇÃO
1.1 OBJETIVOS DO ESTUDO
1.2 DEFINIÇÃO DE MERCADO
1.3 VISÃO GERAL DO MERCADO DE CARRINHOS MÉDICOS DO ORIENTE MÉDIO E ÁFRICA
1.4 LIMITAÇÕES
1,5 MERCADOS COBERTOS
2 MERCADO DE CARRINHOS MÉDICOS DO ORIENTE MÉDIO E ÁFRICA: SEGMENTAÇÃO
2.1 MERCADOS COBERTOS
2.2 ÂMBITO GEOGRÁFICO
2,3 ANOS CONSIDERADOS PARA O ESTUDO
2.4 MOEDA E PREÇOS
2.5 MODELO DE VALIDAÇÃO DE DADOS TRIPÉ DBMR
2.6 ENTREVISTAS PRINCIPAIS COM PRINCIPAIS LÍDERES DE OPINIÃO
2.7 MODELAGEM MULTIVARIADA
2.1 CURVA DE VIDA DO PRODUTO
2.2 GRADE DE POSIÇÃO DE MERCADO DBMR
2.3 ANÁLISE DA PARTICIPAÇÃO DO FORNECEDOR
2.4 GRADE DE COBERTURA DE APLICAÇÃO DE MERCADO
2.5 FONTES SECUNDÁRIAS
2.6 PREMISSAS
3 RESUMO EXECUTIVO
4 INSIGHTS PREMIUM
5 MERCADO DE CARRINHOS MÉDICOS DO ORIENTE MÉDIO E ÁFRICA: REGULAMENTOS
5.1 REGULAMENTAÇÃO NOS EUA
5.2 REGULAMENTOS NA EUROPA:
5.3 REGULAMENTOS NA CHINA:
5.4 REGULAMENTOS NO JAPÃO:
5.5 REGULAMENTAÇÃO NA ÍNDIA:
6 VISÃO GERAL DO MERCADO
6.1 MOTORISTAS
6.1.1 MELHORIA DAS INSTALAÇÕES E INFRAESTRUTURAS DE SAÚDE
6.1.2 ADOÇÃO DO PRONTUÁRIO MÉDICO ELETRÔNICO (PRM) EM HOSPITAIS
6.1.3 APLICAÇÃO DE CARRINHOS MÉDICOS AVANÇADOS
6.1.4 DURANTE A COVID-19, OS CARRINHOS MÉDICOS FORNECIDOS PELOS FORNECEDORES, AUMENTANDO O CRESCIMENTO DO MERCADO
6.2 RESTRIÇÕES
6.2.1 ALTO CUSTO DE CARRINHOS MÉDICOS PERSONALIZADOS
6.2.2 PROBLEMAS POTENCIAIS COM CARRINHOS OPERADOS POR BATERIA
6.2.3 FALTA DE PROFISSIONAIS QUALIFICADOS
6.3 OPORTUNIDADES
6.3.1 AUMENTO NAS DESPESAS COM SAÚDE
6.3.2 INICIATIVAS ESTRATÉGICAS DOS PRINCIPAIS ATORES DO MERCADO
6.3.3 CONVENIÊNCIA DOS CARRINHOS
6.3.4 PAÍSES EMERGENTES COM HOSPITAIS DESENVOLVIDOS
6.4 DESAFIOS
6.4.1 ESTAÇÃO DE TRABALHO PESADA SOBRE RODAS
6.4.2 QUADRO REGULAMENTAR RIGOROSO
7 MERCADO DE CARRINHOS MÉDICOS DO ORIENTE MÉDIO E ÁFRICA, POR PRODUTO
7.1 VISÃO GERAL
7.2 CARRINHOS DE COMPUTAÇÃO MÓVEL
7.2.1 POR APLICAÇÃO
7.2.1.1 ESTAÇÃO DE TRABALHO DE TELESSAÚDE
7.2.1.2 DOCUMENTAÇÃO
7.2.1.3 ENTREGA DE MEDICAMENTOS
7.2.1.4 EQUIPAMENTO
7.2.1.5 OUTROS
7.2.2 POR FONTE DE ENERGIA
7.2.2.1 NÃO ELÉTRICO
7.2.2.2 ALIMENTADO
7.2.3 POR TIPO DE EXIBIÇÃO
7.2.3.1 1 MONITOR
7.2.3.2 PORTÁTIL
7.2.3.3 TABLET
7.2.3.4 2 MONITORES
7.3 COLUNAS, ARMÁRIOS E ACESSÓRIOS PARA ARMAZENAMENTO MÉDICO
7.3.1 ARMÁRIOS DE ARMAZENAMENTO
7.3.2 ARMÁRIOS DE ABASTECIMENTO
7.3.3 ARMÁRIOS DE ESTERILIZAÇÃO
7.3.4 ARMÁRIOS DE SECAGEM
7.3.5 ARMÁRIOS DE TRANSFERÊNCIA
7.3.6 ARMÁRIOS DE DISPENSAÇÃO
7.3.7 OUTROS
7.4 CARRINHOS DE MEDICAMENTOS
7.4.1 CARRINHOS DE CARTÕES PERFURADOS
7.4.2 CARRINHOS DE CARTÕES PERFURADOS BOX-BIN
7.4.3 CARRINHOS DE CAIXA
7.4.4 CARRINHOS DE LIXEIRA
7.5 ESTAÇÕES DE TRABALHO MONTADAS NA PAREDE
7.5.1 SISTEMA COMBINADO SENTADO-DE PÉ
7.5.2 SISTEMA DE MONTAGEM NA PAREDE
7.5.3 OUTROS
7.6 OUTROS
8 MERCADO DE CARRINHOS MÉDICOS DO ORIENTE MÉDIO E ÁFRICA, POR TIPO
8.1 VISÃO GERAL
8.2 CARRINHO MÉDICO COMPUTADORIZADO
8.2.1 CARRINHO DE TELEMEDICINA
8.2.2 CARRINHO DE PC NO PONTO DE ATENDIMENTO
8.3 CARRINHO DE EMERGÊNCIA
8.4 CARRINHO DE ANESTESIA
8.5 CARRINHO DE PROCEDIMENTOS
8.6 CARRINHO DE UTILITÁRIOS DE LABORATÓRIO MÉDICO
8.7 OUTROS
9 MERCADO DE CARRINHOS MÉDICOS DO ORIENTE MÉDIO E ÁFRICA, POR APLICAÇÃO
9.1 VISÃO GERAL
9.2 MÉDICO
9.2.1 TELEMEDICINA
9.2.2 CIRURGIA
9.3 LABORATÓRIO
9.4 IMAGEM MÉDICA
9.5 OUTROS
10 MERCADOS DE CARRINHOS MÉDICOS NO ORIENTE MÉDIO E ÁFRICA, POR TIPO DE MATERIAL
10.1 VISÃO GERAL
10.2 PLÁSTICO
10.3 AÇO INOXIDÁVEL
10.4 METAL
10,5 MADEIRA
10.6 OUTROS
11 MERCADO DE CARRINHOS MÉDICOS DO ORIENTE MÉDIO E ÁFRICA, POR CARGA ÚTIL
11.1 VISÃO GERAL
11,2 80 KG
11,3 65 kg
11,4 50 KG
11,5 150 KG
11,6 180 kg
11.7 OUTROS
12 MERCADO DE CARRINHOS MÉDICOS DO ORIENTE MÉDIO E ÁFRICA, POR USUÁRIO FINAL
12.1 VISÃO GERAL
12.2 HOSPITAIS
12.2.1 HOSPITAIS DE CUIDADOS DE LONGA DURAÇÃO
12.2.2 HOSPITAIS DE CUIDADOS AGUDOS
12.2.3 INSTALAÇÕES DE ENFERMAGEM
12.2.4 CENTROS DE REABILITAÇÃO
12.3 CLÍNICAS
12.4 CENTROS CIRÚRGICOS AMBULATORIAIS
12.5 CENTROS DE TRAUMA
12.6 OUTROS
13 MERCADO DE CARRINHOS MÉDICOS DO ORIENTE MÉDIO E ÁFRICA, POR CANAL DE DISTRIBUIÇÃO
13.1 VISÃO GERAL
13.2 DISTRIBUIDORES TERCEIRIZADOS
13.3 LICITAÇÃO DIRETA
13.4 OUTROS
14 MERCADO DE CARRINHOS MÉDICOS NO ORIENTE MÉDIO E ÁFRICA, POR REGIÃO
14.1 ORIENTE MÉDIO E ÁFRICA
14.1.1 ÁFRICA DO SUL
14.1.2 ARÁBIA SAUDITA
14.1.3 Emirados Árabes Unidos
14.1.4 EGITO
14.1.5 ISRAEL
14.1.6 RESTANTE DO ORIENTE MÉDIO E ÁFRICA
15 MERCADO DE CARRINHOS MÉDICOS NO ORIENTE MÉDIO E ÁFRICA: CENÁRIO DA EMPRESA
15.1 ANÁLISE DE AÇÕES DA EMPRESA: ORIENTE MÉDIO E ÁFRICA
16 ANÁLISE SWOT
17 PERFIL DA EMPRESA
17.1 ESCALA HUMANA
17.1.1 RESUMO DA EMPRESA
17.1.2 ANÁLISE DAS AÇÕES DA EMPRESA
17.1.3 PORTFÓLIO DE PRODUTOS
17.1.4 DESENVOLVIMENTOS RECENTES
17.1.5 PARCERIA
17.1.6 AQUISIÇÃO
17.2 MCKESSON MÉDICO-CIRÚRGICO INC.
17.2.1 RESUMO DA EMPRESA
17.2.2 ANÁLISE DAS AÇÕES DA EMPRESA
17.2.3 PORTFÓLIO DE PRODUTOS
17.2.4 DESENVOLVIMENTO RECENTE
17.3 ERGOTRON, INC.
17.3.1 RESUMO DA EMPRESA
17.3.2 ANÁLISE DAS AÇÕES DA EMPRESA
17.3.3 PORTFÓLIO DE PRODUTOS
17.3.4 DESENVOLVIMENTOS RECENTES
17.3.4.1 PORTFÓLIO DE PRODUTOS
17.3.5 PARCERIA
17.3.5.1 PORTFÓLIO DE PRODUTOS
17.4 HERMAN MILLER, INC.
17.4.1 RESUMO DA EMPRESA
17.4.2 ANÁLISE DE RECEITA
17.4.3 ANÁLISE DAS AÇÕES DA EMPRESA
17.4.4 PORTFÓLIO DE PRODUTOS
17.4.5 DESENVOLVIMENTO RECENTE
17.5 CORPORAÇÃO DAS INDÚSTRIAS INTERMETRO
17.5.1 RESUMO DA EMPRESA
17.5.2 ANÁLISE DE AÇÕES DA EMPRESA
17.5.3 PORTFÓLIO DE PRODUTOS
17.5.4 DESENVOLVIMENTO RECENTE
17.6 ADVANTECH CO., LTD.
17.6.1 RESUMO DA EMPRESA
17.6.2 ANÁLISE DE RECEITA
17.6.3 PORTFÓLIO DE PRODUTOS
17.6.4 DESENVOLVIMENTO RECENTE
17.7 INDÚSTRIAS AFC
17.7.1 RESUMO DA EMPRESA
17.7.2 PORTFÓLIO DE PRODUTOS
17.7.3 DESENVOLVIMENTOS RECENTES
17.7.3.1 AQUISIÇÃO
17.8 AMD TELEMEDICINA ORIENTE MÉDIO E ÁFRICA
17.8.1 RESUMO DA EMPRESA
17.8.2 PORTFÓLIO DE PRODUTOS
17.8.3 DESENVOLVIMENTO RECENTE
17.8.3.1 PARCERIA
17.9 ALTUS, INC.
17.9.1 RESUMO DA EMPRESA
17.9.2 PORTFÓLIO DE PRODUTOS
17.9.3 DESENVOLVIMENTOS RECENTES
17.9.3.1 EXPANSÃO
17.9.3.2 PARCERIA
17.9.3.3 PORTFÓLIO DE PRODUTOS
17.1 BAILIDA MÉDICA.
17.10.1 RESUMO DA EMPRESA
17.10.2 PORTFÓLIO DE PRODUTOS
17.10.3 DESENVOLVIMENTOS RECENTES
17.11 GRUPO BERGMANN
17.11.1 RESUMO DA EMPRESA
17.11.2 PORTFÓLIO DE PRODUTOS
17.11.3 DESENVOLVIMENTO RECENTE
17.12 BIHEALTHCARE (ZHANGJIAGANG BRAUN INDUSTRY CO., LTD.)
17.12.1 RESUMO DA EMPRESA
17.12.2 PORTFÓLIO DE PRODUTOS
17.12.3 DESENVOLVIMENTO RECENTE
17.12.3.1 O SITE DA EMPRESA NÃO POSSUI NENHUM DESENVOLVIMENTO RECENTE RELACIONADO AO MERCADO
17.13 BYTEC SAÚDE LTDA.
17.13.1 RESUMO DA EMPRESA
17.13.2 PORTFÓLIO DE PRODUTOS
17.13.3 DESENVOLVIMENTO RECENTE
17.14 CAPSA SAÚDE
17.14.1 RESUMO DA EMPRESA
17.14.2 PORTFÓLIO DE PRODUTOS
17.14.3 DESENVOLVIMENTOS RECENTES
17.14.3.1 AQUISIÇÃO
17.15 CHANG GUNG TECNOLOGIA MÉDICA CO., LTD.
17.15.1 RESUMO DA EMPRESA
17.15.2 PORTFÓLIO DE PRODUTOS
17.15.3 DESENVOLVIMENTO RECENTE
17.16 ENOVATE MÉDICO.
17.16.1 RESUMO DA EMPRESA
17.16.2 PORTFÓLIO DE PRODUTOS
17.16.3 DESENVOLVIMENTO RECENTE
17.16.3.1 LANÇAMENTO DO PRODUTO
17.17 HARLOFF MANUFACTURING COMPANY
17.17.1 RESUMO DA EMPRESA
17.17.2 PORTFÓLIO DE PRODUTOS
17.17.3 DESENVOLVIMENTO RECENTE
17.18 TECNOLOGIA DE ALTA VIDA
17.18.1 RESUMO DA EMPRESA
17.18.2 PORTFÓLIO DE PRODUTOS
17.18.3 DESENVOLVIMENTO RECENTE
17.19 HUA SHUO PLÁSTICO CO., LTD.
17.19.1 RESUMO DA EMPRESA
17.19.2 PORTFÓLIO DE PRODUTOS
17.19.3 DESENVOLVIMENTO RECENTE
17.2 ITD GMBH
17.20.1 RESUMO DA EMPRESA
17.20.2 PORTFÓLIO DE PRODUTOS
17.20.3 DESENVOLVIMENTO RECENTE
17.20.3.1 AQUISIÇÃO
17.20.3.2 MODIFICAÇÃO
17.21 JACO INC.
17.21.1 RESUMO DA EMPRESA
17.21.2 PORTFÓLIO DE PRODUTOS
17.21.3 DESENVOLVIMENTOS RECENTES
17.21.3.1 LANÇAMENTO DO PRODUTO
17.22 JEGNA (XIAMEN) INFO&TECH CO., LTD
17.22.1 RESUMO DA EMPRESA
17.22.2 PORTFÓLIO DE PRODUTOS
17.22.3 DESENVOLVIMENTO RECENTE
17.23 JOSON-CARE ENTERPRISE CO., LTD.
17.23.1 RESUMO DA EMPRESA
17.23.2 PORTFÓLIO DE PRODUTOS
17.23.3 DESENVOLVIMENTOS RECENTES
17.24 MEDICAL MASTER CO., LTD.
17.24.1 RESUMO DA EMPRESA
17.24.2 PORTFÓLIO DE PRODUTOS
17.24.3 DESENVOLVIMENTO RECENTE
17.25 CORPORAÇÃO MIDMARK
17.25.1 RESUMO DA EMPRESA
17.25.2 PORTFÓLIO DE PRODUTOS
17.25.3 DESENVOLVIMENTO RECENTE
17.25.3.1 AQUISIÇÃO
17.26 OMNICELL INC.
17.26.1 RESUMO DA EMPRESA
17.26.2 ANÁLISE DE RECEITA
17.26.3 PORTFÓLIO DE PRODUTOS
17.26.4 DESENVOLVIMENTOS RECENTES
17.27 PRODUTOS PEDIGO
17.27.1 RESUMO DA EMPRESA
17.27.2 PORTFÓLIO DE PRODUTOS
17.27.3 DESENVOLVIMENTO RECENTE
17.28 DESEMPENHO SAÚDE
17.28.1 RESUMO DA EMPRESA
17.28.2 PORTFÓLIO DE PRODUTOS
17.28.3 DESENVOLVIMENTO RECENTE
17.29 VILLARD
17.29.1 RESUMO DA EMPRESA
17.29.2 PORTFÓLIO DE PRODUTOS
17.29.3 DESENVOLVIMENTO RECENTE
17.3 ZHANGJIAGANG BESTRAN TECNOLOGIA CO., LTDA.
17.30.1 RESUMO DA EMPRESA
17.30.2 PORTFÓLIO DE PRODUTOS
17.30.3 DESENVOLVIMENTO RECENTE
18 QUESTIONÁRIO
19 RELATÓRIOS RELACIONADOS
Lista de Tabela
TABELA 1 MERCADO DE CARRINHOS MÉDICOS NO ORIENTE MÉDIO E ÁFRICA, POR PRODUTO, 2020-2029 (US$ MILHÕES)
TABELA 2 MERCADO DE CARRINHOS MÉDICOS NO ORIENTE MÉDIO E ÁFRICA, POR PRODUTO, 2020-2029 (UNIDADES)
TABELA 3 CARRINHOS DE COMPUTAÇÃO MÓVEL NO ORIENTE MÉDIO E ÁFRICA NO MERCADO DE CARRINHOS MÉDICOS, POR REGIÃO, 2020-2029 (US$ MILHÕES)
TABELA 4 CARRINHOS DE COMPUTAÇÃO MÓVEL NO ORIENTE MÉDIO E ÁFRICA NO MERCADO DE CARRINHOS MÉDICOS, POR APLICAÇÃO, 2020-2029 (US$ MILHÕES)
TABELA 5 CARRINHOS DE COMPUTAÇÃO MÓVEL NO ORIENTE MÉDIO E ÁFRICA NO MERCADO DE CARRINHOS MÉDICOS, POR APLICAÇÃO, 2020-2029 (UNIDADES)
TABELA 6 CARRINHOS DE COMPUTAÇÃO MÓVEL DO ORIENTE MÉDIO E ÁFRICA NO MERCADO DE CARRINHOS MÉDICOS, POR FONTE DE ENERGIA, 2020-2029 (US$ MILHÕES)
TABELA 7 CARRINHOS DE COMPUTAÇÃO MÓVEL NO ORIENTE MÉDIO E ÁFRICA NO MERCADO DE CARRINHOS MÉDICOS, POR FONTE DE ENERGIA, 2020-2029 (UNIDADES)
TABELA 8 CARRINHOS DE COMPUTAÇÃO MÓVEL NO ORIENTE MÉDIO E ÁFRICA NO MERCADO DE CARRINHOS MÉDICOS, POR TIPO DE EXIBIÇÃO, 2020-2029 (US$ MILHÕES)
TABELA 9 CARRINHOS DE COMPUTAÇÃO MÓVEL NO ORIENTE MÉDIO E ÁFRICA NO MERCADO DE CARRINHOS MÉDICOS, POR TIPO DE EXIBIÇÃO, 2020-2029 (UNIDADES)
TABELA 10 COLUNAS, ARMÁRIOS E ACESSÓRIOS PARA ARMAZENAMENTO MÉDICO NO MERCADO DE CARRINHOS MÉDICOS DO ORIENTE MÉDIO E ÁFRICA, POR REGIÃO, 2020-2029 (US$ MILHÕES)
TABELA 11 COLUNAS, ARMÁRIOS E ACESSÓRIOS PARA ARMAZENAMENTO MÉDICO NO MERCADO DE CARRINHOS MÉDICOS NO ORIENTE MÉDIO E ÁFRICA, POR PRODUTO, 2020-2029 (US$ MILHÕES)
TABELA 12 COLUNAS, ARMÁRIOS E ACESSÓRIOS PARA ARMAZENAMENTO MÉDICO NO MERCADO DE CARRINHOS MÉDICOS NO ORIENTE MÉDIO E ÁFRICA, POR PRODUTO, 2020-2029 (UNIDADES)
TABELA 13 CARRINHOS DE MEDICAMENTOS NO ORIENTE MÉDIO E ÁFRICA NO MERCADO DE CARRINHOS MÉDICOS, POR REGIÃO, 2020-2029 (US$ MILHÕES)
TABELA 14 CARRINHOS DE MEDICAMENTOS NO ORIENTE MÉDIO E ÁFRICA NO MERCADO DE CARRINHOS MÉDICOS, POR PRODUTO, 2020-2029 (US$ MILHÕES)
TABELA 15 CARRINHOS DE MEDICAMENTOS NO ORIENTE MÉDIO E ÁFRICA NO MERCADO DE CARRINHOS MÉDICOS, POR PRODUTO, 2020-2029 (UNIDADES)
TABELA 16 ESTAÇÕES DE TRABALHO DE PAREDE NO ORIENTE MÉDIO E ÁFRICA NO MERCADO DE CARRINHOS MÉDICOS, POR REGIÃO, 2020-2029 (US$ MILHÕES)
TABELA 17 ESTAÇÕES DE TRABALHO MONTADAS NA PAREDE NO ORIENTE MÉDIO E ÁFRICA NO MERCADO DE CARRINHOS MÉDICOS, POR PRODUTO, 2020-2029 (US$ MILHÕES)
TABELA 18 ESTAÇÕES DE TRABALHO MONTADAS NA PAREDE NO ORIENTE MÉDIO E ÁFRICA NO MERCADO DE CARRINHOS MÉDICOS, POR PRODUTO, 2020-2029 (UNIDADES)
TABELA 19 ORIENTE MÉDIO E ÁFRICA OUTROS NO MERCADO DE CARRINHOS MÉDICOS, POR REGIÃO, 2020-2029 (US$ MILHÕES)
TABELA 20 MERCADO DE CARRINHOS MÉDICOS NO ORIENTE MÉDIO E ÁFRICA, POR TIPO, 2020-2029 (US$ MILHÕES)
TABELA 21 MERCADO DE CARRINHOS MÉDICOS NO ORIENTE MÉDIO E ÁFRICA, POR TIPO, 2020-2029 (UNIDADES)
TABELA 22 CARRINHOS MÉDICOS COMPUTADORIZADOS NO MERCADO DE CARRINHOS MÉDICOS DO ORIENTE MÉDIO E ÁFRICA, POR REGIÃO, 2020-2029 (US$ MILHÕES)
TABELA 23 CARRINHOS MÉDICOS COMPUTADORIZADOS NO MERCADO DE CARRINHOS MÉDICOS DO ORIENTE MÉDIO E ÁFRICA, POR TIPO, 2020-2029 (US$ MILHÕES)
TABELA 24 CARRINHOS MÉDICOS COMPUTADORIZADOS NO MERCADO DE CARRINHOS MÉDICOS DO ORIENTE MÉDIO E ÁFRICA, POR TIPO, 2020-2029 (UNIDADES)
TABELA 25 CARRINHOS DE EMERGÊNCIA NO MERCADO DE CARRINHOS MÉDICOS DO ORIENTE MÉDIO E ÁFRICA, POR REGIÃO, 2020-2029 (US$ MILHÕES)
TABELA 26 CARRINHOS DE ANESTESIA NO MERCADO DE CARRINHOS MÉDICOS DO ORIENTE MÉDIO E ÁFRICA, POR REGIÃO, 2020-2029 (US$ MILHÕES)
TABELA 27 CARRINHO DE PROCEDIMENTO NO MERCADO DE CARRINHOS MÉDICOS DO ORIENTE MÉDIO E ÁFRICA, POR REGIÃO, 2020-2029 (US$ MILHÕES)
TABELA 28 CARRINHO UTILITÁRIO PARA LABORATÓRIO MÉDICO NO MERCADO DE CARRINHOS MÉDICOS NO ORIENTE MÉDIO E ÁFRICA, POR REGIÃO, 2020-2029 (US$ MILHÕES)
TABELA 29 ORIENTE MÉDIO E ÁFRICA OUTROS NO MERCADO DE CARRINHOS MÉDICOS, POR REGIÃO, 2020-2029 (US$ MILHÕES)
TABELA 30 MERCADO DE CARRINHOS MÉDICOS NO ORIENTE MÉDIO E ÁFRICA, POR APLICAÇÃO, 2020-2029 (US$ MILHÕES)
TABELA 31 MERCADO DE CARRINHOS MÉDICOS NO ORIENTE MÉDIO E ÁFRICA, POR REGIÃO, 2020-2029 (US$ MILHÕES)
TABELA 32 MERCADO DE CARRINHOS MÉDICOS NO ORIENTE MÉDIO E ÁFRICA, POR APLICAÇÃO, 2020-2029 (US$ MILHÕES)
TABELA 33 MERCADO DE CARRINHOS MÉDICOS DE LABORATÓRIO NO ORIENTE MÉDIO E ÁFRICA, POR REGIÃO, 2020-2029 (US$ MILHÕES)
TABELA 34 MERCADO DE IMAGEM MÉDICA NO ORIENTE MÉDIO E ÁFRICA, POR REGIÃO, 2020-2029 (US$ MILHÕES)
TABELA 35 ORIENTE MÉDIO E ÁFRICA OUTROS NO MERCADO DE CARRINHOS MÉDICOS, POR REGIÃO, 2020-2029 (US$ MILHÕES)
TABELA 36 MERCADO DE CARRINHOS MÉDICOS NO ORIENTE MÉDIO E ÁFRICA, POR TIPO DE MATERIAL, 2020-2029 (US$ MILHÕES)
TABELA 37 MERCADO DE CARRINHOS MÉDICOS NO ORIENTE MÉDIO E ÁFRICA, POR TIPO DE MATERIAL, 2020-2029 (UNIDADES)
TABELA 38 MERCADO DE PLÁSTICO EM CARRINHOS MÉDICOS NO ORIENTE MÉDIO E ÁFRICA, POR REGIÃO, 2020-2029 (US$ MILHÕES)
TABELA 39 MERCADO DE CARRINHOS MÉDICOS DE AÇO INOXIDÁVEL NO ORIENTE MÉDIO E ÁFRICA, POR REGIÃO, 2020-2029 (US$ MILHÕES)
TABELA 40 METAL NO MERCADO DE CARRINHOS MÉDICOS DO ORIENTE MÉDIO E ÁFRICA, POR REGIÃO, 2020-2029 (US$ MILHÕES)
TABELA 41 MERCADO DE MADEIRA NO ORIENTE MÉDIO E ÁFRICA PARA CARRINHOS MÉDICOS, POR REGIÃO, 2020-2029 (US$ MILHÕES)
TABELA 42 ORIENTE MÉDIO E ÁFRICA OUTROS NO MERCADO DE CARRINHOS MÉDICOS, POR REGIÃO, 2020-2029 (US$ MILHÕES)
TABELA 43 MERCADO DE CARRINHOS MÉDICOS NO ORIENTE MÉDIO E ÁFRICA, POR CARGA ÚTIL, 2020-2029 (US$ MILHÕES)
TABELA 44 ORIENTE MÉDIO E ÁFRICA 80 KG NO MERCADO DE CARRINHOS MÉDICOS, POR REGIÃO, 2020-2029 (US$ MILHÕES)
TABELA 45 ORIENTE MÉDIO E ÁFRICA 65 KG NO MERCADO DE CARRINHOS MÉDICOS, POR REGIÃO, 2020-2029 (US$ MILHÕES)
TABELA 46 ORIENTE MÉDIO E ÁFRICA MERCADO DE CARRINHOS MÉDICOS DE 50 KG, POR REGIÃO, 2020-2029 (US$ MILHÕES)
TABELA 47 ORIENTE MÉDIO E ÁFRICA 150 KG NO MERCADO DE CARRINHOS MÉDICOS, POR REGIÃO, 2020-2029 (US$ MILHÕES)
TABELA 48 ORIENTE MÉDIO E ÁFRICA 180 KG NO MERCADO DE CARRINHOS MÉDICOS, POR REGIÃO, 2020-2029 (US$ MILHÕES)
TABELA 49 ORIENTE MÉDIO E ÁFRICA OUTROS NO MERCADO DE CARRINHOS MÉDICOS, POR REGIÃO, 2020-2029 (US$ MILHÕES)
TABELA 50 MERCADO DE CARRINHOS MÉDICOS NO ORIENTE MÉDIO E ÁFRICA, POR USUÁRIO FINAL, 2020-2029 (US$ MILHÕES)
TABELA 51 HOSPITAIS DO ORIENTE MÉDIO E ÁFRICA NO MERCADO DE CARRINHOS MÉDICOS, POR REGIÃO, 2020-2029 (US$ MILHÕES)
TABELA 52 HOSPITAIS DO ORIENTE MÉDIO E ÁFRICA NO MERCADO DE CARRINHOS MÉDICOS, POR USUÁRIO FINAL, 2020-2029 (US$ MILHÕES)
TABELA 53 CLÍNICAS DO ORIENTE MÉDIO E ÁFRICA NO MERCADO DE CARRINHOS MÉDICOS, POR REGIÃO, 2020-2029 (US$ MILHÕES)
TABELA 54 CENTROS CIRÚRGICOS AMBULATORIAIS DO ORIENTE MÉDIO E ÁFRICA NO MERCADO DE CARRINHOS MÉDICOS, POR REGIÃO, 2020-2029 (US$ MILHÕES)
TABELA 55 CENTROS DE TRAUMA DO ORIENTE MÉDIO E ÁFRICA NO MERCADO DE CARRINHOS MÉDICOS, POR REGIÃO, 2020-2029 (US$ MILHÕES)
TABELA 56 ORIENTE MÉDIO E ÁFRICA OUTROS NO MERCADO DE CARRINHOS MÉDICOS, POR REGIÃO, 2020-2029 (US$ MILHÕES)
TABELA 57 MERCADO DE CARRINHOS MÉDICOS NO ORIENTE MÉDIO E ÁFRICA, POR CANAL DE DISTRIBUIÇÃO, 2020-2029 (US$ MILHÕES)
TABELA 58 DISTRIBUIDORES TERCEIRIZADOS NO ORIENTE MÉDIO E ÁFRICA NO MERCADO DE CARRINHOS MÉDICOS, POR REGIÃO, 2020-2029 (US$ MILHÕES)
TABELA 59 ORIENTE MÉDIO E ÁFRICA LICITAÇÃO DIRETA NO MERCADO DE CARRINHOS MÉDICOS, POR REGIÃO, 2020-2029 (US$ MILHÕES)
TABELA 60 ORIENTE MÉDIO E ÁFRICA OUTROS NO MERCADO DE CARRINHOS MÉDICOS, POR REGIÃO, 2020-2029 (US$ MILHÕES)
TABELA 61 MERCADO DE CARRINHOS MÉDICOS NO ORIENTE MÉDIO E ÁFRICA, POR PAÍS, 2020-2029 (US$ MILHÕES)
TABELA 62 MERCADO DE CARRINHOS MÉDICOS NO ORIENTE MÉDIO E ÁFRICA, POR PRODUTO, 2020-2029 (US$ MILHÕES)
TABELA 63 MERCADO DE CARRINHOS MÉDICOS NO ORIENTE MÉDIO E ÁFRICA, POR PRODUTO, 2020-2029 (UNIDADES)
TABELA 64 CARRINHOS DE COMPUTAÇÃO MÓVEL NO ORIENTE MÉDIO E ÁFRICA NO MERCADO DE CARRINHOS MÉDICOS, POR APLICAÇÃO, 2020-2029 (US$ MILHÕES)
TABELA 65 CARRINHOS DE COMPUTAÇÃO MÓVEL NO ORIENTE MÉDIO E ÁFRICA NO MERCADO DE CARRINHOS MÉDICOS, POR APLICAÇÃO, 2020-2029 (UNIDADES)
TABELA 66 CARRINHOS DE COMPUTAÇÃO MÓVEL DO ORIENTE MÉDIO E ÁFRICA NO MERCADO DE CARRINHOS MÉDICOS, POR FONTE DE ENERGIA, 2020-2029 (US$ MILHÕES)
TABELA 67 CARRINHOS DE COMPUTAÇÃO MÓVEL DO ORIENTE MÉDIO E ÁFRICA NO MERCADO DE CARRINHOS MÉDICOS, POR FONTE DE ENERGIA, 2020-2029 (UNIDADES)
TABELA 68 CARRINHOS DE COMPUTAÇÃO MÓVEL NO ORIENTE MÉDIO E ÁFRICA NO MERCADO DE CARRINHOS MÉDICOS, POR TIPO DE EXIBIÇÃO, 2020-2029 (US$ MILHÕES)
TABELA 69 CARRINHOS DE COMPUTAÇÃO MÓVEL NO ORIENTE MÉDIO E ÁFRICA NO MERCADO DE CARRINHOS MÉDICOS, POR TIPO DE EXIBIÇÃO, 2020-2029 (UNIDADES)
TABELA 70 COLUNAS, ARMÁRIOS E ACESSÓRIOS PARA ARMAZENAMENTO MÉDICO NO MERCADO DE CARRINHOS MÉDICOS DO ORIENTE MÉDIO E ÁFRICA, POR PRODUTO, 2020-2029 (US$ MILHÕES)
TABELA 71 COLUNAS DE ARMAZENAMENTO, ARMÁRIOS E ACESSÓRIOS NO MERCADO DE CARRINHOS MÉDICOS DO ORIENTE MÉDIO E ÁFRICA, POR PRODUTO, 2020-2029 (UNIDADES)
TABELA 72 CARRINHOS DE MEDICAMENTOS NO ORIENTE MÉDIO E ÁFRICA NO MERCADO DE CARRINHOS MÉDICOS, POR PRODUTO, 2020-2029 (US$ MILHÕES)
TABELA 73 CARRINHOS DE MEDICAMENTOS NO ORIENTE MÉDIO E ÁFRICA NO MERCADO DE CARRINHOS MÉDICOS, POR PRODUTO, 2020-2029 (UNIDADES)
TABELA 74 ESTAÇÕES DE TRABALHO MONTADAS NA PAREDE NO MERCADO DE CARRINHOS MÉDICOS DO ORIENTE MÉDIO E ÁFRICA, POR PRODUTO, 2020-2029 (US$ MILHÕES)
TABELA 75 ESTAÇÕES DE TRABALHO MONTADAS NA PAREDE NO MERCADO DE CARRINHOS MÉDICOS DA ÁSIA-PACÍFICO, POR PRODUTO, 2020-2029 (UNIDADES)
TABELA 76 MERCADO DE CARRINHOS MÉDICOS NO ORIENTE MÉDIO E ÁFRICA, POR TIPO, 2020-2029 (US$ MILHÕES)
TABELA 77 MERCADO DE CARRINHOS MÉDICOS NO ORIENTE MÉDIO E ÁFRICA, POR TIPO, 2020-2029 (UNIDADES)
TABELA 78 CARRINHOS MÉDICOS COMPUTADORIZADOS NO MERCADO DE CARRINHOS MÉDICOS DO ORIENTE MÉDIO E ÁFRICA, POR TIPO, 2020-2029 (US$ MILHÕES)
TABELA 79 CARRINHOS MÉDICOS COMPUTADORIZADOS NO MERCADO DE CARRINHOS MÉDICOS DO ORIENTE MÉDIO E ÁFRICA, POR TIPO, 2020-2029 (UNIDADES)
TABELA 80 MERCADO DE CARRINHOS MÉDICOS NO ORIENTE MÉDIO E ÁFRICA, POR APLICAÇÃO, 2020-2029 (US$ MILHÕES)
TABELA 81 MERCADO DE CARRINHOS MÉDICOS NO ORIENTE MÉDIO E ÁFRICA, POR APLICAÇÃO, 2020-2029 (US$ MILHÕES)
TABELA 82 MERCADO DE CARRINHOS MÉDICOS NO ORIENTE MÉDIO E ÁFRICA, POR TIPO DE MATERIAL, 2020-2029 (US$ MILHÕES)
TABELA 83 MERCADO DE CARRINHOS MÉDICOS NO ORIENTE MÉDIO E ÁFRICA, POR TIPO DE MATERIAL, 2020-2029 (UNIDADES)
TABELA 84 MERCADO DE CARRINHOS MÉDICOS NO ORIENTE MÉDIO E ÁFRICA, POR CARGA ÚTIL, 2020-2029 (US$ MILHÕES)
TABELA 85 MERCADO DE CARRINHOS MÉDICOS NO ORIENTE MÉDIO E ÁFRICA, POR USUÁRIO FINAL, 2020-2029 (US$ MILHÕES)
TABELA 86 HOSPITAIS DO ORIENTE MÉDIO E ÁFRICA NO MERCADO DE CARRINHOS MÉDICOS, POR USUÁRIO FINAL, 2020-2029 (US$ MILHÕES)
TABELA 87 MERCADO DE CARRINHOS MÉDICOS NO ORIENTE MÉDIO E ÁFRICA, POR CANAL DE DISTRIBUIÇÃO, 2020-2029 (US$ MILHÕES)
TABELA 88 MERCADO DE CARRINHOS MÉDICOS DA ÁFRICA DO SUL, POR PRODUTO, 2020-2029 (US$ MILHÕES)
TABELA 89 MERCADO DE CARRINHOS MÉDICOS DA ÁFRICA DO SUL, POR PRODUTO, 2020-2029 (UNIDADES)
TABELA 90 MERCADO DE CARRINHOS MÉDICOS DA ÁFRICA DO SUL, POR PRODUTO, 2020-2029 (ASP)
TABELA 91 CARRINHOS DE COMPUTAÇÃO MÓVEL NO MERCADO DE CARRINHOS MÉDICOS DA ÁFRICA DO SUL, POR APLICAÇÃO, 2020-2029 (US$ MILHÕES)
TABELA 92 CARRINHOS DE COMPUTAÇÃO MÓVEL NA ÁFRICA DO SUL NO MERCADO DE CARRINHOS MÉDICOS, POR APLICAÇÃO, 2020-2029 (UNIDADES)
TABELA 93 CARRINHOS DE COMPUTAÇÃO MÓVEL NA ÁFRICA DO SUL NO MERCADO DE CARRINHOS MÉDICOS, POR APLICAÇÃO, 2020-2029 (ASP)
TABELA 94 CARRINHOS DE COMPUTAÇÃO MÓVEL NA ÁFRICA DO SUL NO MERCADO DE CARRINHOS MÉDICOS, POR FONTE DE ENERGIA, 2020-2029 (US$ MILHÕES)
TABELA 95 CARRINHOS DE COMPUTAÇÃO MÓVEL DA ÁFRICA DO SUL NO MERCADO DE CARRINHOS MÉDICOS, POR FONTE DE ENERGIA, 2020-2029 (UNIDADES)
TABELA 96 CARRINHOS DE COMPUTAÇÃO MÓVEL NA ÁFRICA DO SUL NO MERCADO DE CARRINHOS MÉDICOS, POR FONTE DE ENERGIA, 2020-2029 (ASP)
TABELA 97 CARRINHOS DE COMPUTAÇÃO MÓVEL NA ÁFRICA DO SUL NO MERCADO DE CARRINHOS MÉDICOS, POR TIPO DE EXIBIÇÃO, 2020-2029 (US$ MILHÕES)
TABELA 98 CARRINHOS DE COMPUTAÇÃO MÓVEL NA ÁFRICA DO SUL NO MERCADO DE CARRINHOS MÉDICOS, POR TIPO DE EXIBIÇÃO, 2020-2029 (UNIDADES)
TABELA 99 CARRINHOS DE COMPUTAÇÃO MÓVEL NA ÁFRICA DO SUL NO MERCADO DE CARRINHOS MÉDICOS, POR TIPO DE EXIBIÇÃO, 2020-2029 (ASP)
TABELA 100 COLUNAS, ARMÁRIOS E ACESSÓRIOS PARA ARMAZENAMENTO MÉDICO NA ÁFRICA DO SUL NO MERCADO DE CARRINHOS MÉDICOS, POR PRODUTO, 2020-2029 (US$ MILHÕES)
TABELA 101 COLUNAS, ARMÁRIOS E ACESSÓRIOS PARA ARMAZENAMENTO MÉDICO NA ÁFRICA DO SUL NO MERCADO DE CARRINHOS MÉDICOS, POR PRODUTO, 2020-2029 (UNIDADES)
TABELA 102 COLUNAS, ARMÁRIOS E ACESSÓRIOS PARA ARMAZENAMENTO MÉDICO NA ÁFRICA DO SUL NO MERCADO DE CARRINHOS MÉDICOS, POR PRODUTO, 2020-2029 (ASP)
TABELA 103 CARRINHOS DE MEDICAMENTOS NO MERCADO DE CARRINHOS MÉDICOS DA ÁFRICA DO SUL, POR PRODUTO, 2020-2029 (US$ MILHÕES)
TABELA 104 CARRINHOS DE MEDICAMENTOS NO MERCADO DE CARRINHOS MÉDICOS DA ÁFRICA DO SUL, POR PRODUTO, 2020-2029 (UNIDADES)
TABELA 105 CARRINHOS DE MEDICAMENTOS NO MERCADO DE CARRINHOS MÉDICOS DA ÁFRICA DO SUL, POR PRODUTO, 2020-2029 (ASP)
TABELA 106 ESTAÇÕES DE TRABALHO MONTADAS NA PAREDE NO MERCADO DE CARRINHOS MÉDICOS DA ÁFRICA DO SUL, POR PRODUTO, 2020-2029 (US$ MILHÕES)
TABELA 107 ESTAÇÕES DE TRABALHO MONTADAS NA PAREDE NO MERCADO DE CARRINHOS MÉDICOS DA ÁFRICA DO SUL, POR PRODUTO, 2020-2029 (UNIDADES)
TABELA 108 ESTAÇÕES DE TRABALHO MONTADAS NA PAREDE NO MERCADO DE CARRINHOS MÉDICOS DA ÁFRICA DO SUL, POR PRODUTO, 2020-2029 (ASP)
TABELA 109 MERCADO DE CARRINHOS MÉDICOS DA ÁFRICA DO SUL, POR TIPO, 2020-2029 (US$ MILHÕES)
TABELA 110 MERCADO DE CARRINHOS MÉDICOS DA ÁFRICA DO SUL, POR TIPO, 2020-2029 (UNIDADES)
TABELA 111 MERCADO DE CARRINHOS MÉDICOS DA ÁFRICA DO SUL, POR TIPO, 2020-2029 (ASP)
TABELA 112 CARRINHOS MÉDICOS COMPUTADORIZADOS NO MERCADO DE CARRINHOS MÉDICOS DA ÁFRICA DO SUL, POR TIPO, 2020-2029 (US$ MILHÕES)
TABELA 113 CARRINHOS MÉDICOS COMPUTADORIZADOS NO MERCADO DE CARRINHOS MÉDICOS DA ÁFRICA DO SUL, POR TIPO, 2020-2029 (UNIDADES)
TABELA 114 CARRINHOS MÉDICOS COMPUTADORIZADOS NO MERCADO DE CARRINHOS MÉDICOS DA ÁFRICA DO SUL, POR TIPO, 2020-2029 (ASP)
TABELA 115 MERCADO DE CARRINHOS MÉDICOS DA ÁFRICA DO SUL, POR APLICAÇÃO, 2020-2029 (US$ MILHÕES)
TABELA 116 MERCADO DE CARRINHOS MÉDICOS NA ÁFRICA DO SUL, POR APLICAÇÃO, 2020-2029 (US$ MILHÕES)
TABELA 117 MERCADO DE CARRINHOS MÉDICOS DA ÁFRICA DO SUL, POR TIPO DE MATERIAL, 2020-2029 (US$ MILHÕES)
TABELA 118 MERCADO DE CARRINHOS MÉDICOS DA ÁFRICA DO SUL, POR TIPO DE MATERIAL, 2020-2029 (UNIDADES)
TABELA 119 MERCADO DE CARRINHOS MÉDICOS DA ÁFRICA DO SUL, POR TIPO DE MATERIAL, 2020-2029 (ASP)
TABELA 120 MERCADO DE CARRINHOS MÉDICOS DA ÁFRICA DO SUL, POR CARGA ÚTIL, 2020-2029 (US$ MILHÕES)
TABELA 121 MERCADO DE CARRINHOS MÉDICOS DA ÁFRICA DO SUL, POR USUÁRIO FINAL, 2020-2029 (US$ MILHÕES)
TABELA 122 HOSPITAIS DA ÁFRICA DO SUL NO MERCADO DE CARRINHOS MÉDICOS, POR USUÁRIO FINAL, 2020-2029 (US$ MILHÕES)
TABELA 123 MERCADO DE CARRINHOS MÉDICOS DA ÁFRICA DO SUL, POR CANAL DE DISTRIBUIÇÃO, 2020-2029 (US$ MILHÕES)
TABELA 124 MERCADO DE CARRINHOS MÉDICOS DA ARÁBIA SAUDITA, POR PRODUTO, 2020-2029 (US$ MILHÕES)
TABELA 125 MERCADO DE CARRINHOS MÉDICOS DA ARÁBIA SAUDITA, POR PRODUTO, 2020-2029 (UNIDADES)
TABELA 126 MERCADO DE CARRINHOS MÉDICOS DA ARÁBIA SAUDITA, POR PRODUTO, 2020-2029 (ASP)
TABELA 127 CARRINHOS DE COMPUTAÇÃO MÓVEL DA ARÁBIA SAUDITA NO MERCADO DE CARRINHOS MÉDICOS, POR APLICAÇÃO, 2020-2029 (US$ MILHÕES)
TABELA 128 CARRINHOS DE COMPUTAÇÃO MÓVEL DA ARÁBIA SAUDITA NO MERCADO DE CARRINHOS MÉDICOS, POR APLICAÇÃO, 2020-2029 (UNIDADES)
TABELA 129 CARRINHOS DE COMPUTAÇÃO MÓVEL DA ARÁBIA SAUDITA NO MERCADO DE CARRINHOS MÉDICOS, POR APLICAÇÃO, 2020-2029 (ASP)
TABELA 130 CARRINHOS DE COMPUTAÇÃO MÓVEL DA ARÁBIA SAUDITA NO MERCADO DE CARRINHOS MÉDICOS, POR FONTE DE ENERGIA, 2020-2029 (US$ MILHÕES)
TABELA 131 CARRINHOS DE COMPUTAÇÃO MÓVEL DA ARÁBIA SAUDITA NO MERCADO DE CARRINHOS MÉDICOS, POR FONTE DE ENERGIA, 2020-2029 (UNIDADES)
TABELA 132 CARRINHOS DE COMPUTAÇÃO MÓVEL DA ARÁBIA SAUDITA NO MERCADO DE CARRINHOS MÉDICOS, POR FONTE DE ENERGIA, 2020-2029 (ASP)
TABELA 133 CARRINHOS DE COMPUTAÇÃO MÓVEL DA ARÁBIA SAUDITA NO MERCADO DE CARRINHOS MÉDICOS, POR TIPO DE EXIBIÇÃO, 2020-2029 (US$ MILHÕES)
TABELA 134 CARRINHOS DE COMPUTAÇÃO MÓVEL DA ARÁBIA SAUDITA NO MERCADO DE CARRINHOS MÉDICOS, POR TIPO DE EXIBIÇÃO, 2020-2029 (UNIDADES)
TABELA 135 CARRINHOS DE COMPUTAÇÃO MÓVEL DA ARÁBIA SAUDITA NO MERCADO DE CARRINHOS MÉDICOS, POR TIPO DE EXIBIÇÃO, 2020-2029 (ASP)
TABELA 136 COLUNAS, ARMÁRIOS E ACESSÓRIOS PARA ARMAZENAMENTO MÉDICO NA ARÁBIA SAUDITA NO MERCADO DE CARRINHOS MÉDICOS, POR PRODUTO, 2020-2029 (US$ MILHÕES)
TABELA 137 COLUNAS, ARMÁRIOS E ACESSÓRIOS PARA ARMAZENAMENTO MÉDICO NA ARÁBIA SAUDITA NO MERCADO DE CARRINHOS MÉDICOS, POR PRODUTO, 2020-2029 (UNIDADES)
TABELA 138 COLUNAS, ARMÁRIOS E ACESSÓRIOS PARA ARMAZENAMENTO MÉDICO NA ARÁBIA SAUDITA NO MERCADO DE CARRINHOS MÉDICOS, POR PRODUTO, 2020-2029 (ASP)
TABELA 139 CARRINHOS DE MEDICAMENTOS DA ARÁBIA SAUDITA NO MERCADO DE CARRINHOS MÉDICOS, POR PRODUTO, 2020-2029 (US$ MILHÕES)
TABELA 140 CARRINHOS DE MEDICAMENTOS DA ARÁBIA SAUDITA NO MERCADO DE CARRINHOS MÉDICOS, POR PRODUTO, 2020-2029 (UNIDADES)
TABELA 141 CARRINHOS DE MEDICAMENTOS DA ARÁBIA SAUDITA NO MERCADO DE CARRINHOS MÉDICOS, POR PRODUTO, 2020-2029 (ASP)
TABELA 142 ESTAÇÕES DE TRABALHO MONTADAS NA PAREDE NO MERCADO DE CARRINHOS MÉDICOS DA ARÁBIA SAUDITA, POR PRODUTO, 2020-2029 (US$ MILHÕES)
TABELA 143 ESTAÇÕES DE TRABALHO MONTADAS NA PAREDE NO MERCADO DE CARRINHOS MÉDICOS DA ARÁBIA SAUDITA, POR PRODUTO, 2020-2029 (UNIDADES)
TABELA 144 ESTAÇÕES DE TRABALHO MONTADAS NA PAREDE NO MERCADO DE CARRINHOS MÉDICOS DA ARÁBIA SAUDITA, POR PRODUTO, 2020-2029 (ASP)
TABELA 145 MERCADO DE CARRINHOS MÉDICOS DA ARÁBIA SAUDITA, POR TIPO, 2020-2029 (US$ MILHÕES)
TABELA 146 MERCADO DE CARRINHOS MÉDICOS DA ARÁBIA SAUDITA, POR TIPO, 2020-2029 (UNIDADES)
TABELA 147 MERCADO DE CARRINHOS MÉDICOS DA ARÁBIA SAUDITA, POR TIPO, 2020-2029 (ASP)
TABELA 148 CARRINHO MÉDICO COMPUTADORIZADO DA ARÁBIA SAUDITA NO MERCADO DE CARRINHOS MÉDICOS, POR TIPO, 2020-2029 (US$ MILHÕES)
TABELA 149 CARRINHO MÉDICO COMPUTADORIZADO DA ARÁBIA SAUDITA NO MERCADO DE CARRINHOS MÉDICOS, POR TIPO, 2020-2029 (UNIDADES)
TABELA 150 CARRINHOS MÉDICOS COMPUTADORIZADOS DA ARÁBIA SAUDITA NO MERCADO DE CARRINHOS MÉDICOS, POR TIPO, 2020-2029 (ASP)
TABELA 151 MERCADO DE CARRINHOS MÉDICOS DA ARÁBIA SAUDITA, POR APLICAÇÃO, 2020-2029 (US$ MILHÕES)
TABELA 152 MERCADO DE CARRINHOS MÉDICOS DA ARÁBIA SAUDITA, POR APLICAÇÃO, 2020-2029 (US$ MILHÕES)
TABELA 153 MERCADO DE CARRINHOS MÉDICOS DA ARÁBIA SAUDITA, POR TIPO DE MATERIAL, 2020-2029 (US$ MILHÕES)
TABELA 154 MERCADO DE CARRINHOS MÉDICOS DA ARÁBIA SAUDITA, POR TIPO DE MATERIAL, 2020-2029 (UNIDADES)
TABELA 155 MERCADO DE CARRINHOS MÉDICOS DA ARÁBIA SAUDITA, POR TIPO DE MATERIAL, 2020-2029 (ASP)
TABELA 156 MERCADO DE CARRINHOS MÉDICOS DA ARÁBIA SAUDITA, POR CARGA ÚTIL, 2020-2029 (US$ MILHÕES)
TABELA 157 MERCADO DE CARRINHOS MÉDICOS DA ARÁBIA SAUDITA, POR USUÁRIO FINAL, 2020-2029 (US$ MILHÕES)
TABELA 158 HOSPITAIS DA ARÁBIA SAUDITA NO MERCADO DE CARRINHOS MÉDICOS, POR USUÁRIO FINAL, 2020-2029 (US$ MILHÕES)
TABELA 159 MERCADO DE CARRINHOS MÉDICOS DA ARÁBIA SAUDITA, POR CANAL DE DISTRIBUIÇÃO, 2020-2029 (US$ MILHÕES)
TABELA 160 MERCADO DE CARRINHOS MÉDICOS DOS EAU, POR PRODUTO, 2020-2029 (US$ MILHÕES)
TABELA 161 MERCADO DE CARRINHOS MÉDICOS DOS EAU, POR PRODUTO, 2020-2029 (UNIDADES)
TABELA 162 MERCADO DE CARRINHOS MÉDICOS DOS EAU, POR PRODUTO, 2020-2029 (ASP)
TABELA 163 CARRINHOS DE COMPUTAÇÃO MÓVEL NOS EAU NO MERCADO DE CARRINHOS MÉDICOS, POR APLICAÇÃO, 2020-2029 (US$ MILHÕES)
TABELA 164 CARRINHOS DE COMPUTAÇÃO MÓVEL NOS EAU NO MERCADO DE CARRINHOS MÉDICOS, POR APLICAÇÃO, 2020-2029 (UNIDADES)
TABELA 165 CARRINHOS DE COMPUTAÇÃO MÓVEL NOS EAU NO MERCADO DE CARRINHOS MÉDICOS, POR APLICAÇÃO, 2020-2029 (ASP)
TABELA 166 CARRINHOS DE COMPUTAÇÃO MÓVEL NOS EAU NO MERCADO DE CARRINHOS MÉDICOS, POR FONTE DE ENERGIA, 2020-2029 (US$ MILHÕES)
TABELA 167 CARRINHOS DE COMPUTAÇÃO MÓVEL NOS EAU NO MERCADO DE CARRINHOS MÉDICOS, POR FONTE DE ENERGIA, 2020-2029 (UNIDADES)
TABELA 168 CARRINHOS DE COMPUTAÇÃO MÓVEL NOS EAU NO MERCADO DE CARRINHOS MÉDICOS, POR FONTE DE ENERGIA, 2020-2029 (ASP)
TABELA 169 CARRINHOS DE COMPUTAÇÃO MÓVEL NOS EAU NO MERCADO DE CARRINHOS MÉDICOS, POR TIPO DE EXIBIÇÃO, 2020-2029 (US$ MILHÕES)
TABELA 170 CARRINHOS DE COMPUTAÇÃO MÓVEL NOS EAU NO MERCADO DE CARRINHOS MÉDICOS, POR TIPO DE EXIBIÇÃO, 2020-2029 (UNIDADES)
TABELA 171 CARRINHOS DE COMPUTAÇÃO MÓVEL NOS EAU NO MERCADO DE CARRINHOS MÉDICOS, POR TIPO DE EXIBIÇÃO, 2020-2029 (ASP)
TABELA 172 COLUNAS, ARMÁRIOS E ACESSÓRIOS PARA ARMAZENAMENTO MÉDICO NOS EAU NO MERCADO DE CARRINHOS MÉDICOS, POR PRODUTO, 2020-2029 (US$ MILHÕES)
TABELA 173 COLUNAS, ARMÁRIOS E ACESSÓRIOS PARA ARMAZENAMENTO MÉDICO NOS EAU NO MERCADO DE CARRINHOS MÉDICOS, POR PRODUTO, 2020-2029 (UNIDADES)
TABELA 174 COLUNAS, ARMÁRIOS E ACESSÓRIOS PARA ARMAZENAMENTO MÉDICO NOS EAU NO MERCADO DE CARRINHOS MÉDICOS, POR PRODUTO, 2020-2029 (ASP)
TABELA 175 CARRINHOS PARA MEDICAMENTOS NO MERCADO DE CARRINHOS MÉDICOS DOS EAU, POR PRODUTO, 2020-2029 (US$ MILHÕES)
TABELA 176 CARRINHOS PARA MEDICAMENTOS NO MERCADO DE CARRINHOS MÉDICOS DOS EAU, POR PRODUTO, 2020-2029 (UNIDADES)
TABELA 177 CARRINHOS DE MEDICAMENTOS NO MERCADO DE CARRINHOS MÉDICOS DOS EAU, POR PRODUTO, 2020-2029 (ASP)
TABELA 178 ESTAÇÕES DE TRABALHO MONTADAS NA PAREDE NO MERCADO DE CARRINHOS MÉDICOS DOS EAU, POR PRODUTO, 2020-2029 (US$ MILHÕES)
TABELA 179 ESTAÇÕES DE TRABALHO MONTADAS NA PAREDE NO MERCADO DE CARRINHOS MÉDICOS DOS EAU, POR PRODUTO, 2020-2029 (UNIDADES)
TABELA 180 ESTAÇÕES DE TRABALHO MONTADAS NA PAREDE NO MERCADO DE CARRINHOS MÉDICOS NOS EAU, POR PRODUTO, 2020-2029 (ASP)
TABELA 181 MERCADO DE CARRINHOS MÉDICOS NOS EAU, POR TIPO, 2020-2029 (US$ MILHÕES)
TABELA 182 MERCADO DE CARRINHOS MÉDICOS NOS EAU, POR TIPO, 2020-2029 (UNIDADES)
TABELA 183 MERCADO DE CARRINHOS MÉDICOS NOS EAU, POR TIPO, 2020-2029 (ASP)
TABELA 184 CARRINHOS MÉDICOS COMPUTADORIZADOS NOS EAU NO MERCADO DE CARRINHOS MÉDICOS, POR TIPO, 2020-2029 (US$ MILHÕES)
TABELA 185 CARRINHOS MÉDICOS COMPUTADORIZADOS NOS EAU NO MERCADO DE CARRINHOS MÉDICOS, POR TIPO, 2020-2029 (UNIDADES)
TABELA 186 CARRINHOS MÉDICOS COMPUTADORIZADOS NOS EAU NO MERCADO DE CARRINHOS MÉDICOS, POR TIPO, 2020-2029 (ASP)
TABELA 187 MERCADO DE CARRINHOS MÉDICOS DOS EAU, POR APLICAÇÃO, 2020-2029 (US$ MILHÕES)
TABELA 188 MERCADO DE CARRINHOS MÉDICOS NOS EAU, POR APLICAÇÃO, 2020-2029 (US$ MILHÕES)
TABELA 189 MERCADO DE CARRINHOS MÉDICOS DOS EAU, POR TIPO DE MATERIAL, 2020-2029 (US$ MILHÕES)
TABELA 190 MERCADO DE CARRINHOS MÉDICOS NOS EAU, POR TIPO DE MATERIAL, 2020-2029 (UNIDADES)
TABELA 191 MERCADO DE CARRINHOS MÉDICOS NOS EAU, POR TIPO DE MATERIAL, 2020-2029 (ASP)
TABELA 192 MERCADO DE CARRINHOS MÉDICOS DOS EAU, POR CARGA ÚTIL, 2020-2029 (US$ MILHÕES)
TABELA 193 MERCADO DE CARRINHOS MÉDICOS NOS EAU, POR USUÁRIO FINAL, 2020-2029 (US$ MILHÕES)
TABELA 194 HOSPITAIS DOS EAU NO MERCADO DE CARRINHOS MÉDICOS, POR USUÁRIO FINAL, 2020-2029 (US$ MILHÕES)
TABELA 195 MERCADO DE CARRINHOS MÉDICOS NOS EAU, POR CANAL DE DISTRIBUIÇÃO, 2020-2029 (US$ MILHÕES)
TABELA 196 MERCADO DE CARRINHOS MÉDICOS DO EGITO, POR PRODUTO, 2020-2029 (US$ MILHÕES)
TABELA 197 MERCADO DE CARRINHOS MÉDICOS DO EGITO, POR PRODUTO, 2020-2029 (UNIDADES)
TABELA 198 MERCADO DE CARRINHOS MÉDICOS DO EGITO, POR PRODUTO, 2020-2029 (ASP)
TABELA 199 CARRINHOS DE COMPUTAÇÃO MÓVEL NO MERCADO DE CARRINHOS MÉDICOS DO EGITO, POR APLICAÇÃO, 2020-2029 (US$ MILHÕES)
TABELA 200 CARRINHOS DE COMPUTAÇÃO MÓVEL NO MERCADO DE CARRINHOS MÉDICOS DO EGITO, POR APLICAÇÃO, 2020-2029 (UNIDADES)
TABELA 201 CARRINHOS DE COMPUTAÇÃO MÓVEL NO MERCADO DE CARRINHOS MÉDICOS DO EGITO, POR APLICAÇÃO, 2020-2029 (ASP)
TABELA 202 CARRINHOS DE COMPUTAÇÃO MÓVEL NO MERCADO DE CARRINHOS MÉDICOS DO EGITO, POR FONTE DE ENERGIA, 2020-2029 (US$ MILHÕES)
TABELA 203 CARRINHOS DE COMPUTAÇÃO MÓVEL NO MERCADO DE CARRINHOS MÉDICOS DO EGITO, POR FONTE DE ENERGIA, 2020-2029 (UNIDADES)
TABELA 204 CARRINHOS DE COMPUTAÇÃO MÓVEL NO MERCADO DE CARRINHOS MÉDICOS DO EGITO, POR FONTE DE ENERGIA, 2020-2029 (ASP)
TABELA 205 CARRINHOS DE COMPUTAÇÃO MÓVEL NO MERCADO DE CARRINHOS MÉDICOS DO EGITO, POR TIPO DE EXIBIÇÃO, 2020-2029 (US$ MILHÕES)
TABELA 206 CARRINHOS DE COMPUTAÇÃO MÓVEL NO MERCADO DE CARRINHOS MÉDICOS DO EGITO, POR TIPO DE EXIBIÇÃO, 2020-2029 (UNIDADES)
TABELA 207 CARRINHOS DE COMPUTAÇÃO MÓVEL NO MERCADO DE CARRINHOS MÉDICOS DO EGITO, POR TIPO DE EXIBIÇÃO, 2020-2029 (ASP)
TABELA 208 COLUNAS, ARMÁRIOS E ACESSÓRIOS PARA ARMAZENAMENTO MÉDICO NO MERCADO DE CARRINHOS MÉDICOS DO EGITO, POR PRODUTO, 2020-2029 (US$ MILHÕES)
TABELA 209 COLUNAS, ARMÁRIOS E ACESSÓRIOS PARA ARMAZENAMENTO MÉDICO NO MERCADO DE CARRINHOS MÉDICOS DO EGITO, POR PRODUTO, 2020-2029 (UNIDADES)
TABELA 210 COLUNAS, ARMÁRIOS E ACESSÓRIOS PARA ARMAZENAMENTO MÉDICO NO MERCADO DE CARRINHOS MÉDICOS DO EGITO, POR PRODUTO, 2020-2029 (ASP)
TABELA 211 CARRINHOS DE MEDICAMENTOS NO MERCADO DE CARRINHOS MÉDICOS DO EGITO, POR PRODUTO, 2020-2029 (US$ MILHÕES)
TABELA 212 CARRINHOS DE MEDICAMENTOS NO MERCADO DE CARRINHOS MÉDICOS DO EGITO, POR PRODUTO, 2020-2029 (UNIDADES)
TABELA 213 CARRINHOS DE MEDICAMENTOS NO MERCADO DE CARRINHOS MÉDICOS DO EGITO, POR PRODUTO, 2020-2029 (ASP)
TABELA 214 ESTAÇÕES DE TRABALHO MONTADAS NA PAREDE NO MERCADO DE CARRINHOS MÉDICOS DO EGITO, POR PRODUTO, 2020-2029 (US$ MILHÕES)
TABELA 215 ESTAÇÕES DE TRABALHO MONTADAS NA PAREDE NO MERCADO DE CARRINHOS MÉDICOS DO EGITO, POR PRODUTO, 2020-2029 (UNIDADES)
TABELA 216 ESTAÇÕES DE TRABALHO MONTADAS NA PAREDE NO MERCADO DE CARRINHOS MÉDICOS DO EGITO, POR PRODUTO, 2020-2029 (ASP)
TABELA 217 MERCADO DE CARRINHOS MÉDICOS NO EGITO, POR TIPO, 2020-2029 (US$ MILHÕES)
TABELA 218 MERCADO DE CARRINHOS MÉDICOS NO EGITO, POR TIPO, 2020-2029 (UNIDADES)
TABELA 219 MERCADO DE CARRINHOS MÉDICOS DO EGITO, POR TIPO, 2020-2029 (ASP)
TABELA 220 CARRINHOS MÉDICOS COMPUTADORIZADOS NO MERCADO DE CARRINHOS MÉDICOS DO EGITO, POR TIPO, 2020-2029 (US$ MILHÕES)
TABELA 221 CARRINHO MÉDICO COMPUTADORIZADO NO MERCADO DE CARRINHOS MÉDICOS DO EGITO, POR TIPO, 2020-2029 (UNIDADES)
TABELA 222 CARRINHOS MÉDICOS COMPUTADORIZADOS NO MERCADO DE CARRINHOS MÉDICOS DO EGITO, POR TIPO, 2020-2029 (ASP)
TABELA 223 MERCADO DE CARRINHOS MÉDICOS DO EGITO, POR APLICAÇÃO, 2020-2029 (US$ MILHÕES)
TABELA 224 MERCADO DE CARRINHOS MÉDICOS NO EGITO, POR APLICAÇÃO, 2020-2029 (US$ MILHÕES)
TABELA 225 MERCADO DE CARRINHOS MÉDICOS DO EGITO, POR TIPO DE MATERIAL, 2020-2029 (US$ MILHÕES)
TABELA 226 MERCADO DE CARRINHOS MÉDICOS DO EGITO, POR TIPO DE MATERIAL, 2020-2029 (UNIDADES)
TABELA 227 MERCADO DE CARRINHOS MÉDICOS DO EGITO, POR TIPO DE MATERIAL, 2020-2029 (ASP)
TABELA 228 MERCADO DE CARRINHOS MÉDICOS DO EGITO, POR CARGA ÚTIL, 2020-2029 (US$ MILHÕES)
TABELA 229 MERCADO DE CARRINHOS MÉDICOS DO EGITO, POR USUÁRIO FINAL, 2020-2029 (US$ MILHÕES)
TABELA 230 HOSPITAIS DO EGITO NO MERCADO DE CARRINHOS MÉDICOS, POR USUÁRIO FINAL, 2020-2029 (US$ MILHÕES)
TABELA 231 MERCADO DE CARRINHOS MÉDICOS DO EGITO, POR CANAL DE DISTRIBUIÇÃO, 2020-2029 (US$ MILHÕES)
TABELA 232 MERCADO DE CARRINHOS MÉDICOS DE ISRAEL, POR PRODUTO, 2020-2029 (US$ MILHÕES)
TABELA 233 MERCADO DE CARRINHOS MÉDICOS DE ISRAEL, POR PRODUTO, 2020-2029 (UNIDADES)
TABELA 234 MERCADO DE CARRINHOS MÉDICOS DE ISRAEL, POR PRODUTO, 2020-2029 (ASP)
TABELA 235 CARRINHOS DE COMPUTAÇÃO MÓVEL DE ISRAEL NO MERCADO DE CARRINHOS MÉDICOS, POR APLICAÇÃO, 2020-2029 (US$ MILHÕES)
TABELA 236 CARRINHOS DE COMPUTAÇÃO MÓVEL DE ISRAEL NO MERCADO DE CARRINHOS MÉDICOS, POR APLICAÇÃO, 2020-2029 (UNIDADES)
TABELA 237 CARRINHOS DE COMPUTAÇÃO MÓVEL DE ISRAEL NO MERCADO DE CARRINHOS MÉDICOS, POR APLICAÇÃO, 2020-2029 (ASP)
TABELA 238 CARRINHOS DE COMPUTAÇÃO MÓVEL DE ISRAEL NO MERCADO DE CARRINHOS MÉDICOS, POR FONTE DE ENERGIA, 2020-2029 (US$ MILHÕES)
TABELA 239 CARRINHOS DE COMPUTAÇÃO MÓVEL DE ISRAEL NO MERCADO DE CARRINHOS MÉDICOS, POR FONTE DE ENERGIA, 2020-2029 (UNIDADES)
TABELA 240 CARRINHOS DE COMPUTAÇÃO MÓVEL DE ISRAEL NO MERCADO DE CARRINHOS MÉDICOS, POR FONTE DE ENERGIA, 2020-2029 (ASP)
TABELA 241 CARRINHOS DE COMPUTAÇÃO MÓVEL DE ISRAEL NO MERCADO DE CARRINHOS MÉDICOS, POR TIPO DE EXIBIÇÃO, 2020-2029 (US$ MILHÕES)
TABELA 242 CARRINHOS DE COMPUTAÇÃO MÓVEL DE ISRAEL NO MERCADO DE CARRINHOS MÉDICOS, POR TIPO DE EXIBIÇÃO, 2020-2029 (UNIDADES)
TABELA 243 CARRINHOS DE COMPUTAÇÃO MÓVEL DE ISRAEL NO MERCADO DE CARRINHOS MÉDICOS, POR TIPO DE EXIBIÇÃO, 2020-2029 (ASP)
TABELA 244 COLUNAS, ARMÁRIOS E ACESSÓRIOS DE ARMAZENAMENTO MÉDICO DE ISRAEL NO MERCADO DE CARRINHOS MÉDICOS, POR PRODUTO, 2020-2029 (US$ MILHÕES)
TABELA 245 COLUNAS, ARMÁRIOS E ACESSÓRIOS PARA ARMAZENAMENTO MÉDICO EM ISRAEL NO MERCADO DE CARRINHOS MÉDICOS, POR PRODUTO, 2020-2029 (UNIDADES)
TABELA 246 COLUNAS, ARMÁRIOS E ACESSÓRIOS PARA ARMAZENAMENTO MÉDICO EM ISRAEL NO MERCADO DE CARRINHOS MÉDICOS, POR PRODUTO, 2020-2029 (ASP)
TABELA 247 CARRINHOS DE MEDICAMENTOS DE ISRAEL NO MERCADO DE CARRINHOS MÉDICOS, POR PRODUTO, 2020-2029 (US$ MILHÕES)
TABELA 248 CARRINHOS PARA MEDICAMENTOS DE ISRAEL NO MERCADO DE CARRINHOS MÉDICOS, POR PRODUTO, 2020-2029 (UNIDADES)
TABELA 249 CARRINHOS DE MEDICAMENTOS DE ISRAEL NO MERCADO DE CARRINHOS MÉDICOS, POR PRODUTO, 2020-2029 (ASP)
TABELA 250 ESTAÇÕES DE TRABALHO DE PAREDE DE ISRAEL NO MERCADO DE CARRINHOS MÉDICOS, POR PRODUTO, 2020-2029 (US$ MILHÕES)
TABELA 251 ESTAÇÕES DE TRABALHO DE PAREDE DE ISRAEL NO MERCADO DE CARRINHOS MÉDICOS, POR PRODUTO, 2020-2029 (UNIDADES)
TABELA 252 ESTAÇÕES DE TRABALHO DE PAREDE DE ISRAEL NO MERCADO DE CARRINHOS MÉDICOS, POR PRODUTO, 2020-2029 (ASP)
TABELA 253 MERCADO DE CARRINHOS MÉDICOS DE ISRAEL, POR TIPO, 2020-2029 (US$ MILHÕES)
TABELA 254 MERCADO DE CARRINHOS MÉDICOS DE ISRAEL, POR TIPO, 2020-2029 (UNIDADES)
TABELA 255 MERCADO DE CARRINHOS MÉDICOS DE ISRAEL, POR TIPO, 2020-2029 (ASP)
TABELA 256 CARRINHO MÉDICO COMPUTADORIZADO DE ISRAEL NO MERCADO DE CARRINHOS MÉDICOS, POR TIPO, 2020-2029 (US$ MILHÕES)
TABELA 257 CARRINHO MÉDICO COMPUTADORIZADO DE ISRAEL NO MERCADO DE CARRINHOS MÉDICOS, POR TIPO, 2020-2029 (UNIDADES)
TABELA 258 CARRINHO MÉDICO COMPUTADORIZADO DE ISRAEL NO MERCADO DE CARRINHOS MÉDICOS, POR TIPO, 2020-2029 (ASP)
TABELA 259 MERCADO DE CARRINHOS MÉDICOS DE ISRAEL, POR APLICAÇÃO, 2020-2029 (US$ MILHÕES)
TABELA 260 MERCADO DE CARRINHOS MÉDICOS DE ISRAEL, POR APLICAÇÃO, 2020-2029 (US$ MILHÕES)
TABELA 261 MERCADO DE CARRINHOS MÉDICOS DE ISRAEL, POR TIPO DE MATERIAL, 2020-2029 (US$ MILHÕES)
TABELA 262 MERCADO DE CARRINHOS MÉDICOS DE ISRAEL, POR TIPO DE MATERIAL, 2020-2029 (UNIDADES)
TABELA 263 MERCADO DE CARRINHOS MÉDICOS DE ISRAEL, POR TIPO DE MATERIAL, 2020-2029 (ASP)
TABELA 264 MERCADO DE CARRINHOS MÉDICOS DE ISRAEL, POR CARGA ÚTIL, 2020-2029 (US$ MILHÕES)
TABELA 265 MERCADO DE CARRINHOS MÉDICOS DE ISRAEL, POR USUÁRIO FINAL, 2020-2029 (US$ MILHÕES)
TABELA 266 HOSPITAIS DE ISRAEL NO MERCADO DE CARRINHOS MÉDICOS, POR USUÁRIO FINAL, 2020-2029 (US$ MILHÕES)
TABELA 267 MERCADO DE CARRINHOS MÉDICOS DE ISRAEL, POR CANAL DE DISTRIBUIÇÃO, 2020-2029 (US$ MILHÕES)
TABELA 268 RESTANTE DO MERCADO DE CARRINHOS MÉDICOS DO ORIENTE MÉDIO E ÁFRICA, POR PRODUTO, 2020-2029 (US$ MILHÕES)
TABELA 269 RESTANTE DO MERCADO DE CARRINHOS MÉDICOS DO ORIENTE MÉDIO E ÁFRICA, POR PRODUTO, 2020-2029 (UNIDADES)
TABELA 270 RESTANTE DO MERCADO DE CARRINHOS MÉDICOS DO ORIENTE MÉDIO E ÁFRICA, POR PRODUTO, 2020-2029 (ASP)
Lista de Figura
FIGURA 1 MERCADO DE CARRINHOS MÉDICOS DO ORIENTE MÉDIO E ÁFRICA: SEGMENTAÇÃO
FIGURA 2 MERCADO DE CARRINHOS MÉDICOS NO ORIENTE MÉDIO E ÁFRICA: TRIANGULAÇÃO DE DADOS
FIGURA 3 MERCADO DE CARRINHOS MÉDICOS NO ORIENTE MÉDIO E ÁFRICA: ANÁLISE DROC
FIGURA 4 MERCADO DE CARRINHOS MÉDICOS NO ORIENTE MÉDIO E ÁFRICA: ORIENTE MÉDIO E ÁFRICA VS ANÁLISE REGIONAL
FIGURA 5 MERCADO DE CARRINHOS MÉDICOS NO ORIENTE MÉDIO E ÁFRICA: ANÁLISE DE PESQUISA DA EMPRESA
FIGURA 6 MERCADO DE CARRINHOS MÉDICOS NO ORIENTE MÉDIO E ÁFRICA: DEMOGRAFIA DA ENTREVISTA
FIGURA 7 MERCADO DE CARRINHOS MÉDICOS DO ORIENTE MÉDIO E ÁFRICA: GRADE DE POSIÇÃO DE MERCADO DE DBMR
FIGURA 8 MERCADO DE CARRINHOS MÉDICOS NO ORIENTE MÉDIO E ÁFRICA: ANÁLISE DA PARTICIPAÇÃO DE FORNECEDORES
FIGURA 9 MERCADO DE CARRINHOS MÉDICOS DO ORIENTE MÉDIO E ÁFRICA: GRADE DE COBERTURA DE APLICAÇÃO DE MERCADO
FIGURA 10 MERCADO DE CARRINHOS MÉDICOS DO ORIENTE MÉDIO E ÁFRICA: SEGMENTAÇÃO
FIGURA 11 A MELHORIA DAS INSTALAÇÕES E DA INFRAESTRUTURA DE SAÚDE E A ADOÇÃO DO REGISTRO MÉDICO ELETRÔNICO (EMR) NOS HOSPITAIS DEVEM IMPULSIONAR O MERCADO DE CARRINHOS MÉDICOS NO ORIENTE MÉDIO E NA ÁFRICA NO PERÍODO PREVISTO DE 2022 A 2029
FIGURA 12 O SEGMENTO DE CARRINHOS DE COMPUTAÇÃO MÓVEL DEVE SER REPRESENTANTE DA MAIOR PARCIALIDADE DO MERCADO DE CARRINHOS MÉDICOS DO ORIENTE MÉDIO E ÁFRICA EM 2022 E 2029
FIGURA 13 A AMÉRICA DO NORTE DEVE DOMINA O MERCADO DE CARRINHOS MÉDICOS DO ORIENTE MÉDIO E ÁFRICA, E A ÁSIA-PACÍFICO DEVE CRESCER COM O MAIOR CAGR NO PERÍODO PREVISTO DE 2022 A 2029
FIGURA 14 MOTIVADORES, RESTRIÇÕES, OPORTUNIDADES E DESAFIOS DO MERCADO DE CARRINHOS MÉDICOS DO ORIENTE MÉDIO E DA ÁFRICA
FIGURA 15 MERCADO DE CARRINHOS MÉDICOS NO ORIENTE MÉDIO E ÁFRICA: POR PRODUTO, 2021
FIGURA 16 MERCADO DE CARRINHOS MÉDICOS NO ORIENTE MÉDIO E ÁFRICA: POR PRODUTO, 2020-2029 (US$ MILHÕES)
FIGURA 17 MERCADO DE CARRINHOS MÉDICOS NO ORIENTE MÉDIO E ÁFRICA: POR PRODUTO, CAGR (2022-2029)
FIGURA 18 MERCADO DE CARRINHOS MÉDICOS NO ORIENTE MÉDIO E ÁFRICA: POR PRODUTO, CURVA DE VIDA
FIGURA 19 MERCADO DE CARRINHOS MÉDICOS NO ORIENTE MÉDIO E ÁFRICA: POR TIPO, 2021
FIGURA 20 MERCADO DE CARRINHOS MÉDICOS NO ORIENTE MÉDIO E ÁFRICA: POR TIPO, 2020-2029 (US$ MILHÕES)
FIGURA 21 MERCADO DE CARRINHOS MÉDICOS NO ORIENTE MÉDIO E ÁFRICA: POR TIPO, CAGR (2022-2029)
FIGURA 22 MERCADO DE CARRINHOS MÉDICOS NO ORIENTE MÉDIO E ÁFRICA: POR TIPO, CURVA DE LINHA DE SALVAÇÃO
FIGURA 23 MERCADO DE CARRINHOS MÉDICOS NO ORIENTE MÉDIO E ÁFRICA: POR APLICAÇÃO, 2021
FIGURA 24 MERCADO DE CARRINHOS MÉDICOS NO ORIENTE MÉDIO E ÁFRICA: POR APLICAÇÃO, 2020-2029 (US$ MILHÕES)
FIGURA 25 MERCADO DE CARRINHOS MÉDICOS NO ORIENTE MÉDIO E ÁFRICA: POR APLICAÇÃO, CAGR (2022-2029)
FIGURA 26 MERCADO DE CARRINHOS MÉDICOS NO ORIENTE MÉDIO E ÁFRICA: POR APLICAÇÃO, CURVA DE LINHA DE SALVAÇÃO
FIGURA 27 MERCADO DE CARRINHOS MÉDICOS NO ORIENTE MÉDIO E ÁFRICA: POR TIPO DE MATERIAL, 2021
FIGURA 28 MERCADO DE CARRINHOS MÉDICOS NO ORIENTE MÉDIO E ÁFRICA: POR TIPO DE MATERIAL, 2020-2029 (US$ MILHÕES)
FIGURA 29 MERCADO DE CARRINHOS MÉDICOS NO ORIENTE MÉDIO E ÁFRICA: POR TIPO DE MATERIAL, CAGR (2022-2029)
FIGURA 30 MERCADO DE CARRINHOS MÉDICOS NO ORIENTE MÉDIO E ÁFRICA: POR TIPO DE MATERIAL, CURVA DE LINHA DE VIDA
FIGURA 31 MERCADO DE CARRINHOS MÉDICOS NO ORIENTE MÉDIO E ÁFRICA: POR CARGA ÚTIL, 2021
FIGURA 32 MERCADO DE CARRINHOS MÉDICOS NO ORIENTE MÉDIO E ÁFRICA: POR CARGA ÚTIL, 2020-2029 (US$ MILHÕES)
FIGURA 33 MERCADO DE CARRINHOS MÉDICOS NO ORIENTE MÉDIO E ÁFRICA: POR CARGA ÚTIL, CAGR (2022-2029)
FIGURA 34 MERCADO DE CARRINHOS MÉDICOS NO ORIENTE MÉDIO E ÁFRICA: POR CARGA ÚTIL, CURVA DE LINHA DE SALVAÇÃO
FIGURA 35 MERCADO DE CARRINHOS MÉDICOS NO ORIENTE MÉDIO E ÁFRICA: POR USUÁRIO FINAL, 2021
FIGURA 36 MERCADO DE CARRINHOS MÉDICOS NO ORIENTE MÉDIO E ÁFRICA: POR USUÁRIO FINAL, 2020-2029 (US$ MILHÕES)
FIGURA 37 MERCADO DE CARRINHOS MÉDICOS NO ORIENTE MÉDIO E ÁFRICA: POR USUÁRIO FINAL, CAGR (2022-2029)
FIGURA 38 MERCADO DE CARRINHOS MÉDICOS NO ORIENTE MÉDIO E ÁFRICA: POR USUÁRIO FINAL, CURVA DE LINHA DE SALVAÇÃO
FIGURA 39 MERCADO DE CARRINHOS MÉDICOS NO ORIENTE MÉDIO E ÁFRICA: POR DISTRIBUIDORES TERCEIRIZADOS, 2021
FIGURA 40 MERCADO DE CARRINHOS MÉDICOS NO ORIENTE MÉDIO E ÁFRICA: POR DISTRIBUIDORES TERCEIRIZADOS, 2020-2029 (US$ MILHÕES)
FIGURA 41 MERCADO DE CARRINHOS MÉDICOS NO ORIENTE MÉDIO E ÁFRICA: POR DISTRIBUIDORES TERCEIRIZADOS, CAGR (2022-2029)
FIGURA 42 MERCADO DE CARRINHOS MÉDICOS NO ORIENTE MÉDIO E ÁFRICA: POR DISTRIBUIDORES TERCEIRIZADOS, CURVA DA LINHA DE VIDA
FIGURA 43 MERCADO DE CARRINHOS MÉDICOS NO ORIENTE MÉDIO E ÁFRICA: RESUMO (2021)
FIGURA 44 MERCADO DE CARRINHOS MÉDICOS NO ORIENTE MÉDIO E ÁFRICA: POR PAÍS (2021)
FIGURA 45 MERCADO DE CARRINHOS MÉDICOS NO ORIENTE MÉDIO E ÁFRICA: POR PAÍS (2022 E 2029)
FIGURA 46 MERCADO DE CARRINHOS MÉDICOS NO ORIENTE MÉDIO E ÁFRICA: POR PAÍS (2021 E 2029)
FIGURA 47 MERCADO DE CARRINHOS MÉDICOS NO ORIENTE MÉDIO E ÁFRICA: POR PRODUTO (2022-2029)
FIGURA 48 MERCADO DE CARRINHOS MÉDICOS NO ORIENTE MÉDIO E ÁFRICA: PARTICIPAÇÃO DA EMPRESA EM 2021 (%)
Metodologia de Investigação
A recolha de dados e a análise do ano base são feitas através de módulos de recolha de dados com amostras grandes. A etapa inclui a obtenção de informações de mercado ou dados relacionados através de diversas fontes e estratégias. Inclui examinar e planear antecipadamente todos os dados adquiridos no passado. Da mesma forma, envolve o exame de inconsistências de informação observadas em diferentes fontes de informação. Os dados de mercado são analisados e estimados utilizando modelos estatísticos e coerentes de mercado. Além disso, a análise da quota de mercado e a análise das principais tendências são os principais fatores de sucesso no relatório de mercado. Para saber mais, solicite uma chamada de analista ou abra a sua consulta.
A principal metodologia de investigação utilizada pela equipa de investigação do DBMR é a triangulação de dados que envolve a mineração de dados, a análise do impacto das variáveis de dados no mercado e a validação primária (especialista do setor). Os modelos de dados incluem grelha de posicionamento de fornecedores, análise da linha de tempo do mercado, visão geral e guia de mercado, grelha de posicionamento da empresa, análise de patentes, análise de preços, análise da quota de mercado da empresa, normas de medição, análise global versus regional e de participação dos fornecedores. Para saber mais sobre a metodologia de investigação, faça uma consulta para falar com os nossos especialistas do setor.
Personalização disponível
A Data Bridge Market Research é líder em investigação formativa avançada. Orgulhamo-nos de servir os nossos clientes novos e existentes com dados e análises que correspondem e atendem aos seus objetivos. O relatório pode ser personalizado para incluir análise de tendências de preços de marcas-alvo, compreensão do mercado para países adicionais (solicite a lista de países), dados de resultados de ensaios clínicos, revisão de literatura, mercado remodelado e análise de base de produtos . A análise de mercado dos concorrentes-alvo pode ser analisada desde análises baseadas em tecnologia até estratégias de carteira de mercado. Podemos adicionar quantos concorrentes necessitar de dados no formato e estilo de dados que procura. A nossa equipa de analistas também pode fornecer dados em tabelas dinâmicas de ficheiros Excel em bruto (livro de factos) ou pode ajudá-lo a criar apresentações a partir dos conjuntos de dados disponíveis no relatório.

