Middle East and Africa Raised Garden Beds Market, By Product Type (Wood Bed, Polypropylene Resin Bed, Metal Bed and Others), Shape (Square, Rectangular, Oval and Round), Price Range (Economy/Mid-Range and Premium), Application (Vegetable, Herb, Flowers, Fruits and Others), End Use (Residential and Commercial), Sales Channel (Wholesalers/Distributors, Exclusive Stores, Multibrand Stores, Online Retailers and Other Sales Channels) - Industry Trends and Forecast to 2029.
Middle East and Africa Raised Garden Beds Market Analysis and Insights
Improvements in soil content and drainage and surge in the investment in raised garden beds are expected to drive the demand for Middle East and Africa raised garden beds market. However, risks regarding high temperature in summers and rising construction and development costs may further restrict the market's growth.
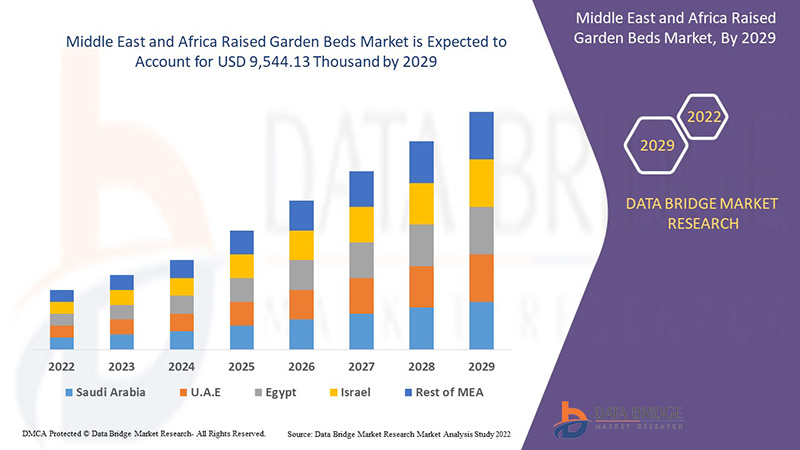
Data Bridge Market Research analyzes that Middle East and Africa raised garden beds market is expected to reach the value of USD 9,544.13 thousand by 2029, at a CAGR of 3.6% during the forecast period. Wood bed accounts for the largest segment in the market. This market report also covers pricing analysis, patent analysis and technological advancements in depth.
|
Report Metric |
Details |
|
Forecast Period |
2022 to 2029 |
|
Base Year |
2021 |
|
Historic Years |
2020 (Customizable to 2019 - 2014) |
|
Quantitative Units |
Revenue in USD Thousand |
|
Segments Covered |
By Product Type (Wood Bed, Polypropylene Resin Bed, Metal Bed, and Others), Shape (Square, Rectangular, Oval, and Round), Price Range (Economy/Mid-Range and Premium), Application (Vegetable, Herb, Flowers, Fruits, and Others), End Use (Residential and Commercial), Sales Channel (Wholesalers/Distributors, Exclusive Stores, Multibrand Stores, Online Retailers, and Other Sales Channels) |
|
Countries Covered |
South Africa, Saudi Arabia, Egypt, Israel, United Arab Emirates and rest of Middle East and Africa. |
|
Market Players Covered |
Gardener's Supply Company, Keter, Everbloom Garden, Vegega, MinifarmBox LLC, JelionGarden, Raised Cedar Garden Beds, VegCradle., Birdies Garden Products, Greenes Fence Company, Vego Garden, CedarCraft, Durable GreenBed, Naturalyards, LLC, and Vegepod USA among others |
Market Definition
Raised garden beds are freestanding garden beds constructed above the natural terrain. They are elevated a few inches or more above the soil level, and just wide enough to reach across by hand. They can be made in any shape and size. They can range from a simple rectangular plateau of soil to a more elaborate bed framed in wood, metal, stone, and plastic blocks, among others. These structures allow for better soil, lessen the need for bending, weeding, maximize the growing space, and ward off pests.
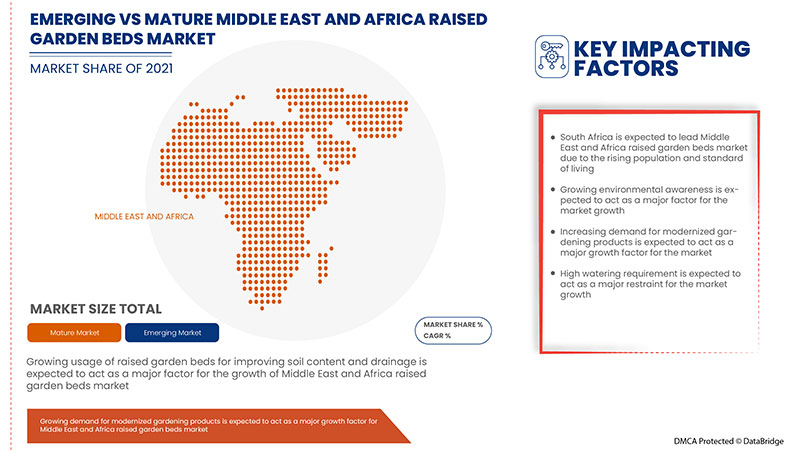
Raised garden beds allow more garden space for growing plants as they can easily be built on undesirable growing areas. Soil that is raised off the ground can be controlled for quality, creating a warm, nutrient-rich, well-draining growing environment for optimal root development and plant growth. They improve growing conditions for plants by lifting their roots above poor soil. They can be used effectively to control erosion and recycle and conserve water and nutrients by building them along contour lines on slopes. They enable the elderly and physically disabled to grow vegetables without having to bend over to tend them.
Middle East and Africa Raised Garden Beds Market Dynamics
Drivers
-
Improvements in soil content and drainage
Raised garden beds are an excellent way to grow a wide variety of plants, and are especially popular for growing fruits and vegetables. They are an excellent way to improve drainage and can be used to introduce different soil types to the garden. Raised garden beds are an excellent choice because their soils warm up faster, extending the growing season. They improve soil drainage, allow for adequate root growth, and can be quite attractive. These enhancement factors are not difficult to implement and can be completed by any gardener who is interested in gardening. As a result of the improved soil content and drainage, demand for these beds is expected to increase, resulting in market growth.
-
Surge in the investment in raised garden beds
Raised bed gardening enables people to grow large quantities of crops. This is because the beds provide more soil depth, allowing for the cultivation of a wider range of crops in a limited amount of space. Roots have enough room to grow without competing with one another. They also allow you to grow plants at different depths. If people want to grow things in their garden but don't have enough planting space, a raised garden bed is the ideal solution. As a result, they will make fewer trips to the grocery store for fruits and vegetables, which will help them save a surprising amount of money. If people do this over time, their savings will only grow. Therefore, the rising investments in these beds are expected to propel the market forward.
Opportunities
-
Growing popularity of gardening as a hobby among the consumers
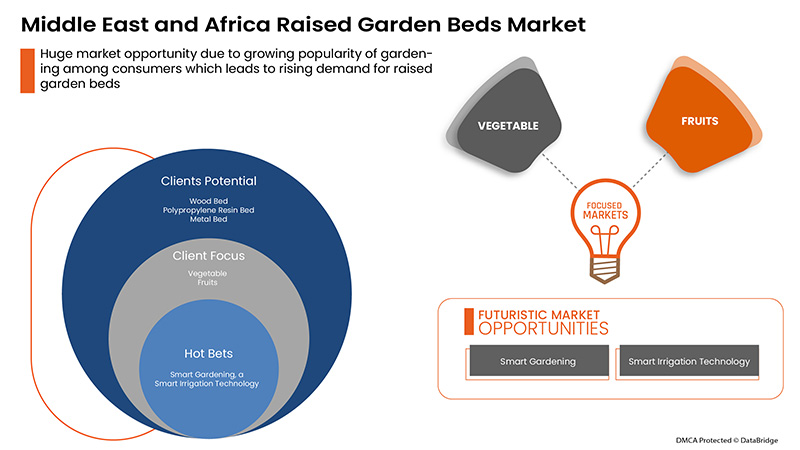
Gardening has always been touted as a relaxing recreational activity. From a mental perspective, gardening is a way for adults and even children to cope with boredom. It is associated with mental clarity and a feeling of reward and offers many physical benefits as well. People around the world are turning to gardening as a soothing and family-friendly hobby. This wave of new gardeners has led to an increase in the growth of the gardening industry as a whole. The growing popularity of local, organic, and homemade food traits has increased the interest in gardening. Homegrown vegetables often taste better. The fruits and vegetables that are produced also have a positive impact on the diet. Thus, the growing popularity of gardening increases the demand for these beds and may provide growth opportunities for the market.
Restraints/Challenges
- Risks regarding high temperature in summers
The rate of plant growth and development is dependent upon the temperature surrounding the plant. Different varieties of plants have specific temperature ranges represented by minimum, maximum, and optimum which are essential for grain and fruit production. Although, temperature effects on plant growth and development depend upon plant species, under the increasing climate change scenario there are potential risks of temperatures exceeding the optimum range for many species. Heat waves or extreme temperatures are projected to become more intense in the coming years. The effect of temperature on plants varies widely and is influenced by various factors such as exposure to sunlight, moisture drainage, elevation, and amount of precipitation. Therefore, the risks regarding high temperature in summers causing these beds to dry out more readily may hinder the market growth.
- Rising construction and development costs
The changes in the construction industry over the years such as the continuous development of construction technology, diversified materials, and the opening of the construction market have led to an increase in construction costs. The manufacturing of many materials used in construction is highly energy intensive. For materials such as steel and cement, the majority of the energy used comes from coal. Natural gas is mainly used in the production of bricks and roof tiles. This high dependence of construction materials on coal, gas, and electricity makes it vulnerable to increasing energy prices. Moreover, the rising construction and development costs in the form of inputs such as materials, labor, tools, and equipment required in the construction of these beds along with the high cost of maintenance may restrict the market growth.
Post-COVID-19 Impact on Middle East and Africa Raised Garden Beds Market
COVID-19 impacted various manufacturing industries in the year 2020-2021 as it led to the closure of workplaces, disruption of supply chains, and restrictions on transportation. Due to the lockdown, the market has experienced a downfall in sales due to the retail outlets being shut down and the restrictions on customer access over the past few years.
However, the growth of the market post-pandemic period is attributed to more people working from home and spending quality time at home. This has led to the increased popularity of gardening among people due to the various health benefits and growing popularity of organic fruits and vegetables. The key market players are making various strategic decisions to bounce back post-COVID-19. The players are conducting multiple R&D activities to improve their offerings. They are enhancing their market share by exploring different retail channels and expanding into new regions.
Recent Developments
- In October 2021, Keter acquired Casual Living Unlimited LLC and its sister company, Trigon Plastics LLC. This acquisition would help the company to make a crucial step towards better integration of circular capabilities under their control by providing a consistent, in-house supply of recycled resins for their manufacturing.
- In May 2021, Keter announced a new partnership with the Education Fund's Food Forests for Schools initiative. They want to counteract climate change via hands-on community engagement and support for the Education Fund's critical efforts to develop environmental awareness and build engaging outdoor areas for schools to learn about and appreciate nature.
Middle East and Africa Raised Garden Beds Market Scope
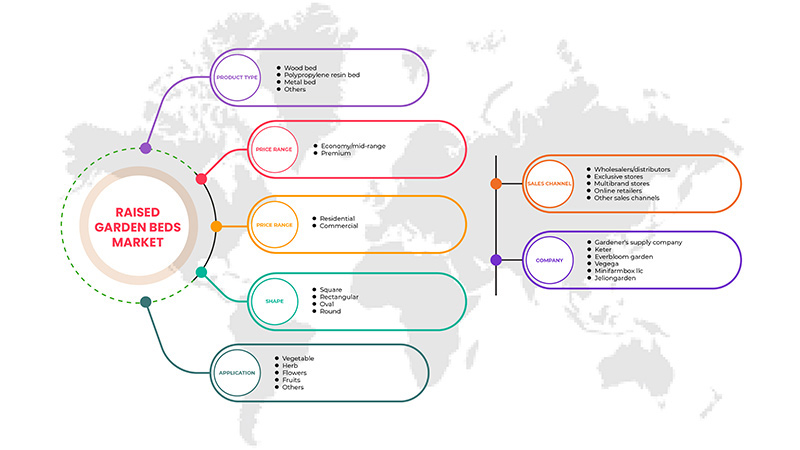
Middle East and Africa raised garden beds market is segmented based on product type, shape, price range, application, end use, and sales channel. The growth amongst these segments will help you analyze major growth segments in the industries and provide the users with a valuable market overview and market insights to help them make strategic decisions for identifying core market applications.
Product Type
- Wood Bed
- Polypropylene Resin Bed
- Metal Bed
- Others
Based on product type, the market is segmented into wood bed, polypropylene resin bed, metal bed and others.
Shape
- Square
- Rectangular
- Oval
- Round
Based on shape, the market is segmented into square, rectangular, oval and round.
Price Range
- Economy/Mid-Range
- Premium
Based on price range, the market is segmented into economy/mid-range and premium.
Application
- Vegetable
- Herb
- Flowers
- Fruits
- Others
Based on application, the market is segmented into vegetable, herb, flowers, fruits and others.
End Use
- Residential
- Commercial
Based on end use, the market is segmented into residential and commercial.
Sales Channel
- Wholesalers/Distributors
- Exclusive Stores
- Multibrand Stores
- Online Retailers
- Other Sales Channels
Based on sales channel, the market is segmented into wholesalers/distributors, exclusive stores, multibrand stores, online retailers and other sales channels.
Middle East and Africa Raised Garden Beds Market Regional Analysis/Insights
Middle East and Africa raised garden beds market is analyzed, and market size insights and trends are provided by country, product type, shape, price range, application, end use, and sales channel as referenced above.
The market covers countries such as South Africa, Saudi Arabia, Egypt, Israel, United Arab Emirates and rest of Middle East and Africa.
South Africa is expected to dominate the market due to the rising population and the advancement in the standard of living in the Middle East and Africa region. Egypt and Saudi Arabia are two more countries where the demand is increasing.
The country section of this market report also provides individual market impacting factors and domestic regulation changes that impact the market's current and future trends. Data points such as new sales, replacement sales, country demographics, disease epidemiology, and import-export tariffs are some of the significant pointers used to forecast the market scenario for individual countries. Also, the presence and availability of Middle East and Africa brands and their challenges faced due to large or scarce competition from local and domestic brands and the impact of sales channels are considered while providing forecast analysis of the country data.
Competitive Landscape and Middle East and Africa Raised Garden Beds Market Share Analysis
Middle East and Africa raised garden beds market competitive landscape provides details of the competitor. Details included are company overview, company financials, revenue generated, market potential, investment in research and development, new market initiatives, Middle East and Africa presence, production sites and facilities, production capacities, company strengths and weaknesses, solution launch, product width and breadth, and application dominance. The above data points are only related to the companies' focus on the market.
Some of the major players operating in the market are Gardener's Supply Company, Keter, Everbloom Garden, Vegega, MinifarmBox LLC, JelionGarden, Raised Cedar Garden Beds, VegCradle., Birdies Garden Products, Greenes Fence Company, Vego Garden, CedarCraft, Durable GreenBed, Naturalyards, LLC, and Vegepod USA among others.
SKU-
Obtenha acesso online ao relatório sobre a primeira nuvem de inteligência de mercado do mundo

- Painel interativo de análise de dados
- Painel de análise da empresa para oportunidades de elevado potencial de crescimento
- Acesso de analista de pesquisa para personalização e customização. consultas
- Análise da concorrência com painel interativo
- Últimas notícias, atualizações e atualizações Análise de tendências
- Aproveite o poder da análise de benchmark para um rastreio abrangente da concorrência
Índice
1 INTRODUÇÃO
1.1 OBJETIVOS DO ESTUDO
1.2 DEFINIÇÃO DE MERCADO
1.3 PANORAMA GERAL DO MERCADO DE CANTOS ELEVADOS DO MÉDIO ORIENTE E DE ÁFRICA
1.4 LIMITAÇÃO
1,5 MERCADOS COBERTOS
2 SEGMENTAÇÃO DE MERCADO
2.1 MERCADOS COBERTOS
2.2 ÂMBITO GEOGRÁFICO
2,3 ANOS CONSIDERADOS PARA O ESTUDO
2.4 MOEDA E PREÇOS
2.5 MODELO DE VALIDAÇÃO DE DADOS TRIPÉ DBMR
2.6 CURVA DA LINHA DE VIDA DO TIPO DE PRODUTO
2.7 MODELAÇÃO MULTIVARIADA
2.8 ENTREVISTAS PRINCIPAIS COM PRINCIPAIS LÍDERES DE OPINIÃO
2.9 GRADE DE POSIÇÃO DE MERCADO DBMR
2.1 GRADE DE COBERTURA DE APLICAÇÃO DE MERCADO
2.11 MATRIZ DE DESAFIOS DO MERCADO DBMR
2.12 ANÁLISE DE PARTICIPAÇÃO DOS FORNECEDORES DBMR
2.13 FONTES SECUNDÁRIAS
2.14 PREMISSAS
3 RESUMO EXECUTIVO
4 INSIGHTS PREMIUM
4.1 COMPORTAMENTO DE COMPRA DO CONSUMIDOR
4.1.1 FATORES CULTURAIS
4.1.2 FATORES SOCIAIS
4.1.3 FATORES PESSOAIS
4.1.4 FATORES PSICOLÓGICOS
4.1.5 FATORES ECONÓMICOS
4.2 FATORES QUE AFETAM A DECISÃO DE COMPRA
4.3 AS CINCO FORÇAS DE PORTER:
4.3.1 AMEAÇA DE NOVOS ENTRADANTES
4.3.2 AMEAÇA DE SUBSTITUTOS
4.3.3 PODER DE BARGANHA DO CLIENTE
4.3.4 PODER DE NEGOCIAÇÃO DO FORNECEDOR
4.3.5 CONCORRÊNCIA INTERNA (RIVALIDADE)
4.4 CRITÉRIOS DE SELEÇÃO DE FORNECEDORES
4.5 ANÁLISE DA CADEIA DE FORNECIMENTO
4.5.1 AQUISIÇÃO DE MATÉRIA-PRIMA
4.5.2 FABRICAÇÃO E EMBALAMENTO
4.5.3 MARKETING E DISTRIBUIÇÃO
4.5.4 UTILIZADORES FINAIS
4.6 COBERTURA REGULAMENTAR
4.7 CRITÉRIOS DE ADOÇÃO DO PRODUTO
4.7.1 VISÃO GERAL
4.7.2 CONSCIÊNCIA DO PRODUTO
4.7.3 INTERESSE NO PRODUTO
4.7.4 AVALIAÇÃO DO PRODUTO
4.7.5 TESTE DO PRODUTO
4.7.6 ADOÇÃO DO PRODUTO
4.7.7 CONCLUSÃO
5 PANORAMA GERAL DO MERCADO
5.1 MOTORISTAS
5.1.1 MELHORIAS NO CONTEÚDO DO SOLO E DA DRENAGEM
5.1.2 AUMENTO DO INVESTIMENTO EM CANTOS ELEVADOS
5.1.3 AUMENTO DAS ATIVIDADES DE HORTA DOMÉSTICA
5.1.4 CRESCENTE SENSIBILIZAÇÃO PARA A PRESERVAÇÃO DO MEIO AMBIENTE
5.2 RESTRIÇÕES
5.2.1 RISCOS RELATIVOS ÀS ELEVADAS TEMPERATURAS NO VERÃO
5.2.2 AUMENTO DOS CUSTOS DE CONSTRUÇÃO E DESENVOLVIMENTO
5.2.3 NECESSIDADE DE MAIS IRRIGAÇÃO
5.3 OPORTUNIDADES
5.3.1 CRESCENTE POPULARIDADE DA JARDINAGEM COMO HOBBY ENTRE OS CONSUMIDORES
5.3.2 MUDANÇA PARA A MELHORIA DO PADRÃO DE VIDA
5.3.3 PENETRAÇÃO DE CANTOS ELEVADOS ATRAVÉS DE SITES DE COMÉRCIO ELETRÓNICO
5.4 DESAFIOS
5.4.1 CUSTOS ELEVADOS ASSOCIADOS À COMPRA DE CANTOS ELEVADOS
5.4.2 REQUISITO DE MANUTENÇÃO ALTAMENTE EFICIENTE
6 MERCADO DE CANTOS ELEVADOS DO ORIENTE MÉDIO E ÁFRICA, POR TIPO DE PRODUTO
6.1 VISÃO GERAL
6.2 CAMA DE MADEIRA
6.2.1 CAMA DE MADEIRA, POR TIPO DE MATERIAL
6.2.1.1 SEQUÊNCIA
6.2.1.2 CEDRO
6.2.1.3 PINHO NÃO TRATADO
6.2.1.4 Abetos
6.3 LEITO DE RESINA DE POLIPROPILENO
6.4 CAMA DE METAL
6.5 OUTROS
7 MERCADO DE CANTOS ELEVADOS DO ORIENTE MÉDIO E ÁFRICA, POR SHAPE
7.1 VISÃO GERAL
7,2 QUADRADOS
7.3 RETANGULAR
7.4 OVAL
7,5 RODADAS
8 MERCADOS DE CANTOS ELEVADOS DO ORIENTE MÉDIO E ÁFRICA, POR FAIXA DE PREÇO
8.1 VISÃO GERAL
8.2 ECONOMIA/FAIXA MÉDIA
8.3 PREMIUM
9 MERCADO DE CANTOS ELEVADOS DO ORIENTE MÉDIO E ÁFRICA, POR APLICAÇÃO
9.1 VISÃO GERAL
9.2 VEGETAL
9.3 ERVA
9.4 FLORES
9,5 FRUTAS
9.6 OUTROS
10 MERCADOS DE CANTOS ELEVADOS DO ORIENTE MÉDIO E ÁFRICA, POR USO FINAL
10.1 VISÃO GERAL
10.2 RESIDENCIAL
10.2.1 RESIDENCIAL, POR TIPO DE PRODUTO
10.2.1.1 CAMA DE MADEIRA
10.2.1.2 LEITO DE RESINA DE POLIPROPILENO
10.2.1.3 CAMA DE METAL
10.2.1.4 OUTROS
10.3 COMERCIAL
10.3.1 COMERCIAL, PARA USO FINAL
10.3.1.1 PARQUES PÚBLICOS
10.3.1.2 CAMPO DESPORTIVO
10.3.1.3 ESCOLAS
10.3.1.4 FACULDADES
10.3.1.5 INSTITUIÇÕES GOVERNAMENTAIS
10.3.1.6 OUTROS
10.3.2 COMERCIAL, POR TIPO DE PRODUTO
10.3.2.1 CAMA DE MADEIRA
10.3.2.2 LEITO DE RESINA DE POLIPROPILENO
10.3.2.3 CAMA DE METAL
10.3.2.4 OUTROS
11 MERCADO DE CANTOS ELEVADOS DO ORIENTE MÉDIO E ÁFRICA, POR CANAL DE VENDAS
11.1 VISÃO GERAL
11.2 ATACADISTAS/DISTRIBUIDORES
11.3 LOJAS EXCLUSIVAS
11.4 LOJAS MULTIMARCAS
11.5 REVENDEDORES ONLINE
11.6 OUTROS CANAIS DE VENDA
12 MERCADOS DE CANTOS ELEVADOS NO MÉDIO ORIENTE E EM ÁFRICA, POR REGIÃO
12.1 ORIENTE MÉDIO E ÁFRICA
12.1.1 ÁFRICA DO SUL
12.1.2 EGITO
12.1.3 ARÁBIA SAUDITA
12.1.4 EMIRADOS ÁRABES UNIDOS
12.1.5 ISRAEL
12.1.6 RESTANTE ORIENTE MÉDIO E ÁFRICA
13 MERCADO DE CANTOS DE JARDIM ELEVADOS DO ORIENTE MÉDIO E ÁFRICA, PAISAGISMO DA EMPRESA
13.1 ANÁLISE DE AÇÕES DA EMPRESA: MÉDIO ORIENTE E ÁFRICA
13.2 AQUISIÇÃO
13.3 PARCERIA
13.4 LANÇAMENTO DO PRODUTO
13.5 EXPANSÃO
14 ANÁLISE SWOT
15 PERFIS DE EMPRESAS
15.1 EMPRESA DE ARTIGOS PARA JARDINEIRO
15.1.1 RESUMO DA EMPRESA
15.1.2 ANÁLISE DAS AÇÕES DA EMPRESA
15.1.3 PORTFÓLIO DE PRODUTOS
15.1.4 DESENVOLVIMENTOS RECENTES
15,2 KETER
15.2.1 RESUMO DA EMPRESA
15.2.2 ANÁLISE DAS AÇÕES DA EMPRESA
15.2.3 PORTFÓLIO DE PRODUTOS
15.2.4 DESENVOLVIMENTOS RECENTES
15.3 JARDIM EVERBLOOM
15.3.1 RESUMO DA EMPRESA
15.3.2 ANÁLISE DAS AÇÕES DA EMPRESA
15.3.3 PORTFÓLIO DE PRODUTOS
15.3.4 DESENVOLVIMENTOS RECENTES
15.4 VEGEGA
15.4.1 RESUMO DA EMPRESA
15.4.2 ANÁLISE DAS AÇÕES DA EMPRESA
15.4.3 PORTFÓLIO DE PRODUTOS
15.4.4 DESENVOLVIMENTO RECENTE
15.5 MINIFARMBOX LLC
15.5.1 RESUMO DA EMPRESA
15.5.2 ANÁLISE DAS AÇÕES DA EMPRESA
15.5.3 PORTFÓLIO DE PRODUTOS
15.5.4 DESENVOLVIMENTOS RECENTES
15.6 JELIONGARDEN
15.6.1 RESUMO DA EMPRESA
15.6.2 PORTFÓLIO DE PRODUTOS
15.6.3 DESENVOLVIMENTO RECENTE
15.7 CANTOS DE CEDRO ELEVADOS
15.7.1 RESUMO DA EMPRESA
15.7.2 PORTFÓLIO DE PRODUTOS
15.7.3 DESENVOLVIMENTO RECENTE
15.8 VEGCRADLE.
15.8.1 RESUMO DA EMPRESA
15.8.2 PORTFÓLIO DE PRODUTOS
15.8.3 DESENVOLVIMENTO RECENTE
15.9 BIRDIES PRODUTOS DE JARDIM
15.9.1 RESUMO DA EMPRESA
15.9.2 PORTFÓLIO DE PRODUTOS
15.9.3 DESENVOLVIMENTO RECENTE
15.1 EMPRESA DE CERCA GREENES
15.10.1 RESUMO DA EMPRESA
15.10.2 PORTFÓLIO DE PRODUTOS
15.10.3 DESENVOLVIMENTOS RECENTES
15.11 JARDIM VEGO
15.11.1 RESUMO DA EMPRESA
15.11.2 PORTFÓLIO DE PRODUTOS
15.11.3 DESENVOLVIMENTOS RECENTES
15.12 CEDARCRAFT
15.12.1 RESUMO DA EMPRESA
15.12.2 PORTFÓLIO DE PRODUTOS
15.12.3 DESENVOLVIMENTO RECENTE
15.13 CANTOS VERDES DURÁVEIS
15.13.1 RESUMO DA EMPRESA
15.13.2 PORTFÓLIO DE PRODUTOS
15.13.3 DESENVOLVIMENTO RECENTE
15.14 NATURALYARDS, LLC
15.14.1 RESUMO DA EMPRESA
15.14.2 PORTFÓLIO DE PRODUTOS
15.14.3 DESENVOLVIMENTO RECENTE
15.15 VEGEPOD EUA
15.15.1 RESUMO DA EMPRESA
15.15.2 PORTFÓLIO DE PRODUTOS
15.15.3 DESENVOLVIMENTOS RECENTES
16 QUESTIONÁRIO
17 RELATÓRIOS RELACIONADOS
Lista de Tabela
QUADRO 1 MERCADO DE CANTOS ELEVADOS NO MÉDIO ORIENTE E EM ÁFRICA, POR TIPO DE PRODUTO, 2020-2029 (MIL USD)
QUADRO 2: CANTOS DE MADEIRA NO MERCADO DE CANTOS ELEVADOS DO ORIENTE MÉDIO E ÁFRICA, POR REGIÃO, 2020-2029 (MIL USD)
QUADRO 3: CANTOS DE MADEIRA NO MERCADO DE CANTOS ELEVADOS DO MÉDIO ORIENTE E DE ÁFRICA, POR TIPO DE MATERIAL, 2020-2029 (MIL USD)
QUADRO 4: MERCADO DE CANTOS DE RESINA DE POLIPROPILENO NO MÉDIO ORIENTE E EM ÁFRICA, POR REGIÃO, 2020-2029 (MIL USD)
QUADRO 5: MERCADO DE CANTOS ELEVADOS PARA JARDINS ELEVADOS NO MÉDIO ORIENTE E EM ÁFRICA, POR REGIÃO, 2020-2029 (MIL USD)
QUADRO 6 MÉDIO ORIENTE E ÁFRICA OUTROS NO MERCADO DE CANTOS ELEVADOS, POR REGIÃO, 2020-2029 (MIL USD)
QUADRO 7 MERCADO DE CANTOS ELEVADOS NO MÉDIO ORIENTE E EM ÁFRICA, POR FORMATO, 2020-2029 (MIL USD)
QUADRO 8 PRAÇA DO ORIENTE MÉDIO E ÁFRICA NO MERCADO DE CANTOS ELEVADOS, POR REGIÃO, 2020-2029 (MIL USD)
QUADRO 9 ORIENTE MÉDIO E ÁFRICA RETANGULAR NO MERCADO DE CANTOS ELEVADOS, POR REGIÃO, 2020-2029 (MIL USD)
QUADRO 10 ORIENTE MÉDIO E ÁFRICA OVAL NO MERCADO DE CANTOS ELEVADOS, POR REGIÃO, 2020-2029 (MIL USD)
QUADRO 11 - MÉDIO ORIENTE E ÁFRICA - JORNADA NO MERCADO DE CANTOS ELEVADOS, POR REGIÃO, 2020-2029 (MIL USD)
QUADRO 12 MERCADO DE CANTOS ELEVADOS NO MÉDIO ORIENTE E EM ÁFRICA, POR FAIXA DE PREÇO, 2020-2029 (MIL USD)
QUADRO 13 ECONOMIA/MEIO-ALCANCE DO MERCADO DE CANTOS ELEVADOS NO MÉDIO ORIENTE E EM ÁFRICA, POR REGIÃO, 2020-2029 (MIL USD)
QUADRO 14 ORIENTE MÉDIO E ÁFRICA: PREMIUM NO MERCADO DE CANTOS ELEVADOS, POR REGIÃO, 2020-2029 (MIL USD)
QUADRO 15 MERCADO DE CANTOS ELEVADOS NO MÉDIO ORIENTE E EM ÁFRICA, POR APLICAÇÃO, 2020-2029 (MIL USD)
QUADRO 16 MERCADO DE HORTÍCOLAS ELEVADAS NO MÉDIO ORIENTE E EM ÁFRICA, POR REGIÃO, 2020-2029 (MIL USD)
QUADRO 17 MERCADO DE ERVAS NO ORIENTE MÉDIO E ÁFRICA EM CANTOS ELEVADOS, POR REGIÃO, 2020-2029 (MIL USD)
QUADRO 18 FLORES DO ORIENTE MÉDIO E DE ÁFRICA NO MERCADO DE CANTOS ELEVADOS, POR REGIÃO, 2020-2029 (MIL USD)
QUADRO 19 FRUTAS NO MERCADO DE CANTOS ELEVADOS DO ORIENTE MÉDIO E DE ÁFRICA, POR REGIÃO, 2020-2029 (MIL USD)
QUADRO 20 MÉDIO ORIENTE E ÁFRICA OUTROS NO MERCADO DE CANTOS ELEVADOS, POR REGIÃO, 2020-2029 (MIL USD)
QUADRO 21 MERCADO DE CANTOS ELEVADOS NO MÉDIO ORIENTE E EM ÁFRICA, POR UTILIZAÇÃO FINAL, 2020-2029 (MIL USD)
QUADRO 22 MERCADO DE CANTOS ELEVADOS RESIDENCIAIS NO MÉDIO ORIENTE E EM ÁFRICA, POR REGIÃO, 2020-2029 (MIL USD)
QUADRO 23 MERCADO DE CANTOS ELEVADOS PARA JARDINS RESIDENCIAIS NO MÉDIO ORIENTE E EM ÁFRICA, POR TIPO DE PRODUTO, 2020-2029 (MIL USD)
QUADRO 24 MERCADO DE CANTOS ELEVADOS NO MÉDIO ORIENTE E EM ÁFRICA, POR REGIÃO, 2020-2029 (MIL USD)
QUADRO 25 MERCADO DE CANTOS ELEVADOS NO MÉDIO ORIENTE E EM ÁFRICA, POR UTILIZAÇÃO FINAL, 2020-2029 (MIL USD)
QUADRO 26 MERCADO DE CANTOS ELEVADOS NO MÉDIO ORIENTE E EM ÁFRICA, POR TIPO DE PRODUTO, 2020-2029 (MIL USD)
QUADRO 27 MERCADO DE CANTOS ELEVADOS NO MÉDIO ORIENTE E EM ÁFRICA, POR CANAL DE VENDAS, 2020-2029 (MIL USD)
QUADRO 28 ATACADISTAS/DISTRIBUIDORES DO ORIENTE MÉDIO E ÁFRICA NO MERCADO DE CANTOS ELEVADOS PARA JARDINS, POR REGIÃO, 2020-2029 (MIL USD)
QUADRO 29 LOJAS EXCLUSIVAS NO ORIENTE MÉDIO E ÁFRICA NO MERCADO DE CANTOS ELEVADOS, POR REGIÃO, 2020-2029 (MIL USD)
QUADRO 30 LOJAS MULTIMARCAS DO ORIENTE MÉDIO E ÁFRICA NO MERCADO DE CANTOS ELEVADOS, POR REGIÃO, 2020-2029 (MIL USD)
QUADRO 31 REVENDEDORES ONLINE DO ORIENTE MÉDIO E ÁFRICA NO MERCADO DE CANTOS ELEVADOS PARA JARDINS, POR REGIÃO, 2020-2029 (MIL USD)
QUADRO 32 ORIENTE MÉDIO E ÁFRICA OUTROS CANAIS DE VENDA NO MERCADO DE CANTOS ELEVADOS, POR REGIÃO, 2020-2029 (MIL USD)
QUADRO 33 MERCADO DE CANTOS ELEVADOS NO MÉDIO ORIENTE E EM ÁFRICA, POR PAÍS, 2020-2029 (MIL USD)
QUADRO 34 MERCADO DE CANTOS ELEVADOS NO MÉDIO ORIENTE E EM ÁFRICA, POR TIPO DE PRODUTO, 2020-2029 (MIL USD)
QUADRO 35 CANTOS DE MADEIRA NO MERCADO DE CANTOS ELEVADOS DO ORIENTE MÉDIO E DE ÁFRICA, POR TIPO DE PRODUTO, 2020-2029 (MIL USD)
QUADRO 36 MERCADO DE CANTOS ELEVADOS NO MÉDIO ORIENTE E EM ÁFRICA, POR FORMATO, 2020-2029 (MIL USD)
QUADRO 37 MERCADO DE CANTOS ELEVADOS NO MÉDIO ORIENTE E EM ÁFRICA, POR FAIXA DE PREÇOS, 2020-2029 (MIL USD)
QUADRO 38 MERCADO DE CANTOS ELEVADOS NO MÉDIO ORIENTE E EM ÁFRICA, POR APLICAÇÃO, 2020-2029 (MIL USD)
QUADRO 39 MERCADO DE CANTOS ELEVADOS NO MÉDIO ORIENTE E EM ÁFRICA, POR UTILIZAÇÃO FINAL, 2020-2029 (MIL USD)
QUADRO 40 MERCADO DE CANTOS ELEVADOS PARA JARDINS RESIDENCIAIS NO MÉDIO ORIENTE E EM ÁFRICA, POR TIPO DE PRODUTO, 2020-2029 (MIL USD)
QUADRO 41 MERCADO DE CANTOS ELEVADOS NO MÉDIO ORIENTE E EM ÁFRICA, POR UTILIZAÇÃO FINAL, 2020-2029 (MIL USD)
QUADRO 42 MERCADO DE CANTOS ELEVADOS NO MÉDIO ORIENTE E EM ÁFRICA, POR TIPO DE PRODUTO, 2020-2029 (MIL USD)
QUADRO 43 MERCADO DE CANTOS ELEVADOS NO MÉDIO ORIENTE E EM ÁFRICA, POR CANAL DE VENDAS, 2020-2029 (MIL USD)
QUADRO 44 MERCADO DE CANTOS ELEVADOS DA ÁFRICA DO SUL, POR TIPO DE PRODUTO, 2020-2029 (MIL USD)
QUADRO 45: MERCADO DE CANTOS DE MADEIRA NA ÁFRICA DO SUL PARA JARDINS ELEVADOS, POR TIPO DE PRODUTO, 2020-2029 (MIL USD)
QUADRO 46 MERCADO DE CANTOS ELEVADOS DA ÁFRICA DO SUL, POR FORMATO, 2020-2029 (MIL USD)
QUADRO 47 MERCADO DE CANTOS ELEVADOS DA ÁFRICA DO SUL, POR FAIXA DE PREÇOS, 2020-2029 (MIL USD)
QUADRO 48 MERCADO DE CANTOS ELEVADOS DA ÁFRICA DO SUL, POR APLICAÇÃO, 2020-2029 (MIL USD)
QUADRO 49 MERCADO DE CANTOS ELEVADOS DA ÁFRICA DO SUL, POR UTILIZAÇÃO FINAL, 2020-2029 (MIL USD)
QUADRO 50 MERCADO DE CANTOS ELEVADOS PARA JARDINS RESIDENCIAIS NA ÁFRICA DO SUL, POR TIPO DE PRODUTO, 2020-2029 (MIL USD)
QUADRO 51 MERCADO DE CANTOS ELEVADOS COMERCIAIS NA ÁFRICA DO SUL, POR UTILIZAÇÃO FINAL, 2020-2029 (MIL USD)
QUADRO 52 MERCADO DE CANTOS ELEVADOS COMERCIAIS NA ÁFRICA DO SUL, POR TIPO DE PRODUTO, 2020-2029 (MIL USD)
QUADRO 53 MERCADO DE CANTOS ELEVADOS DA ÁFRICA DO SUL, POR CANAL DE VENDAS, 2020-2029 (MIL USD)
QUADRO 54 MERCADO DE CANTOS ELEVADOS DO EGITO, POR TIPO DE PRODUTO, 2020-2029 (MIL USD)
QUADRO 55 CAMA DE MADEIRA DO EGITO NO MERCADO DE CANTOS ELEVADOS PARA JARDINS, POR TIPO DE PRODUTO, 2020-2029 (MIL USD)
QUADRO 56 MERCADO DE CANTOS ELEVADOS DO EGITO, POR FORMATO, 2020-2029 (MIL USD)
QUADRO 57 MERCADO DE CANTOS ELEVADOS DO EGITO, POR FAIXA DE PREÇO, 2020-2029 (MIL USD)
QUADRO 58 MERCADO DE CANTOS ELEVADOS DO EGITO, POR APLICAÇÃO, 2020-2029 (MIL USD)
QUADRO 59 MERCADO DE CANTOS ELEVADOS DO EGITO, POR UTILIZAÇÃO FINAL, 2020-2029 (MIL USD)
QUADRO 60 EGITO RESIDENCIAL NO MERCADO DE CANTOS ELEVADOS, POR TIPO DE PRODUTO, 2020-2029 (MIL USD)
QUADRO 61 EGITO COMERCIAL NO MERCADO DE CANTOS ELEVADOS, POR UTILIZAÇÃO FINAL, 2020-2029 (MIL USD)
QUADRO 62 MERCADO DE CANTOS ELEVADOS COMERCIAIS DO EGITO, POR TIPO DE PRODUTO, 2020-2029 (MIL USD)
QUADRO 63 MERCADO DE CANTOS ELEVADOS DO EGITO, POR CANAL DE VENDAS, 2020-2029 (MIL USD)
QUADRO 64 MERCADO DE CANTOS ELEVADOS DA ARÁBIA SAUDITA, POR TIPO DE PRODUTO, 2020-2029 (MIL USD)
QUADRO 65: CAMA DE MADEIRA NO MERCADO DE CANTOS ELEVADOS DA ARÁBIA SAUDITA, POR TIPO DE PRODUTO, 2020-2029 (MIL USD)
QUADRO 66 MERCADO DE CANTOS ELEVADOS DA ARÁBIA SAUDITA, POR FORMATO, 2020-2029 (MIL USD)
QUADRO 67 MERCADO DE CANTOS ELEVADOS DA ARÁBIA SAUDITA, POR FAIXA DE PREÇO, 2020-2029 (MIL USD)
QUADRO 68 MERCADO DE CANTOS ELEVADOS DA ARÁBIA SAUDITA, POR APLICAÇÃO, 2020-2029 (MIL USD)
QUADRO 69 MERCADO DE CANTOS ELEVADOS DA ARÁBIA SAUDITA, POR UTILIZAÇÃO FINAL, 2020-2029 (MIL USD)
QUADRO 70 RESIDENCIAIS NA ARÁBIA SAUDITA NO MERCADO DE CANTOS ELEVADOS, POR TIPO DE PRODUTO, 2020-2029 (MIL USD)
QUADRO 71 MERCADO DE CANTOS ELEVADOS DA ARÁBIA SAUDITA, COMERCIAL, POR UTILIZAÇÃO FINAL, 2020-2029 (MIL USD)
QUADRO 72 MERCADO DE CANTOS ELEVADOS DA ARÁBIA SAUDITA, POR TIPO DE PRODUTO, 2020-2029 (MIL USD)
QUADRO 73 MERCADO DE CANTOS ELEVADOS DA ARÁBIA SAUDITA, POR CANAL DE VENDAS, 2020-2029 (MIL USD)
QUADRO 74 MERCADO DE CANTOS ELEVADOS PARA JARDINS NOS EMIRADOS ÁRABES UNIDOS, POR TIPO DE PRODUTO, 2020-2029 (MIL USD)
QUADRO 75 MERCADO DE CANTOS DE MADEIRA PARA JARDINS ELEVADOS NOS EMIRADOS ÁRABES UNIDOS, POR TIPO DE PRODUTO, 2020-2029 (MIL USD)
QUADRO 76 MERCADO DE CANTOS ELEVADOS NOS EMIRADOS ÁRABES UNIDOS, POR FORMATO, 2020-2029 (MIL USD)
QUADRO 77 MERCADO DE CANTOS ELEVADOS DOS EMIRADOS ÁRABES UNIDOS, POR FAIXA DE PREÇOS, 2020-2029 (MIL USD)
QUADRO 78 MERCADO DE CANTOS ELEVADOS NOS EMIRADOS ÁRABES UNIDOS, POR APLICAÇÃO, 2020-2029 (MIL USD)
QUADRO 79 MERCADO DE CANTOS ELEVADOS NOS EMIRADOS ÁRABES UNIDOS, POR UTILIZAÇÃO FINAL, 2020-2029 (MIL USD)
QUADRO 80 MERCADO DE CANTOS ELEVADOS PARA JARDINS RESIDENCIAIS NOS EMIRADOS ÁRABES UNIDOS, POR TIPO DE PRODUTO, 2020-2029 (MIL USD)
QUADRO 81 EMIRADOS ÁRABES UNIDOS COMERCIAL NO MERCADO DE CANTOS ELEVADOS, POR UTILIZAÇÃO FINAL, 2020-2029 (MIL USD)
QUADRO 82 EMIRADOS ÁRABES UNIDOS COMERCIAL NO MERCADO DE CANTOS ELEVADOS, POR TIPO DE PRODUTO, 2020-2029 (MIL USD)
QUADRO 83 MERCADO DE CANTOS ELEVADOS NOS EMIRADOS ÁRABES UNIDOS, POR CANAL DE VENDAS, 2020-2029 (MIL USD)
QUADRO 84 MERCADO DE CANTOS ELEVADOS DE JARDIM DE ISRAEL, POR TIPO DE PRODUTO, 2020-2029 (MIL USD)
QUADRO 85 CAMA DE MADEIRA DE ISRAEL NO MERCADO DE CANTOS ELEVADOS PARA JARDINS, POR TIPO DE PRODUTO, 2020-2029 (MIL USD)
QUADRO 86 MERCADO DE CANTOS ELEVADOS DE JARDIM DE ISRAEL, POR FORMATO, 2020-2029 (MIL USD)
QUADRO 87 MERCADO DE CANTOS ELEVADOS DE JARDIM DE ISRAEL, POR FAIXA DE PREÇO, 2020-2029 (MIL USD)
QUADRO 88 MERCADO DE CANTOS ELEVADOS DE JARDIM DE ISRAEL, POR APLICAÇÃO, 2020-2029 (MIL USD)
QUADRO 89 MERCADO DE CANTOS ELEVADOS DE JARDIM DE ISRAEL, POR UTILIZAÇÃO FINAL, 2020-2029 (MIL USD)
QUADRO 90 RESIDENCIAL ISRAELITA NO MERCADO DE CANTOS ELEVADOS, POR TIPO DE PRODUTO, 2020-2029 (MIL USD)
QUADRO 91 ISRAEL COMERCIAL NO MERCADO DE CANTOS ELEVADOS, POR UTILIZAÇÃO FINAL, 2020-2029 (MIL USD)
QUADRO 92: MERCADO DE CANTOS ELEVADOS COMERCIAIS DE ISRAEL, POR TIPO DE PRODUTO, 2020-2029 (MIL USD)
QUADRO 93 MERCADO DE CANTOS ELEVADOS DE JARDIM DE ISRAEL, POR CANAL DE VENDAS, 2020-2029 (MIL USD)
QUADRO 94 MERCADO DE CANTOS ELEVADOS NO RESTANTE DO MÉDIO ORIENTE E ÁFRICA, POR TIPO DE PRODUTO, 2020-2029 (MIL USD)
Lista de Figura
FIGURA 1 MERCADO DE CANTOS ELEVADOS DO ORIENTE MÉDIO E ÁFRICA: SEGMENTAÇÃO
FIGURA 2 MERCADO DE CANTOS ELEVADOS NO MÉDIO ORIENTE E EM ÁFRICA: TRIANGULAÇÃO DE DADOS
FIGURA 3 MERCADO DE CANTOS ELEVADOS NO MÉDIO ORIENTE E EM ÁFRICA: ANÁLISE DROC
FIGURA 4 MERCADO DE CANTOS ELEVADOS NO ORIENTE MÉDIO E ÁFRICA: ANÁLISE DE MERCADO REGIONAL VS ORIENTE MÉDIO E ÁFRICA
FIGURA 5 MERCADO DE CANTOS ELEVADOS NO MÉDIO ORIENTE E EM ÁFRICA: ANÁLISE DE PESQUISA DA EMPRESA
FIGURA 6 MERCADO DE CANTOS ELEVADOS DO ORIENTE MÉDIO E ÁFRICA: A CURVA DA LINHA DE VIDA DO TIPO DE PRODUTO
FIGURA 7 MERCADO DE CANTOS ELEVADOS NO MÉDIO ORIENTE E EM ÁFRICA: MODELAÇÃO MULTIVARIADA
FIGURA 8 MERCADO DE CANTOS ELEVADOS NO MÉDIO ORIENTE E EM ÁFRICA: DEMOGRAFIA DA ENTREVISTA
FIGURA 9 MERCADO DE CANTOS ELEVADOS DO ORIENTE MÉDIO E ÁFRICA: GRADE DE POSIÇÃO DE MERCADO DBMR
FIGURA 10 MERCADO DE CANTOS ELEVADOS NO MÉDIO ORIENTE E ÁFRICA: GRADE DE COBERTURA DE APLICAÇÃO DE MERCADO
FIGURA 11 MERCADO DE CANTOS ELEVADOS NO MÉDIO ORIENTE E EM ÁFRICA: A MATRIZ DO DESAFIO DO MERCADO
FIGURA 12 MERCADO DE CANTOS ELEVADOS PARA JARDINS NO MÉDIO ORIENTE E EM ÁFRICA: ANÁLISE DA PARTICIPAÇÃO DOS FORNECEDORES
FIGURA 13 MERCADO DE CANTOS ELEVADOS NO MÉDIO ORIENTE E EM ÁFRICA: SEGMENTAÇÃO
FIGURA 14 O AUMENTO DO INVESTIMENTO EM CANTOS ELEVADOS DEVE IMPULSIONAR O MERCADO DE CANTOS ELEVADOS DO ORIENTE MÉDIO E DE ÁFRICA NO PERÍODO PREVISTO
FIGURA 15 O SEGMENTO DE CANTOS DE MADEIRA DEVE SER REPRESENTANTE DA MAIOR PARCIALIDADE DO MERCADO DE CANTOS ELEVADOS DO ORIENTE MÉDIO E ÁFRICA EM 2022 E 2029
FIGURA 16 ANÁLISE DA CADEIA DE FORNECIMENTO – MERCADO DE CANTOS ELEVADOS DO MÉDIO ORIENTE E ÁFRICA
FIGURA 17 MERCADO DE CANTOS ELEVADOS NO MÉDIO ORIENTE E EM ÁFRICA: CENÁRIO DE ADOÇÃO DO PRODUTO
FIGURA 18 MOTIVADORES, RESTRIÇÕES, OPORTUNIDADES E DESAFIOS DO MERCADO DE CANTOS ELEVADOS DO MÉDIO ORIENTE E DE ÁFRICA
FIGURA 19 MERCADO DE CANTOS ELEVADOS NO MÉDIO ORIENTE E EM ÁFRICA: POR TIPO DE PRODUTO, 2021
FIGURA 20 MERCADO DE CANTOS ELEVADOS NO MÉDIO ORIENTE E ÁFRICA: POR FORMATO, 2021
FIGURA 21 MERCADO DE CANTOS ELEVADOS NO MÉDIO ORIENTE E ÁFRICA: POR FAIXA DE PREÇOS, 2021
FIGURA 22 MERCADO DE CANTOS ELEVADOS NO MÉDIO ORIENTE E ÁFRICA: POR APLICAÇÃO, 2021
FIGURA 23 MERCADO DE CANTOS ELEVADOS NO MÉDIO ORIENTE E EM ÁFRICA: POR UTILIZADOR FINAL, 2021
FIGURA 24 MERCADO DE CANTOS ELEVADOS NO MÉDIO ORIENTE E EM ÁFRICA: POR CANAL DE VENDAS, 2021
FIGURA 25 MERCADO DE CANTOS ELEVADOS NO MÉDIO ORIENTE E EM ÁFRICA: RESUMO (2021)
FIGURA 26 MERCADO DE CANTOS ELEVADOS NO MÉDIO ORIENTE E EM ÁFRICA: POR PAÍS (2021)
FIGURA 27 MERCADO DE CANTOS ELEVADOS NO MÉDIO ORIENTE E EM ÁFRICA: POR PAÍS (2022 E 2029)
FIGURA 28 MERCADO DE CANTOS ELEVADOS NO MÉDIO ORIENTE E ÁFRICA: POR PAÍS (2021 E 2029)
FIGURA 29 MERCADO DE CANTOS ELEVADOS NO MÉDIO ORIENTE E EM ÁFRICA: POR TIPO DE PRODUTO (2022 - 2029)
FIGURA 30 MERCADO DE CANTOS ELEVADOS NO MÉDIO ORIENTE E EM ÁFRICA: PARTICIPAÇÃO DA EMPRESA EM 2021 (%)
Metodologia de Investigação
A recolha de dados e a análise do ano base são feitas através de módulos de recolha de dados com amostras grandes. A etapa inclui a obtenção de informações de mercado ou dados relacionados através de diversas fontes e estratégias. Inclui examinar e planear antecipadamente todos os dados adquiridos no passado. Da mesma forma, envolve o exame de inconsistências de informação observadas em diferentes fontes de informação. Os dados de mercado são analisados e estimados utilizando modelos estatísticos e coerentes de mercado. Além disso, a análise da quota de mercado e a análise das principais tendências são os principais fatores de sucesso no relatório de mercado. Para saber mais, solicite uma chamada de analista ou abra a sua consulta.
A principal metodologia de investigação utilizada pela equipa de investigação do DBMR é a triangulação de dados que envolve a mineração de dados, a análise do impacto das variáveis de dados no mercado e a validação primária (especialista do setor). Os modelos de dados incluem grelha de posicionamento de fornecedores, análise da linha de tempo do mercado, visão geral e guia de mercado, grelha de posicionamento da empresa, análise de patentes, análise de preços, análise da quota de mercado da empresa, normas de medição, análise global versus regional e de participação dos fornecedores. Para saber mais sobre a metodologia de investigação, faça uma consulta para falar com os nossos especialistas do setor.
Personalização disponível
A Data Bridge Market Research é líder em investigação formativa avançada. Orgulhamo-nos de servir os nossos clientes novos e existentes com dados e análises que correspondem e atendem aos seus objetivos. O relatório pode ser personalizado para incluir análise de tendências de preços de marcas-alvo, compreensão do mercado para países adicionais (solicite a lista de países), dados de resultados de ensaios clínicos, revisão de literatura, mercado remodelado e análise de base de produtos . A análise de mercado dos concorrentes-alvo pode ser analisada desde análises baseadas em tecnologia até estratégias de carteira de mercado. Podemos adicionar quantos concorrentes necessitar de dados no formato e estilo de dados que procura. A nossa equipa de analistas também pode fornecer dados em tabelas dinâmicas de ficheiros Excel em bruto (livro de factos) ou pode ajudá-lo a criar apresentações a partir dos conjuntos de dados disponíveis no relatório.

