North America Polyethylene Glycol Market, By Grade (PEG 200, PEG 300, PEG 400, PEG 600, PEG 1000, PEG 3350, PEG 4000, PEG 6000, PEG 8000, PEG 10000, and PEG 20000), Form (Opaque Liquid, White Waxy Solid, and Flakes/ Powder), Packaging Size (Plastic Bottles and Drums), Application (Healthcare, Building and Construction, Industrial, Cosmetics/Personal Care, and Others), Industry Trends and Forecast to 2030.
North America Polyethylene Glycol Market Analysis and Size
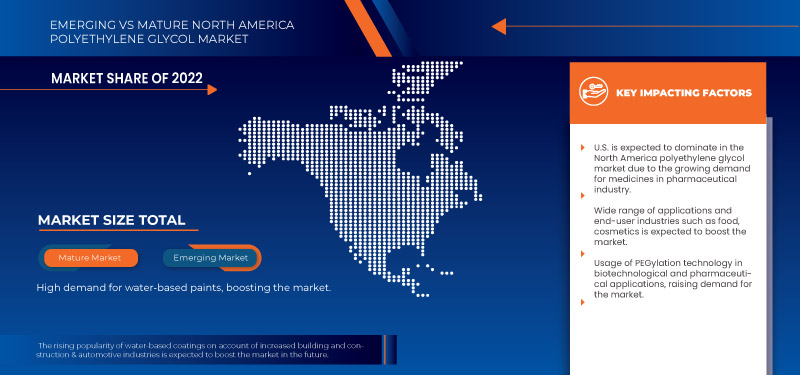
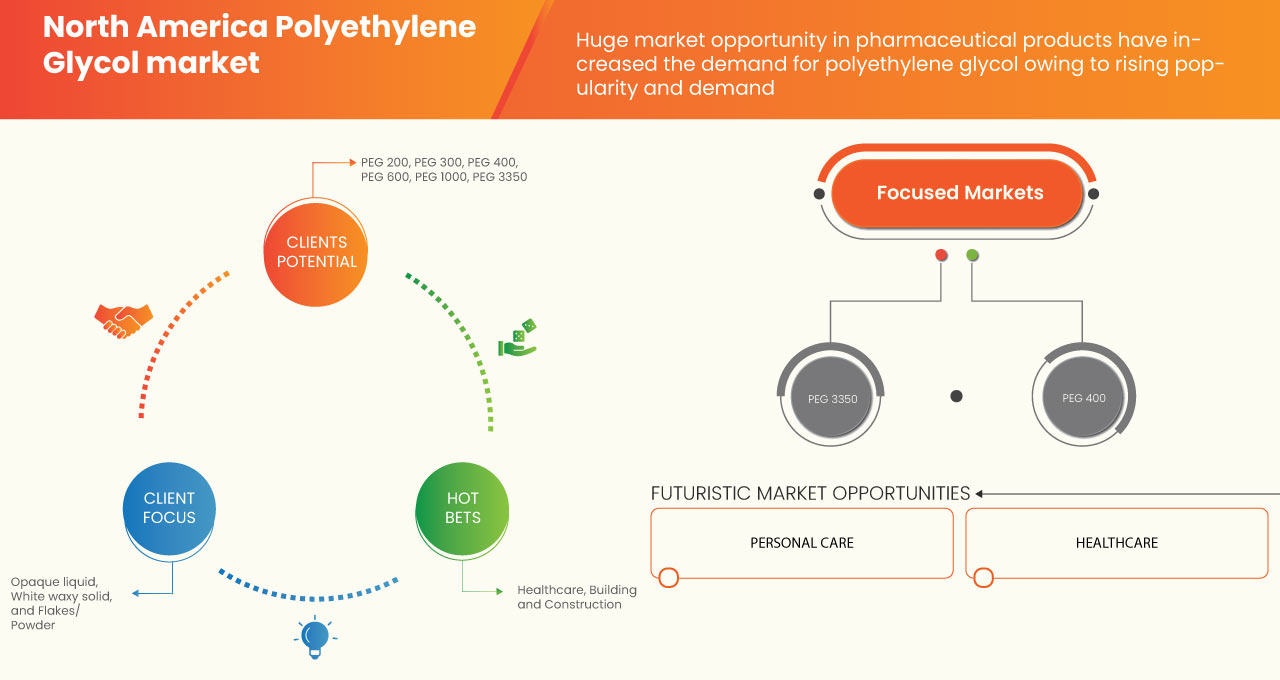
The North America polyethylene glycol market is being driven by the pharmaceutical industry is a key driver driving market expansion. Polyethylene glycols are crucial components of pharmaceutical formulations used to create topical, oral, ophthalmic, and rectal treatments. In a number of medicinal applications, they serve as lubricants and film-coating agents. Additionally, the use of polyethylene glycol in paint and coating products will open up more business potential for polyethylene glycol markets. However, stringent government regulations may restrain market growth.
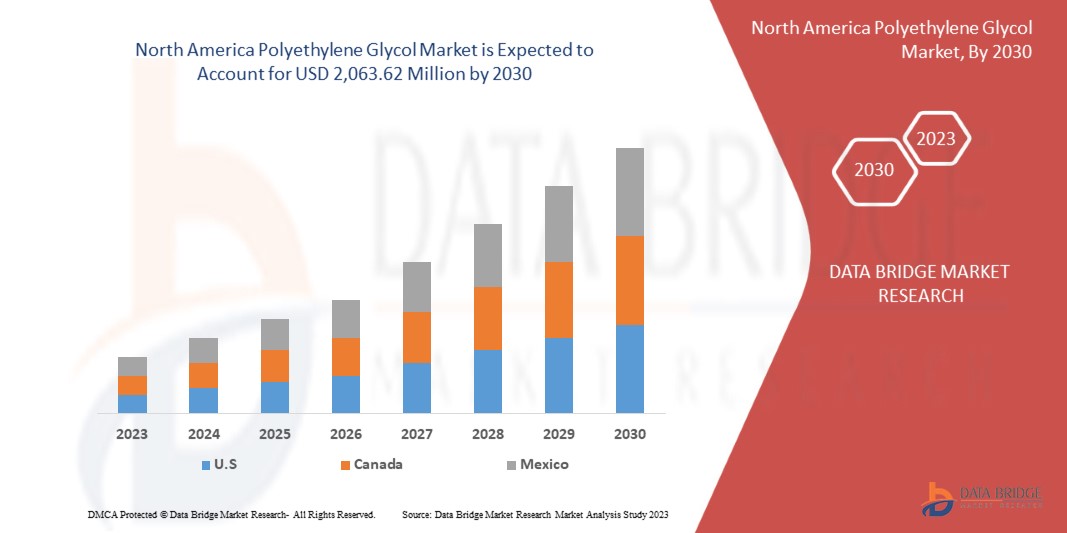
Data Bridge Market Research analyses that the North America polyethylene glycol market is expected to reach the value of USD 2,063.62 million by 2030, at a CAGR of 6.6% during the forecast period.
|
Report Metric |
Details |
|
Forecast Period |
2023 to 2030 |
|
Base Year |
2022 |
|
Historic Year |
2021 (Customizable to 2020-2016) |
|
Quantitative Units |
Revenue in USD Million, Volumes in Tons, Pricing in USD |
|
Segments Covered |
By Grade (PEG 200, PEG 300, PEG 400, PEG 600, PEG 1000, PEG 3350, PEG 4000, PEG 6000, PEG 8000, PEG 10000, and PEG 20000), Form (Opaque Liquid, White Waxy Solid, and Flakes/ Powder), Packaging Size (Plastic Bottles and Drums), Application (Healthcare, Building and Construction, Industrial, Cosmetics/Personal Care, and Others). |
|
Countries Covered |
U.S., Canada, and Mexico |
|
Market Players Covered |
SABIC, Dow, BASF SE, Merck KGaA, INEOS, Croda International Plc, Clariant, India Glycols Limited, Pro Chem, Inc., GFS Chemicals, Inc, Liaoning Oxiranchem Inc., Liaoning Kelong Fine Chemical Co., Ltd., LOTTE Chemical Corporation, Hefei TNJ Chemical Industry Co., Ltd., Noah Chemicals, and Mil-Spec Industries Corporation among others |
Market Definition
PEG or polyethylene glycol is a polymeric material composed of ethylene oxide and water as monomers which are not only hydrophilic but also biocompatible. However, it is a synthetic molecule synthesized by polymerizing ethylene oxide where a ring-opening takes place. As it is composed of water and ethylene oxide, it finds innumerable applications in industries ranging from pharmaceuticals to construction.
Polyethylene glycols are made reactive by the replacement of the terminal hydroxyl group with several reactive functional groups such as thiols, carboxyl groups, N-hydroxysuccinimide esters azides, or reactive alkyne groups, which initiate the formation of crosslinks. It is conjugation chemistry, which plays a major role in their synthesis and depending on the attached functional group, different conditions and methods are chosen. For instance, acrylate-terminated polyethylene glycols could undergo rapid reaction under mild reaction conditions. It is colorless, low-toxic, non-irritating in nature, and has very high biocompatibility. It is widely used as an anti-foaming agent, lubricant, dispersive agent, and laxative. It is applicable to a variety of industries, such as pharmaceuticals, healthcare, building and construction, personal care, and cosmetics.
North America Polyethylene Glycol Market Dynamics
This section deals with understanding the market drivers, advantages, opportunities, restraints and challenges. All of this is discussed in detail as below:
Drivers:
- Growing demand for medicines
Drug discovery is a tedious process that takes many years. Research and development towards creating new innovative pharmaceuticals are becoming important due to the increased number of chronic diseases, the aging population, and the entry of generic competitors in the future market.
The pharmaceutical industry is growing North America at an increased rate, with 'Pfizer medicine having the highest sales rate in the market. Pfizer's research and development department also predicted that the main research is attributed towards oncologic and pain killer drugs, lipid regulators, antidiabetics, respiratory agents, and others, with the United States showing the highest revenue growth.
In the evaluation of the pharmacodynamics of candidate compounds, the metabolism of drugs plays a direct role. Polyethylene glycol acts as an inactive ingredient in the pharmaceutical industry, usually as a wetting and thickening agent in ointment and creams, and is used to add protective coatings tablets. Moreover, its use as an electrolyte solution for the examination of disorders and dysfunctionality in the colon of humans is well known.
- Usage of PEGlycation technology in biotechnological and pharmaceutical applications
PEGylation is the technique of modification of biopharmaceuticals containing polyethylene glycol to enhance the pharmacological properties of the proteins and other large molecules in bio-therapeutic drugs. The technique elongates the period of the half-life of the parental drugs and enhances the aqueous solubility of drug substances.
The PEGylation of protein molecules involves the addition of PEG molecules to the protein structure, which changes its pharmacokinetic properties and reduces the immunogenicity of molecules that help prevent infections, specifically in cancer therapy. The technique involves the conjugation of protein molecules that prolongs the blood circulation of proteins with the reduction of immunogenicity. This is because certain groups of antibody, called Anti-PEG, in the immune system recognizes and binds to the molecules of polyethylene glycols. Anti-PEG antibodies are non-toxic in nature and cause no harm to human tissues.
Opportunities
- Production of polyethylene glycol- 400 for eye drop applications
Polyethylene glycol-400 is a clear and colorless liquid mainly derived from petroleum possessing the characteristic of a standard petroleum polyethylene glycol. The shelf life of these eye drops is one year when stored in a cool and well-ventilated space.
Polyethylene glycol-400 is a low molecular weight compound with less toxicity. It is very hydrophilic, which makes it useful in drug formulations. Its major application lies as an ophthalmic solution, which is generally used for the treatment of burning, discomfort, or dryness of eyes. There are various names, such as blink gel tears, blink tears, or vision true tear liquids, for eye drop solutions that contain the same compound.
RESTRAINTS/ CHALLENGES
- Viscosity stability issues in PEG
Polyethylene glycol is a compound widely used in pharmaceutical formulations, including every variety of parental, topical, oral, rectal, and ophthalmic disorder preparations. Solid grades of Polyethylene glycol with the addition of liquid grade polyethylene glycol can be used in topical ointments and as ointment bases. Moreover, these Liquid polyethylene glycols are used as water-soluble solvents in soft gelatin capsules.
However, the adsorption of moisture by polyethylene glycol from the gelatin can sometimes lead to the hardening of the capsule shell, which alternately can affect the health of the patient consuming it.
Post-COVID-19 Impact on the North America Polyethylene glycol Market
Post the pandemic, the demand for polyethylene glycol products has increased as there won't be any more restrictions on movement, so the supply of products would be easy. In addition, companies developed their processing units to manufacture polyethylene glycol-based products, and the demand for polyethylene glycol in the beauty and healthcare industries has also increased, which may propel the market's growth.
The increased demand in building and construction enables manufacturers to produce more new products, which ultimately increases the demand for Polyethylene glycol and has helped the market grow.
Moreover, the high demand in healthcare industries for will drive the market's growth. Furthermore, the demand for polyethylene glycol in healthcare industries after the COVID-19 pandemic has increased as there is rising awareness about the health benefits and high demand from the healthcare service sector resulted in market growth. Additionally, consumers' interest in new polyethylene glycol and research development is expected to fuel the growth of the North America polyethylene glycol market.
Recent Developments
- In May 2022, EA Pharma Co., Ltd. announced the launch of MOVICOL® HD, A new dosage form added to polyethylene glycol chronic constipation treatment for the first time in Japan. The MOVICOL® HD is a high dose formulation of existing "MOVICOL® LD", the first polyethylene glycol indicated for the treatment of chronic constipation.
- In October 2021, Camber consumer care introduced 4 new over-the-counter items, including Polyethylene Glycol Powder. The company now provides generic OTC medications in a range of strengths and dosages for allergy, pain, and gastrointestinal relief, benefiting a wide range of patients.
North America Polyethylene Glycol Market Scope
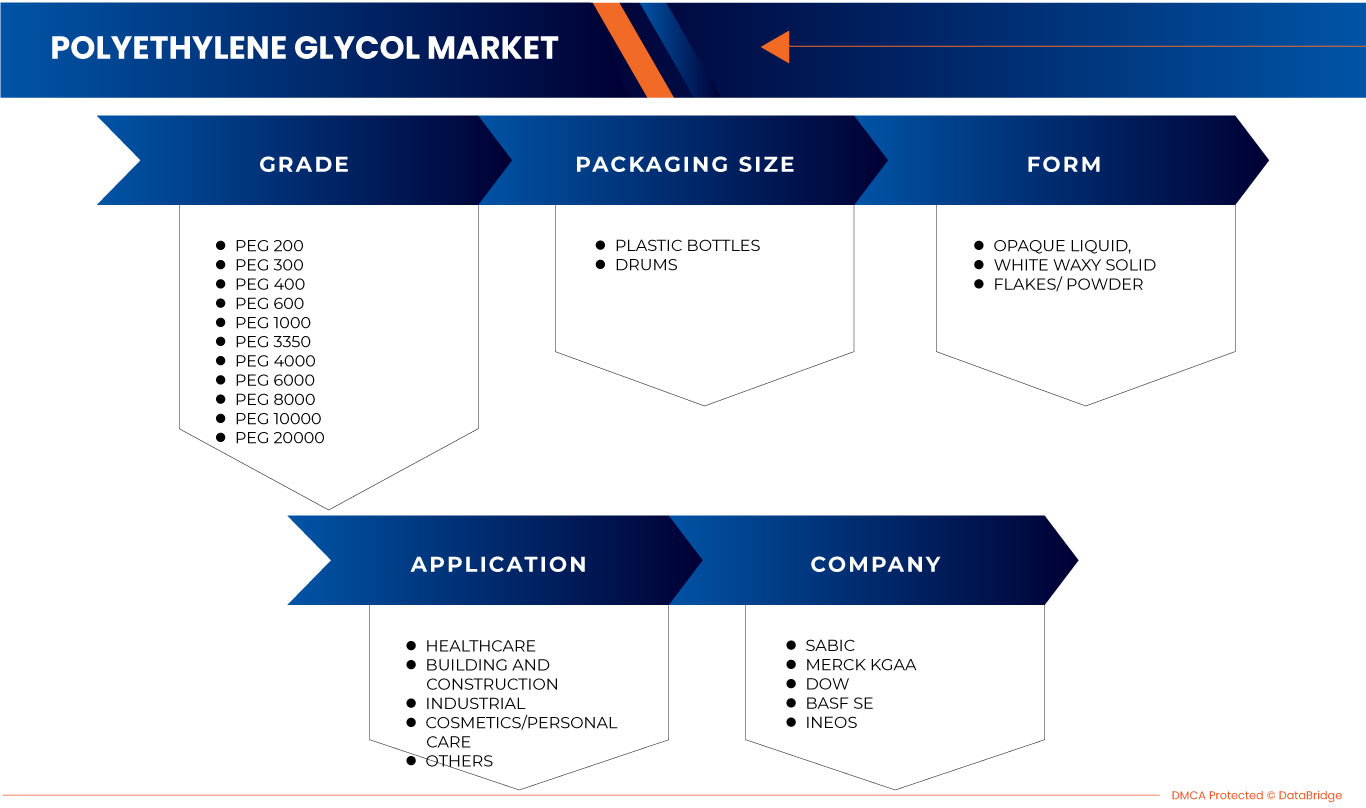
The North America polyethylene glycol market is categorized into four notable segments, which are grade, form, packaging size and application. The growth amongst these segments will help you analyze major growth segments in the industries and provide the users with a valuable market overview and market insights to help them make strategic decisions for identifying core market applications.
Grade
- PEG 200
- PEG 300
- PEG 400
- PEG 600
- PEG 1000
- PEG 3350
- PEG 4000
- PEG 6000
- PEG 8000
- PEG 10000
- PEG 20000
On the basis of grade, the market is segmented into PEG 200, PEG 300, PEG 400, PEG 600, PEG 1000, PEG 3350, PEG 4000, PEG 6000, PEG 8000, PEG 10000, and PEG 20000.
Form
- Opaque Liquid,
- White Waxy Solid
- Flakes/ Powder
On the basis of form, the market is segmented into opaque liquid, white waxy solid, and flakes/ powder.
Packaging Size
- Plastic Bottles
- Drums Bags
On the basis of packaging size, the market is segmented into plastic bottles and drums.
Application
- Healthcare
- Building and Construction
- Industrial
- Cosmetics/Personal Care
- Others
On the basis of application, the market is segmented into healthcare, building and construction, industrial, cosmetics/personal care, and others.
North America Polyethylene Glycol Market Regional Analysis/Insights
The polyethylene glycol market is analyzed and market size insights and trends are provided by country on grade, form, packaging size, application and market size insights and trends are provided based on as referenced above.
The countries covered in the North America polyethylene glycol market report are U.S., Canada, and Mexico
U.S. is dominating the North America polyethylene glycol market. Polyethylene glycol and its derivatives find a wide range of applications in drugs, diagnostics, and medical devices is the major reason for the growth of polyethylene glycol market in U.S. However, Viscosity Stability Issues in PEG is expected to restrict the growth of market.
The country section of the report also provides individual market impacting factors and changes in market regulation that impact the current and future trends of the market. Data points like down-stream and upstream value chain analysis, technical trends and porter's five forces analysis, case studies are some of the pointers used to forecast the market scenario for individual countries. Also, the presence and availability of North America brands and their challenges faced due to large or scarce competition from local and domestic brands, impact of domestic tariffs and trade routes are considered while providing forecast analysis of the country data.
Competitive Landscape and North America Polyethylene Glycol Market Share Analysis
The North America polyethylene glycol market competitive landscape provides details by competitor. Details included are company overview, company financials, revenue generated, market potential, investment in research and development, new market initiatives, North America presence, production sites and facilities, production capacities, company strengths and weaknesses, product launch, product width and breadth, application dominance. The above data points provided are only related to the companies' focus on the polyethylene glycol market.
Some of the major players operating in the North America polyethylene glycol market are SABIC, Dow, BASF SE, Merck KGaA, INEOS, Croda International Plc, Clariant, India Glycols Limited, Pro Chem, Inc., GFS Chemicals, Inc, Liaoning Oxiranchem Inc., Liaoning Kelong Fine Chemical Co., Ltd., LOTTE Chemical Corporation, Hefei TNJ Chemical Industry Co., Ltd., Noah Chemicals, and Mil-Spec Industries Corporation among others.
SKU-
Obtenha acesso online ao relatório sobre a primeira nuvem de inteligência de mercado do mundo

- Painel interativo de análise de dados
- Painel de análise da empresa para oportunidades de elevado potencial de crescimento
- Acesso de analista de pesquisa para personalização e customização. consultas
- Análise da concorrência com painel interativo
- Últimas notícias, atualizações e atualizações Análise de tendências
- Aproveite o poder da análise de benchmark para um rastreio abrangente da concorrência
Índice
1 INTRODUCTION
1.1 OBJECTIVES OF THE STUDY
1.2 MARKET DEFINITION
1.3 VISÃO GERAL DO MERCADO DE POLIETILENOGLICOL DA AMÉRICA DO NORTE
1.4 LIMITAÇÕES
1,5 MERCADOS COBERTOS
2 SEGMENTAÇÃO DE MERCADO
2.1 MERCADOS COBERTOS
2.2 ÂMBITO GEOGRÁFICO
2,3 ANOS CONSIDERADOS PARA O ESTUDO
2.4 MOEDA E PREÇOS
2.5 MODELO DE VALIDAÇÃO DE DADOS TRIPÉ DBMR
2.6 MODELAGEM MULTIVARIADA
2.7 CURVA DE LINHA DE SALVAÇÃO DO TRATAMENTO
2.8 ENTREVISTAS PRINCIPAIS COM PRINCIPAIS LÍDERES DE OPINIÃO
2.9 GRADE DE POSIÇÃO DE MERCADO DBMR
2.1 GRADE DE COBERTURA DE APLICAÇÃO DE MERCADO
2.11 FONTES SECUNDÁRIAS
2.12 PREMISSAS
3 RESUMO EXECUTIVO
4 INSIGHTS PREMIUM
4.1 ANÁLISE PESTEL
4.2 AS CINCO FORÇAS DE PORTER:
4.3 QUADRO REGULAMENTAR
4.4 CENÁRIO DE IMPORTAÇÃO E EXPORTAÇÃO
4.5 ANÁLISE DE CONSUMO DE PRODUÇÃO
4.6 COBERTURA DE MATÉRIA-PRIMA – MERCADO DE POLIETILENOGLICOL DA AMÉRICA DO NORTE
4.7 AVANÇO TECNOLÓGICO DOS FABRICANTES
4.8 CRITÉRIOS DE SELEÇÃO DE FORNECEDORES
5 MERCADO DE POLIETILENOGLICOL DA AMÉRICA DO NORTE: ÍNDICE DE PREÇOS
6 CAPACIDADE DE PRODUÇÃO
7 ANÁLISE DA CADEIA DE SUPRIMENTOS
7.1 VISÃO GERAL
7.2 CENÁRIO DE CUSTOS LOGÍSTICOS
7.3 IMPORTÂNCIA DOS PRESTADORES DE SERVIÇOS LOGÍSTICOS
8 VISÃO GERAL DO MERCADO
8.1 MOTORISTAS
8.1.1 CRESCENTE DEMANDA POR MEDICAMENTOS
8.1.2 ALTA DEMANDA DE SORVETES
8.1.3 USO DA TECNOLOGIA DE PEGLICAÇÃO EM APLICAÇÕES BIOTECNOLÓGICAS E FARMACÊUTICAS
8.1.4 ALTA DEMANDA POR TINTAS À BASE DE ÁGUA
8.2 RESTRIÇÕES
8.2.1 PROBLEMAS DE ESTABILIDADE DE VISCOSIDADE EM PEG
8.2.2 REGULAMENTAÇÕES RIGOROSAS NA INDÚSTRIA FARMACÊUTICA
8.2.3 REGULAMENTAÇÕES AMBIENTAIS
8.2.4 ALTA DEMANDA POR SUBSTITUTOS
8.3 OPORTUNIDADES
8.3.1 PRODUÇÃO DE POLIETILENOGLICOL-400 PARA APLICAÇÃO EM COLÍRIOS
8.3.2 PRODUÇÃO DE PEG PARA TERAPIA DE PELE E APLICAÇÕES DE POMADA
8.3.3 USO DE POLIETILENOGLICOL COMO ADITIVO PARA MELHORAR AS PROPRIEDADES DE TINTAS E REVESTIMENTOS
8.4 DESAFIOS
8.4.1 FLUTUAÇÃO DOS PREÇOS DA MATÉRIA-PRIMA
8.4.2 ALTAS TARIFAS E REGULAMENTOS DE IMPORTAÇÃO
8.4.3 REAÇÕES ALÉRGICAS IMEDIATAS AO PEG
9 MERCADO DE POLIETILENOGLICOL DA AMÉRICA DO NORTE, POR GRAU
9.1 VISÃO GERAL
9.2 PEG 400
9.3 PEG 600
9.4 PEG 200
9,5 PEG 300
9,6 PEG 1000
9,7 PEG 3350
9,8 PEG 4000
9,9 PEG 8000
9.1 PEG 6000
9.11 PEG 10000
9.12 PEG 20000
10 MERCADO DE POLIETILENOGLICOL DA AMÉRICA DO NORTE, POR FORMA
10.1 VISÃO GERAL
10.2 LÍQUIDO OPACO
10.3 FLOCOS/PÓ
10.4 SÓLIDO CEROSO BRANCO
11 MERCADO DE POLIETILENOGLICOL DA AMÉRICA DO NORTE, POR TAMANHO DE EMBALAGEM
11.1 VISÃO GERAL
11.2 TAMBORES
11.3 GARRAFAS DE PLÁSTICO
12 MERCADO DE POLIETILENOGLICOL DA AMÉRICA DO NORTE, POR APLICAÇÃO
12.1 VISÃO GERAL
12.2 SAÚDE
12.2.1 PRODUTOS FARMACÊUTICOS
12.2.1.1 COMPRIMIDOS
12.2.1.2 Pomadas
12.2.2 COLONOSCOPIA
12.2.3 PREPARAÇÃO DO ENEMA BÁRICO
12.3 INDUSTRIAIS
12.4 COSMÉTICOS/CUIDADOS PESSOAIS
12.4.1 CREME PARA A PELE
12.4.2 PASTA DE DENTES
12.4.3 LUBRIFICANTES PESSOAIS
12.4.4 OUTROS
12.5 EDIFÍCIOS E CONSTRUÇÃO
12.5.1 TINTAS E REVESTIMENTOS
12.5.2 AZULEJOS CERÂMICOS
12.5.3 OUTROS
12.6 OUTROS
13 MERCADO DE POLIETILENOGLICOL DA AMÉRICA DO NORTE, POR REGIÃO
13.1 AMÉRICA DO NORTE
13.1.1 EUA
13.1.2 CANADÁ
13.1.3 MÉXICO
14 PAISAGISMO DA EMPRESA
14.1 ANÁLISE DAS AÇÕES DA EMPRESA: AMÉRICA DO NORTE
15 ANÁLISE SWOT
16 PERFIL DA EMPRESA
16.1 SABIC
16.1.1 RESUMO DA EMPRESA
16.1.2 ANÁLISE DE RECEITA
16.1.3 ANÁLISE DAS AÇÕES DA EMPRESA
16.1.4 PORTFÓLIO DE PRODUTOS
16.1.5 DESENVOLVIMENTOS RECENTES
16.2 MERCK KGAA
16.2.1 RESUMO DA EMPRESA
16.2.2 ANÁLISE DE RECEITA
16.2.3 ANÁLISE DAS AÇÕES DA EMPRESA
16.2.4 PRODUCT PORTFOLIO
16.2.5 RECENT DEVELOPMENTS
16.3 DOW
16.3.1 COMPANY SNAPSHOT
16.3.2 REVENUE ANALYSIS
16.3.3 COMPANY SHARE ANALYSIS
16.3.4 PRODUCT PORTFOLIO
16.3.5 RECENT DEVELOPMENTS
16.4 BASF SE
16.4.1 COMPANY SNAPSHOT
16.4.2 REVENUE ANALYSIS
16.4.3 COMPANY SHARE ANALYSIS
16.4.4 PRODUCT PORTFOLIO
16.4.5 RECENT DEVELOPMENTS
16.5 INEOS
16.5.1 COMPANY SNAPSHOT
16.5.2 REVENUE ANALYSIS
16.5.3 COMPANY SHARE ANALYSIS
16.5.4 PRODUCT PORTFOLIO
16.5.5 RECENT DEVELOPMENTS
16.6 LOTTE CHEMICAL CORPORATION
16.6.1 COMPANY SNAPSHOT
16.6.2 REVENUE ANALYSIS
16.6.3 COMPANY SHARE ANALYSIS
16.6.4 PRODUCT PORTFOLIO
16.6.5 RECENT DEVELOPMENTS
16.7 HEFEI TNJ CHEMICAL INDUSTRY CO., LTD.
16.7.1 COMPANY SNAPSHOT
16.7.2 PRODUCT PORTFOLIO
16.7.3 RECENT DEVELOPMENTS
16.8 CLARIANT
16.8.1 COMPANY SNAPSHOT
16.8.2 REVENUE ANALYSIS
16.8.3 PRODUCT PORTFOLIO
16.8.4 RECENT DEVELOPMENT
16.9 CRODA INTERNATIONAL PLC
16.9.1 COMPANY SNAPSHOT
16.9.2 REVENUE ANALYSIS
16.9.3 PRODUCT PORTFOLIO
16.9.4 RECENT DEVELOPMENTS
16.1 GFS CHEMICALS, INC.
16.10.1 COMPANY SNAPSHOT
16.10.2 PRODUCT PORTFOLIO
16.10.3 RECENT DEVELOPMENT
16.11 INDIA GLYCOLS LIMITED
16.11.1 COMPANY SNAPSHOT
16.11.2 REVENUE ANALYSIS
16.11.3 PRODUCT PORTFOLIO
16.11.4 RECENT DEVELOPMENTS
16.12 LIAONING KELONG FINE CHEMICAL CO., LTD.
16.12.1 COMPANY SNAPSHOT
16.12.2 PRODUCT PORTFOLIO
16.12.3 RECENT DEVELOPMENTS
16.13 LIAONING OXIRANCHEM INC.
16.13.1 COMPANY SNAPSHOT
16.13.2 PRODUCT PORTFOLIO
16.13.3 RECENT DEVELOPMENTS
16.14 MIL-SPEC INDUSTRIES CORPORATION
16.14.1 COMPANY SNAPSHOT
16.14.2 PRODUCT PORTFOLIO
16.14.3 RECENT DEVELOPMENT
16.15 NOAH CHEMICALS
16.15.1 COMPANY SNAPSHOT
16.15.2 PRODUCT PORTFOLIO
16.15.3 RECENT DEVELOPMENT
16.16 PROCHEM, INC
16.16.1 COMPANY SNAPSHOT
16.16.2 PRODUCT PORTFOLIO
16.16.3 RECENT DEVELOPMENT
17 QUESTIONNAIRE
18 RELATED REPORTS
Lista de Tabela
TABELA 1 MERCADO DE POLIETILENOGLICOL DA AMÉRICA DO NORTE, POR GRAU, 2021-2030 (US$ MILHÕES)
TABELA 2 MERCADO DE POLIETILENOGLICOL NA AMÉRICA DO NORTE, POR GRAU, 2021-2030 (TONELADAS)
TABELA 3 PEG 400 NA AMÉRICA DO NORTE NO MERCADO DE POLIETILENOGLICOL, POR REGIÃO, 2021-2030 (US$ MILHÕES)
TABELA 4 PEG 400 NA AMÉRICA DO NORTE NO MERCADO DE POLIETILENOGLICOL, POR REGIÃO, 2021-2030 (TONELADAS)
TABELA 5 PEG 600 NA AMÉRICA DO NORTE NO MERCADO DE POLIETILENOGLICOL, POR REGIÃO, 2021-2030 (US$ MILHÕES)
TABELA 6 PEG 600 DA AMÉRICA DO NORTE NO MERCADO DE POLIETILENOGLICOL, POR REGIÃO, 2021-2030 (TONELADAS)
TABELA 7 PEG 200 NA AMÉRICA DO NORTE NO MERCADO DE POLIETILENOGLICOL, POR REGIÃO, 2021-2030 (US$ MILHÕES)
TABELA 8 PEG 200 DA AMÉRICA DO NORTE NO MERCADO DE POLIETILENOGLICOL, POR REGIÃO, 2021-2030 (TONELADAS)
TABELA 9 PEG 300 DA AMÉRICA DO NORTE NO MERCADO DE POLIETILENOGLICOL, POR REGIÃO, 2021-2030 (US$ MILHÕES
TABELA 10 PEG 300 DA AMÉRICA DO NORTE NO MERCADO DE POLIETILENOGLICOL, POR REGIÃO, 2021-2030 (TONELADAS)
TABELA 11 PEG 1000 NA AMÉRICA DO NORTE NO MERCADO DE POLIETILENOGLICOL, POR REGIÃO, 2021-2030 (US$ MILHÕES)
TABELA 12 PEG 1000 NA AMÉRICA DO NORTE NO MERCADO DE POLIETILENOGLICOL, POR REGIÃO, 2021-2030 (TONELADAS)
TABELA 13 PEG 3350 DA AMÉRICA DO NORTE NO MERCADO DE POLIETILENOGLICOL, POR REGIÃO, 2021-2030 (US$ MILHÕES)
TABELA 14 PEG 3350 DA AMÉRICA DO NORTE NO MERCADO DE POLIETILENOGLICOL, POR REGIÃO, 2021-2030 (TONELADAS)
TABELA 15 PEG 4000 DA AMÉRICA DO NORTE NO MERCADO DE POLIETILENOGLICOL, POR REGIÃO, 2021-2030 (US$ MILHÕES)
TABELA 16 PEG 4000 DA AMÉRICA DO NORTE NO MERCADO DE POLIETILENOGLICOL, POR REGIÃO, 2021-2030 (TONELADAS)
TABELA 17 PEG 8000 NA AMÉRICA DO NORTE NO MERCADO DE POLIETILENOGLICOL, POR REGIÃO, 2021-2030 (US$ MILHÕES)
TABELA 18 PEG 8000 DA AMÉRICA DO NORTE NO MERCADO DE POLIETILENOGLICOL, POR REGIÃO, 2021-2030 (TONELADAS)
TABELA 19 PEG 6000 NA AMÉRICA DO NORTE NO MERCADO DE POLIETILENOGLICOL, POR REGIÃO, 2021-2030 (US$ MILHÕES)
TABELA 20 PEG 6000 NA AMÉRICA DO NORTE NO MERCADO DE POLIETILENOGLICOL, POR REGIÃO, 2021-2030 (TONELADAS)
TABELA 21 PEG 10000 DA AMÉRICA DO NORTE NO MERCADO DE POLIETILENOGLICOL, POR REGIÃO, 2021-2030 (US$ MILHÕES)
TABELA 22 PEG 10000 NA AMÉRICA DO NORTE NO MERCADO DE POLIETILENOGLICOL, POR REGIÃO, 2021-2030 (TONELADAS)
TABELA 23 AMÉRICA DO NORTE PEG 20000 NO MERCADO DE POLIETILENOGLICOL, POR REGIÃO, 2021-2030 (US$ MILHÕES)
TABELA 24 PEG 20000 NA AMÉRICA DO NORTE NO MERCADO DE POLIETILENOGLICOL, POR REGIÃO, 2021-2030 (TONELADAS)
TABELA 25 MERCADO DE POLIETILENOGLICOL DA AMÉRICA DO NORTE, POR FORMA, 2021-2030 (US$ MILHÕES)
TABELA 26 MERCADO DE POLIETILENOGLICOL DA AMÉRICA DO NORTE, POR FORMA, 2021-2030 (TONELADAS)
TABELA 27 MERCADO DE LÍQUIDO OPACO EM POLIETILENOGLICOL DA AMÉRICA DO NORTE, POR REGIÃO, 2021-2030 (US$ MILHÕES)
TABELA 28 MERCADO DE POLIETILENOGLICOL LÍQUIDO OPACO NA AMÉRICA DO NORTE, POR REGIÃO, 2021-2030 (TONELADAS)
TABELA 29 FLOCOS/PÓ DA AMÉRICA DO NORTE NO MERCADO DE POLIETILENOGLICOL, POR REGIÃO, 2021-2030 (US$ MILHÕES)
TABELA 30 MERCADO DE POLIETILENOGLICOL EM FLOCOS/PÓ DA AMÉRICA DO NORTE, POR REGIÃO, 2021-2030 (TONELADAS)
TABELA 31 MERCADO DE SÓLIDOS CEROSOS BRANCOS EM POLIETILENOGLICOL DA AMÉRICA DO NORTE, POR REGIÃO, 2021-2030 (US$ MILHÕES)
TABELA 32 MERCADO DE SÓLIDOS CEROSOS BRANCOS EM POLIETILENOGLICOL NA AMÉRICA DO NORTE, POR REGIÃO, 2021-2030 (TONELADAS)
TABELA 33 MERCADO DE POLIETILENOGLICOL DA AMÉRICA DO NORTE, POR TAMANHO DE EMBALAGEM, 2021-2030 (US$ MILHÕES)
TABELA 34 MERCADO DE POLIETILENOGLICOL DA AMÉRICA DO NORTE, POR TAMANHO DE EMBALAGEM, 2021-2030 (TONELADAS)
TABELA 35 TAMBORES DA AMÉRICA DO NORTE NO MERCADO DE POLIETILENOGLICOL, POR REGIÃO, 2021-2030 (US$ MILHÕES)
TABELA 36 TAMBORES DA AMÉRICA DO NORTE NO MERCADO DE POLIETILENOGLICOL, POR REGIÃO, 2021-2030 (TONELADAS)
TABELA 37 GARRAFAS PLÁSTICAS DA AMÉRICA DO NORTE NO MERCADO DE POLIETILENOGLICOL, POR REGIÃO, 2021-2030 (US$ MILHÕES)
TABELA 38 GARRAFAS PLÁSTICAS DA AMÉRICA DO NORTE NO MERCADO DE POLIETILENOGLICOL, POR REGIÃO, 2021-2030 (TONELADAS)
TABELA 39 MERCADO DE POLIETILENOGLICOL DA AMÉRICA DO NORTE, POR APLICAÇÃO, 2021-2030 (US$ MILHÕES)
TABELA 40 MERCADO DE POLIETILENOGLICOL DA AMÉRICA DO NORTE, POR APLICAÇÃO, 2021-2030 (TONELADAS)
TABELA 41 SAÚDE NA AMÉRICA DO NORTE NO MERCADO DE POLIETILENOGLICOL, POR REGIÃO, 2021-2030 (US$ MILHÕES)
TABELA 42 CUIDADOS DE SAÚDE NA AMÉRICA DO NORTE NO MERCADO DE POLIETILENOGLICOL, POR REGIÃO, 2021-2030 (TONELADAS)
TABELA 43 CUIDADOS DE SAÚDE NA AMÉRICA DO NORTE NO MERCADO DE POLIETILENOGLICOL, POR APLICAÇÃO, 2021-2030 (US$ MILHÕES)
TABELA 44 CUIDADOS DE SAÚDE NA AMÉRICA DO NORTE NO MERCADO DE POLIETILENOGLICOL, POR APLICAÇÃO, 2021-2030 (TONELADAS)
TABELA 45 PRODUTOS FARMACÊUTICOS DA AMÉRICA DO NORTE NO MERCADO DE POLIETILENOGLICOL, POR CATEGORIA, 2021-2030 (US$ MILHÕES)
TABELA 46 PRODUTOS FARMACÊUTICOS DA AMÉRICA DO NORTE NO MERCADO DE POLIETILENOGLICOL, POR CATEGORIA, 2021-2030 (TONELADAS)
TABELA 47 MERCADO INDUSTRIAL DE POLIETILENOGLICOL DA AMÉRICA DO NORTE, POR REGIÃO, 2021-2030 (US$ MILHÕES)
TABELA 48 MERCADO INDUSTRIAL DE POLIETILENOGLICOL DA AMÉRICA DO NORTE, POR REGIÃO, 2021-2030 (TONELADAS)
TABELA 49 MERCADO DE COSMÉTICOS/CUIDADOS PESSOAIS DA AMÉRICA DO NORTE NO MERCADO DE POLIETILENOGLICOL, POR REGIÃO, 2021-2030 (US$ MILHÕES)
TABELA 50 MERCADO DE COSMÉTICOS/CUIDADOS PESSOAIS DA AMÉRICA DO NORTE NO POLIETILENOGLICOL, POR REGIÃO, 2021-2030 (TONELADAS)
TABELA 51 COSMÉTICOS/CUIDADOS PESSOAIS NA AMÉRICA DO NORTE NO MERCADO DE POLIETILENOGLICOL, POR APLICAÇÃO, 2021-2030 (US$ MILHÕES)
TABELA 52 MERCADO DE COSMÉTICOS/CUIDADOS PESSOAIS DA AMÉRICA DO NORTE NO POLIETILENOGLICOL, POR APLICAÇÃO, 2021-2030 (TONELADAS)
TABELA 53 EDIFICAÇÃO E CONSTRUÇÃO NA AMÉRICA DO NORTE NO MERCADO DE POLIETILENOGLICOL, POR REGIÃO, 2021-2030 (US$ MILHÕES)
TABELA 54 EDIFICAÇÃO E CONSTRUÇÃO NA AMÉRICA DO NORTE NO MERCADO DE POLIETILENOGLICOL, POR REGIÃO, 2021-2030 (TONELADAS)
TABELA 55 EDIFICAÇÃO E CONSTRUÇÃO NA AMÉRICA DO NORTE NO MERCADO DE POLIETILENOGLICOL, POR APLICAÇÃO, 2021-2030 (US$ MILHÕES)
TABELA 56 EDIFÍCIOS E CONSTRUÇÃO NA AMÉRICA DO NORTE NO MERCADO DE POLIETILENOGLICOL, POR APLICAÇÃO, 2021-2030 (TONELADAS)
TABELA 57 AMÉRICA DO NORTE OUTROS NO MERCADO DE POLIETILENOGLICOL, POR REGIÃO, 2021-2030 (US$ MILHÕES)
TABELA 58 AMÉRICA DO NORTE OUTROS NO MERCADO DE POLIETILENOGLICOL, POR REGIÃO, 2021-2030 (TONELADAS)
TABELA 59 MERCADO DE POLIETILENOGLICOL DA AMÉRICA DO NORTE, POR PAÍS, 2021-2030 (US$ MILHÕES)
TABELA 60 MERCADO DE POLIETILENOGLICOL DA AMÉRICA DO NORTE, POR PAÍS, 2021-2030 (TONELADAS)
TABELA 61 MERCADO DE POLIETILENOGLICOL DA AMÉRICA DO NORTE, POR GRAU, 2021-2030 (US$ MILHÕES)
TABELA 62 MERCADO DE POLIETILENOGLICOL NA AMÉRICA DO NORTE, POR GRAU, 2021-2030 (TONELADAS)
TABELA 63 MERCADO DE POLIETILENOGLICOL DA AMÉRICA DO NORTE, POR GRAU ASP, 2021-2030 (USD/TON)
TABELA 64 MERCADO DE POLIETILENOGLICOL DA AMÉRICA DO NORTE, POR FORMA, 2021-2030 (US$ MILHÕES)
TABELA 65 MERCADO DE POLIETILENOGLICOL DA AMÉRICA DO NORTE, POR FORMA, 2021-2030 (TONELADAS)
TABELA 66 MERCADO DE POLIETILENOGLICOL DA AMÉRICA DO NORTE, POR FORMULÁRIO ASP, 2021-2030 (USD/TONELADA)
TABELA 67 MERCADO DE POLIETILENOGLICOL DA AMÉRICA DO NORTE, POR TAMANHO DE EMBALAGEM, 2021-2030 (US$ MILHÕES)
TABELA 68 MERCADO DE POLIETILENOGLICOL DA AMÉRICA DO NORTE, POR TAMANHO DE EMBALAGEM, 2021-2030 (TONELADAS)
TABELA 69 MERCADO DE POLIETILENOGLICOL DA AMÉRICA DO NORTE, POR TAMANHO DE EMBALAGEM ASP, 2021-2030 (USD/ TONELADA)
TABELA 70 MERCADO DE POLIETILENOGLICOL DA AMÉRICA DO NORTE, POR APLICAÇÃO, 2021-2030 (US$ MILHÕES)
TABELA 71 MERCADO DE POLIETILENOGLICOL DA AMÉRICA DO NORTE, POR APLICAÇÃO, 2021-2030 (TONELADAS)
TABELA 72 MERCADO DE POLIETILENOGLICOL DA AMÉRICA DO NORTE, POR APLICAÇÃO ASP, 2021-2030 (USD/TONELADA)
TABELA 73 CUIDADOS DE SAÚDE NA AMÉRICA DO NORTE NO MERCADO DE POLIETILENOGLICOL, POR APLICAÇÃO, 2021-2030 (US$ MILHÕES)
TABELA 74 CUIDADOS DE SAÚDE NA AMÉRICA DO NORTE NO MERCADO DE POLIETILENOGLICOL, POR APLICAÇÃO, 2021-2030 (TONELADAS)
TABELA 75 PRODUTOS FARMACÊUTICOS DA AMÉRICA DO NORTE NO MERCADO DE POLIETILENOGLICOL, POR CATEGORIA, 2021-2030 (US$ MILHÕES)
TABELA 76 PRODUTOS FARMACÊUTICOS DA AMÉRICA DO NORTE NO MERCADO DE POLIETILENOGLICOL, POR CATEGORIA, 2021-2030 (TONELADAS)
TABELA 77 MERCADO DE COSMÉTICOS/CUIDADOS PESSOAIS DA AMÉRICA DO NORTE NO POLIETILENOGLICOL, POR APLICAÇÃO, 2021-2030 (US$ MILHÕES)
TABELA 78 MERCADO DE COSMÉTICOS/CUIDADOS PESSOAIS DA AMÉRICA DO NORTE NO POLIETILENOGLICOL, POR APLICAÇÃO, 2021-2030 (TONELADAS)
TABELA 79 EDIFICAÇÃO E CONSTRUÇÃO NA AMÉRICA DO NORTE NO MERCADO DE POLIETILENOGLICOL, POR APLICAÇÃO, 2021-2030 (US$ MILHÕES)
TABELA 80 EDIFÍCIOS E CONSTRUÇÃO NA AMÉRICA DO NORTE NO MERCADO DE POLIETILENOGLICOL, POR APLICAÇÃO, 2021-2030 (TONELADAS)
TABELA 81 MERCADO DE POLIETILENOGLICOL NOS EUA, POR GRAU, 2021-2030 (US$ MILHÕES)
TABELA 82 MERCADO DE POLIETILENOGLICOL NOS EUA, POR GRAU, 2021-2030 (TONELADAS)
TABELA 83 MERCADO DE POLIETILENOGLICOL DOS EUA, POR GRAU ASP, 2021-2030 (USD/TONELADA)
TABELA 84 MERCADO DE POLIETILENOGLICOL NOS EUA, POR FORMA, 2021-2030 (US$ MILHÕES)
TABELA 85 MERCADO DE POLIETILENOGLICOL NOS EUA, POR FORMA, 2021-2030 (TONELADAS)
TABELA 86 MERCADO DE POLIETILENOGLICOL DOS EUA, POR FORMULÁRIO ASP, 2021-2030 (USD/TONELADA)
TABELA 87 MERCADO DE POLIETILENOGLICOL DOS EUA, POR TAMANHO DE EMBALAGEM, 2021-2030 (US$ MILHÕES)
TABELA 88 MERCADO DE POLIETILENOGLICOL DOS EUA, POR TAMANHO DE EMBALAGEM, 2021-2030 (TONELADAS)
TABELA 89 MERCADO DE POLIETILENOGLICOL DOS EUA, POR TAMANHO DE EMBALAGEM ASP, 2021-2030 (USD/TONELADA)
TABELA 90 MERCADO DE POLIETILENOGLICOL DOS EUA, POR APLICAÇÃO, 2021-2030 (US$ MILHÕES)
TABELA 91 MERCADO DE POLIETILENOGLICOL DOS EUA, POR APLICAÇÃO, 2021-2030 (TONELADAS)
TABELA 92 MERCADO DE POLIETILENOGLICOL DOS EUA, POR APLICAÇÃO ASP, 2021-2030 (USD/TONELADA)
TABELA 93: MERCADO DE SAÚDE NO MERCADO DE POLIETILENOGLICOL NOS EUA, POR APLICAÇÃO, 2021-2030 (US$ MILHÕES)
TABELA 94: MERCADO DE SAÚDE NO MERCADO DE POLIETILENOGLICOL NOS EUA, POR APLICAÇÃO, 2021-2030 (TONELADAS)
TABELA 95 PRODUTOS FARMACÊUTICOS NOS EUA NO MERCADO DE POLIETILENOGLICOL, POR CATEGORIA, 2021-2030 (US$ MILHÕES)
TABELA 96 PRODUTOS FARMACÊUTICOS NOS EUA NO MERCADO DE POLIETILENOGLICOL, POR CATEGORIA, 2021-2030 (TONELADAS)
TABELA 97 COSMÉTICOS/CUIDADOS PESSOAIS NO MERCADO DE POLIETILENOGLICOL NOS EUA, POR APLICAÇÃO, 2021-2030 (US$ MILHÕES)
TABELA 98 COSMÉTICOS/CUIDADOS PESSOAIS NO MERCADO DE POLIETILENOGLICOL NOS EUA, POR APLICAÇÃO, 2021-2030 (TONELADAS)
TABELA 99 EDIFICAÇÃO E CONSTRUÇÃO NOS EUA NO MERCADO DE POLIETILENOGLICOL, POR APLICAÇÃO, 2021-2030 (US$ MILHÕES)
TABELA 100 EDIFÍCIOS E CONSTRUÇÃO NOS EUA EM MERCADO DE POLIETILENOGLICOL, POR APLICAÇÃO, 2021-2030 (TONELADAS)
TABELA 101 MERCADO DE POLIETILENOGLICOL DO CANADÁ, POR GRAU, 2021-2030 (US$ MILHÕES)
TABELA 102 MERCADO DE POLIETILENOGLICOL NO CANADÁ, POR GRAU, 2021-2030 (TONELADAS)
TABELA 103 MERCADO DE POLIETILENOGLICOL NO CANADÁ, POR GRAU ASP, 2021-2030 (USD/TONELADA)
TABELA 104 MERCADO DE POLIETILENOGLICOL DO CANADÁ, POR FORMA, 2021-2030 (US$ MILHÕES)
TABELA 105 MERCADO DE POLIETILENOGLICOL NO CANADÁ, POR FORMA, 2021-2030 (TONELADAS)
TABELA 106 MERCADO DE POLIETILENOGLICOL DO CANADÁ, POR FORMULÁRIO ASP, 2021-2030 (USD/TONELADA)
TABELA 107 MERCADO DE POLIETILENOGLICOL DO CANADÁ, POR TAMANHO DE EMBALAGEM, 2021-2030 (US$ MILHÕES)
TABELA 108 MERCADO DE POLIETILENOGLICOL DO CANADÁ, POR TAMANHO DE EMBALAGEM, 2021-2030 (TONELADAS)
TABELA 109 MERCADO DE POLIETILENOGLICOL DO CANADÁ, POR TAMANHO DE EMBALAGEM ASP, 2021-2030 (USD/ TONELADA)
TABELA 110 MERCADO DE POLIETILENOGLICOL DO CANADÁ, POR APLICAÇÃO, 2021-2030 (MILHÕES DE DÓLARES)
TABELA 111 MERCADO DE POLIETILENOGLICOL DO CANADÁ, POR APLICAÇÃO, 2021-2030 (TONELADAS)
TABELA 112 MERCADO DE POLIETILENOGLICOL DO CANADÁ, POR APLICAÇÃO ASP, 2021-2030 (USD/TONELADA)
TABELA 113: SAÚDE NO CANADÁ NO MERCADO DE POLIETILENOGLICOL, POR APLICAÇÃO, 2021-2030 (US$ MILHÕES)
TABELA 114: SAÚDE NO CANADÁ NO MERCADO DE POLIETILENOGLICOL, POR APLICAÇÃO, 2021-2030 (TONELADAS)
TABELA 115 PRODUTOS FARMACÊUTICOS DO CANADÁ NO MERCADO DE POLIETILENOGLICOL, POR CATEGORIA, 2021-2030 (US$ MILHÕES)
TABELA 116 PRODUTOS FARMACÊUTICOS NO MERCADO DE POLIETILENOGLICOL DO CANADÁ, POR CATEGORIA, 2021-2030 (TONELADAS)
TABELA 117 COSMÉTICOS/CUIDADOS PESSOAIS NO MERCADO DE POLIETILENOGLICOL DO CANADÁ, POR APLICAÇÃO, 2021-2030 (US$ MILHÕES)
TABELA 118 COSMÉTICOS/CUIDADOS PESSOAIS NO MERCADO DE POLIETILENOGLICOL DO CANADÁ, POR APLICAÇÃO, 2021-2030 (TONELADAS)
TABELA 119 CONSTRUÇÃO E EDIFICAÇÃO NO CANADÁ NO MERCADO DE POLIETILENOGLICOL, POR APLICAÇÃO, 2021-2030 (US$ MILHÕES)
TABELA 120 CONSTRUÇÃO E EDIFÍCIOS NO CANADÁ NO MERCADO DE POLIETILENOGLICOL, POR APLICAÇÃO, 2021-2030 (TONELADAS)
TABELA 121 MERCADO DE POLIETILENOGLICOL NO MÉXICO, POR GRAU, 2021-2030 (US$ MILHÕES)
TABELA 122 MERCADO DE POLIETILENOGLICOL NO MÉXICO, POR GRAU, 2021-2030 (TONELADAS)
TABELA 123 MERCADO DE POLIETILENOGLICOL NO MÉXICO, POR GRAU ASP, 2021-2030 (USD/TON)
TABELA 124 MERCADO DE POLIETILENOGLICOL NO MÉXICO, POR FORMA, 2021-2030 (US$ MILHÕES)
TABELA 125 MERCADO DE POLIETILENOGLICOL NO MÉXICO, POR FORMA, 2021-2030 (TONELADAS)
TABELA 126 MERCADO DE POLIETILENOGLICOL NO MÉXICO, POR FORMULÁRIO ASP, 2021-2030 (USD/TON)
TABELA 127 MERCADO DE POLIETILENOGLICOL NO MÉXICO, POR TAMANHO DE EMBALAGEM, 2021-2030 (US$ MILHÕES)
TABELA 128 MERCADO DE POLIETILENOGLICOL DO MÉXICO, POR TAMANHO DE EMBALAGEM, 2021-2030 (TONELADAS)
TABELA 129 MERCADO DE POLIETILENOGLICOL NO MÉXICO, POR TAMANHO DE EMBALAGEM ASP, 2021-2030 (USD/ TONELADA)
TABLE 130 MEXICO POLYETHYLENE GLYCOL MARKET, BY APPLICATION, 2021-2030 (USD MILLION)
TABLE 131 MEXICO POLYETHYLENE GLYCOL MARKET, BY APPLICATION, 2021-2030 (TONS)
TABLE 132 MEXICO HEALTHCARE IN POLYETHYLENE GLYCOL MARKET, BY APPLICATION, 2021-2030 (USD MILLION)
TABLE 133 MEXICO HEALTHCARE IN POLYETHYLENE GLYCOL MARKET, BY APPLICATION, 2021-2030 (TONS)
TABLE 134 MEXICO PHARMACEUTICALS IN POLYETHYLENE GLYCOL MARKET, BY CATEGORY, 2021-2030 (USD MILLION)
TABLE 135 MEXICO PHARMACEUTICALS IN POLYETHYLENE GLYCOL MARKET, BY CATEGORY, 2021-2030 (TONS)
TABLE 136 MEXICO COSMETICS/PERSONAL CARE IN POLYETHYLENE GLYCOL MARKET, BY APPLICATION, 2021-2030 (USD MILLION)
TABLE 137 MEXICO COSMETICS/PERSONAL CARE IN POLYETHYLENE GLYCOL MARKET, BY APPLICATION, 2021-2030 (TONS)
TABLE 138 MEXICO BUILDING AND CONSTRUCTION IN POLYETHYLENE GLYCOL MARKET, BY APPLICATION, 2021-2030 (USD MILLION)
TABLE 139 MEXICO BUILDING AND CONSTRUCTION IN POLYETHYLENE GLYCOL MARKET, BY APPLICATION, 2021-2030 (TONS)
Lista de Figura
FIGURE 1 NORTH AMERICA POLYETHYLENE GLYCOL MARKET: SEGMENTATION
FIGURE 2 NORTH AMERICA POLYETHYLENE GLYCOL MARKET: DATA TRIANGULATION
FIGURE 3 NORTH AMERICA POLYETHYLENE GLYCOL MARKET: DROC ANALYSIS
FIGURE 4 NORTH AMERICA POLYETHYLENE GLYCOL MARKET: NORTH AMERICA VS REGIONAL MARKET ANALYSIS
FIGURE 5 NORTH AMERICA POLYETHYLENE GLYCOL MARKET: COMPANY RESEARCH ANALYSIS
FIGURE 6 NORTH AMERICA POLYETHYLENE GLYCOL MARKET: INTERVIEW DEMOGRAPHICS
FIGURE 7 NORTH AMERICA POLYETHYLENE GLYCOL MARKET: DBMR MARKET POSITION GRID
FIGURE 8 NORTH AMERICA POLYETHYLENE GLYCOL MARKET: MARKET APPLICATION COVERAGE GRID
FIGURE 9 NORTH AMERICA POLYETHYLENE GLYCOL MARKET: SEGMENTATION
FIGURE 10 THE GROWTH IN CONSTRUCTION AND BUILDING INDUSTRIES AND RISING DEMAND FOR WATER-BASED PAINTS TO PROVIDE A HIGH QUALITY PROTECTIVE COATING IS DRIVING THE GROWTH OF THE NORTH AMERICA POLYETHYLENE GLYCOL MARKET IN THE FORECAST PERIOD OF 2023 TO 2030
FIGURE 11 PEG 400 SEGMENT IS EXPECTED TO ACCOUNT FOR THE LARGEST SHARE OF THE NORTH AMERICA POLYETHYLENE GLYCOL MARKET IN 2023- 2030
FIGURE 12 IMPORT EXPORT SCENARIO (USD THOUSAND)
FIGURE 13 DRIVERS, RESTRAINTS, OPPORTUNITIES, AND CHALLENGES OF THE NORTH AMERICA POLYETHYLENE GLYCOL MARKET
FIGURE 14 NORTH AMERICA POLYETHYLENE GLYCOL MARKET, BY GRADE, 2022
FIGURE 15 NORTH AMERICA POLYETHYLENE GLYCOL MARKET, BY FORM, 2022
FIGURE 16 NORTH AMERICA POLYETHYLENE GLYCOL MARKET, BY PACKAGING SIZE, 2022
FIGURE 17 NORTH AMERICA POLYETHYLENE GLYCOL MARKET, BY APPLICATION, 2022
FIGURE 18 NORTH AMERICA POLYETHYLENE GLYCOL MARKET: SNAPSHOT (2022)
FIGURE 19 NORTH AMERICA POLYETHYLENE GLYCOL MARKET: BY COUNTRY (2022)
FIGURE 20 NORTH AMERICA POLYETHYLENE GLYCOL MARKET: BY COUNTRY (2023 & 2030)
FIGURE 21 NORTH AMERICA POLYETHYLENE GLYCOL MARKET: BY COUNTRY (2022 & 2030)
FIGURE 22 NORTH AMERICA POLYETHYLENE GLYCOL MARKET: BY GRADE (2023-2030)
FIGURE 23 NORTH AMERICA POLYETHYLENE GLYCOL MARKET: COMPANY SHARE 2022 (%)
Metodologia de Investigação
A recolha de dados e a análise do ano base são feitas através de módulos de recolha de dados com amostras grandes. A etapa inclui a obtenção de informações de mercado ou dados relacionados através de diversas fontes e estratégias. Inclui examinar e planear antecipadamente todos os dados adquiridos no passado. Da mesma forma, envolve o exame de inconsistências de informação observadas em diferentes fontes de informação. Os dados de mercado são analisados e estimados utilizando modelos estatísticos e coerentes de mercado. Além disso, a análise da quota de mercado e a análise das principais tendências são os principais fatores de sucesso no relatório de mercado. Para saber mais, solicite uma chamada de analista ou abra a sua consulta.
A principal metodologia de investigação utilizada pela equipa de investigação do DBMR é a triangulação de dados que envolve a mineração de dados, a análise do impacto das variáveis de dados no mercado e a validação primária (especialista do setor). Os modelos de dados incluem grelha de posicionamento de fornecedores, análise da linha de tempo do mercado, visão geral e guia de mercado, grelha de posicionamento da empresa, análise de patentes, análise de preços, análise da quota de mercado da empresa, normas de medição, análise global versus regional e de participação dos fornecedores. Para saber mais sobre a metodologia de investigação, faça uma consulta para falar com os nossos especialistas do setor.
Personalização disponível
A Data Bridge Market Research é líder em investigação formativa avançada. Orgulhamo-nos de servir os nossos clientes novos e existentes com dados e análises que correspondem e atendem aos seus objetivos. O relatório pode ser personalizado para incluir análise de tendências de preços de marcas-alvo, compreensão do mercado para países adicionais (solicite a lista de países), dados de resultados de ensaios clínicos, revisão de literatura, mercado remodelado e análise de base de produtos . A análise de mercado dos concorrentes-alvo pode ser analisada desde análises baseadas em tecnologia até estratégias de carteira de mercado. Podemos adicionar quantos concorrentes necessitar de dados no formato e estilo de dados que procura. A nossa equipa de analistas também pode fornecer dados em tabelas dinâmicas de ficheiros Excel em bruto (livro de factos) ou pode ajudá-lo a criar apresentações a partir dos conjuntos de dados disponíveis no relatório.

