U.S. Chemical Distribution Market, By Chemical Type (Commodity Chemicals, Specialty Chemicals), Distribution Channel (B2B, Third Party Distribution, E-commerce and Others), Distribution Method (Airways Distribution, Rail Distribution, Road Distribution and Shipping Distribution), Chemical Packaging (Drums, Intermediate Bulk Container (IBC), Flexitanks and Others), Packaging Size (100 to 250 Liters, 250 to 500 Liters and above 500 Liters) Industry Trends and Forecast to 2029
Market Analysis and Insights: U.S. Chemical Distribution Market
The U.S. chemical distribution market is expected to gain market growth in the forecast period of 2022 to 2029. Data Bridge Market Research analyses that the market is growing at a CAGR of 5.3% in the forecast period of 2022 to 2029 and expected to reach USD 1,30,12,893.29 thousand by 2029. The major factor driving the market is rising consumption of chemicals across numerous industries.
Chemical distribution is known to be the transport and storage of packaged and bulk chemicals. These are frequently distributed through containers, pipelines, barrels and sacks. Chemical industry produces several chemicals like raw materials for industrial sectors, which includes cosmetics, oil and petroleum, food, paint, textile, building construction and agriculture.
The major factor driving the growth of the distribution chemicals market is the rising consumption of chemicals across numerous industries. Also the technological development in chemical industries is driving the market. Rising awareness regarding the negative impacts of chemicals on the health and environment is restraining the market. Growing attention of high quality products due to shifting consumer preference is acting as viable opportunity that can support the market. Stringent government regulations for the commercialization and usage of various specialty chemicals is a challenging factor for the market.
This chemical distribution market report provides details of market share, new developments, and product pipeline analysis, impact of domestic and localised market players, analyses opportunities in terms of emerging revenue pockets, changes in market regulations, product approvals, strategic decisions, product launches, geographic expansions, and technological innovations in the market. To understand the analysis and the market scenario contact us for an Analyst Brief, our team will help you create a revenue impact solution to achieve your desired goal.
 U.S. Chemical Distribution Market Scope and Market Size
The U.S. chemical distribution market is segmented of the basis into the chemical type, distribution channel, distribution method, chemical packaging and packaging size. The growth among segments helps you analyse niche pockets of growth and strategies to approach the market and determine your core application areas and the difference in your target markets.
- On the basis of chemical type, the chemical distribution market are segmented into commodity chemicals and specialty chemicals. In 2022, commodity chemicals segment is expected to dominate in U.S. because commodity chemicals are multi-purpose and are used by many different businesses and industries.
- On the basis of distribution channel, the chemical distribution market are segmented into B2B, third party distribution, E-commerce and others. In 2022, B2B is expected to dominate in U.S. because it provides convenience, higher profits and improved security to buyers and sellers.
- On the basis of distribution method, the chemical distribution market are segmented into airways distribution, rail distribution, road distribution and shipping distribution. In 2022, rail distribution is expected to dominate in U.S. because rail distribution is cheaper and suitable for long-distance distribution and also it has more carrier capacity.
- On the basis of chemical packaging, the chemical distribution market are segmented into drums, Intermediate Bulk Container (IBC), flexitanks and others. In 2022, Intermediate Bulk Containers (IBC) is expected to dominate in U.S. because it is most suitable in case of bulk chemical distribution and IBC has zero wastage quality.
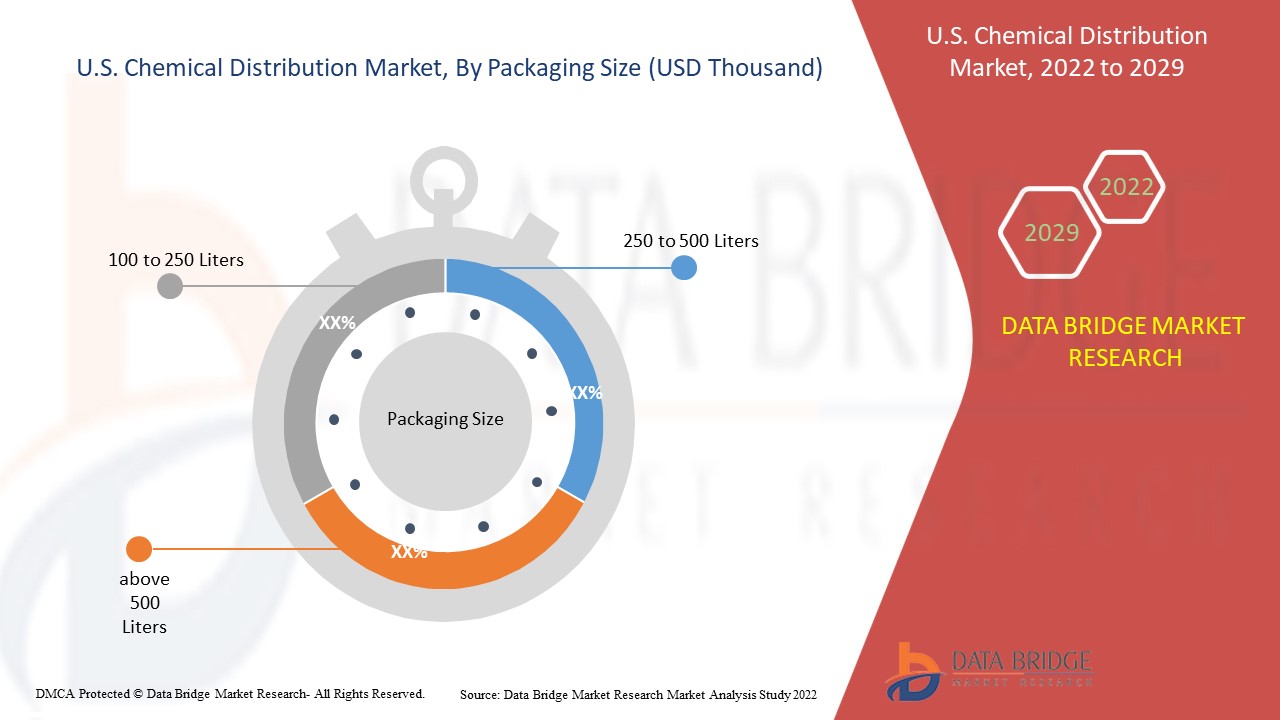
- On the basis of packaging size, the chemical distribution market are segmented into 100 to 250 liters, 250 to 500 liters and above 500 liters. In 2022, 250 to 500 liters is expected to dominate in U.S. because it is suitable for international and domestic transporting in bulk.
Growth in the Chemical Distribution industry
The U.S. chemical distribution market also provides you with detailed market analysis for every country growth in installed base of different kind of products for chemical distribution market, impact of technology using life line curves and changes in infant formula regulatory scenarios and their impact on the chemical distribution market. The data is available for historic period 2011 to 2019.
Competitive Landscape and Chemical Distribution Market Share Analysis
U.S. chemical distribution market competitive landscape provides details by competitor. Details included are company overview, company financials, revenue generated, market potential, investment in research and development, new market initiatives, global presence, production sites and facilities, company strengths and weaknesses, product launch, clinical trials pipelines, brand analysis, product approvals, patents, product width and breadth, application dominance, technology lifeline curve. The above data points provided are only related to the company’s focus related to U.S. chemical distribution market.
Some of the major players covered in the report are Brenntag SE, DKSH Management Ltd., Univar Solutions Inc., Hydrite Chemical, Wilbur-Ellis Holdings, Inc., IMCD Group, ICC Industries Inc., Azelis, HELM AG, Aceto, Prinova Group LLC., Barentz, Caldic B.V., Safic-Alcan, GTM and other domestic and regional players. DBMR analysts understand competitive strengths and provide competitive analysis for each competitor separately.
For instance,
- In August 2021, Brenntag SE, the global market leader in chemicals and ingredients distribution, acquires all operating assets and business of Matrix Chemical, LLC. The company is a solvents distributor and the largest distributor of acetone in North America. This acquisition will help Brenntag SE to cater the demand of customers in North America efficiently.
- In August 2021, Univar Solutions Inc. announced that it has begun construction on a new custom-designed facility in Abbotsford, British Columbia, Canada. The SAP-ready facility is expected to open during the first half of 2023 and aligns with the Company's long-term sustainability commitment to achieve net-zero emissions by 2050. This expansion will help the company to acquire a more customer base.
SKU-
Obtenha acesso online ao relatório sobre a primeira nuvem de inteligência de mercado do mundo

- Painel interativo de análise de dados
- Painel de análise da empresa para oportunidades de elevado potencial de crescimento
- Acesso de analista de pesquisa para personalização e customização. consultas
- Análise da concorrência com painel interativo
- Últimas notícias, atualizações e atualizações Análise de tendências
- Aproveite o poder da análise de benchmark para um rastreio abrangente da concorrência
Índice
1 INTRODUÇÃO
1.1 OBJETIVOS DO ESTUDO
1.2 DEFINIÇÃO DE MERCADO
1.3 VISÃO GERAL DO MERCADO DE DISTRIBUIÇÃO DE PRODUTOS QUÍMICOS NOS EUA
1.4 LIMITAÇÃO
1,5 MERCADOS COBERTOS
2 SEGMENTAÇÃO DE MERCADO
2.1 MERCADOS COBERTOS
2.2 ÂMBITO GEOGRÁFICO
2,3 ANOS CONSIDERADOS PARA O ESTUDO
2.4 MOEDA E PREÇOS
2.5 MODELO DE VALIDAÇÃO DE DADOS TRIPÉ DBMR
2.6 TIPO CURVA DE LINHA DE VIDA
2.7 MODELAGEM MULTIVARIADA
2.8 ENTREVISTAS PRINCIPAIS COM PRINCIPAIS LÍDERES DE OPINIÃO
2.9 GRADE DE POSIÇÃO DE MERCADO DBMR
2.1 MATRIZ DE DESAFIOS DO MERCADO DBMR
2.11 ANÁLISE DA PARTICIPAÇÃO DO FORNECEDOR
2.12 DADOS DE IMPORTAÇÃO E EXPORTAÇÃO
2.13 FONTES SECUNDÁRIAS
2.14 PREMISSAS
3 RESUMO EXECUTIVO
4 INSIGHTS PREMIUM
4.1 RESUMO REGIONAL
4.1.1 EUA
4.1.2 CANADÁ
4.1.3 MÉXICO
5 VISÃO GERAL DO MERCADO
5.1 MOTORISTAS
5.1.1 AUMENTO DO CONSUMO DE PRODUTOS QUÍMICOS EM VÁRIOS SETORES
5.1.2 AUMENTO DA POPULARIDADE DA INFRAESTRUTURA SUSTENTÁVEL E VERDE
5.1.3 AVANÇOS TECNOLÓGICOS NA PRODUÇÃO QUÍMICA
5.1.4 CRESCENTE UTILIZAÇÃO DE PRODUTOS QUÍMICOS A GRANEL E ESPECIAIS NAS INDÚSTRIAS DE PETRÓLEO, GÁS E PETRÓLEO
5.2 RESTRIÇÕES
5.2.1 AUMENTANDO A CONSCIENTIZAÇÃO SOBRE OS IMPACTOS NEGATIVOS DOS PRODUTOS QUÍMICOS NA SAÚDE E NO MEIO AMBIENTE
5.2.2 VOLATILIDADE NA PREÇOS DE PRODUTOS QUÍMICOS
5.3 OPORTUNIDADES
5.3.1 ATENÇÃO CRESCENTE A PRODUTOS DE ALTA QUALIDADE DEVIDO À MUDANÇA NA PREFERÊNCIA DO CONSUMIDOR
5.3.2 AUMENTO DO INVESTIMENTO EM P&D POR PARTE DOS FABRICANTES DE PRODUTOS QUÍMICOS PARA EXPANDIR AS UNIDADES DE PRODUÇÃO
5.4 DESAFIOS
5.4.1 REGULAMENTAÇÕES GOVERNAMENTAIS RIGOROSAS PARA COMERCIALIZAÇÃO E USO DE VÁRIOS PRODUTOS QUÍMICOS ESPECIAIS
5.4.2 DINÂMICA DA CADEIA DE SUPRIMENTOS INTERROMPIDA
6 IMPACTO DA COVID-19 NOS EUA. MERCADO DE DISTRIBUIÇÃO DE PRODUTOS QUÍMICOS
6.1 ANÁLISE DO IMPACTO DA COVID-19 NO MERCADO DE DISTRIBUIÇÃO DE PRODUTOS QUÍMICOS DOS EUA
6.2 IMPACTO EM EMBALAGENS SUSTENTÁVEIS
6.3 IMPACTO NO SETOR DA CONSTRUÇÃO
6.4 INICIATIVAS GOVERNAMENTAIS E DECISÕES ESTRATÉGICAS DOS FABRICANTES PARA IMPULSIONAR O MERCADO
6.5 IMPACTO NO PREÇO
6.6 IMPACTO NA DEMANDA
6.7 IMPACTO NA CADEIA DE SUPRIMENTOS
6.8 CONCLUSÃO
7 MERCADO DE DISTRIBUIÇÃO DE PRODUTOS QUÍMICOS NOS EUA, POR TIPO DE PRODUTO QUÍMICO
7.1 VISÃO GERAL
7.2 PRODUTOS QUÍMICOS DE COMMODITIES
7.2.1 PETROQUÍMICOS
7.2.2 ORGÂNICOS
7.2.3 PLÁSTICOS E POLÍMEROS
7.2.4 BORRACHA SINTÉTICA
7.2.5 INORGÂNICOS
7.2.6 FIBRAS
7.2.7 FILMES
7.2.8 EXPLOSIVOS
7.2.9 OUTROS
7.3 PRODUTOS QUÍMICOS ESPECIAIS
7.3.1 AGROQUÍMICOS
7.3.2 CASO
7.3.3 POLÍMEROS E RESINAS ESPECIAIS (SPR)
7.3.4 ELECTRONIC CHEMICALS
7.3.5 FLAVOR & FRAGRANCES
7.3.6 PERSONAL CARE ACTIVE INGREDIENTS (PCAI)
7.3.7 OTHERS
8 U.S.. CHEMICAL DISTRIBUTION MARKET, BY CHEMICAL PACKAGING
8.1 OVERVIEW
8.2 INTERMEDIATE BULK CONTAINER (IBC)
8.3 DRUMS
8.4 FLEXITANKS
8.5 OTHERS
9 U.S.. CHEMICAL DISTRIBUTION MARKET, BY PACKAGING SIZE
9.1 OVERVIEW
9.2 250 TO 500 LITERS
9.3 ABOVE 500 LITERS
9.4 100 TO 250 LITERS
10 U.S.. CHEMICAL DISTRIBUTION MARKET, BY DISTRIBUTION METHOD
10.1 OVERVIEW
10.2 RAIL DISTRIBUTION
10.3 ROAD DISTRIBUTION
10.4 SHIPPING DISTRIBUTION
10.5 AIRWAYS DISTRIBUTION
11 U.S.. CHEMICAL DISTRIBUTION MARKET, BY DISTRIBUTION CHANNEL
11.1 OVERVIEW
11.2 B2B
11.3 E-COMMERCE
11.4 THIRD PARTY DISTRIBUTION
11.5 OTHERS
12 U.S.. CHEMICAL DISTRIBUTION MARKET, BY COUNTRY
12.1 U.S.
13 U.S.. CHEMICAL DISTRIBUTION MARKET: COMPANY LANDSCAPE
13.1 COMPANY SHARE ANALYSIS: U.S..
13.2 PARTNERSHIPS & ACQUISITIONS
13.3 EXPANSIONS
13.4 NEW PRODUCT DEVELOPMENT
14 SWOT ANALYSIS
15 COMPANY PROFILES
15.1 BRENNTAG SE
15.1.1 COMPANY SNAPSHOT
15.1.2 REVENUE ANALYSIS
15.1.3 PRODUCT PORTFOLIO
15.1.4 RECENT UPDATES
15.2 UNIVAR SOLUTIONS INC.
15.2.1 COMPANY SNAPSHOT
15.2.2 REVENUE ANALYSIS
15.2.3 PRODUCT PORTFOLIO
15.2.4 RECENT UPDATES
15.3 DKSH MANAGEMENT LTD.
15.3.1 COMPANY SNAPSHOT
15.3.2 REVENUE ANALYSIS
15.3.3 PRODUCT PORTFOLIO
15.3.4 RECENT UPDATES
15.4 IMCD GROUP B.V.
15.4.1 COMPANY SNAPSHOT
15.4.2 REVENUE ANALYSIS
15.4.3 PRODUCT PORTFOLIO
15.4.4 RECENT UPDATES
15.5 HYDRITE CHEMICALS
15.5.1 COMPANY SNAPSHOT
15.5.2 PRODUCT PORTFOLIO
15.5.3 RECENT UPDATES
15.6 AZELIS
15.6.1 COMPANY SNAPSHOT
15.6.2 REVENUE ANALYSIS
15.6.3 PRODUCT PORTFOLIO
15.6.4 RECENT UPDATES
15.7 WILBUR-ELLIS HOLDINDS INC.
15.7.1 COMPANY SNAPSHOT
15.7.2 PRODUCT PORTFOLIO
15.7.3 RECENT UPDATES
15.8 ICC INDUSTRIES INC.
15.8.1 COMPANY SNAPSHOT
15.8.2 PRODUCT PORTFOLIO
15.8.3 RECENT UPDATE
15.9 ACETO
15.9.1 COMPANY SNAPSHOT
15.9.2 PRODUCT PORTFOLIO
15.9.3 RECENT UPDATES
15.1 BARENTZ
15.10.1 COMPANY SNAPSHOT
15.10.2 PRODUCT PORTFOLIO
15.10.3 RECENT UPDATES
15.11 CALDIC B.V.
15.11.1 COMPANY SNAPSHOT
15.11.2 PRODUCT PORTFOLIO
15.11.3 RECENT UPDATE
15.12 GTM
15.12.1 COMPANY SNAPSHOT
15.12.2 PRODUCT PORTFOLIO
15.12.3 RECENT UPDATES
15.13 HELM AG
15.13.1 COMPANY SNAPSHOT
15.13.2 PRODUCT PORTFOLIO
15.13.3 RECENT UPDATES
15.14 PRINOVA GROUP LLC.
15.14.1 COMPANY SNAPSHOT
15.14.2 PRODUCT PORTFOLIO
15.14.3 RECENT UPDATE
15.15 SALFIC ALCAN
15.15.1 COMPANY SNAPSHOT
15.15.2 PRODUCT PORTFOLIO
15.15.3 RECENT UPDATES
16 QUESTIONNAIRE
17 RELATED REPORTS
Lista de Tabela
TABELA 1 DADOS DE IMPORTAÇÃO DE PRODUTOS QUÍMICOS; CÓDIGO SH - 2901 (USD MIL)
TABELA 2 DADOS DE EXPORTAÇÃO DE PRODUTOS QUÍMICOS; CÓDIGO SH - 2901 (MIL USD)
TABELA 3: MERCADO DE DISTRIBUIÇÃO DE PRODUTOS QUÍMICOS NOS EUA, POR TIPO DE PRODUTO QUÍMICO, 2020-2029 (MIL DÓLARES AMERICANOS)
TABELA 4: MERCADO DE DISTRIBUIÇÃO DE PRODUTOS QUÍMICOS NOS EUA, POR TIPO DE PRODUTO QUÍMICO, 2020-2029 (TONELADAS)
TABELA 5 EUA. PRODUTOS QUÍMICOS DE COMMODITIES NO MERCADO DE DISTRIBUIÇÃO DE PRODUTOS QUÍMICOS, POR TIPO, 2020-2029 (MIL USD)
TABELA 6 EUA. PRODUTOS QUÍMICOS ESPECIAIS NO MERCADO DE DISTRIBUIÇÃO DE PRODUTOS QUÍMICOS, POR TIPO, 2020-2029 (MIL USD)
TABELA 7: MERCADO DE DISTRIBUIÇÃO DE PRODUTOS QUÍMICOS NOS EUA, POR EMBALAGEM DE PRODUTOS QUÍMICOS, 2020-2029 (MIL DÓLARES AMERICANOS)
TABELA 8: MERCADO DE DISTRIBUIÇÃO DE PRODUTOS QUÍMICOS NOS EUA, POR TAMANHO DE EMBALAGEM, 2020-2029 (MIL USD)
TABELA 9: MERCADO DE DISTRIBUIÇÃO DE PRODUTOS QUÍMICOS NOS EUA, POR MÉTODO DE DISTRIBUIÇÃO, 2020-2029 (MIL USD)
TABELA 10 MERCADO DE DISTRIBUIÇÃO DE PRODUTOS QUÍMICOS NOS EUA, POR CANAL DE DISTRIBUIÇÃO, 2020-2029 (MIL USD)
TABELA 11 MERCADO DE DISTRIBUIÇÃO DE PRODUTOS QUÍMICOS NOS EUA, POR PAÍS, 2020-2029 (MIL USD)
TABELA 12: MERCADO DE DISTRIBUIÇÃO DE PRODUTOS QUÍMICOS NOS EUA, POR PAÍS, 2020-2029 (TONELADAS)
TABELA 13 MERCADO DE DISTRIBUIÇÃO DE PRODUTOS QUÍMICOS NOS EUA, POR TIPO DE PRODUTO QUÍMICO, 2020-2029 (MIL USD)
TABELA 14 MERCADO DE DISTRIBUIÇÃO DE PRODUTOS QUÍMICOS NOS EUA, POR TIPO DE PRODUTO QUÍMICO, 2020-2029 (TONELADAS)
TABELA 15 PRODUTOS QUÍMICOS DE COMMODITIES DOS EUA NO MERCADO DE DISTRIBUIÇÃO QUÍMICA, POR TIPO DE PRODUTO QUÍMICO, 2020-2029 (MIL USD)
TABELA 16 PRODUTOS QUÍMICOS ESPECIAIS NO MERCADO DE DISTRIBUIÇÃO QUÍMICA DOS EUA, POR TIPO DE PRODUTO QUÍMICO, 2020-2029 (MIL USD)
TABELA 17 MERCADO DE DISTRIBUIÇÃO DE PRODUTOS QUÍMICOS NOS EUA, POR EMBALAGEM DE PRODUTOS QUÍMICOS, 2020-2029 (MIL USD)
TABELA 18 MERCADO DE DISTRIBUIÇÃO DE PRODUTOS QUÍMICOS NOS EUA, POR TAMANHO DE EMBALAGEM, 2020-2029 (MIL USD)
TABELA 19 MERCADO DE DISTRIBUIÇÃO DE PRODUTOS QUÍMICOS NOS EUA, POR MÉTODO DE DISTRIBUIÇÃO, 2020-2029 (MIL USD)
TABELA 20 MERCADO DE DISTRIBUIÇÃO DE PRODUTOS QUÍMICOS NOS EUA, POR CANAL DE DISTRIBUIÇÃO, 2020-2029 (MIL USD)
Lista de Figura
FIGURA 1 MERCADO DE DISTRIBUIÇÃO DE PRODUTOS QUÍMICOS NOS EUA
FIGURA 2 EUA. MERCADO DE DISTRIBUIÇÃO DE PRODUTOS QUÍMICOS: TRIANGULAÇÃO DE DADOS
FIGURA 3 MERCADO DE DISTRIBUIÇÃO DE PRODUTOS QUÍMICOS NOS EUA: ANÁLISE DROC
FIGURA 4 MERCADO DE DISTRIBUIÇÃO DE PRODUTOS QUÍMICOS NOS EUA: ANÁLISE DE MERCADO REGIONAL VS. PAÍS
FIGURA 5 MERCADO DE DISTRIBUIÇÃO DE PRODUTOS QUÍMICOS NOS EUA: ANÁLISE DE PESQUISA DA EMPRESA
FIGURA 6 EUA. MERCADO DE DISTRIBUIÇÃO DE PRODUTOS QUÍMICOS: TIPO CURVA DE LINHA DE VIDA
FIGURA 7 EUA. MERCADO DE DISTRIBUIÇÃO DE PRODUTOS QUÍMICOS: MODELAGEM MULTIVARIADA
FIGURA 8 MERCADO DE DISTRIBUIÇÃO DE PRODUTOS QUÍMICOS NOS EUA: DEMOGRAFIA DAS ENTREVISTAS
FIGURA 9 MERCADO DE DISTRIBUIÇÃO DE PRODUTOS QUÍMICOS DOS EUA: GRADE DE POSIÇÃO DE MERCADO DE DBMR
FIGURA 10 MERCADO DE DISTRIBUIÇÃO DE PRODUTOS QUÍMICOS DOS EUA: A MATRIZ DO DESAFIO DO MERCADO
FIGURA 11 MERCADO DE DISTRIBUIÇÃO DE PRODUTOS QUÍMICOS DOS EUA: ANÁLISE DA PARTICIPAÇÃO DOS FORNECEDORES
FIGURA 12 MERCADO DE DISTRIBUIÇÃO DE PRODUTOS QUÍMICOS NOS EUA: SEGMENTAÇÃO
FIGURA 13: O AUMENTO DO CONSUMO DE PRODUTOS QUÍMICOS EM DIVERSOS SETORES ESTÁ NOS IMPULSIONANDO. MERCADO DE DISTRIBUIÇÃO DE PRODUTOS QUÍMICOS NO PERÍODO PREVISTO DE 2022 A 2029
FIGURA 14: O SEGMENTO DE COMMODITY CHEMICALS DEVE REPRESENTAR A MAIOR PARTICIPAÇÃO DO MERCADO DE DISTRIBUIÇÃO DE PRODUTOS QUÍMICOS NOS EUA EM 2022 E 2029
FIGURA 15 MOTIVADORES, RESTRIÇÕES, OPORTUNIDADES E DESAFIOS DO MERCADO DE DISTRIBUIÇÃO DE PRODUTOS QUÍMICOS NOS EUA
FIGURA 16 MERCADO DE DISTRIBUIÇÃO DE PRODUTOS QUÍMICOS NOS EUA, POR TIPO DE PRODUTO QUÍMICO (MIL USD) (2021)
FIGURA 17 MERCADO DE DISTRIBUIÇÃO DE PRODUTOS QUÍMICOS NOS EUA, POR EMBALAGEM DE PRODUTOS QUÍMICOS (MIL USD) (2021)
FIGURA 18 MERCADO DE DISTRIBUIÇÃO DE PRODUTOS QUÍMICOS NOS EUA, POR TAMANHO DE EMBALAGEM (MIL USD) (2021)
FIGURA 19 MERCADO DE DISTRIBUIÇÃO DE PRODUTOS QUÍMICOS NOS EUA, POR MÉTODO DE DISTRIBUIÇÃO (MIL USD) (2021)
FIGURA 20 MERCADO DE DISTRIBUIÇÃO DE PRODUTOS QUÍMICOS NOS EUA, POR CANAL DE DISTRIBUIÇÃO (MIL USD) (2021)
FIGURA 21 MERCADO DE DISTRIBUIÇÃO DE PRODUTOS QUÍMICOS NOS EUA: RESUMO (2021)
FIGURA 22 MERCADO DE DISTRIBUIÇÃO DE PRODUTOS QUÍMICOS NOS EUA: POR PAÍS (2021)
FIGURA 23 MERCADO DE DISTRIBUIÇÃO DE PRODUTOS QUÍMICOS NOS EUA: POR PAÍS (2022 E 2029)
FIGURA 24 MERCADO DE DISTRIBUIÇÃO DE PRODUTOS QUÍMICOS NOS EUA: POR PAÍS (2021 E 2029)
FIGURA 25 MERCADO DE DISTRIBUIÇÃO DE PRODUTOS QUÍMICOS NOS EUA: POR TIPO DE PRODUTO QUÍMICO (2022-2029)
FIGURA 26 MERCADO DE DISTRIBUIÇÃO DE PRODUTOS QUÍMICOS NOS EUA: PARTICIPAÇÃO DA EMPRESA EM 2021 (%)
Metodologia de Investigação
A recolha de dados e a análise do ano base são feitas através de módulos de recolha de dados com amostras grandes. A etapa inclui a obtenção de informações de mercado ou dados relacionados através de diversas fontes e estratégias. Inclui examinar e planear antecipadamente todos os dados adquiridos no passado. Da mesma forma, envolve o exame de inconsistências de informação observadas em diferentes fontes de informação. Os dados de mercado são analisados e estimados utilizando modelos estatísticos e coerentes de mercado. Além disso, a análise da quota de mercado e a análise das principais tendências são os principais fatores de sucesso no relatório de mercado. Para saber mais, solicite uma chamada de analista ou abra a sua consulta.
A principal metodologia de investigação utilizada pela equipa de investigação do DBMR é a triangulação de dados que envolve a mineração de dados, a análise do impacto das variáveis de dados no mercado e a validação primária (especialista do setor). Os modelos de dados incluem grelha de posicionamento de fornecedores, análise da linha de tempo do mercado, visão geral e guia de mercado, grelha de posicionamento da empresa, análise de patentes, análise de preços, análise da quota de mercado da empresa, normas de medição, análise global versus regional e de participação dos fornecedores. Para saber mais sobre a metodologia de investigação, faça uma consulta para falar com os nossos especialistas do setor.
Personalização disponível
A Data Bridge Market Research é líder em investigação formativa avançada. Orgulhamo-nos de servir os nossos clientes novos e existentes com dados e análises que correspondem e atendem aos seus objetivos. O relatório pode ser personalizado para incluir análise de tendências de preços de marcas-alvo, compreensão do mercado para países adicionais (solicite a lista de países), dados de resultados de ensaios clínicos, revisão de literatura, mercado remodelado e análise de base de produtos . A análise de mercado dos concorrentes-alvo pode ser analisada desde análises baseadas em tecnologia até estratégias de carteira de mercado. Podemos adicionar quantos concorrentes necessitar de dados no formato e estilo de dados que procura. A nossa equipa de analistas também pode fornecer dados em tabelas dinâmicas de ficheiros Excel em bruto (livro de factos) ou pode ajudá-lo a criar apresentações a partir dos conjuntos de dados disponíveis no relatório.

