Global Optical Power Meter Market, By Type (Thermal Detectors and Photo Detectors), Instrument/Product Type (Benchtop Meter, Portable Meter, Virtual Meters, Optical Wavelength, Hand-Held Meter, and Others), Detector Type (InGaAs (Indium Gallium Arsenide), Germanium, Silicon, and Others), Power Range (High, Medium, and Low), Wavelength (850NM TO 1650NM and 400NM to 1100NM), Light Source (Laser, and LED), Application (Installation & Maintenance, Testing, Manufacturing, Research & Development, and Others), End User (Telecommunication Industry, Electrical & Electronics Industry, Automotive Industry, Military & Aerospace Industry, Energy & Utilities Industry, and Others) – Industry Trends and Forecast to 2030.
Optical Power Meter Market Analysis and Size
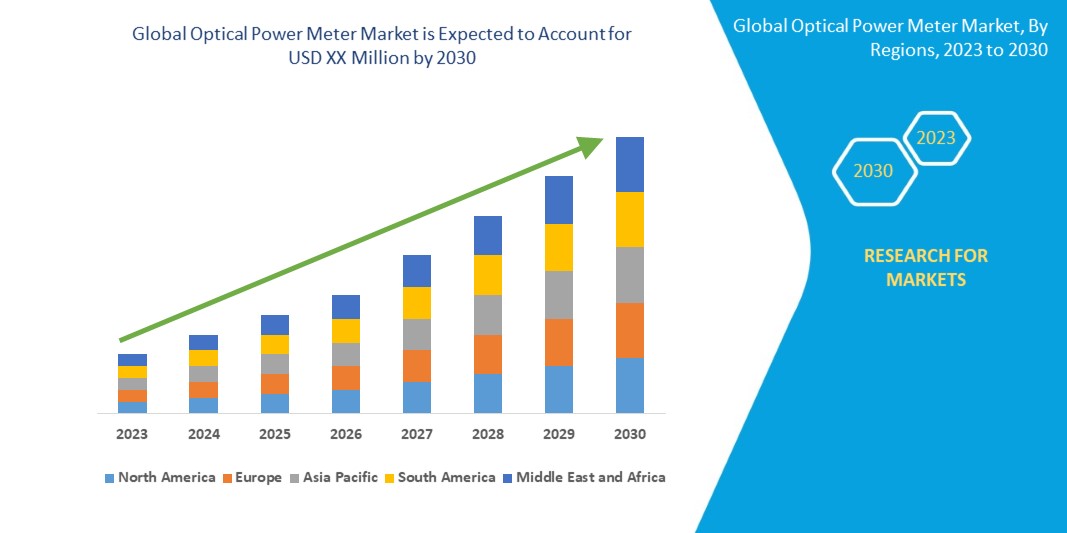
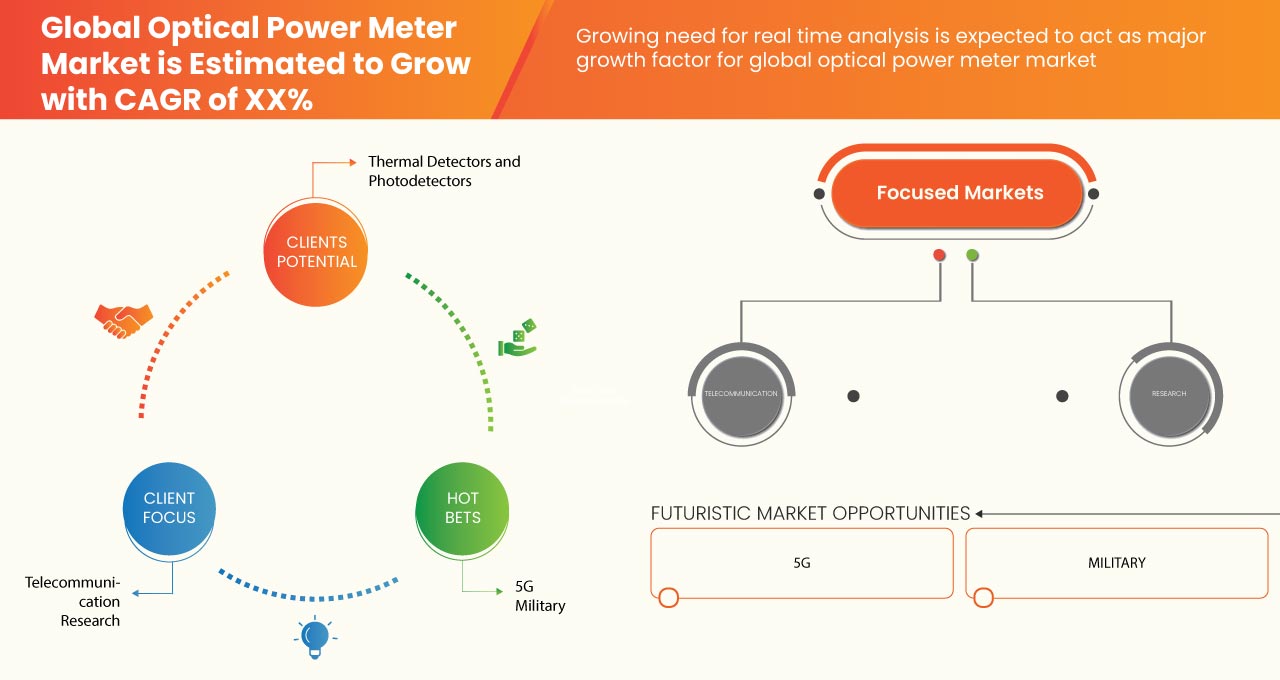
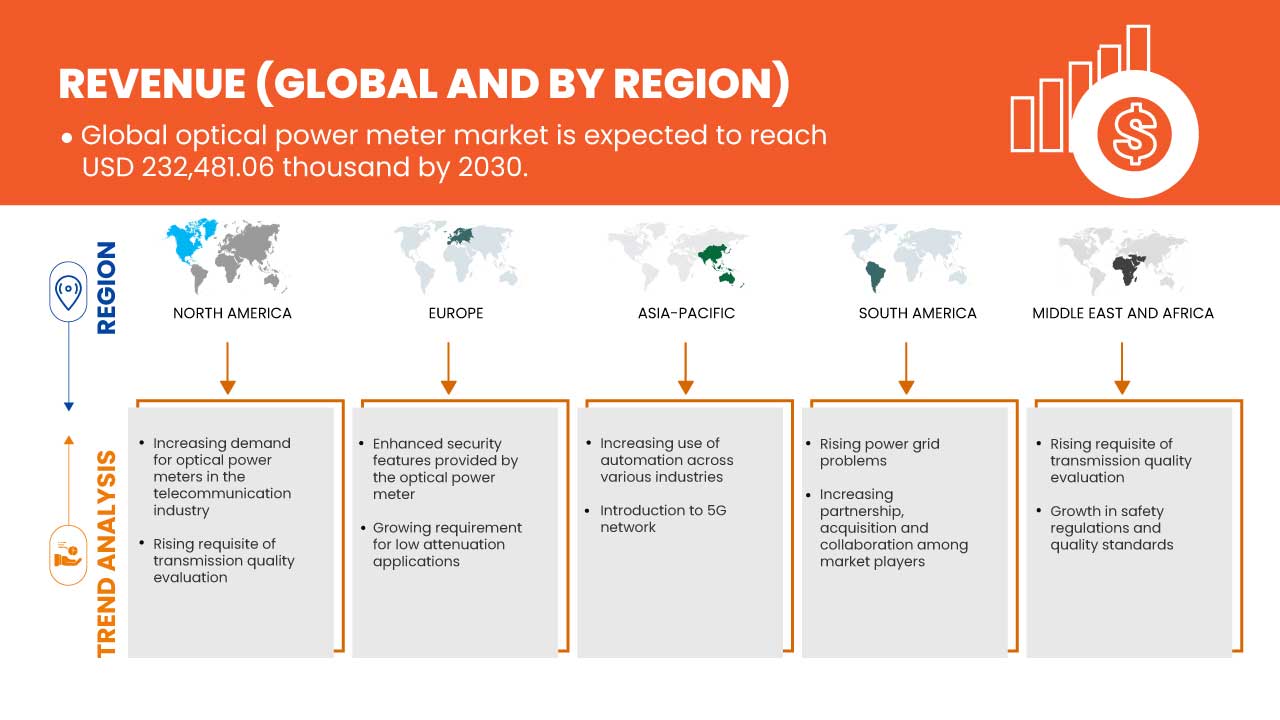
Global optical power meter market is expected to gain market growth in the forecast period of 2023 to 2030. Data Bridge Market Research analyses that the market is growing with a CAGR of 6.5%. Growing demand for research and development activities is acting as the major factor for the growth of the market.
This optical power meter market report provides details of market share, new developments, and product pipeline analysis, the impact of domestic and localized market players, analyses opportunities in terms of emerging revenue pockets, changes in market regulations, product approvals, strategic decisions, product launches, geographic expansions, and technological innovations in the market. To understand the analysis and the market scenario, contact us for an Analyst Brief, and our team will help you create a revenue impact solution to achieve your desired goal.
|
Report Metric |
Details |
|
Forecast Period |
2023 to 2030 |
|
Base Year |
2022 |
|
Historic Years |
2021 (Customizable to 2015-2020) |
|
Quantitative Units |
Revenue in Thousand, Volumes in Units, Pricing in USD |
|
Segments Covered |
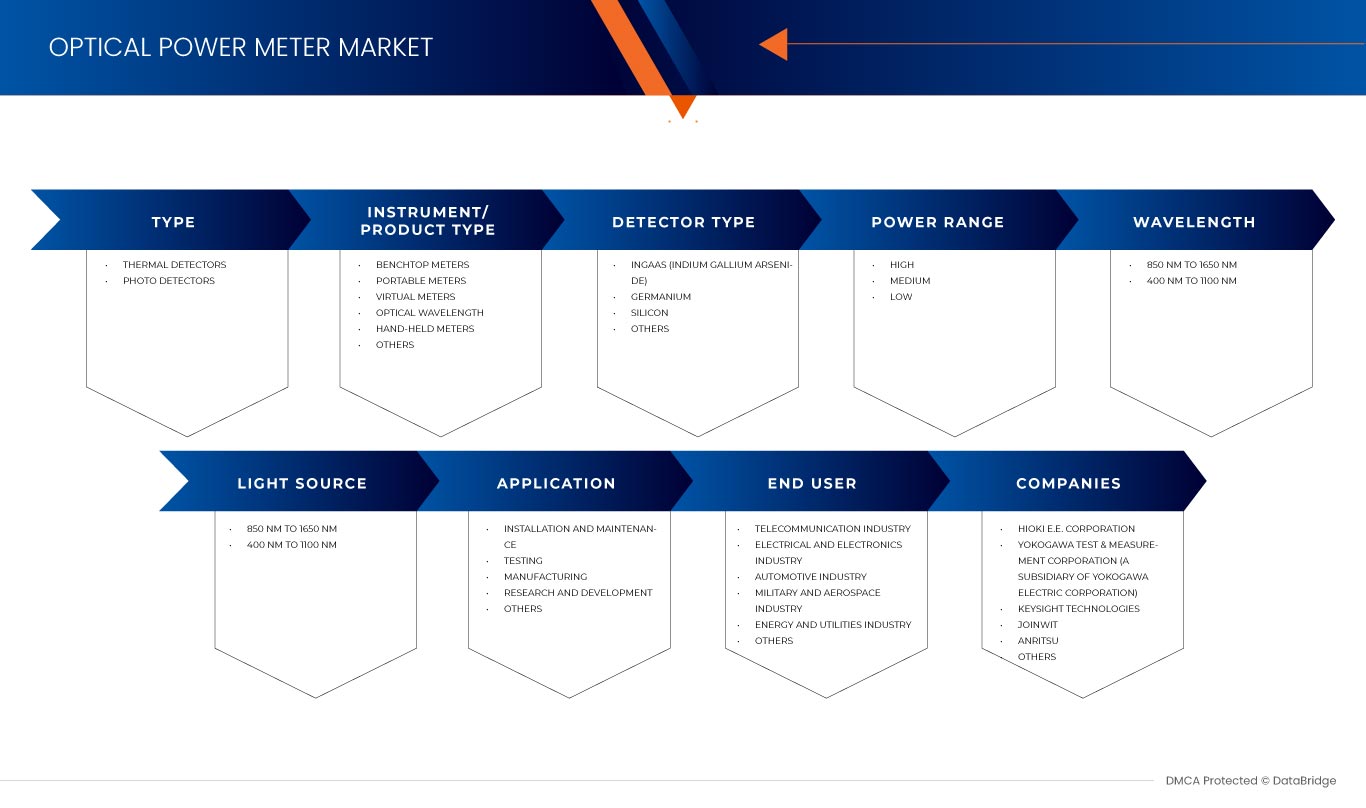
Type (Thermal Detectors and Photo Detectors), Instrument/Product Type (Benchtop Meter, Portable Meter, Virtual Meters, Optical Wavelength, Hand-Held Meter, and Others), Detector Type (InGaAs (Indium Gallium Arsenide), Germanium, Silicon, and Others), Power Range (High, Medium, and Low), Wavelength (850NM TO 1650NM and 400NM to 1100NM), Light Source (Laser, and LED), Application (Installation & Maintenance, Testing, Manufacturing, Research & Development, and Others), End User (Telecommunication Industry, Electrical & Electronics Industry, Automotive Industry, Military & Aerospace Industry, Energy & Utilities Industry, and Others) |
|
Countries Covered |
U.S., Canada, Mexico, Germany, France, U.K., Italy, Spain, Switzerland, Netherlands, Russia, Turkey, Belgium, Poland, Finland, Norway, Sweden, Denmark, and Rest of Europe, Japan, China, South Korea, India, Australia, Singapore, Thailand, Malaysia, Indonesia, Taiwan, Vietnam, Philippines, New Zealand, and Rest of Asia-Pacific, South Africa, Israel, U.A.E., Saudi Arabia, Egypt, Qatar, Bahrain, Kuwait, Oman, Rest of Middle East and Africa, Brazil, Argentina and Rest of South America |
|
Market Players Covered |
Thorlabs (U.S.), Inc., Kingfisher International (Australia), GAO Tek & GAO Group Inc. (U.S.), VIAVI Solutions Inc. (U.S.), Fluke Corporation (U.S.), EXFO Inc.(Canada), AFL(U.S.), Newport Corporation (A Subsidiary of MKS Instruments) (U.S.), Stanlay (India), Keysight Technologies (U.S.), Anritsu (Japan), Tech Optics Ltd.(England), JOINWIT (China), Artifex Engineering GmbH & Co KG. (Germany), HIOKI E.E. CORPORATION (Japan), Edmund Optics Inc. (U.S.), BIOPTIC CO., LTD (South Korea), ComSonics (U.S.), ADC CORPORATION (Japan), Deviser Instruments (U.S.), Incorporated, PDR World (India), Jonard Tools (U.S.), OZ Optics Ltd. (Canada), APEX Technologies (France), Ophir Optronics Solutions Ltd (Israel), Santec Corporation (Japan) and Yokogawa Test & Measurement Corporation (Japan), among others |
Market Definition
An optical power meter is a device that measures electricity and power in an optical signal. Optical power meters were used to test the average amount of power in fiber optic networks and systems. A power meter is a combination and integration of a calibrated sensor, display and measuring amplifier and display, which measures and monitors the range of wavelengths and power levels. The calibrated sensor is integrated with a photodiode which is used to measure the wavelengths and power levels in the system. The sensors consist of silicon, germanium or InGaAs based semiconductor. Different sensor types used in optical power meters have different characteristics. A measuring amplifier is used to verify accuracy and to deliver data and information. The display unit provides the monitored and measured optical power reading and set wavelength. An optical power meter also helps to determine the power loss incurred by the optical signal while passing through the optical media.
Global Optical Power Meter Market Dynamics
This section deals with understanding the market drivers, advantages, opportunities, restraints and challenges. All of this is discussed in detail as below:
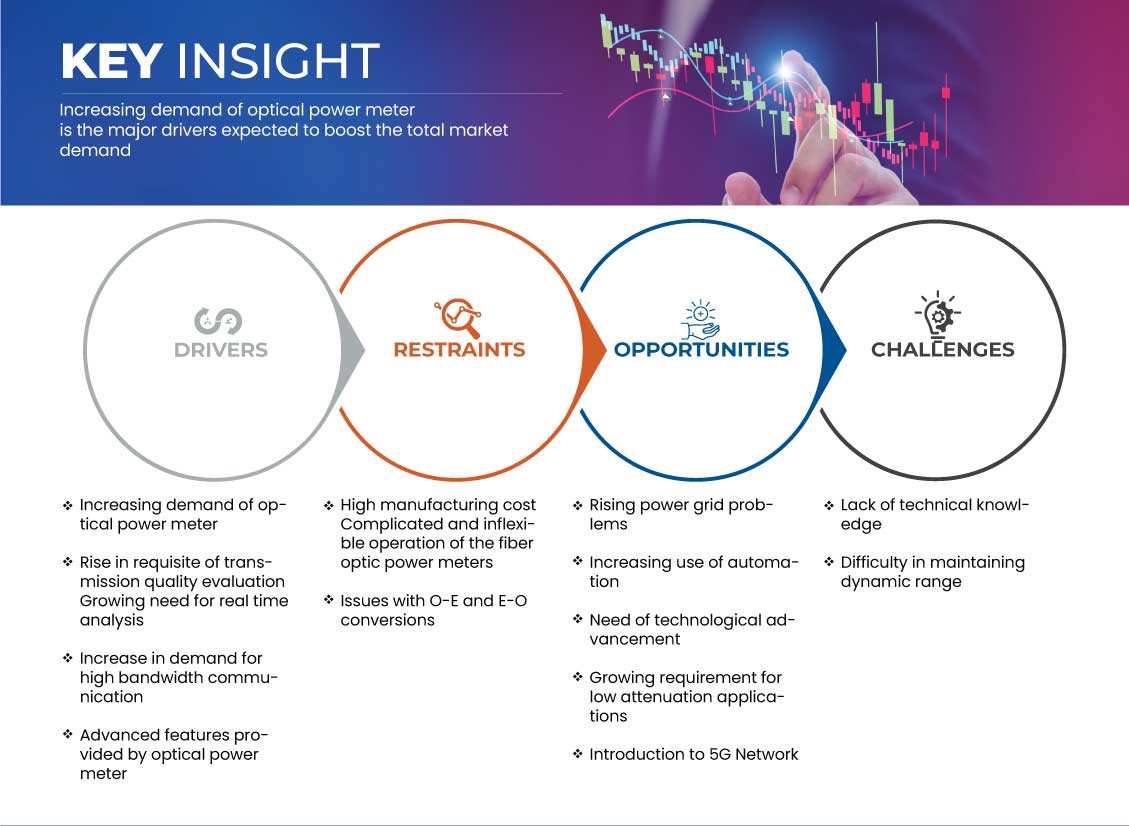
Drivers
- INCREASING DEMAND FOR OPTICAL POWER METER
Оптический измеритель мощности — это устройство, которое измеряет электричество и мощность в оптическом сигнале. Оптические измерители мощности использовались для проверки среднего количества мощности в оптоволоконных сетях и системах. Измеритель мощности — это комбинация и интеграция калиброванного датчика, дисплея и измерительного усилителя, который измеряет и контролирует диапазон длин волн и уровней мощности. Оптический измеритель мощности также помогает определить потери мощности, возникающие в оптическом сигнале при прохождении через оптическую среду.
Ожидается, что в ближайшие годы мировой рынок оптических измерителей мощности значительно вырастет из-за растущего спроса на оптические измерители мощности. Оптические измерители мощности широко используются в телекоммуникационной отрасли, поскольку они обеспечивают точные измерения оптической мощности оптоволоконного кабеля или системы.
- ПОВЫШЕНИЕ ТРЕБОВАНИЙ К ОЦЕНКЕ КАЧЕСТВА ПЕРЕДАЧИ
Сеть передачи является важным фактором в сети связи для предоставления более качественных услуг потребителям. Для оценки и мониторинга качества сети передачи не существует общего стандарта. Одной из основных целей, на которой телекоммуникационная отрасль уделяет основное внимание, является передача сигналов по кабелям с наименьшими помехами, максимальной пропускной способностью, наименьшим уровнем шума, низким потреблением энергии и оптимальным качеством передачи.
В настоящее время различные ресурсоемкие услуги, такие как видео в формате Ultra HD, 3D-телевидение, онлайн-торговля, облачные вычисления и другие, увеличивают спрос интернет-потребителей на IP-трафик.
Эти приложения доступа привели к использованию фиксированных антенн беспроводной сети, ключевой безопасности, базовых станций мобильной сети и структур мониторинга и измерения, которые затем требуют более высокой информации и пропускной способности данных. Следовательно, увеличение транспортной емкости сетей доступа становится критически важным для поставщиков интернет-услуг.
Провода передачи подвергаются воздействию внешних условий, и многие факторы могут привести к неправильной калибровке. Поэтому важно регулярно оценивать качество передачи, включая оценку мощности в кабелях с помощью оптических измерителей мощности.
Возможности
- РОСТ ПРОБЛЕМ С ЭЛЕКТРОСЕТЯМИ
Энергосистема, также называемая электрической сетью, представляет собой взаимосвязанную сетевую структуру для доставки электроэнергии и мощности от производителей к потребителям для ежедневного использования. Энергосистема состоит из трех этапов: генерация, передача и распределение.
Электростанции преобразуют механическую энергию в электрическую с помощью генератора. Передача электроэнергии осуществляется с помощью линий электропередач. Процесс распределения соединяет подстанции от крупных промышленных зданий до небольших домов, чтобы обеспечить их электроэнергией.
Ограничения/Проблемы
- ОТСУТСТВИЕ ТЕХНИЧЕСКИХ ЗНАНИЙ
Рост технологических достижений, инноваций и цифровизации бизнес-процессов затрудняет для рабочих, служащих и персонала задачу по приведению своих навыков в соответствие с потребностями растущих и технологически обновленных операций.
Это создает разрыв в навыках между персоналом и бизнесом. Существует нехватка квалифицированных технических специалистов с соответствующей квалификацией и знаниями, поскольку технологии совершенствуются с каждым днем.
По мере того, как компьютеры оснащаются более интеллектуальными и инновационными решениями, они становятся более способны выполнять задачи, которые ранее выполнялись людьми, поэтому сотрудникам и персоналу необходимо будет развивать и совершенствовать свои навыки, которые дадут им преимущество перед компьютерными машинами, такие как критическое мышление, инновации и креативность.
Оптические измерители мощности относятся к полупроводникам и требуют обширных технических знаний относительно единиц измерения, преобразований и т. д., что затрудняет эксплуатацию измерителей мощности обычным персоналом.
Влияние COVID-19 на мировой рынок оптических измерителей мощности
COVID-19 оказал значительное влияние на мировую экономику, и рынок оптических измерителей мощности не является исключением. Поскольку пандемия вызвала сбои в цепочках поставок и производстве, спрос на оптические измерители мощности мог быть затронут.
Однако растущее использование оптических измерителей мощности в телекоммуникационной отрасли, центрах обработки данных и других приложениях поддерживало спрос относительно стабильным. Потребность в надежных и высокоскоростных сетях связи только возросла во время пандемии из-за перехода на удаленную работу и онлайн-обучение.
Кроме того, с ростом внедрения технологии 5G и расширением оптоволоконных сетей спрос на оптические измерители мощности, вероятно, продолжит расти в ближайшие годы.
В целом, хотя COVID-19 мог вызвать некоторые сбои на рынке оптических измерителей мощности, ожидается, что растущий спрос на высокоскоростные и надежные сети связи будет способствовать росту в долгосрочной перспективе.
Последние события
- В сентябре 2020 года EXFO Inc. приобрела InOpticals Inc., которая предлагает сверхбыстрые испытательные приборы для лабораторного и производственного рынков. В рамках этого приобретения оптические испытательные предложения компании будут объединены с решениями InOpticals. Благодаря этому компания сможет расширить свой продуктовый портфель, использовать инновационные испытательные решения InOpticals и расти на рынке.
- В мае 2020 года Kingfisher International расширила свои возможности по калибровке оптоволоконных измерителей мощности в видимом и УФ-А спектре. Благодаря этому компания точно откалибровала полупроводниковые оптические измерители мощности от 350 до 1650 нм с интервалом 5 нм. Это помогло компании лучше удовлетворять потребности клиентов.
Масштаб мирового рынка оптических измерителей мощности
Глобальный рынок оптических измерителей мощности сегментирован на основе компонента, типа, типа прибора\продукта, типа детектора, диапазона мощности, длины волны, источника света, применения и конечного пользователя. Рост среди этих сегментов поможет вам проанализировать сегменты с незначительным ростом в отраслях и предоставить пользователям ценный обзор рынка и рыночные идеи, которые помогут им принимать стратегические решения для определения основных рыночных приложений.
ТИП
- ТЕПЛОВЫЕ ДЕТЕКТОРЫ
- ФОТО ДЕТЕКТОРЫ
По типу мировой рынок измерителей оптической мощности сегментируется на тепловые детекторы и фотодетекторы.
ТИП ИНСТРУМЕНТА/ПРОДУКТА
- НАСТОЛЬНЫЙ ИЗМЕРИТЕЛЬ
- ПОРТАТИВНЫЙ ИЗМЕРИТЕЛЬ
- ВИРТУАЛЬНЫЕ МЕТРЫ
- ОПТИЧЕСКАЯ ДЛИНА ВОЛНЫ
- РУЧНОЙ ИЗМЕРИТЕЛЬ
- ДРУГИЕ
На основе типа прибора/продукта мировой рынок измерителей оптической мощности сегментирован на настольные измерители, портативные измерители, виртуальные измерители, оптические измерители длины волны, ручные измерители и другие.
ТИП ДЕТЕКТОРА
- ИНГААС (ИНДИЙ-ГАЛЛИЙ АРСЕНИД)
- ГЕРМАНИЙ
- КРЕМНИЙ
- ДРУГИЕ
По типу детектора мировой рынок измерителей оптической мощности сегментирован на InGaAs (арсенид индия-галлия), германиевые, кремниевые и другие.
ДИАПАЗОН МОЩНОСТИ
- ВЫСОКИЙ
- СЕРЕДИНА
- НИЗКИЙ
По диапазону мощности рынок измерителей оптической мощности сегментирован на высокий, средний и низкий.
ДЛИНА ВОЛНЫ
- 850-1650 НМ
- 400-1100 морских миль
В зависимости от длины волны мировой рынок измерителей оптической мощности сегментирован на диапазоны от 850 нм до 1650 нм и от 400 нм до 1100 нм.
ИСТОЧНИК СВЕТА
- ЛАЗЕР
- ВЕЛ
В зависимости от источника света мировой рынок измерителей оптической мощности сегментирован на лазерные и светодиодные.
ПРИЛОЖЕНИЕ
- УСТАНОВКА И ОБСЛУЖИВАНИЕ
- ТЕСТИРОВАНИЕ
- ПРОИЗВОДСТВО
- ИССЛЕДОВАНИЯ И РАЗРАБОТКИ
- ДРУГИЕ
По сфере применения мировой рынок измерителей оптической мощности подразделяется на установку и обслуживание, тестирование, производство, исследования и разработки и другие.
КОНЕЧНЫЙ ПОЛЬЗОВАТЕЛЬ
- ТЕЛЕКОММУНИКАЦИОННАЯ ИНДУСТРИЯ
- ЭЛЕКТРИЧЕСКАЯ И ЭЛЕКТРОННАЯ ПРОМЫШЛЕННОСТЬ
- АВТОМОБИЛЬНАЯ ПРОМЫШЛЕННОСТЬ
- ВОЕННАЯ И АЭРОКОСМИЧЕСКАЯ ПРОМЫШЛЕННОСТЬ
- ЭНЕРГЕТИКА И КОММУНАЛЬНЫЕ УСЛУГИ
- ДРУГИЕ
По признаку конечного пользователя мировой рынок измерителей оптической мощности подразделяется на телекоммуникационную отрасль, электротехническую и электронную промышленность, автомобильную промышленность, военную и аэрокосмическую промышленность, энергетику и коммунальное хозяйство и другие.
Региональный анализ/информация о мировом рынке оптических измерителей мощности
Проведен анализ мирового рынка измерителей оптической мощности, а также предоставлена информация о размере рынка по странам, компонентам, типам, типам прибора/продукта, типам детектора, диапазонам мощности, длинам волн, источникам света, областям применения и конечным пользователям.
В отчете о мировом рынке измерителей оптической мощности рассматриваются следующие страны: США, Канада, Мексика, Германия, Франция, Великобритания, Италия, Испания, Швейцария, Нидерланды, Россия, Турция, Бельгия, Польша, Финляндия, Норвегия, Швеция, Дания, остальные страны Европы, Япония, Китай, Южная Корея, Индия, Австралия, Сингапур, Таиланд, Малайзия, Индонезия, Тайвань, Вьетнам, Филиппины, Новая Зеландия, остальные страны Азиатско-Тихоокеанского региона, Южная Африка, Израиль, ОАЭ, Саудовская Аравия, Египет, Катар, Бахрейн, Кувейт, Оман, остальные страны Ближнего Востока и Африки, Бразилия, Аргентина и остальные страны Южной Америки.
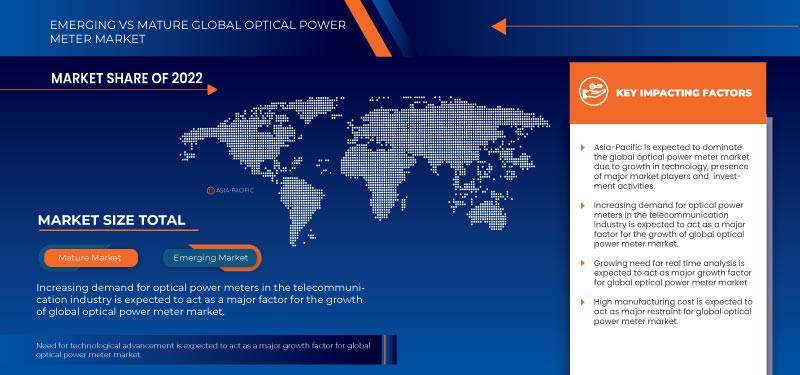
Азиатско-Тихоокеанский регион доминирует на мировом рынке оптических измерителей мощности из-за высокого уровня внедрения передовых технологий и присутствия крупных игроков в регионе. Китай доминирует на рынке оптических измерителей мощности из-за роста телекоммуникационной отрасли, цифровизации и растущих проблем с электросетями, что способствует росту страны во всем регионе. Однако в США имеется огромное присутствие наиболее технологически продвинутых лидеров на рынке для предоставления инновационных технологий, что способствует росту страны. Растущее внедрение оптических измерителей мощности способствует росту рынка в Германии.
Раздел отчета по странам также содержит отдельные факторы, влияющие на рынок, и изменения в регулировании рынка, которые влияют на текущие и будущие тенденции рынка. Такие данные, как анализ цепочки создания стоимости сверху и снизу, технические тенденции и анализ пяти сил Портера, а также тематические исследования, являются некоторыми из указателей, используемых для прогнозирования рыночного сценария для отдельных стран. Кроме того, при предоставлении прогнозного анализа данных по странам учитываются наличие и доступность глобальных брендов и их проблемы, связанные с большой или малой конкуренцией со стороны местных и отечественных брендов, влияние внутренних тарифов и торговых путей.
Анализ конкурентной среды и доли мирового рынка оптических измерителей мощности
Конкурентная среда мирового рынка оптических измерителей мощности содержит сведения о конкурентах. Включены сведения о компании, финансах компании, полученном доходе, рыночном потенциале, инвестициях в исследования и разработки, новых рыночных инициативах, глобальном присутствии, производственных площадках и объектах, производственных мощностях, сильных и слабых сторонах компании, запуске продукта, широте и широте продукта, доминировании приложений. Приведенные выше данные касаются только фокуса компаний, связанного с мировым рынком оптических измерителей мощности.
Некоторые из основных игроков, работающих на мировом рынке измерителей оптической мощности, включают Keysight Technologies, Anritsu, Newport Corporation (дочерняя компания MKS Instruments), Yokogawa Test & Measurement Corporation, HIOKI EE CORPORATION, AFL, EXFO Inc., Fluke Corporation, APEX Technologies, PDR World, Thorlabs, Inc, VIAVI Solutions Inc., JOINWIT, ComSonics, BIOPTIC CO., LTD, OZ Optics Ltd, Santec Corporation, Jonard Tools., ADC CORPORATION, Ophir Optronics Solutions Ltd, Deviser Instruments, Incorporated, Edmund Optics, Kingfisher International, Artifex Engineering GmbH & Co KG., GAO Tek & GAO Group Inc., Tech Optics Ltd. и Stanlay.
SKU-
Получите онлайн-доступ к отчету на первой в мире облачной платформе рыночной аналитики

- Интерактивная панель анализа данных
- Панель анализа компании для возможностей с высоким потенциалом роста
- Доступ аналитика-исследователя для настройки и запросов
- Анализ конкурентов с помощью интерактивной панели
- Последние новости, обновления и анализ тенденций
- Используйте возможности сравнительного анализа для комплексного отслеживания конкурентов
Методология исследования
Сбор данных и анализ базового года выполняются с использованием модулей сбора данных с большими размерами выборки. Этап включает получение рыночной информации или связанных данных из различных источников и стратегий. Он включает изучение и планирование всех данных, полученных из прошлого заранее. Он также охватывает изучение несоответствий информации, наблюдаемых в различных источниках информации. Рыночные данные анализируются и оцениваются с использованием статистических и последовательных моделей рынка. Кроме того, анализ доли рынка и анализ ключевых тенденций являются основными факторами успеха в отчете о рынке. Чтобы узнать больше, пожалуйста, запросите звонок аналитика или оставьте свой запрос.
Ключевой методологией исследования, используемой исследовательской группой DBMR, является триангуляция данных, которая включает в себя интеллектуальный анализ данных, анализ влияния переменных данных на рынок и первичную (отраслевую экспертную) проверку. Модели данных включают сетку позиционирования поставщиков, анализ временной линии рынка, обзор рынка и руководство, сетку позиционирования компании, патентный анализ, анализ цен, анализ доли рынка компании, стандарты измерения, глобальный и региональный анализ и анализ доли поставщика. Чтобы узнать больше о методологии исследования, отправьте запрос, чтобы поговорить с нашими отраслевыми экспертами.
Доступна настройка
Data Bridge Market Research является лидером в области передовых формативных исследований. Мы гордимся тем, что предоставляем нашим существующим и новым клиентам данные и анализ, которые соответствуют и подходят их целям. Отчет можно настроить, включив в него анализ ценовых тенденций целевых брендов, понимание рынка для дополнительных стран (запросите список стран), данные о результатах клинических испытаний, обзор литературы, обновленный анализ рынка и продуктовой базы. Анализ рынка целевых конкурентов можно проанализировать от анализа на основе технологий до стратегий портфеля рынка. Мы можем добавить столько конкурентов, о которых вам нужны данные в нужном вам формате и стиле данных. Наша команда аналитиков также может предоставить вам данные в сырых файлах Excel, сводных таблицах (книга фактов) или помочь вам в создании презентаций из наборов данных, доступных в отчете.

