Global Wearable Devices In Sports Market
市场规模(十亿美元)
CAGR :
% 
 USD
90.73 Billion
USD
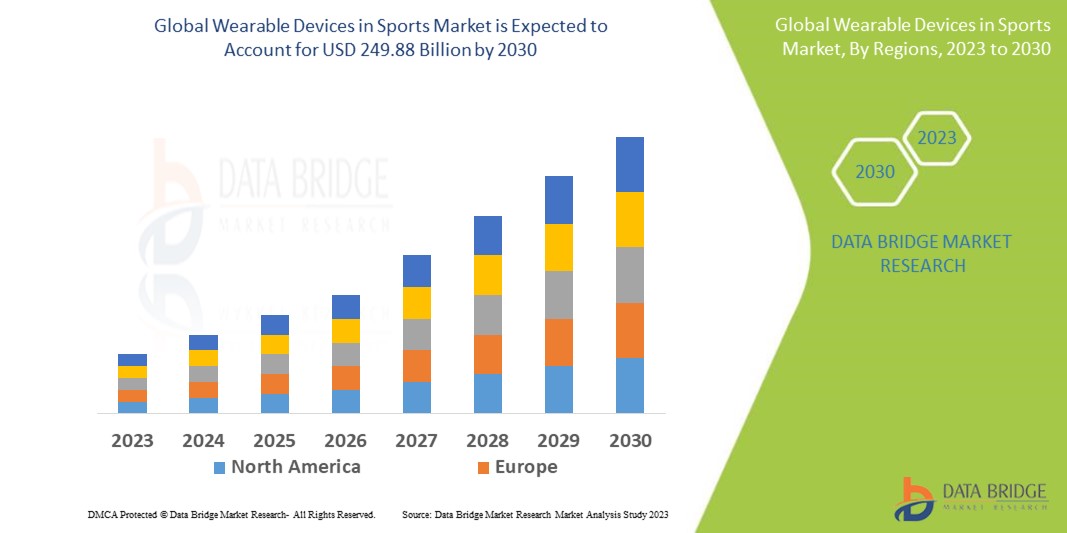
249.88 Billion
2022
2030
USD
90.73 Billion
USD
249.88 Billion
2022
2030
| 2023 –2030 | |
| USD 90.73 Billion | |
| USD 249.88 Billion | |
| % | |
全球运动可穿戴设备市场,按组件(硬件、软件)、产品类型(计步器、健身和心率监测器、智能面料、智能相机、投篮追踪器等)、站点(头带、手持、手臂和手腕、夹子、鞋传感器等)、应用(步数、卡路里燃烧、心率监测、睡眠追踪等)、最终用户(运动中心、健身中心、家庭护理环境等)、分销渠道(独立零售店、大卖场/超市、品牌店、网上销售渠道)划分——行业趋势与预测到 2030 年。
运动可穿戴设备市场分析及规模
越来越多的年轻人积极参与体育相关活动,这为健康指标的提高提供了助力,从而加速了市场的增长。此外,随着人们对健康问题的认识不断提高,体育运动已逐渐成为一种保持身体健康和预防生活方式紊乱的便捷方式。这些工具可承受用户与训练相关的身体活动并防止过度训练。所有这些因素都极大地推动了市场的增长。
Data Bridge Market Research 分析,运动市场中可穿戴设备的规模在 2022 年为 907.3 亿美元,到 2030 年将增至 2498.8 亿美元,预计在 2023 年至 2030 年的预测期内复合年增长率为 13.5%。除了对市场价值、增长率、细分、地理覆盖范围和主要参与者等市场情景的见解外,Data Bridge Market Research 策划的市场报告还包括深度专家分析、患者流行病学、渠道分析、定价分析和监管框架。
运动可穿戴设备市场范围及细分
|
报告指标 |
细节 |
|
预测期 |
2023 至 2030 年 |
|
基准年 |
2022 |
|
历史岁月 |
2021(可定制为 2015 - 2020) |
|
定量单位 |
收入(单位:十亿美元)、销量(单位:台)、定价(美元) |
|
涵盖的领域 |
组件(硬件、软件)、产品类型(计步器、健身和心率监测器、智能面料、智能相机、射击追踪器等)、站点(头带、手持、手臂和手腕、夹子、鞋传感器等)、应用程序(步数计数、卡路里消耗、心率监测、睡眠追踪等)、最终用户(运动中心、健身中心、家庭护理环境等)、分销渠道(独立零售店、大卖场/超市、品牌店、在线销售渠道) |
|
覆盖国家 |
北美洲的美国、加拿大和墨西哥、欧洲的德国、法国、英国、荷兰、瑞士、比利时、俄罗斯、意大利、西班牙、土耳其、欧洲其他地区、中国、日本、印度、韩国、新加坡、马来西亚、澳大利亚、泰国、印度尼西亚、菲律宾、亚太地区 (APAC) 的其他地区、沙特阿拉伯、阿联酋、南非、埃及、以色列、中东和非洲 (MEA) 的其他地区、巴西、阿根廷和南美洲其他地区 |
|
涵盖的市场参与者 |
Apple Inc.(美国)、华为技术有限公司(中国)、Fitbit Inc.(英国)、Nike, Inc.(美国)、Under Armour, Inc(美国)、荷兰皇家飞利浦电子公司(荷兰)、Zepp Health Corporation(中国)、StretchSense(美国)、Catapult(美国)、Withings(法国)、广东创思医疗电子有限公司(中国)、雅培(美国)、美敦力(爱尔兰)、Apple Inc.(美国)、Virtual-Realties, LLC(英国)、Google LLC(美国)、小米(中国)、索尼公司(日本)、Garmin Ltd.(美国)、霍尼韦尔国际公司(美国)、LG 电子(韩国) |
|
市场机会 |
|
市场定义
与运动相关的可穿戴技术是一组旨在帮助和支持用户的产品。这些可穿戴设备旨在通过技术帮助运动员。这些可穿戴设备使用蓝牙、物联网和 Wi-Fi 来提供个人表现数据。这些可穿戴设备具有 GPS 追踪器,可帮助收集用户的步速、心率、步数、卡路里消耗量等数据。
全球运动可穿戴设备市场动态
驱动程序
- 运动损伤发生率不断上升
运动损伤在世界范围内非常常见。例如,在广州夏季亚运会上,209名运动员中约有288人新受伤,每1000名运动员受伤的发生率为45.5人。这种发生率的增加使运动可穿戴设备的需求迅速增加。因此,这一因素推动了市场增长。
- 可穿戴设备需求不断增长
可穿戴设备(如健身带和其他传感器)的使用日益增多,有助于监测运动员的压力负荷并防止疲劳引起的伤害,这推动了运动可穿戴设备市场的增长。例如,新斯科舍省的一家以绩效为基础的公司 Athletigen Technology, Inc. 与许多运动员合作,利用收集到的 DNA 信息来提高他们的表现和健康状况,并降低运动相关伤害的发生率。预计此类情况将在预测期内推动市场增长。
机会
- 加强市场参与者的伙伴关系
市场参与者之间合作伙伴关系的不断增加也推动了市场的增长。例如,2022 年,专注于投球的公司 KineticPro Performance 与智能面料技术制造商 Nextiles 合作。KineticPro Sleeve 将使用精心放置在肘部正上方的基于螺纹的传感器提供手臂的实时生物力学分析。因此,这一因素为市场增长创造了更多机会。
- 智能服装/纺织品需求不断增长
智能服装/纺织品的制造和设计融入了可提高穿戴者功能的技术。这些纺织品具有多种应用,例如与其他设备通信、转换成不同的材料、传导能量以及保护穿戴者免受环境危害。过去几年,可穿戴纺织品个人系统(例如健康监测、保护、安全和健康生活方式)的研发活动日益增多,引起了人们的浓厚兴趣。因此,这一因素促进了市场的增长。
限制/挑战
- 可穿戴设备成本高昂
可穿戴设备初期成本高昂,而且由于电池存在一些问题,设备维护和维修成本也很高,这些因素共同阻碍了市场的增长。因此,这是市场的主要制约因素。
本运动可穿戴设备市场报告详细介绍了最新发展、贸易法规、进出口分析、生产分析、价值链优化、市场份额、国内和本地市场参与者的影响,分析了新兴收入领域的机会、市场法规的变化、战略市场增长分析、市场规模、类别市场增长、应用领域和主导地位、产品批准、产品发布、地域扩展、市场技术创新。如需了解有关运动可穿戴设备市场的更多信息,请联系 Data Bridge Market Research 获取分析师简报,我们的团队将帮助您做出明智的市场决策,实现市场增长。
近期发展
- 2022 年,人类表现业务 WHOOP 与宾夕法尼亚州立大学校际体育协会合作,利用 WHOOP 可穿戴技术和个性化健康见解来增强学生运动员的健康。这项新的多年期合作包括在整个体育部门推出 WHOOP 4.0 以及一项全面的学生运动员健康和参与计划。
全球运动可穿戴设备市场范围
运动市场中的可穿戴设备根据组件、产品类型、地点、应用、最终用户和分销渠道进行细分。这些细分市场之间的增长将帮助您分析行业中增长微弱的细分市场,并为用户提供有价值的市场概览和市场洞察,帮助他们做出战略决策,确定核心市场应用。
成分
- 硬件
- 软件
产品类型
- 计步器
- 健身和心率监测器
- 智能面料、智能相机
- 射击追踪器
- 其他的
地点
- 头巾
- 手持式
- 手臂和手腕
- 夹子
- 鞋子传感器
- 其他的
应用
- 步数
- 卡路里消耗
- 心率监测
- 睡眠追踪
- 其他的
最终用户
- 体育中心
- 健身中心
- 家庭护理设置
- 其他的
分销渠道
- 独立零售店
- 大卖场/超市
- 品牌专卖店
- 线上销售渠道
体育可穿戴设备市场区域分析/洞察
对体育市场中的可穿戴设备进行了分析,并按上述组件、产品类型、站点、应用、最终用户和分销渠道提供了市场规模洞察和趋势。
运动可穿戴设备市场报告涵盖的国家包括北美的美国、加拿大和墨西哥,欧洲的德国、法国、英国、荷兰、瑞士、比利时、俄罗斯、意大利、西班牙、土耳其,欧洲其他地区,亚太地区(APAC)的中国、日本、印度、韩国、新加坡、马来西亚、澳大利亚、泰国、印度尼西亚、菲律宾,亚太地区(APAC)的其他地区,中东和非洲(MEA)的沙特阿拉伯、阿联酋、南非、埃及、以色列,中东和非洲(MEA)的其他地区,南美洲的巴西、阿根廷和南美洲其他地区。
由于专业运动员越来越受欢迎,北美有望在运动可穿戴设备市场占据主导地位。此外,运动员运动损伤案例的增加以及该地区研究活动的增多也推动了市场的增长。
由于智能手机成本降低,预计亚太地区将在 2023 年至 2030 年的预测期内出现显着增长,这有望促进市场增长。众多目标客户群体不断增长的需求使制造商能够通过提高产量来降低产品价格。
报告的国家部分还提供了影响单个市场因素和国内市场监管变化,这些因素和变化会影响市场的当前和未来趋势。下游和上游价值链分析、技术趋势和波特五力分析、案例研究等数据点是用于预测单个国家市场情景的一些指标。此外,在提供国家数据的预测分析时,还考虑了全球品牌的存在和可用性以及它们因来自本地和国内品牌的大量或稀缺竞争而面临的挑战、国内关税和贸易路线的影响。
体育用品市场竞争格局及可穿戴设备份额分析
运动可穿戴设备市场竞争格局按竞争对手提供详细信息。详细信息包括公司概况、公司财务状况、收入、市场潜力、研发投资、新市场计划、全球影响力、生产基地和设施、生产能力、公司优势和劣势、产品发布、产品宽度和广度、应用主导地位。以上提供的数据点仅与公司对运动可穿戴设备的关注有关。
在运动可穿戴设备市场运营的一些主要参与者包括:
- 苹果公司(美国)
- 华为技术有限公司 (中国)
- Fitbit Inc.(英国)
- 耐克公司(美国)
- Under Armour, Inc(美国)
- Koninklijke Philips NV(荷兰)
- Zepp Health Corporation(中国)
- StretchSense(美国)
- 弹射器(美国)
- Withings (法国)
- 广东创思医疗电子有限公司 (中国)
- 雅培(美国)
- 美敦力(爱尔兰)
- 苹果公司(美国)
- Virtual-Realties, LLC(英国)
- Google LLC(美国)
- 小米 (中国)
- 索尼公司(日本)
- Garmin Ltd.(美国)
- 霍尼韦尔国际公司(美国)
- LG 电子 (韩国)
SKU-

目录
- introduction
- OBJECTIVES OF THE STUDY
- MARKET DEFINITION
- OVERVIEW of THE Global wearable devices in sports MARKET
- LIMITATIONs
- MARKETS COVERED
- Global WEARABLE DEVICES IN SPORTS MARKET: SEGMENTATION
- MARKETS COVERED
- geographical scope
- years considered for the study
- CURRENCY AND PRICING
- DBMR TRIPOD DATA VALIDATION MODEL
- primary interviews with key opinion leaders
- MULTIVARIATE MODELLING
- component LIFELINE CURVE
- DBMR MARKET POSITION GRID
- VENDOR SHARE ANALYSIS
- MARKET end user COVERAGE GRID
- secondary sourcEs
- assumptions
- EXECUTIVE SUMMARY
- premium insights
- global Wearable Devices in Sports Market: regulationS
- REGULATION IN US:
- REGULATION IN EUROPE
- REGULATIONS IN JAPAN
- REGULATIONS IN INDIA
- REGULATIONS IN CANADA
- REGULATIONS IN SOUTH AFRICA
- Market Overview
- drivers
- Increasing popularity among professional athletes
- increasing smartphone penetration
- benefits of wearable electronics
- Rising social awareness
- presence of major market players
- Restraints
- Data privacy is a major concern
- Smaller size leads to reliability issues
- stringent regulatory & reimbursement of wearable medical devices
- OPPORTUNITIES
- RISING HEALTHCARE EXPENDITURE and disposable income
- Multi-featured and hybrid application mobile devices
- Emerging Markets
- Multiple application coverage
- CHALLENGES
- high initial costs
- limited battery life
- Impact of COVID-19 Pandemic on the Global Wearable Devices in Sports Market
- Price Impact
- Impact on Demand
- Impact on Supply Chain
- STRATEGIC DECISIONS OFMANUFACTURERS/ SERVICE PROVIDER
- Conclusion
- Global wearable devices in sports market, By COMPONENT
- overview
- software
- HARDWARE
- Global wearable devices in sports market, By product type
- overview
- pedometers
- PIEZOELECTRIC
- Spring-levered
- fitness & heart rate monitors
- BASIC FITNESS TRACKER
- heart rate monitoring trackers
- heart rate monitoring trackers with gps
- smart fabrics
- passive
- active
- advanced
- shot tracker
- smart camera
- others
- Global wearable devices in sports market, By SITE
- overview
- handheld, arm & wrist
- headband
- clip
- shoe sensor
- others
- Global wearable devices in sports market, By APPLICATION
- overview
- step counts
- calorie burnt
- heart rate monitoring
- sleep tracking
- others
- Global wearable devices in sports market, By END USER
- overview
- sports centers
- fitness centers
- homecare settings
- OTHERS
- Global wearable devices in sports market, By distribution channel
- overview
- INDEPENDENT RETAIL STORE
- hypermarket/ supermarket
- online sale channel
- brand store
- GLOBAL WEARABLE DEVICES IN SPORTS MARKET, BY region
- OVERVIEW
- North America
- U.S.
- CANADA
- MEXICO
- Europe
- Germany
- France
- U.K.
- Italy
- Spain
- Russia
- Turkey
- Belgium
- Netherlands
- Switzerland
- Rest of Europe
- ASIA-PACIFIC
- CHINA
- JAPAN
- INDIA
- AUSTRALIA
- SOUTH KOREA
- SINGAPORE
- MALAYSIA
- THAILAND
- INDONESIA
- PHILIPPINES
- REST OF ASIA-PACIFIC
- South America
- BRAZIL
- ARGENTINA
- REST OF SOUTH AMERICA
- Middle East & Africa
- SOUTH AFRICA
- Saudi Arabia
- U.A.E.
- EGYPT
- Israel
- Rest of Middle East & Africa
- Global Wearable devices in sports Market: COMPANY landscape
- company share analysis: global
- company share analysis: north america
- company share analysis: europe
- company share analysis: Asia-Pacific
- swot analysis
- company profile
- apple inc.
- COMPANY SNAPSHOT
- REVENUE ANALYSIS
- company share anlysis
- SERVICE PORTFOLIO
- RECENT DEVELOPMENTS
- HUAWEI TECHNOLOGY CO., LTD.
- COMPANY SNAPSHOT
- company share anlysis
- PRODUCT PORTFOLIO
- RECENT DEVELOPMENTS
- fitbit inc. (a subsidiary of google llc)
- COMPANY SNAPSHOT
- REVENUE ANALYSIS
- company share anlysis
- SERVICE PORTFOLIO
- RECENT DEVELOPMENTS
- SAMSUNG
- COMPANY SNAPSHOT
- REVENUE ANALYSIS
- company share anlysis
- PRODUCT PORTFOLIO
- RECENT DEVELOPMENTS
- ZEPP HEALTH CORPORATION
- COMPANY SNAPSHOT
- REVENUE ANALYSIS
- company share anlysis
- PRODUCT PORTFOLIO
- RECENT DEVELOPMENTS
- ABBOTT
- COMPANY SNAPSHOT
- REVENUE ANALYSIS
- PRODUCT PORTFOLIO
- RECENT DEVELOPMENTS
- ACTIVEINSIGHTS LTD.
- COMPANY SNAPSHOT
- PRODUCT PORTFOLIO
- RECENT DEVELOPMENTS
- BIO-BEAT
- COMPANY SNAPSHot
- product Portfolio
- RECENT DEVELOPMENTs
- CARRE TECHNOLOGIES INC (HEXOSKIN)
- COMPANY SNAPSHOT
- PRODUCT PORTFOLIO
- RECENT DEVELOPMENTS
- CATAPULT
- COMPANY SNAPSHOT
- REVENUE ANALYSIS
- PRODUCT PORTFOLIO
- RECENT DEVELOPMENTS
- garmin ltd.
- COMPANY SNAPSHOT
- REVENUE ANALYSIS
- SERVICE PORTFOLIO
- RECENT developments
- Guangdong Transtek Medical Eletronics Co., Ltd.
- COMPANY SNAPSHOT
- REVENUE ANALYSIS
- PRODUCT PORTFOLIO
- RECENT DEVELOPMENTS
- HALO NEUROSCIENCE
- COMPANY SNAPSHot
- product Portfolio
- RECENT DEVELOPMENT
- HOCOMA
- COMPANY SNAPSHOT
- PRODUCT PORTFOLIO
- 14.3 RECENT DEVELOPMENTS
- HYKSO
- COMPANY SNAPSHOT
- PRODUCT PORTFOLIO
- RECENT DEVELOPMENT
- imeasure u ltd.
- COMPANY SNAPSHOT
- SERVICE PORTFOLIO
- RECENT DEVELOPMENT
- GN STORE NORD A/S
- COMPANY SNAPSHOT
- REVENUE ANALYSIS
- PRODUCT PORTFOLIO
- RECENT DEVELOPMENTS
- KONINKLIJKE PHILIPS N.V.
- COMPANY SNAPSHOT
- REVENUE ANALYSIS
- PRODUCT PORTFOLIO
- RECENT DEVELOPMENTS
- masimo
- COMPANY SNAPSHOT
- REVENUE ANALYSIS
- PRODUCT PORTFOLIO
- RECENT DEVELOPMENTS
- MEDTRONIC
- COMPANY SNAPSHot
- REVENUE ANALYSIS
- product Portfolio
- RECENT DEVELOPMENTs
- Nike inc.
- COMPANY SNAPSHOT
- REVENUE ANALYSIS
- SERVICE PORTFOLIO
- RECENT developments
- OMRON CORPORATION
- COMPANY SNAPSHOT
- REVENUE ANALYSIS
- PRODUCT PORTFOLIO
- RECENT DEVELOPMENTS
- polar electro
- COMPANY SNAPSHOT
- SERVICE PORTFOLIO
- RECENT DEVELOPMENTS
- sensoria
- COMPANY SNAPSHOT
- SERVICE PORTFOLIO
- 24.3 RECENT DEVELOPMENTS
- STRETCHSENSE, A SENSOR HOLDINGS LIMITED COMPANY
- COMPANY SNAPSHOT
- PRODUCT PORTFOLIO
- RECENT DEVELOPMENTS
- SIGMA SPORT
- COMPANY SNAPSHot
- product Portfolio
- RECENT DEVELOPMENT
- TomTom International BV.
- COMPANY SNAPSHot
- REVENUEANALYSIS
- product Portfolio
- RECENT DEVELOPMENT
- under armour inc.
- COMPANY SNAPSHOT
- REVENUE ANALYSIS
- SERVICE PORTFOLIO
- RECENT DEVELOPMENTS
- WEARABLE X
- COMPANY SNAPSHOT
- 29.2 SERVICE PORTFOLIO
- 29.3 RECENT DEVELOPMENT
- WITHINGS
- COMPANY SNAPSHOT
- PRODUCT PORTFOLIO
- RECENT DEVELOPMENTS
- questionnaire
- related reports
表格列表
TABLE 1 Global wearable devices in sports market, By component, 2019-2028 (USD million)
TABLE 2 Global software IN WEARABLE DEVICES IN SPORTS MARKET, By REGION, 2019-2028 (USD million)
TABLE 3 Global hardware IN WEARABLE DEVICES IN SPORTS MARKET, By REGION, 2019-2028 (USD million)
TABLE 4 Global wearable devices in sports market, By product type, 2019-2028 (USD million)
TABLE 5 Global pedometers IN WEARABLE DEVICES IN SPORTS MARKET, By REGION, 2019-2028 (USD million)
TABLE 6 Global pedometers in wearable devices in sports market, By product type, 2019-2028 (USD million)
TABLE 7 Global fitness & heart rate monitors IN WEARABLE DEVICES IN SPORTS MARKET, By REGION, 2019-2028 (USD million)
TABLE 8 Global FITNESS & HEART RATE MONITORS in wearable devices in sports market, By product type, 2019-2028 (USD million)
TABLE 9 Global smart fabrics IN WEARABLE DEVICES IN SPORTS MARKET, By REGION, 2019-2028 (USD million)
TABLE 10 Global smart fabrics in wearable devices in sports market, By product type, 2019-2028 (USD million)
TABLE 11 Global shot tracker IN WEARABLE DEVICES IN SPORTS MARKET, By REGION, 2019-2028 (USD million)
TABLE 12 Global smart camera IN WEARABLE DEVICES IN SPORTS MARKET, By REGION, 2019-2028 (USD million)
TABLE 13 Global others IN WEARABLE DEVICES IN SPORTS MARKET, By REGION, 2019-2028 (USD million)
TABLE 14 Global wearable devices in sports market, By site, 2019-2028 (USD million)
TABLE 15 Global handheld, arm & wrist IN WEARABLE DEVICES IN SPORTS MARKET, By REGION, 2019-2028 (USD million)
TABLE 16 Global headband IN WEARABLE DEVICES IN SPORTS MARKET, By REGION, 2019-2028 (USD million)
TABLE 17 Global clip IN WEARABLE DEVICES IN SPORTS MARKET, By REGION, 2019-2028 (USD million)
TABLE 18 Global shoe sensor IN WEARABLE DEVICES IN SPORTS MARKET, By REGION, 2019-2028 (USD million)
TABLE 19 Global others IN WEARABLE DEVICES IN SPORTS MARKET, By REGION, 2019-2028 (USD million)
TABLE 20 Global wearable devices in sports market, By application, 2019-2028 (USD million)
TABLE 21 Global step counts IN WEARABLE DEVICES IN SPORTS MARKET, By REGION, 2019-2028 (USD million)
TABLE 22 Global calorie burnt IN WEARABLE DEVICES IN SPORTS MARKET, By REGION, 2019-2028 (USD million)
TABLE 23 Global heart rate monitoring IN WEARABLE DEVICES IN SPORTS MARKET, By REGION, 2019-2028 (USD million)
TABLE 24 Global sleep tracking IN WEARABLE DEVICES IN SPORTS MARKET, By REGION, 2019-2028 (USD million)
TABLE 25 Global others IN WEARABLE DEVICES IN SPORTS MARKET, By REGION, 2019-2028 (USD million)
TABLE 26 Global wearable devices in sports market, By end user, 2019-2028 (USD million)
TABLE 27 Global sports centers IN WEARABLE DEVICES IN SPORTS MARKET, By REGION, 2019-2028 (USD million)
TABLE 28 Global fitness centers IN WEARABLE DEVICES IN SPORTS MARKET, By REGION, 2019-2028 (USD million)
TABLE 29 Global homecare settings IN WEARABLE DEVICES IN SPORTS MARKET, By REGION, 2019-2028 (USD million)
TABLE 30 Global others IN WEARABLE DEVICES IN SPORTS MARKET, By REGION, 2019-2028 (USD million)
TABLE 31 Global wearable devices in sports market, By distribution channel, 2019-2028 (USD million)
TABLE 32 Global independent retail store IN WEARABLE DEVICES IN SPORTS MARKET, By REGION, 2019-2028 (USD million)
TABLE 33 Global hypermarket/ supermarket IN WEARABLE DEVICES IN SPORTS MARKET, By REGION, 2019-2028 (USD million)
TABLE 34 Global online sale channel IN WEARABLE DEVICES IN SPORTS MARKET, By REGION, 2019-2028 (USD million)
TABLE 35 Global brand store IN WEARABLE DEVICES IN SPORTS MARKET, By REGION, 2019-2028 (USD million)
TABLE 36 GLOBAL wearable devices in sports Market, By REGION, 2019-2028 (USD million)
TABLE 37 North America wearable devices in sports Market, By COUNTRY, 2019-2028 (USD million)
TABLE 38 North America Wearable Devices in Sports Market, By Component, 2019-2028 (USD Million)
TABLE 39 North America Wearable Devices in Sports Market, By Product Type, 2019-2028 (USD Million)
TABLE 40 North America Pedometers in Wearable Devices in Sports Market, By Product Type, 2019-2028 (USD Million)
TABLE 41 North America Fitness & Heart Rate Monitors in Wearable Devices in Sports Market, By Product Type, 2019-2028 (USD Million)
TABLE 42 North America Smart Fabrics in Wearable Devices in Sports Market, By Product Type, 2019-2028 (USD Million)
TABLE 43 North America Wearable Devices in Sports Market, By Site, 2019-2028 (USD Million)
TABLE 44 North America Wearable Devices in Sports Market, By Application, 2019-2028 (USD Million)
TABLE 45 North America Wearable Devices in Sports Market, By End User, 2019-2028 (USD Million)
TABLE 46 North America Wearable Devices in Sports Market, By Distribution Channel, 2019-2028 (USD Million)
TABLE 47 U.S. Wearable Devices in Sports Market, By Component, 2019-2028 (USD Million)
TABLE 48 U.S. Wearable Devices in Sports Market, By Product Type, 2019-2028 (USD Million)
TABLE 49 U.S. Pedometers in Wearable Devices in Sports Market, By Product Type, 2019-2028 (USD Million)
TABLE 50 U.S. Fitness & Heart Rate Monitors in Wearable Devices in Sports Market, By Product Type, 2019-2028 (USD Million)
TABLE 51 U.S. Smart Fabrics in Wearable Devices in Sports Market, By Product Type, 2019-2028 (USD Million)
TABLE 52 U.S. Wearable Devices in Sports Market, By Site, 2019-2028 (USD Million)
TABLE 53 U.S. Wearable Devices in Sports Market, By Application, 2019-2028 (USD Million)
TABLE 54 U.S. Wearable Devices in Sports Market, By End User, 2019-2028 (USD Million)
TABLE 55 U.S. Wearable Devices in Sports Market, By Distribution Channel, 2019-2028 (USD Million)
TABLE 56 Canada Wearable Devices in Sports Market, By Component, 2019-2028 (USD Million)
TABLE 57 Canada Wearable Devices in Sports Market, By Product Type, 2019-2028 (USD Million)
TABLE 58 Canada Pedometers in Wearable Devices in Sports Market, By Product Type, 2019-2028 (USD Million)
TABLE 59 Canada Fitness & Heart Rate Monitors in Wearable Devices in Sports Market, By Product Type, 2019-2028 (USD Million)
TABLE 60 Canada Smart Fabrics in Wearable Devices in Sports Market, By Product Type, 2019-2028 (USD Million)
TABLE 61 Canada Wearable Devices in Sports Market, By Site, 2019-2028 (USD Million)
TABLE 62 Canada Wearable Devices in Sports Market, By Application, 2019-2028 (USD Million)
TABLE 63 Canada Wearable Devices in Sports Market, By End User, 2019-2028 (USD Million)
TABLE 64 Canada Wearable Devices in Sports Market, By Distribution Channel, 2019-2028 (USD Million)
TABLE 65 Mexico Wearable Devices in Sports Market, By Component, 2019-2028 (USD Million)
TABLE 66 Mexico Wearable Devices in Sports Market, By Product Type, 2019-2028 (USD Million)
TABLE 67 Mexico Pedometers in Wearable Devices in Sports Market, By Product Type, 2019-2028 (USD Million)
TABLE 68 Mexico Fitness & Heart Rate Monitors in Wearable Devices in Sports Market, By Product Type, 2019-2028 (USD Million)
TABLE 69 Mexico Smart Fabrics in Wearable Devices in Sports Market, By Product Type, 2019-2028 (USD Million)
TABLE 70 Mexico Wearable Devices in Sports Market, By Site, 2019-2028 (USD Million)
TABLE 71 Mexico Wearable Devices in Sports Market, By Application, 2019-2028 (USD Million)
TABLE 72 Mexico Wearable Devices in Sports Market, By End User, 2019-2028 (USD Million)
TABLE 73 Mexico Wearable Devices in Sports Market, By Distribution Channel, 2019-2028 (USD Million)
TABLE 74 Europe Wearable devices in sports Market, By country, 2019-2028 (USD Million)
TABLE 75 EUROPE WEARABLE DEVICES IN SPORTS MARKET, BY Component, 2019-2028 (USD MILLION)
TABLE 76 EUROPE WEARABLE DEVICES IN SPORTS MARKET, BY PRODUCT type, 2019-2028 (UNITS)
TABLE 77 EUROPE pedometers in Wearable devices in sports Market, By Product type, 2019-2028 (USD Million)
TABLE 78 EUROPE fitness & heart rate monitors in Wearable devices in sports Market, By Product type, 2019-2028 (USD Million)
TABLE 79 EUROPE smart fabrics in Wearable devices in sports Market, By Product type, 2019-2028 (USD Million)
TABLE 80 EUROPE Wearable devices in sports Market, By site, 2019-2028 (USD Million)
TABLE 81 EUROPE Wearable devices in sports Market, By application, 2019-2028 (USD Million)
TABLE 82 EUROPE Wearable devices in sports Market, By End User, 2019-2028 (USD Million)
TABLE 83 EUROPE Wearable devices in sports Market, By Distribution CHannel, 2019-2028 (USD Million)
TABLE 84 GERMANY WEARABLE DEVICES IN SPORTS MARKET, BY Component, 2019-2028 (USD MILLION)
TABLE 85 GERMANY WEARABLE DEVICES IN SPORTS MARKET, BY PRODUCT type, 2019-2028 (UNITS)
TABLE 86 GERMANY pedometers in Wearable devices in sports Market, By Product type, 2019-2028 (USD Million)
TABLE 87 GERMANY fitness & heart rate monitors in Wearable devices in sports Market, By Product type, 2019-2028 (USD Million)
TABLE 88 GERMANY smart fabrics in Wearable devices in sports Market, By Product type, 2019-2028 (USD Million)
TABLE 89 GERMANY Wearable devices in sports Market, By site, 2019-2028 (USD Million)
TABLE 90 GERMANY Wearable devices in sports Market, By application, 2019-2028 (USD Million)
TABLE 91 GERMANY Wearable devices in sports Market, By End User, 2019-2028 (USD Million)
TABLE 92 GERMANY Wearable devices in sports Market, By Distribution CHannel, 2019-2028 (USD Million)
TABLE 93 FRANCE WEARABLE DEVICES IN SPORTS MARKET, BY Component, 2019-2028 (USD MILLION)
TABLE 94 FRANCE WEARABLE DEVICES IN SPORTS MARKET, BY PRODUCT type, 2019-2028 (UNITS)
TABLE 95 FRANCE pedometers in Wearable devices in sports Market, By Product type, 2019-2028 (USD Million)
TABLE 96 FRANCE fitness & heart rate monitors in Wearable devices in sports Market, By Product type, 2019-2028 (USD Million)
TABLE 97 FRANCE smart fabrics in Wearable devices in sports Market, By Product type, 2019-2028 (USD Million)
TABLE 98 FRANCE Wearable devices in sports Market, By site, 2019-2028 (USD Million)
TABLE 99 FRANCE Wearable devices in sports Market, By application, 2019-2028 (USD Million)
TABLE 100 FRANCE Wearable devices in sports Market, By End User, 2019-2028 (USD Million)
TABLE 101 FRANCE Wearable devices in sports Market, By Distribution CHannel, 2019-2028 (USD Million)
TABLE 102 U.K. WEARABLE DEVICES IN SPORTS MARKET, BY Component, 2019-2028 (USD MILLION)
TABLE 103 U.K. WEARABLE DEVICES IN SPORTS MARKET, BY PRODUCT type, 2019-2028 (UNITS)
TABLE 104 U.K. pedometers in Wearable devices in sports Market, By Product type, 2019-2028 (USD Million)
TABLE 105 U.K. fitness & heart rate monitors in Wearable devices in sports Market, By Product type, 2019-2028 (USD Million)
TABLE 106 U.K. smart fabrics in Wearable devices in sports Market, By Product type, 2019-2028 (USD Million)
TABLE 107 U.K. Wearable devices in sports Market, By site, 2019-2028 (USD Million)
TABLE 108 U.K. Wearable devices in sports Market, By application, 2019-2028 (USD Million)
TABLE 109 U.K. Wearable devices in sports Market, By End User, 2019-2028 (USD Million)
TABLE 110 U.K. Wearable devices in sports Market, By Distribution CHannel, 2019-2028 (USD Million)
TABLE 111 ITALY WEARABLE DEVICES IN SPORTS MARKET, BY Component, 2019-2028 (USD MILLION)
TABLE 112 ITALY WEARABLE DEVICES IN SPORTS MARKET, BY PRODUCT type, 2019-2028 (UNITS)
TABLE 113 ITALY pedometers in Wearable devices in sports Market, By Product type, 2019-2028 (USD Million)
TABLE 114 ITALY fitness & heart rate monitors in Wearable devices in sports Market, By Product type, 2019-2028 (USD Million)
TABLE 115 ITALY smart fabrics in Wearable devices in sports Market, By Product type, 2019-2028 (USD Million)
TABLE 116 ITALY Wearable devices in sports Market, By site, 2019-2028 (USD Million)
TABLE 117 ITALY Wearable devices in sports Market, By application, 2019-2028 (USD Million)
TABLE 118 ITALY Wearable devices in sports Market, By End User, 2019-2028 (USD Million)
TABLE 119 ITALY Wearable devices in sports Market, By Distribution CHannel, 2019-2028 (USD Million)
TABLE 120 SPAIN WEARABLE DEVICES IN SPORTS MARKET, BY Component, 2019-2028 (USD MILLION)
TABLE 121 SPAIN WEARABLE DEVICES IN SPORTS MARKET, BY PRODUCT type, 2019-2028 (UNITS)
TABLE 122 SPAIN pedometers in Wearable devices in sports Market, By Product type, 2019-2028 (USD Million)
TABLE 123 SPAIN fitness & heart rate monitors in Wearable devices in sports Market, By Product type, 2019-2028 (USD Million)
TABLE 124 SPAIN smart fabrics in Wearable devices in sports Market, By Product type, 2019-2028 (USD Million)
TABLE 125 SPAIN Wearable devices in sports Market, By site, 2019-2028 (USD Million)
TABLE 126 SPAIN Wearable devices in sports Market, By application, 2019-2028 (USD Million)
TABLE 127 SPAIN Wearable devices in sports Market, By End User, 2019-2028 (USD Million)
TABLE 128 SPAIN Wearable devices in sports Market, By Distribution CHannel, 2019-2028 (USD Million)
TABLE 129 RUSSIA WEARABLE DEVICES IN SPORTS MARKET, BY Component, 2019-2028 (USD MILLION)
TABLE 130 RUSSIA WEARABLE DEVICES IN SPORTS MARKET, BY PRODUCT type, 2019-2028 (UNITS)
TABLE 131 RUSSIA pedometers in Wearable devices in sports Market, By Product type, 2019-2028 (USD Million)
TABLE 132 RUSSIA fitness & heart rate monitors in Wearable devices in sports Market, By Product type, 2019-2028 (USD Million)
TABLE 133 RUSSIA smart fabrics in Wearable devices in sports Market, By Product type, 2019-2028 (USD Million)
TABLE 134 RUSSIA Wearable devices in sports Market, By site, 2019-2028 (USD Million)
TABLE 135 RUSSIA Wearable devices in sports Market, By application, 2019-2028 (USD Million)
TABLE 136 RUSSIA Wearable devices in sports Market, By End User, 2019-2028 (USD Million)
TABLE 137 RUSSIA Wearable devices in sports Market, By Distribution CHannel, 2019-2028 (USD Million)
TABLE 138 TURKEY WEARABLE DEVICES IN SPORTS MARKET, BY Component, 2019-2028 (USD MILLION)
TABLE 139 TURKEY WEARABLE DEVICES IN SPORTS MARKET, BY PRODUCT type, 2019-2028 (UNITS)
TABLE 140 TURKEY pedometers in Wearable devices in sports Market, By Product type, 2019-2028 (USD Million)
TABLE 141 TURKEY fitness & heart rate monitors in Wearable devices in sports Market, By Product type, 2019-2028 (USD Million)
TABLE 142 TURKEY smart fabrics in Wearable devices in sports Market, By Product type, 2019-2028 (USD Million)
TABLE 143 TURKEY Wearable devices in sports Market, By site, 2019-2028 (USD Million)
TABLE 144 TURKEY Wearable devices in sports Market, By application, 2019-2028 (USD Million)
TABLE 145 TURKEY Wearable devices in sports Market, By End User, 2019-2028 (USD Million)
TABLE 146 TURKEY Wearable devices in sports Market, By Distribution CHannel, 2019-2028 (USD Million)
TABLE 147 BELGIUM WEARABLE DEVICES IN SPORTS MARKET, BY Component, 2019-2028 (USD MILLION)
TABLE 148 BELGIUM WEARABLE DEVICES IN SPORTS MARKET, BY PRODUCT type, 2019-2028 (UNITS)
TABLE 149 BELGIUM pedometers in Wearable devices in sports Market, By Product type, 2019-2028 (USD Million)
TABLE 150 BELGIUM fitness & heart rate monitors in Wearable devices in sports Market, By Product type, 2019-2028 (USD Million)
TABLE 151 BELGIUM smart fabrics in Wearable devices in sports Market, By Product type, 2019-2028 (USD Million)
TABLE 152 BELGIUM Wearable devices in sports Market, By site, 2019-2028 (USD Million)
TABLE 153 BELGIUM Wearable devices in sports Market, By application, 2019-2028 (USD Million)
TABLE 154 BELGIUM Wearable devices in sports Market, By End User, 2019-2028 (USD Million)
TABLE 155 BELGIUM Wearable devices in sports Market, By Distribution CHannel, 2019-2028 (USD Million)
TABLE 156 NETHERLANDS WEARABLE DEVICES IN SPORTS MARKET, BY Component, 2019-2028 (USD MILLION)
TABLE 157 NETHERLANDS WEARABLE DEVICES IN SPORTS MARKET, BY PRODUCT type, 2019-2028 (UNITS)
TABLE 158 NETHERLANDS pedometers in Wearable devices in sports Market, By Product type, 2019-2028 (USD Million)
TABLE 159 NETHERLANDS fitness & heart rate monitors in Wearable devices in sports Market, By Product type, 2019-2028 (USD Million)
TABLE 160 NETHERLANDS smart fabrics in Wearable devices in sports Market, By Product type, 2019-2028 (USD Million)
TABLE 161 NETHERLANDS Wearable devices in sports Market, By site, 2019-2028 (USD Million)
TABLE 162 NETHERLANDS Wearable devices in sports Market, By application, 2019-2028 (USD Million)
TABLE 163 NETHERLANDS Wearable devices in sports Market, By End User, 2019-2028 (USD Million)
TABLE 164 NETHERLANDS Wearable devices in sports Market, By Distribution CHannel, 2019-2028 (USD Million)
TABLE 165 SWITZERLAND WEARABLE DEVICES IN SPORTS MARKET, BY Component, 2019-2028 (USD MILLION)
TABLE 166 SWITZERLAND WEARABLE DEVICES IN SPORTS MARKET, BY PRODUCT type, 2019-2028 (UNITS)
TABLE 167 SWITZERLAND pedometers in Wearable devices in sports Market, By Product type, 2019-2028 (USD Million)
TABLE 168 SWITZERLAND fitness & heart rate monitors in Wearable devices in sports Market, By Product type, 2019-2028 (USD Million)
TABLE 169 SWITZERLAND smart fabrics in Wearable devices in sports Market, By Product type, 2019-2028 (USD Million)
TABLE 170 SWITZERLAND Wearable devices in sports Market, By site, 2019-2028 (USD Million)
TABLE 171 SWITZERLAND Wearable devices in sports Market, By application, 2019-2028 (USD Million)
TABLE 172 SWITZERLAND Wearable devices in sports Market, By End User, 2019-2028 (USD Million)
TABLE 173 SWITZERLAND Wearable devices in sports Market, By Distribution CHannel, 2019-2028 (USD Million)
TABLE 174 Rest of Europe WEARABLE DEVICES IN SPORTS MARKET, BY component, 2019-2028 (USD MILLION)
TABLE 175 Asia-Pacific wearable devices in sports Market, By COUNTRY, 2019-2028 (USD million)
TABLE 176 Asia-Pacific Wearable Devices in Sports Market, By Component, 2019-2028 (USD Million)
TABLE 177 Asia-Pacific Wearable Devices in Sports Market, By Product Type, 2019-2028 (USD Million)
TABLE 178 Asia-Pacific Pedometers in Wearable Devices in Sports Market, By Product Type, 2019-2028 (USD Million)
TABLE 179 Asia-Pacific Fitness & Heart Rate Monitors in Wearable Devices in Sports Market, By Product Type, 2019-2028 (USD Million)
TABLE 180 Asia-Pacific Smart Fabrics in Wearable Devices in Sports Market, By Product Type, 2019-2028 (USD Million)
TABLE 181 Asia-Pacific Wearable Devices in Sports Market, By Site, 2019-2028 (USD Million)
TABLE 182 Asia-Pacific Wearable Devices in Sports Market, By Application, 2019-2028 (USD Million)
TABLE 183 Asia-Pacific Wearable Devices in Sports Market, By End User, 2019-2028 (USD Million)
TABLE 184 Asia-Pacific Wearable Devices in Sports Market, By Distribution Channel, 2019-2028 (USD Million)
TABLE 185 China Wearable Devices in Sports Market, By Component, 2019-2028 (USD Million)
TABLE 186 China Wearable Devices in Sports Market, By Product Type, 2019-2028 (USD Million)
TABLE 187 China Pedometers in Wearable Devices in Sports Market, By Product Type, 2019-2028 (USD Million)
TABLE 188 China Fitness & Heart Rate Monitors in Wearable Devices in Sports Market, By Product Type, 2019-2028 (USD Million)
TABLE 189 China Smart Fabrics in Wearable Devices in Sports Market, By Product Type, 2019-2028 (USD Million)
TABLE 190 China Wearable Devices in Sports Market, By Site, 2019-2028 (USD Million)
TABLE 191 China Wearable Devices in Sports Market, By Application, 2019-2028 (USD Million)
TABLE 192 China Wearable Devices in Sports Market, By End User, 2019-2028 (USD Million)
TABLE 193 China Wearable Devices in Sports Market, By Distribution Channel, 2019-2028 (USD Million)
TABLE 194 Japan Wearable Devices in Sports Market, By Component, 2019-2028 (USD Million)
TABLE 195 Japan Wearable Devices in Sports Market, By Product Type, 2019-2028 (USD Million)
TABLE 196 Japan Pedometers in Wearable Devices in Sports Market, By Product Type, 2019-2028 (USD Million)
TABLE 197 Japan Fitness & Heart Rate Monitors in Wearable Devices in Sports Market, By Product Type, 2019-2028 (USD Million)
TABLE 198 Japan Smart Fabrics in Wearable Devices in Sports Market, By Product Type, 2019-2028 (USD Million)
TABLE 199 Japan Wearable Devices in Sports Market, By Site, 2019-2028 (USD Million)
TABLE 200 Japan Wearable Devices in Sports Market, By Application, 2019-2028 (USD Million)
TABLE 201 Japan Wearable Devices in Sports Market, By End User, 2019-2028 (USD Million)
TABLE 202 Japan Wearable Devices in Sports Market, By Distribution Channel, 2019-2028 (USD Million)
TABLE 203 India Wearable Devices in Sports Market, By Component, 2019-2028 (USD Million)
TABLE 204 India Wearable Devices in Sports Market, By Product Type, 2019-2028 (USD Million)
TABLE 205 India Pedometers in Wearable Devices in Sports Market, By Product Type, 2019-2028 (USD Million)
TABLE 206 India Fitness & Heart Rate Monitors in Wearable Devices in Sports Market, By Product Type, 2019-2028 (USD Million)
TABLE 207 India Smart Fabrics in Wearable Devices in Sports Market, By Product Type, 2019-2028 (USD Million)
TABLE 208 India Wearable Devices in Sports Market, By Site, 2019-2028 (USD Million)
TABLE 209 India Wearable Devices in Sports Market, By Application, 2019-2028 (USD Million)
TABLE 210 India Wearable Devices in Sports Market, By End User, 2019-2028 (USD Million)
TABLE 211 India Wearable Devices in Sports Market, By Distribution Channel, 2019-2028 (USD Million)
TABLE 212 Australia Wearable Devices in Sports Market, By Component, 2019-2028 (USD Million)
TABLE 213 Australia Wearable Devices in Sports Market, By Product Type, 2019-2028 (USD Million)
TABLE 214 Australia Pedometers in Wearable Devices in Sports Market, By Product Type, 2019-2028 (USD Million)
TABLE 215 Australia Fitness & Heart Rate Monitors in Wearable Devices in Sports Market, By Product Type, 2019-2028 (USD Million)
TABLE 216 Australia Smart Fabrics in Wearable Devices in Sports Market, By Product Type, 2019-2028 (USD Million)
TABLE 217 Australia Wearable Devices in Sports Market, By Site, 2019-2028 (USD Million)
TABLE 218 Australia Wearable Devices in Sports Market, By Application, 2019-2028 (USD Million)
TABLE 219 Australia Wearable Devices in Sports Market, By End User, 2019-2028 (USD Million)
TABLE 220 Australia Wearable Devices in Sports Market, By Distribution Channel, 2019-2028 (USD Million)
TABLE 221 South Korea Wearable Devices in Sports Market, By Component, 2019-2028 (USD Million)
TABLE 222 South Korea Wearable Devices in Sports Market, By Product Type, 2019-2028 (USD Million)
TABLE 223 South Korea Pedometers in Wearable Devices in Sports Market, By Product Type, 2019-2028 (USD Million)
TABLE 224 South Korea Fitness & Heart Rate Monitors in Wearable Devices in Sports Market, By Product Type, 2019-2028 (USD Million)
TABLE 225 South Korea Smart Fabrics in Wearable Devices in Sports Market, By Product Type, 2019-2028 (USD Million)
TABLE 226 South Korea Wearable Devices in Sports Market, By Site, 2019-2028 (USD Million)
TABLE 227 South Korea Wearable Devices in Sports Market, By Application, 2019-2028 (USD Million)
TABLE 228 South Korea Wearable Devices in Sports Market, By End User, 2019-2028 (USD Million)
TABLE 229 South Korea Wearable Devices in Sports Market, By Distribution Channel, 2019-2028 (USD Million)
TABLE 230 Singapore Wearable Devices in Sports Market, By Component, 2019-2028 (USD Million)
TABLE 231 Singapore Wearable Devices in Sports Market, By Product Type, 2019-2028 (USD Million)
TABLE 232 Singapore Pedometers in Wearable Devices in Sports Market, By Product Type, 2019-2028 (USD Million)
TABLE 233 Singapore Fitness & Heart Rate Monitors in Wearable Devices in Sports Market, By Product Type, 2019-2028 (USD Million)
TABLE 234 Singapore Smart Fabrics in Wearable Devices in Sports Market, By Product Type, 2019-2028 (USD Million)
TABLE 235 Singapore Wearable Devices in Sports Market, By Site, 2019-2028 (USD Million)
TABLE 236 Singapore Wearable Devices in Sports Market, By Application, 2019-2028 (USD Million)
TABLE 237 Singapore Wearable Devices in Sports Market, By End User, 2019-2028 (USD Million)
TABLE 238 Singapore Wearable Devices in Sports Market, By Distribution Channel, 2019-2028 (USD Million)
TABLE 239 Malaysia Wearable Devices in Sports Market, By Component, 2019-2028 (USD Million)
TABLE 240 Malaysia Wearable Devices in Sports Market, By Product Type, 2019-2028 (USD Million)
TABLE 241 Malaysia Pedometers in Wearable Devices in Sports Market, By Product Type, 2019-2028 (USD Million)
TABLE 242 Malaysia Fitness & Heart Rate Monitors in Wearable Devices in Sports Market, By Product Type, 2019-2028 (USD Million)
TABLE 243 Malaysia Smart Fabrics in Wearable Devices in Sports Market, By Product Type, 2019-2028 (USD Million)
TABLE 244 Malaysia Wearable Devices in Sports Market, By Site, 2019-2028 (USD Million)
TABLE 245 Malaysia Wearable Devices in Sports Market, By Application, 2019-2028 (USD Million)
TABLE 246 Malaysia Wearable Devices in Sports Market, By End User, 2019-2028 (USD Million)
TABLE 247 Malaysia Wearable Devices in Sports Market, By Distribution Channel, 2019-2028 (USD Million)
TABLE 248 Thailand Wearable Devices in Sports Market, By Component, 2019-2028 (USD Million)
TABLE 249 Thailand Wearable Devices in Sports Market, By Product Type, 2019-2028 (USD Million)
TABLE 250 Thailand Pedometers in Wearable Devices in Sports Market, By Product Type, 2019-2028 (USD Million)
TABLE 251 Thailand Fitness & Heart Rate Monitors in Wearable Devices in Sports Market, By Product Type, 2019-2028 (USD Million)
TABLE 252 Thailand Smart Fabrics in Wearable Devices in Sports Market, By Product Type, 2019-2028 (USD Million)
TABLE 253 Thailand Wearable Devices in Sports Market, By Site, 2019-2028 (USD Million)
TABLE 254 Thailand Wearable Devices in Sports Market, By Application, 2019-2028 (USD Million)
TABLE 255 Thailand Wearable Devices in Sports Market, By End User, 2019-2028 (USD Million)
TABLE 256 Thailand Wearable Devices in Sports Market, By Distribution Channel, 2019-2028 (USD Million)
TABLE 257 Indonesia Wearable Devices in Sports Market, By Component, 2019-2028 (USD Million)
TABLE 258 Indonesia Wearable Devices in Sports Market, By Product Type, 2019-2028 (USD Million)
TABLE 259 Indonesia Pedometers in Wearable Devices in Sports Market, By Product Type, 2019-2028 (USD Million)
TABLE 260 Indonesia Fitness & Heart Rate Monitors in Wearable Devices in Sports Market, By Product Type, 2019-2028 (USD Million)
TABLE 261 Indonesia Smart Fabrics in Wearable Devices in Sports Market, By Product Type, 2019-2028 (USD Million)
TABLE 262 Indonesia Wearable Devices in Sports Market, By Site, 2019-2028 (USD Million)
TABLE 263 Indonesia Wearable Devices in Sports Market, By Application, 2019-2028 (USD Million)
TABLE 264 Indonesia Wearable Devices in Sports Market, By End User, 2019-2028 (USD Million)
TABLE 265 Indonesia Wearable Devices in Sports Market, By Distribution Channel, 2019-2028 (USD Million)
TABLE 266 Philippines Wearable Devices in Sports Market, By Component, 2019-2028 (USD Million)
TABLE 267 Philippines Wearable Devices in Sports Market, By Product Type, 2019-2028 (USD Million)
TABLE 268 Philippines Pedometers in Wearable Devices in Sports Market, By Product Type, 2019-2028 (USD Million)
TABLE 269 Philippines Fitness & Heart Rate Monitors in Wearable Devices in Sports Market, By Product Type, 2019-2028 (USD Million)
TABLE 270 Philippines Smart Fabrics in Wearable Devices in Sports Market, By Product Type, 2019-2028 (USD Million)
TABLE 271 Philippines Wearable Devices in Sports Market, By Site, 2019-2028 (USD Million)
TABLE 272 Philippines Wearable Devices in Sports Market, By Application, 2019-2028 (USD Million)
TABLE 273 Philippines Wearable Devices in Sports Market, By End User, 2019-2028 (USD Million)
TABLE 274 Philippines Wearable Devices in Sports Market, By Distribution Channel, 2019-2028 (USD Million)
TABLE 275 Rest of Asia-Pacific Wearable Devices in Sports Market, By Component, 2019-2028 (USD Million)
TABLE 276 South America wearable devices in sports Market, By COUNTRY, 2019-2028 (USD million)
TABLE 277 South America Wearable Devices in Sports Market, By Component, 2019-2028 (USD Million)
TABLE 278 South America Wearable Devices in Sports Market, By Product Type, 2019-2028 (USD Million)
TABLE 279 South America Pedometers in Wearable Devices in Sports Market, By Product Type, 2019-2028 (USD Million)
TABLE 280 South America Fitness & Heart Rate Monitors in Wearable Devices in Sports Market, By Product Type, 2019-2028 (USD Million)
TABLE 281 South America Smart Fabrics in Wearable Devices in Sports Market, By Product Type, 2019-2028 (USD Million)
TABLE 282 South America Wearable Devices in Sports Market, By Site, 2019-2028 (USD Million)
TABLE 283 South America Wearable Devices in Sports Market, By Application, 2019-2028 (USD Million)
TABLE 284 South America Wearable Devices in Sports Market, By End User, 2019-2028 (USD Million)
TABLE 285 South America Wearable Devices in Sports Market, By Distribution Channel, 2019-2028 (USD Million)
TABLE 286 BRAZIL Wearable Devices in Sports Market, By Component, 2019-2028 (USD Million)
TABLE 287 BRAZIL Wearable Devices in Sports Market, By Product Type, 2019-2028 (USD Million)
TABLE 288 BRAZIL Pedometers in Wearable Devices in Sports Market, By Product Type, 2019-2028 (USD Million)
TABLE 289 BRAZIL Fitness & Heart Rate Monitors in Wearable Devices in Sports Market, By Product Type, 2019-2028 (USD Million)
TABLE 290 BRAZIL Smart Fabrics in Wearable Devices in Sports Market, By Product Type, 2019-2028 (USD Million)
TABLE 291 BRAZIL Wearable Devices in Sports Market, By Site, 2019-2028 (USD Million)
TABLE 292 BRAZIL Wearable Devices in Sports Market, By Application, 2019-2028 (USD Million)
TABLE 293 BRAZIL Wearable Devices in Sports Market, By End User, 2019-2028 (USD Million)
TABLE 294 BRAZIL Wearable Devices in Sports Market, By Distribution Channel, 2019-2028 (USD Million)
TABLE 295 Argentina Wearable Devices in Sports Market, By Component, 2019-2028 (USD Million)
TABLE 296 Argentina Wearable Devices in Sports Market, By Product Type, 2019-2028 (USD Million)
TABLE 297 Argentina Pedometers in Wearable Devices in Sports Market, By Product Type, 2019-2028 (USD Million)
TABLE 298 Argentina Fitness & Heart Rate Monitors in Wearable Devices in Sports Market, By Product Type, 2019-2028 (USD Million)
TABLE 299 Argentina Smart Fabrics in Wearable Devices in Sports Market, By Product Type, 2019-2028 (USD Million)
TABLE 300 Argentina Wearable Devices in Sports Market, By Site, 2019-2028 (USD Million)
TABLE 301 Argentina Wearable Devices in Sports Market, By Application, 2019-2028 (USD Million)
TABLE 302 Argentina Wearable Devices in Sports Market, By End User, 2019-2028 (USD Million)
TABLE 303 Argentina Wearable Devices in Sports Market, By Distribution Channel, 2019-2028 (USD Million)
TABLE 304 rest of south america Wearable Devices in Sports Market, By Component, 2019-2028 (USD Million)
TABLE 305 Middle East & Africa Wearable devices in sports Market, By country, 2019-2028 (USD Million)
TABLE 306 MIDDLE EAST & AFRICA WEARABLE DEVICES IN SPORTS MARKET, BY Component, 2019-2028 (USD MILLION)
TABLE 307 MIDDLE EAST & AFRICA WEARABLE DEVICES IN SPORTS MARKET, BY PRODUCT type, 2019-2028 (UNITS)
TABLE 308 Middle East & Africa pedometers in Wearable devices in sports Market, By Product type, 2019-2028 (USD Million)
TABLE 309 Middle East & Africa fitness & heart rate monitors in Wearable devices in sports Market, By Product type, 2019-2028 (USD Million)
TABLE 310 Middle East & Africa smart fabrics in Wearable devices in sports Market, By Product type, 2019-2028 (USD Million)
TABLE 311 Middle East & Africa Wearable devices in sports Market, By site, 2019-2028 (USD Million)
TABLE 312 Middle East & Africa Wearable devices in sports Market, By application, 2019-2028 (USD Million)
TABLE 313 Middle East & Africa Wearable devices in sports Market, By End User, 2019-2028 (USD Million)
TABLE 314 Middle East & Africa Wearable devices in sports Market, By Distribution CHannel, 2019-2028 (USD Million)
TABLE 315 SOUTH AFRICA WEARABLE DEVICES IN SPORTS MARKET, BY Component, 2019-2028 (USD MILLION)
TABLE 316 SOUTH AFRICA WEARABLE DEVICES IN SPORTS MARKET, BY PRODUCT type, 2019-2028 (UNITS)
TABLE 317 South Africa pedometers in Wearable devices in sports Market, By Product type, 2019-2028 (USD Million)
TABLE 318 South Africa fitness & heart rate monitors in Wearable devices in sports Market, By Product type, 2019-2028 (USD Million)
TABLE 319 South Africa smart fabrics in Wearable devices in sports Market, By Product type, 2019-2028 (USD Million)
TABLE 320 South Africa Wearable devices in sports Market, By site, 2019-2028 (USD Million)
TABLE 321 South Africa Wearable devices in sports Market, By application, 2019-2028 (USD Million)
TABLE 322 South Africa Wearable devices in sports Market, By End User, 2019-2028 (USD Million)
TABLE 323 South Africa Wearable devices in sports Market, By Distribution CHannel, 2019-2028 (USD Million)
TABLE 324 SAUDI ARABIA WEARABLE DEVICES IN SPORTS MARKET, BY Component, 2019-2028 (USD MILLION)
TABLE 325 SAUDI ARABIA WEARABLE DEVICES IN SPORTS MARKET, BY PRODUCT type, 2019-2028 (UNITS)
TABLE 326 Saudi arabia pedometers in Wearable devices in sports Market, By Product type, 2019-2028 (USD Million)
TABLE 327 Saudi arabia fitness & heart rate monitors in Wearable devices in sports Market, By Product type, 2019-2028 (USD Million)
TABLE 328 Saudi arabia smart fabrics in Wearable devices in sports Market, By Product type, 2019-2028 (USD Million)
TABLE 329 Saudi arabia Wearable devices in sports Market, By site, 2019-2028 (USD Million)
TABLE 330 Saudi arabia Wearable devices in sports Market, By application, 2019-2028 (USD Million)
TABLE 331 Saudi arabia Wearable devices in sports Market, By End User, 2019-2028 (USD Million)
TABLE 332 Saudi arabia Wearable devices in sports Market, By Distribution CHannel, 2019-2028 (USD Million)
TABLE 333 U.A.E. WEARABLE DEVICES IN SPORTS MARKET, BY Component, 2019-2028 (USD MILLION)
TABLE 334 U.A.E. WEARABLE DEVICES IN SPORTS MARKET, BY PRODUCT type, 2019-2028 (UNITS)
TABLE 335 U.A.E. pedometers in Wearable devices in sports Market, By Product type, 2019-2028 (USD Million)
TABLE 336 U.A.E. fitness & heart rate monitors in Wearable devices in sports Market, By Product type, 2019-2028 (USD Million)
TABLE 337 U.A.E. smart fabrics in Wearable devices in sports Market, By Product type, 2019-2028 (USD Million)
TABLE 338 U.A.E. Wearable devices in sports Market, By site, 2019-2028 (USD Million)
TABLE 339 U.A.E. Wearable devices in sports Market, By application, 2019-2028 (USD Million)
TABLE 340 U.A.E. Wearable devices in sports Market, By End User, 2019-2028 (USD Million)
TABLE 341 U.A.E. Wearable devices in sports Market, By Distribution CHannel, 2019-2028 (USD Million)
TABLE 342 EGYPT WEARABLE DEVICES IN SPORTS MARKET, BY Component, 2019-2028 (USD MILLION)
TABLE 343 EGYPT WEARABLE DEVICES IN SPORTS MARKET, BY PRODUCT type, 2019-2028 (UNITS)
TABLE 344 EGYPT pedometers in Wearable devices in sports Market, By Product type, 2019-2028 (USD Million)
TABLE 345 EGYPT fitness & heart rate monitors in Wearable devices in sports Market, By Product type, 2019-2028 (USD Million)
TABLE 346 EGYPT smart fabrics in Wearable devices in sports Market, By Product type, 2019-2028 (USD Million)
TABLE 347 EGYPT Wearable devices in sports Market, By site, 2019-2028 (USD Million)
TABLE 348 EGYPT Wearable devices in sports Market, By application, 2019-2028 (USD Million)
TABLE 349 EGYPT Wearable devices in sports Market, By End User, 2019-2028 (USD Million)
TABLE 350 EGYPT Wearable devices in sports Market, By Distribution CHannel, 2019-2028 (USD Million)
TABLE 351 ISRAEL WEARABLE DEVICES IN SPORTS MARKET, BY Component, 2019-2028 (USD MILLION)
TABLE 352 ISRAEL WEARABLE DEVICES IN SPORTS MARKET, BY PRODUCT type, 2019-2028 (UNITS)
TABLE 353 ISRAEL pedometers in Wearable devices in sports Market, By Product type, 2019-2028 (USD Million)
TABLE 354 ISRAEL fitness & heart rate monitors in Wearable devices in sports Market, By Product type, 2019-2028 (USD Million)
TABLE 355 ISRAEL smart fabrics in Wearable devices in sports Market, By Product type, 2019-2028 (USD Million)
TABLE 356 ISRAEL Wearable devices in sports Market, By site, 2019-2028 (USD Million)
TABLE 357 ISRAEL Wearable devices in sports Market, By application, 2019-2028 (USD Million)
TABLE 358 ISRAEL Wearable devices in sports Market, By End User, 2019-2028 (USD Million)
TABLE 359 ISRAEL Wearable devices in sports Market, By Distribution CHannel, 2019-2028 (USD Million)
TABLE 360 Rest of Middle East & Africa WEARABLE DEVICES IN SPORTS MARKET, BY component, 2019-2028 (USD MILLION)
图片列表
FIGURE 1 Global WEARABLE DEVICES IN SPORTS market: segmentation
FIGURE 2 Global WEARABLE DEVICES IN SPORTS MARKET: data triangulation
FIGURE 3 GLOBAL WEARABLE DEVICES IN SPORTS MARKET: DROC ANALYSIS
FIGURE 4 Global WEARABLE DEVICES IN SPORTS MARKET: global VS REGIONAL ANALYSIS
FIGURE 5 Global wearable devices in sports MARKET: COMPANY RESEARCH ANALYSIS
FIGURE 6 Global wearable devices in sports MARKET: INTERVIEW DEMOGRAPHICS
FIGURE 7 Global wearable devices in sports MARKET: DBMR MARKET POSITION GRID
FIGURE 8 GLOBAL WEARABLE DEVICES IN SPORTS MARKET: VENDOR SHARE ANALYSIS
FIGURE 9 Global wearable devices in sports MARKET: MARKET end user cOVERAGE GRID
FIGURE 10 GLOBAL WEARABLE DEVICES IN SPORTS MARKET: SEGMENTATION
FIGURE 11 risE IN popularity among professional athletes is expected to drive the Global wearable devices in sports MARKET in the forecast period of 2021 to 2028
FIGURE 12 software segment is expected to account for the largest share of the Global wearable devices in sports MARKET in 2021 & 2028
FIGURE 13 NORTH AMERICA IS EXPECTED TO DOMINATE THE Global wearable devices in sports MARKET AND ASIA-PACIFIC IS EXPECTED TO GROW WITH THE HIGHEST CAGR IN THE FORECAST PERIOD OF 2021 TO 2028
FIGURE 14 asia-pacific is the fastest-growing market for wearable devices in sports manufacturers in the forecast period of 2021 to 2028
FIGURE 15 DRIVERS, RESTRAINTS, OPPORTUNITIES AND CHALLENGEs OF global Wearable Devices in sports market
FIGURE 16 Global wearable devices in sports market: By component, 2020
FIGURE 17 Global wearable devices in sports market: By component, 2019-2028 (USD million)
FIGURE 18 Global wearable devices in sports market: By component, CAGR (2021-2028)
FIGURE 19 Global wearable devices in sports market: By component, LIFELINE CURVE
FIGURE 20 Global wearable devices in sports market: By PRODUCT TYPE, 2020
FIGURE 21 Global wearable devices in sports market: By PRODUCT TYPE, 2019-2028 (USD million)
FIGURE 22 Global wearable devices in sports market: By PRODUCT TYPE, CAGR (2021-2028)
FIGURE 23 Global wearable devices in sports market: By PRODUCT TYPE, LIFELINE CURVE
FIGURE 24 Global wearable devices in sports market: By site, 2020
FIGURE 25 Global wearable devices in sports market: By site, 2019-2028 (USD million)
FIGURE 26 Global wearable devices in sports market: By site, CAGR (2021-2028)
FIGURE 27 Global wearable devices in sports market: By site, LIFELINE CURVE
FIGURE 28 Global wearable devices in sports market: By application, 2020
FIGURE 29 Global wearable devices in sports market: By application, 2019-2028 (USD million)
FIGURE 30 Global wearable devices in sports market: By application, CAGR (2021-2028)
FIGURE 31 Global wearable devices in sports market: By application, LIFELINE CURVE
FIGURE 32 Global wearable devices in sports market: By end user, 2020
FIGURE 33 Global wearable devices in sports market: By end user, 2019-2028 (USD million)
FIGURE 34 Global wearable devices in sports market: By end user, CAGR (2021-2028)
FIGURE 35 Global wearable devices in sports market: By end user, LIFELINE CURVE
FIGURE 36 Global wearable devices in sports market: By distribution channel, 2020
FIGURE 37 Global wearable devices in sports market: By distribution channel, 2019-2028 (USD million)
FIGURE 38 Global wearable devices in sports market: By distribution channel, CAGR (2021-2028)
FIGURE 39 Global wearable devices in sports market: By distribution channel, LIFELINE CURVE
FIGURE 40 GLOBAL WEARABLE DEVICES IN SPORTS MARKET: SNAPSHOT (2020)
FIGURE 41 GLOBAL WEARABLE DEVICES IN SPORTS MARKET: BY region (2020)
FIGURE 42 GLOBAL WEARABLE DEVICES IN SPORTS MARKET: BY region (2021 & 2028)
FIGURE 43 GLOBAL WEARABLE DEVICES IN SPORTS MARKET: BY region (2020 & 2028)
FIGURE 44 GLOBAL WEARABLE DEVICES IN SPORTS MARKET: BY component (2021-2028)
FIGURE 45 NORTH AMERICA WEARABLE DEVICES IN SPORTS MARKET: SNAPSHOT (2020)
FIGURE 46 NORTH AMERICA WEARABLE DEVICES IN SPORTS MARKET: BY COUNTRY (2020)
FIGURE 47 NORTH AMERICA WEARABLE DEVICES IN SPORTS MARKET: BY COUNTRY (2021 & 2028)
FIGURE 48 NORTH AMERICA WEARABLE DEVICES IN SPORTS MARKET: BY COUNTRY (2020 & 2028)
FIGURE 49 NORTH AMERICA WEARABLE DEVICES IN SPORTS MARKET: BY component (2021-2028)
FIGURE 50 EUROPE Wearable devices in sports Market: SNAPSHOT (2020)
FIGURE 51 EUROPE WEARABLE DEVICES IN SPORTS Market: BY COUNTRY (2020)
FIGURE 52 EUROPE WEARABLE DEVICES IN SPORTS Market: BY country (2021 & 2028)
FIGURE 53 EUROPE WEARABLE DEVICES IN SPORTS Market: BY country (2020 & 2028)
FIGURE 54 EUROPE WEARABLE DEVICES IN SPORTS Market: BY component (2021-2028)
FIGURE 55 ASIA-PACIFIC WEARABLE DEVICES IN SPORTS MARKET: SNAPSHOT (2020)
FIGURE 56 ASIA-PACIFIC WEARABLE DEVICES IN SPORTS MARKET: BY COUNTRY (2020)
FIGURE 57 ASIA-PACIFIC WEARABLE DEVICES IN SPORTS MARKET: BY COUNTRY (2021 & 2028)
FIGURE 58 ASIA-PACIFIC WEARABLE DEVICES IN SPORTS MARKET: BY COUNTRY (2020 & 2028)
FIGURE 59 ASIA-PACIFIC WEARABLE DEVICES IN SPORTS MARKET: BY component (2021-2028)
FIGURE 60 SOUTH AMERICA WEARABLE DEVICES IN SPORTS MARKET: SNAPSHOT (2020)
FIGURE 61 SOUTH AMERICA WEARABLE DEVICES IN SPORTS MARKET: BY COUNTRY (2020)
FIGURE 62 SOUTH AMERICA WEARABLE DEVICES IN SPORTS MARKET: BY COUNTRY (2021 & 2028)
FIGURE 63 SOUTH AMERICA WEARABLE DEVICES IN SPORTS MARKET: BY COUNTRY (2020 & 2028)
FIGURE 64 SOUTH AMERICA WEARABLE DEVICES IN SPORTS MARKET: BY component (2021-2028)
FIGURE 65 MIDDLE EAST & AFRICA Wearable devices in sports Market: SNAPSHOT (2020)
FIGURE 66 MIDDLE EAST & AFRICA WEARABLE DEVICES IN SPORTS Market: BY COUNTRY (2020)
FIGURE 67 MIDDLE EAST & AFRICA WEARABLE DEVICES IN SPORTS Market: BY Country (2021 & 2028)
FIGURE 68 MIDDLE EAST & AFRICA WEARABLE DEVICES IN SPORTS Market: BY Country (2020 & 2028)
FIGURE 69 MIDDLE EAST & AFRICA WEARABLE DEVICES IN SPORTS Market: BY component (2021-2028)
FIGURE 70 Global Wearable devices in sports Market: company share 2020 (%)
FIGURE 71 north america Wearable devices in sports Market: company share 2020 (%)
FIGURE 72 europe Wearable devices in sports Market: company share 2020 (%)
FIGURE 73 Asia-Pacific Wearable devices in sports Market: company share 2020 (%)
研究方法
数据收集和基准年分析是使用具有大样本量的数据收集模块完成的。该阶段包括通过各种来源和策略获取市场信息或相关数据。它包括提前检查和规划从过去获得的所有数据。它同样包括检查不同信息源中出现的信息不一致。使用市场统计和连贯模型分析和估计市场数据。此外,市场份额分析和关键趋势分析是市场报告中的主要成功因素。要了解更多信息,请请求分析师致电或下拉您的询问。
DBMR 研究团队使用的关键研究方法是数据三角测量,其中包括数据挖掘、数据变量对市场影响的分析和主要(行业专家)验证。数据模型包括供应商定位网格、市场时间线分析、市场概览和指南、公司定位网格、专利分析、定价分析、公司市场份额分析、测量标准、全球与区域和供应商份额分析。要了解有关研究方法的更多信息,请向我们的行业专家咨询。
可定制
Data Bridge Market Research 是高级形成性研究领域的领导者。我们为向现有和新客户提供符合其目标的数据和分析而感到自豪。报告可定制,包括目标品牌的价格趋势分析、了解其他国家的市场(索取国家列表)、临床试验结果数据、文献综述、翻新市场和产品基础分析。目标竞争对手的市场分析可以从基于技术的分析到市场组合策略进行分析。我们可以按照您所需的格式和数据样式添加您需要的任意数量的竞争对手数据。我们的分析师团队还可以为您提供原始 Excel 文件数据透视表(事实手册)中的数据,或者可以帮助您根据报告中的数据集创建演示文稿。

