North America Submarine Cable System Market, By Product (Wet Plant Products and Dry Plant Products), Voltage (Medium Voltage and High Voltage, Extra High Voltage), Offering (Installation And Commissioning, Repair And Maintenance And Upgrades), Fiber Class (Unrepeatered and Repeatered), Cables Type (Loose Tube Cables, Ribbon Cables and Others), Armor Type (Light Weight Armor, Single Armor, Double Armor and Rock Armor), Depth (0 to 500M, 500M to 1000M, 1000M to 5000M and Others), Application (Power Cables and Communication Cables) - Industry Trends and Forecast to 2029.
North America Submarine Cable System Market Analysis and Size
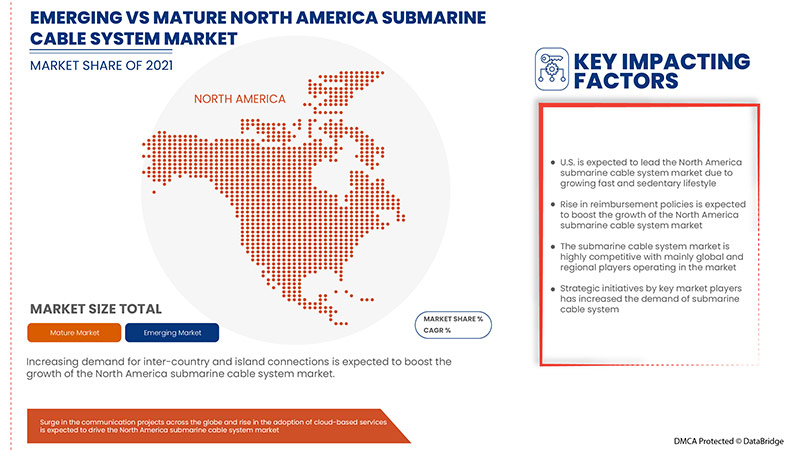
A submarine cable is a cable laid on the sea bed between land-based stations to carry telecommunication signals across stretches of sea and ocean. The rising telecom subscriptions and high investments in offshore wind farms have been directly influencing the growth of the submarine cable market. Also, the growing investments of content and cloud service providers are flourishing the growth of the submarine cable market. Also, the increasing internet traffic in emerging regions positively impacts the market's growth. Furthermore, the growing demand for bandwidth is also acting as an active growth driver for the growth of the submarine cable market. Moreover, the increasing number of offshore wind farms and rising demand for inter-country and island power connections are creating a huge demand for submarine cable and lifting the growth of the submarine cable market.
However, regulatory, environmental, and intricate authorization procedures leading to delays and the complex repairing procedure for deep water power cable links are the major restrictions on the growth of submarine cable in the above-mentioned forecasted period. In contrast, the growing buzz around space-based internet communications constellations can challenge the submarine cable market growth.
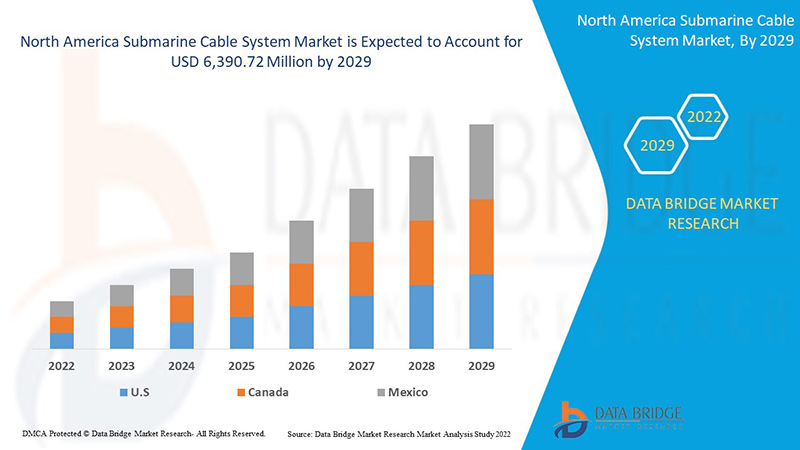
Data Bridge Market Research analyses that the North America submarine cable system market is expected to reach USD 6,390.72 million by 2029, at a CAGR of 7.2% during the forecast period. "Dry Plants products" accounts for the most prominent technology segment. This type of technology is in demand as it offers maximum work efficiency by avoiding the installation of cables in critical areas. The submarine cable system market report also comprehensively covers pricing, patent, and technological advancements.
|
Report Metric |
Details |
|
Forecast Period |
2022 to 2029 |
|
Base Year |
2021 |
|
Historic Years |
2020 (Customizable to 2019-2014) |
|
Segments Covered |
By Product (Wet Plant Products and Dry Plant Products), Voltage (Medium Voltage and High Voltage, Extra High Voltage), Offering (Installation And Commissioning, Repair And Maintenance And Upgrades), Fiber Class (Unrepeatered and Repeatered), Cables Type (Loose Tube Cables, Ribbon Cables and Others), Armor Type (Light Weight Armor, Single Armor, Double Armor and Rock Armor), Depth (0 to 500M, 500M to 1000M, 1000M to 5000M and Others), Application (Power Cables and Communication Cables) |
|
Countries Covered |
U.S., Canada, and Mexico |
|
Market Players Covered |
HENGTONG GROUP CO., LTD, TE Connectivity, Saudi Ericsson, APAR, NEC Corporation, NXT A/S, Norddeutsche Seekabelwerke GmbH (A Subsidiary of Prysmian Group), JDR Cable Systems Ltd, ZTT, Hexatronic Group, Alcatel Submarine Networks, Corning Incorporated, The Okonite Company, AFL (a subsidiary of Fujikura Ltd.), LEONI, NEXANS, Ocean Specialists, Inc. (a subsidiary of Continental Shelf Associates, Inc.), TFKable, Sumitomo Electric Industries, Ltd., Tratos, Hellenic Cables S.A. and HESFIBEL SUBSEA CABLES among others. |
Market Definition
A submarine cable system refers to the cable frameworks connected to a land-based station that helps to transmit the signals over the ocean and marine water bodies. The connectivity combination over long distances combines communication and electricity transmission through the cable systems laid under water.
The demand and the deployment of the submarine cable system are completely dependent on the North America increase in telecom and internet subscriptions. They are expected to expand the submarine systems in unexplored areas. Moreover, sea freight and GPS play a major role in developing submarine cables across all countries and regions in the modern world. This needs the application of proper and unique government regulations to develop a standard procedure and connectivity. Hence it includes several set of rules and regulations which helps to boost the market.
Submarine Cable System Market Dynamics
This section deals with understanding the market drivers, advantages, opportunities, restraints, and challenges. All of this is discussed in detail below:
Drivers/Opportunities
- Rise in the trend of offshore wind power generation
Submarine cables have been around since the mid-1800s. But, for a large portion of their set of experiences, such cables were utilized fundamentally to send power from conventional sources, for example, coal plants, either between nations or out to islands or oil stages. The submarine cable industry faced a decline during the 19th century. That changed during the 2000s, as rising energy costs and worries about environmental change animated interest in growing offshore wind and more effective transnational power grids.
Wind power generation is a clean energy source that does not require fuel and power generation offshore has strong winds, attracting offshore wind power generation development projects across the globe.
- Rise in the adoption of cloud-based services
The development over the air using various new satellite groups of stars being sent off and the rising fondness for getting to content through portable organizations over remote wireless transmissions. These remote transmissions are connected through data center infrastructures. They are interconnected through cables laid in a submarine to develop connections among different data centers in different countries and regions. This implies a need for submarine cables that helps to connect data centers and directly improve cloud-based connectivity for all types of organizations. Thus, the adoption of cloud-based services and solutions is expected to be a major driver of the growth of the submarine cable system market.
- Deployment of various technologies in submarine cable systems
Power feeding to submarine cable systems is a long-established practice, from coaxial submarine systems to present-day optical amplifier systems. The main principles of electrical powering to the submarine cable systems, as discussed in this chapter, are power feeding equipment (PFE) installed in the terminal stations, return path through earth and sea, and the PFE feeding a constant current to stabilize the repeater characteristics and transmission performance.
Restraint/Challenges
- High initial investments act as an entry barrier for SMEs
The connection through subsea cable is lengthy and thus the cost is directly dependent on the length of the cable systems used which directly Thus, it has been observed that usually, the major players in the market involves in the submarine cable service business as it involves huge investments which the SMEs cannot offer. This will restrict more players from entering the market and promote dominance, which is expected to restrict market growth.
- Complex repairing procedures
Cable ships are loaded with enough cable for repairs, maybe 5-10 km, which can be loaded in a few hours. Cable has to be added to make the repair, since there is not enough slack to bring the cable up and cut a piece out. After the cable is retrieved and on board, in a repair room that looks like a laboratory, engineers repair the cable.
Post COVID-19 Impact on Submarine Cable System Market
COVID-19 significantly impacted the submarine cable system market as almost every country has opted for the shutdown for every production facility except those producing essential goods. The government has taken strict actions, such as shutting down production and sale of non-essential goods, blocking international trade, and many more, to prevent the spread of COVID-19. The only business dealing in this pandemic situation is the essential services allowed to open and run the processes.
The growth of the submarine cable system market is rising due to the digitalization in the production process and supply chains across electrical utilities, mining, oil and gas, and transportation. Moreover, cable faults occur frequently worldwide, and a fleet of dedicated vessels repair them as quickly as possible. Repairing a cable requires receiving government permits to access ports and for ships to perform repairs in territorial waters. Delays in permits were already an issue facing the industry in some countries before COVID-19. With the importance of connectivity at its pinnacle, it's more vital than ever for governments to expedite permits to ensure swift repairs.
Manufacturers are making various strategic decisions to bounce back post-COVID-19. The players are conducting multiple research and development activities to improve the technology in the submarine cable system market. The companies will bring advanced and accurate solutions to the market.
Recent Development
- In November 2021, LEONI announced the partnership in the ADOPD project developing ultrafast fiber-optical computational units based on Adaptive Optical Dendrites. This project will help the company to understand the various processes and interactions and result in developing better product technologies in various segments, especially in cable systems
- In July 2022, NEXANS announced the winning of the new project by EuroAsia interconnector Limited to develop European electricity interconnection linking the national grids of Israel, Cyprus, and Greece (Crete). This project will help the company to provide technology for deep water subsea power cables utilizing NEXANS long-term developments for 3,000m ultradeep waters together with the installation capabilities which will be recognized in the market
North America Submarine Cable System Market Scope
The submarine cable system market is segmented on product, voltage, offering, fiber class, cables type, armor type, depth and application. The growth amongst these segments will help you analyze meager growth segments in the industries and provide the users with a valuable market overview and market insights to help them make strategic decisions for identifying core market applications.
By Product
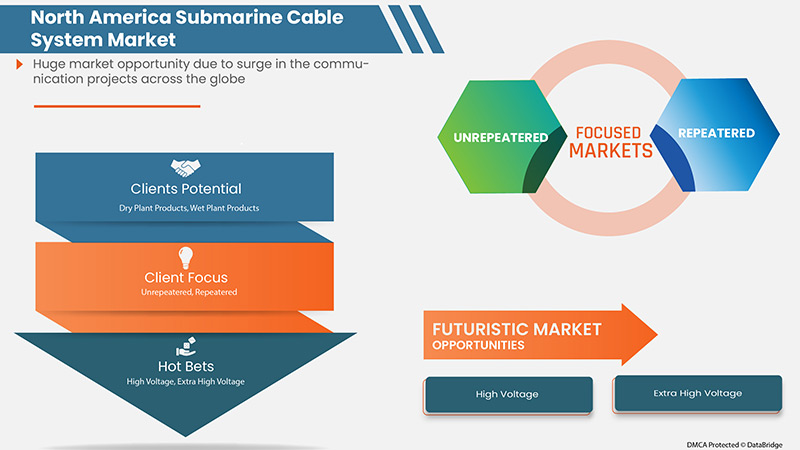
- Wet plant Products
- Dry Plant Products
On the basis of product, the submarine cable system market is segmented into wet plant products and dry plant products.
By Voltage
- Medium Voltage
- High Voltage
- Extra High Voltage
On the basis of voltage, the submarine cable system market is segmented into medium voltage, high voltage and extra high voltage.
By Offering
- Maintenance
- Upgrades
- Installation and Commissioning
On the basis of offering, the submarine cable system market is segmented into maintenance, upgrades and installation and commissioning.
By Fiber Class
- Unrepeatered
- Repeatered
On the basis of fiber class, the submarine cable system market is segmented into unrepeatered and repeatered
By Cables Type
- Loose Tube Cables
- Ribbon Cables
- Others
On the basis of cables type, the submarine cable system market is segmented into loose tube cables, ribbon cables and others.
By Armor Type
- Light Weight Armor
- Single Armor
- Double Armor
- Rock Armor
On the basis of armor type, the submarine cable system market is segmented into light weight armor, single armor, double armor and rock armor.
By Depth
- 0 To 500 M
- 500 M-1000 M
- 1000 M-5000 M
- Others
On the basis of depth, the submarine cable system market is segmented into 0 to 500m, 500m to 1000m, 1000m to 5000m and others.
By Application
- Power Cables
- Communication Cables
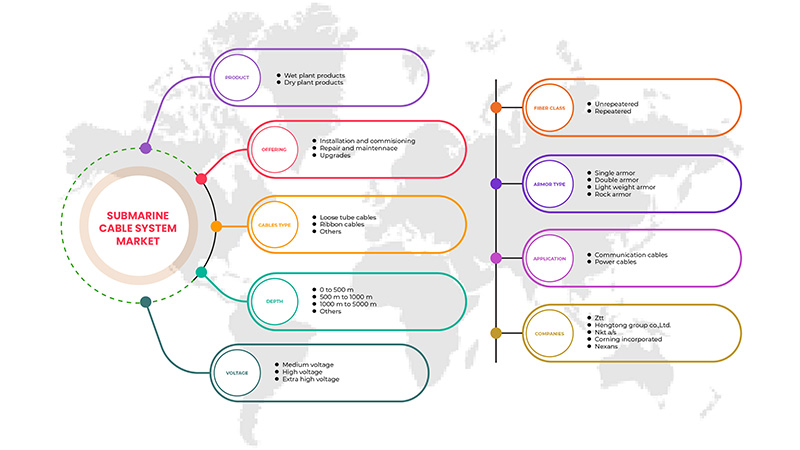
On the basis of application, the submarine cable system market is segmented into power cables and communication cables.
Submarine Cable System Market Regional Analysis/Insights
The submarine cable system market is analysed and market size insights and trends are provided by the product, voltage, offering, fiber glass, cables type, armor type, depth and application as referenced above.
The countries covered in the submarine cable system market report are U.S., Canada, and Mexico.
U.S. dominates the North America submarine cable system market. U.S. is likely to be the fastest-growing submarine cable system market. The rising use of sensors and AI technology in industries are credited with the market's dominance. With the increasing development in automation technology is increasing, which will boost the demand for submarine cable system products in the North America region.
The country section of the report also provides individual market-impacting factors and changes in market regulation that impact the current and future trends of the market. Data points like downstream and upstream value chain analysis, technical trends porter's five forces analysis, and case studies are some of the pointers used to forecast the market scenario for individual countries. Also, the presence and availability of North America brands and their challenges faced due to large or scarce competition from local and domestic brands, the impact of domestic tariffs, and trade routes are considered while providing forecast analysis of the country data.
Competitive Landscape and Submarine Cable System Market Share Analysis
The submarine cable system market competitive landscape provides details by competitor. Details included are company overview, company financials, revenue generated, market potential, investment in research and development, new market initiatives, North America presence, production sites and facilities, production capacities, company strengths and weaknesses, product launch, product width and breadth, application dominance. The above data points provided are only related to the companies' focus related to submarine cable system market.
Some of the major players operating in the submarine cable system market are HENGTONG GROUP CO., LTD, TE Connectivity, Saudi Ericsson, APAR, NEC Corporation, NXT A/S, Norddeutsche Seekabelwerke GmbH (A Subsidiary of Prysmian Group), JDR Cable Systems Ltd, ZTT, Hexatronic Group, Alcatel Submarine Networks, Corning Incorporated, The Okonite Company, AFL (a subsidiary of Fujikura Ltd.), LEONI, NEXANS, Ocean Specialists, Inc. (a subsidiary of Continental Shelf Associates, Inc.), TFKable, Sumitomo Electric Industries, Ltd., Tratos, Hellenic Cables S.A. and HESFIBEL SUBSEA CABLES among others.
SKU-
Accédez en ligne au rapport sur le premier cloud mondial de veille économique

- Tableau de bord d'analyse de données interactif
- Tableau de bord d'analyse d'entreprise pour les opportunités à fort potentiel de croissance
- Accès d'analyste de recherche pour la personnalisation et les requêtes
- Analyse de la concurrence avec tableau de bord interactif
- Dernières actualités, mises à jour et analyse des tendances
- Exploitez la puissance de l'analyse comparative pour un suivi complet de la concurrence
Table des matières
1 INTRODUCTION
1.1 OBJECTIVES OF THE STUDY
1.2 MARKET DEFINITION
1.3 OVERVIEW OF NORTH AMERICA SUBMARINE CABLE SYSTEM MARKET
1.4 CURRENCY AND PRICING
1.5 LIMITATIONS
1.6 MARKETS COVERED
2 MARKET SEGMENTATION
2.1 MARKETS COVERED
2.2 YEARS CONSIDERED FOR THE STUDY
2.3 GEOGRAPHIC SCOPE
2.4 DBMR TRIPOD DATA VALIDATION MODEL
2.5 PRIMARY INTERVIEWS WITH KEY OPINION LEADERS
2.6 DBMR MARKET POSITION GRID
2.7 VENDOR SHARE ANALYSIS
2.8 MARKET APPLICATION COVERAGE GRID
2.9 MULTIVARIATE MODELLING
2.1 PRODUCT CURVE
2.11 CHALLENGE MATRIX
2.12 SECONDARY SOURCES
2.13 ASSUMPTIONS
3 EXECUTIVE SUMMARY
4 PREMIUM INSIGHTS
5 MARKET OVERVIEW
5.1 DRIVERS
5.1.1 SURGE IN THE COMMUNICATION PROJECTS UNDERSEA PATH ACROSS THE GLOBE
5.1.2 RISE IN THE TREND OF OFFSHORE WIND POWER GENERATION
5.1.3 GROWING DEMAND FOR HIGH BANDWIDTH, LOW-LATENCY, AND HIGH REDUNDANCY OWING TO THE EMERGENCE OF 5G
5.1.4 RISE IN THE ADOPTION OF CLOUD-BASED SERVICES
5.2 RESTRAINTS
5.2.1 HIGH INITIAL INVESTMENTS ACT AS ENTRY BARRIER FOR SMES
5.2.2 HIGH PROBABILITY OF DAMAGE DUE TO VULNERABLE CONDITIONS
5.3 OPPORTUNITIES
5.3.1 PENETRATION OF SUBMARINE CABLE OWING TO THE INCREASING INTERNET TRAFFIC ACROSS THE REGION
5.3.2 INCREASING STRATEGIC PARTNERSHIP AMONG MAJOR MARKET PLAYERS FOR CABLE SYSTEMS
5.3.3 RISING INVESTMENTS BY OTT PROVIDERS TO CREATE ABUNDANT OPPORTUNITIES FOR SALES OF SUBMARINE CABLES
5.3.4 DEPLOYMENT OF VARIED TECHNOLOGIES IN SUBMARINE CABLE SYSTEMS
5.4 CHALLENGES
5.4.1 ALTERNATIVE MODES OF INTERNET SERVICE PROVISIONING
5.4.2 COMPLEX REPAIRING PROCEDURES
6 NORTH AMERICA SUBMARINE CABLE SYSTEM MARKET, BY PRODUCT
6.1 OVERVIEW
6.2 DRY PLANT PRODUCTS
6.2.1 POWER FEEDING EQUIPMENT (PFE)
6.2.2 SUBMARINE LINE TERMINAL EQUIPMENT (SLTE)
6.2.3 SUBMARINE LINE MONITOR (SLM)
6.2.4 OTHERS
6.3 WET PLANT PRODUCTS
6.3.1 CABLES
6.3.2 REPEATER
6.3.3 BRANCHING UNIT (BU)
6.3.4 OTHERS
7 NORTH AMERICA SUBMARINE CABLE SYSTEM MARKET, BY VOLTAGE
7.1 OVERVIEW
7.2 HIGH VOLTAGE
7.3 EXTRA HIGH VOLTAGE
7.4 MEDIUM VOLTAGE
8 NORTH AMERICA SUBMARINE CABLE SYSTEM MARKET, BY OFFERING
8.1 OVERVIEW
8.2 INSTALLATION ET MISE EN SERVICE
8.3 RÉPARATION ET ENTRETIEN
8.4 MISES À NIVEAU
9 MARCHÉ DES SYSTÈMES DE CÂBLES SOUS-MARINS EN AMÉRIQUE DU NORD, PAR CLASSE DE FIBRE
9.1 APERÇU
9.2 NON RÉPÉTÉ
9.3 RÉPÉTITÉ
10 MARCHÉ DES SYSTÈMES DE CÂBLES SOUS-MARINS EN AMÉRIQUE DU NORD, PAR TYPE DE CÂBLES
10.1 APERÇU
10.2 CÂBLES À TUBE LIBÈRE
10.3 CÂBLES PLATS
10.4 AUTRES
11 MARCHÉ DES SYSTÈMES DE CÂBLES SOUS-MARINS EN AMÉRIQUE DU NORD, PAR TYPE DE BLINDAGE
11.1 APERÇU
11.2 ARMURE SIMPLE
11.3 DOUBLE ARMURE
11.4 ARMURE LÉGÈRE
11.5 ROCHE ARMOR
12 MARCHÉ DES SYSTÈMES DE CÂBLES SOUS-MARINS EN AMÉRIQUE DU NORD, PAR PROFONDEUR
12.1 APERÇU
12.2 1000M-5000M
12.3 5000M-1000M
12,4 0M-500M
12,5 AUTRES
13 MARCHÉ DES SYSTÈMES DE CÂBLES SOUS-MARINS EN AMÉRIQUE DU NORD, PAR APPLICATION
13.1 APERÇU
13.2 CÂBLES DE COMMUNICATION
13.2.1 PRODUITS VÉGÉTAUX SECS
13.2.1.1 ÉQUIPEMENT D'ALIMENTATION ÉLECTRIQUE (PFE)
13.2.1.2 ÉQUIPEMENT TERMINAL DE LIGNE SOUS-MARINE (SLTE)
13.2.1.3 MONITEUR DE LIGNE SOUS-MARINE (SLM)
13.2.1.4 AUTRES
13.2.2 PRODUITS VÉGÉTAUX HUMIDES
13.2.2.1 CÂBLES
13.2.2.2 RÉPÉTITEUR
13.2.2.3 UNITÉ DE RAMIFICATION (UB)
13.2.2.4 AUTRES
13.3 CÂBLES D'ALIMENTATION
13.3.1 PRODUITS VÉGÉTAUX SECS
13.3.1.1 ÉQUIPEMENT D'ALIMENTATION ÉLECTRIQUE (PFE)
13.3.1.2 ÉQUIPEMENT TERMINAL DE LIGNE SOUS-MARINE (SLTE)
13.3.1.3 MONITEUR DE LIGNE SOUS-MARINE (SLM)
13.3.1.4 AUTRES
13.3.2 PRODUITS VÉGÉTAUX HUMIDES
13.3.2.1 CÂBLES
13.3.2.2 RÉPÉTITEUR
13.3.2.3 UNITÉ DE RAMIFICATION (UB)
13.3.2.4 AUTRES
14 MARCHÉ DES SYSTÈMES DE CÂBLES SOUS-MARINS EN AMÉRIQUE DU NORD, PAR RÉGION
14.1 AMÉRIQUE DU NORD
14.1.1 États-Unis
14.1.2 CANADA
14.1.3 MEXIQUE
15 MARCHÉ DES SYSTÈMES DE CÂBLES SOUS-MARINS EN AMÉRIQUE DU NORD : PAYSAGE DES ENTREPRISES
15.1 ANALYSE DES ACTIONS DE L'ENTREPRISE : AMÉRIQUE DU NORD
16 ANALYSE SWOT
17 PROFIL DE L'ENTREPRISE
17.1 ZTT
17.1.1 INSTANTANÉ DE L'ENTREPRISE
17.1.2 ANALYSE DES ACTIONS DE LA SOCIÉTÉ
17.1.3 PORTEFEUILLE DE PRODUITS
17.1.4 ÉVOLUTION RÉCENTE
17.2 HENGTONG GROUP CO., LTD
17.2.1 INSTANTANÉ DE L'ENTREPRISE
17.2.2 ANALYSE DES ACTIONS DE LA SOCIÉTÉ
17.2.3 CATÉGORIES DE PRODUITS
17.2.4 ÉVOLUTION RÉCENTE
17.3 NKT A/S
17.3.1 INSTANTANÉ DE L'ENTREPRISE
17.3.2 ANALYSE DES REVENUS
17.3.3 PORTEFEUILLE DE PRODUITS
17.3.4 ÉVOLUTION RÉCENTE
17.4 CORNING INCORPORATED
17.4.1 INSTANTANÉ DE L'ENTREPRISE
17.4.2 ANALYSE DES REVENUS
17.4.3 ANALYSE DES ACTIONS DE L'ENTREPRISE
17.4.4 PORTEFEUILLE DE PRODUITS
17.4.5 ÉVOLUTION RÉCENTE
17,5 NEXANS
17.5.1 INSTANTANÉ DE L'ENTREPRISE
17.5.2 ANALYSE DES REVENUS
17.5.3 ANALYSE DES ACTIONS DE L'ENTREPRISE
17.5.4 PORTEFEUILLE DE PRODUITS
17.5.5 ÉVOLUTIONS RÉCENTES
17.6 HELLENIC CABLES SA
17.6.1 INSTANTANÉ DE L'ENTREPRISE
17.6.2 ANALYSE DES REVENUS
17.6.3 PORTEFEUILLE DE PRODUITS
17.6.4 ÉVOLUTIONS RÉCENTES
17.7 RÉSEAUX SOUS-MARINS ALCATEL
17.7.1 INSTANTANÉ DE L'ENTREPRISE
17.7.2 PORTEFEUILLE DE PRODUITS
17.7.3 ÉVOLUTIONS RÉCENTES
17.8 AFL (UNE FILIALE DE FUJIKURA LTD.)
17.8.1 INSTANTANÉ DE L'ENTREPRISE
17.8.2 ANALYSE DES REVENUS
17.8.3 PORTEFEUILLE DE PRODUITS
17.8.4 ÉVOLUTIONS RÉCENTES
17,9 APAR
17.9.1 INSTANTANÉ DE L'ENTREPRISE
17.9.2 ANALYSE DES REVENUS
17.9.3 PORTEFEUILLE DE PRODUITS
17.9.4 ÉVOLUTION RÉCENTE
17.1 CÂBLES SOUS-MARINS HESFIBEL
17.10.1 INSTANTANÉ DE L'ENTREPRISE
17.10.2 PORTEFEUILLE DE PRODUITS
17.10.3 ÉVOLUTION RÉCENTE
17.11 GROUPE HEXATRONIQUE
17.11.1 INSTANTANÉ DE L'ENTREPRISE
17.11.2 ANALYSE DES REVENUS
17.11.3 PORTEFEUILLE DE PRODUITS
17.11.4 ÉVOLUTION RÉCENTE
17.12 JDR CABLE SYSTEMS LTD.
17.12.1 INSTANTANÉ DE L'ENTREPRISE
17.12.2 PORTEFEUILLE DE PRODUITS
17.12.3 ÉVOLUTION RÉCENTE
17.13 LEONI
17.13.1 INSTANTANÉ DE L'ENTREPRISE
17.13.2 ANALYSE DES REVENUS
17.13.3 PORTEFEUILLE DE PRODUITS
17.13.4 RECENT DEVELOPMENT
17.14 NEC CORPORATION
17.14.1 COMPANY SNAPSHOT
17.14.2 REVENUE ANALYSIS
17.14.3 PRODUCT PORTFOLIO
17.14.4 RECENT DEVELOPMENTS
17.15 NORDDEUTSCHE SEEKABELWERKE GMBH
17.15.1 COMPANY SNAPSHOT
17.15.2 PRODUCT PORTFOLIO
17.15.3 RECENT DEVELOPMENT
17.16 OCEAN SPECIALISTS, INC. (A SUBSIDIARY OF CONTINENTAL SHELF ASSOCIATES, INC.)
17.16.1 COMPANY SNAPSHOT
17.16.2 PRODUCT PORTFOLIO
17.16.3 RECENT DEVELOPMENTS
17.17 SAUDI ERICSSON
17.17.1 COMPANY SNAPSHOT
17.17.2 SOLUTION PORTFOLIO
17.17.3 RECENT DEVELOPMENT
17.18 SUMITOMO ELECTRIC INDUSTRIES, LTD.
17.18.1 COMPANY SNAPSHOT
17.18.2 REVENUE ANALYSIS
17.18.3 PRODUCT PORTFOLIO
17.18.4 RECENT DEVELOPMENTS
17.19 TE CONNECTIVITY
17.19.1 COMPANY SNAPSHOT
17.19.2 REVENUE ANALYSIS
17.19.3 SOLUTION PORTFOLIO
17.19.4 RECENT DEVELOPMENT
17.2 TFKABLE
17.20.1 COMPANY SNAPSHOT
17.20.2 PRODUCT PORTFOLIO
17.20.3 RECENT DEVELOPMENT
17.21 THE OKONITE COMPANY
17.21.1 COMPANY SNAPSHOT
17.21.2 PRODUCT PORTFOLIO
17.21.3 RECENT DEVELOPMENTS
17.22 TRATOS
17.22.1 COMPANY SNAPSHOT
17.22.2 PRODUCT PORTFOLIO
17.22.3 RECENT DEVELOPMENTS
18 QUESTIONNAIRE
19 RELATED REPORTS
Liste des tableaux
TABLEAU 1 MARCHÉ DES SYSTÈMES DE CÂBLES SOUS-MARINS EN AMÉRIQUE DU NORD, PAR PRODUIT, 2020-2029 (EN MILLIONS USD)
TABLEAU 2 PRODUITS VÉGÉTAUX SÈCHES EN AMÉRIQUE DU NORD SUR LE MARCHÉ DES SYSTÈMES DE CÂBLES SOUS-MARINS, PAR RÉGION, 2020-2029 (EN MILLIONS USD)
TABLEAU 3 PRODUITS VÉGÉTAUX SÈCHES EN AMÉRIQUE DU NORD SUR LE MARCHÉ DES SYSTÈMES DE CÂBLES SOUS-MARINS, PAR TYPE, 2020-2029 (EN MILLIONS USD)
TABLEAU 4 PRODUITS DE PLANTES HUMIDES EN AMÉRIQUE DU NORD SUR LE MARCHÉ DES SYSTÈMES DE CÂBLES SOUS-MARINS, PAR RÉGION, 2020-2029 (EN MILLIONS USD)
TABLEAU 5 PRODUITS DE PLANTES HUMIDES EN AMÉRIQUE DU NORD SUR LE MARCHÉ DES SYSTÈMES DE CÂBLES SOUS-MARINS, PAR TYPE, 2020-2029 (EN MILLIONS USD)
TABLEAU 6 MARCHÉ DES SYSTÈMES DE CÂBLES SOUS-MARINS EN AMÉRIQUE DU NORD, PAR TENSION, 2020-2029 (EN MILLIONS USD)
TABLEAU 7 MARCHÉ DES SYSTÈMES DE CÂBLES SOUS-MARINS À HAUTE TENSION EN AMÉRIQUE DU NORD, PAR RÉGION, 2020-2029 (EN MILLIONS USD)
TABLEAU 8 MARCHÉ DES SYSTÈMES DE CÂBLES SOUS-MARINS À TRÈS HAUTE TENSION EN AMÉRIQUE DU NORD, PAR RÉGION, 2020-2029 (EN MILLIONS USD)
TABLEAU 9 MARCHÉ DES SYSTÈMES DE CÂBLES SOUS-MARINS À MOYENNE TENSION EN AMÉRIQUE DU NORD, PAR RÉGION, 2020-2029 (EN MILLIONS USD)
TABLEAU 10 MARCHÉ DES SYSTÈMES DE CÂBLES SOUS-MARINS EN AMÉRIQUE DU NORD, PAR OFFRE, 2020-2029 (EN MILLIONS USD)
TABLEAU 11 INSTALLATION ET MISE EN SERVICE DES SYSTÈMES DE CÂBLES SOUS-MARINS EN AMÉRIQUE DU NORD, PAR RÉGION, 2020-2029 (EN MILLIONS USD)
TABLEAU 12 RÉPARATION ET ENTRETIEN DU MARCHÉ DES SYSTÈMES DE CÂBLES SOUS-MARINS EN AMÉRIQUE DU NORD, PAR RÉGION, 2020-2029 (EN MILLIONS USD)
TABLEAU 13 AMÉLIORATIONS DU MARCHÉ DES SYSTÈMES DE CÂBLES SOUS-MARINS EN AMÉRIQUE DU NORD, PAR RÉGION, 2020-2029 (EN MILLIONS USD)
TABLEAU 14 MARCHÉ DES SYSTÈMES DE CÂBLES SOUS-MARINS EN AMÉRIQUE DU NORD, PAR CLASSE DE FIBRE, 2020-2029 (EN MILLIONS USD)
TABLEAU 15 MARCHÉ DES SYSTÈMES DE CÂBLES SOUS-MARINS NON RÉPÉTÉS EN AMÉRIQUE DU NORD, PAR RÉGION, 2020-2029 (EN MILLIONS USD)
TABLEAU 16 MARCHÉ DES SYSTÈMES DE CÂBLES SOUS-MARINS EN AMÉRIQUE DU NORD, PAR RÉGION, 2020-2029 (EN MILLIONS USD)
TABLEAU 17 MARCHÉ DES SYSTÈMES DE CÂBLES SOUS-MARINS EN AMÉRIQUE DU NORD, PAR TYPE DE CÂBLES, 2020-2029 (EN MILLIONS USD)
TABLEAU 18 CÂBLES À TUBE LIBRE EN AMÉRIQUE DU NORD SUR LE MARCHÉ DES SYSTÈMES DE CÂBLES SOUS-MARINS, PAR RÉGION, 2020-2029 (EN MILLIONS USD)
TABLEAU 19 CÂBLES RUBANS SUR LE MARCHÉ DES SYSTÈMES DE CÂBLES SOUS-MARINS EN AMÉRIQUE DU NORD, PAR RÉGION, 2020-2029 (EN MILLIONS USD)
TABLEAU 20 AUTRES EN AMÉRIQUE DU NORD SUR LE MARCHÉ DES SYSTÈMES DE CÂBLES SOUS-MARINS, PAR RÉGION, 2020-2029 (EN MILLIONS USD)
TABLEAU 21 MARCHÉ DES SYSTÈMES DE CÂBLES SOUS-MARINS EN AMÉRIQUE DU NORD, PAR TYPE DE BLINDAGE, 2020-2029 (EN MILLIONS USD)
TABLEAU 22 MARCHÉ DES SYSTÈMES DE CÂBLES SOUS-MARINS À ARMURE SIMPLE EN AMÉRIQUE DU NORD, PAR RÉGION, 2020-2029 (EN MILLIONS USD)
TABLEAU 23 MARCHÉ DES SYSTÈMES DE CÂBLES SOUS-MARINS À DOUBLE BLINDAGE EN AMÉRIQUE DU NORD, PAR RÉGION, 2020-2029 (EN MILLIONS USD)
TABLEAU 24 MARCHÉ DES BLINDAGES LÉGERS DANS LES SYSTÈMES DE CÂBLES SOUS-MARINS EN AMÉRIQUE DU NORD, PAR RÉGION, 2020-2029 (EN MILLIONS USD)
TABLEAU 25 MARCHÉ DES ARMURES DE ROCHE DANS LES SYSTÈMES DE CÂBLES SOUS-MARINS EN AMÉRIQUE DU NORD, PAR RÉGION, 2020-2029 (EN MILLIONS USD)
TABLEAU 26 MARCHÉ DES SYSTÈMES DE CÂBLES SOUS-MARINS EN AMÉRIQUE DU NORD, PAR PROFONDEUR, 2020-2029 (EN MILLIONS USD)
TABLEAU 27 MARCHÉ DES SYSTÈMES DE CÂBLES SOUS-MARINS DE 1 000 À 5 000 M EN AMÉRIQUE DU NORD, PAR RÉGION, 2020-2029 (EN MILLIONS USD)
TABLEAU 28 MARCHÉ DES SYSTÈMES DE CÂBLES SOUS-MARINS DE 500 À 1 000 M EN AMÉRIQUE DU NORD, PAR RÉGION, 2020-2029 (EN MILLIONS USD)
TABLEAU 29 MARCHÉ DES SYSTÈMES DE CÂBLES SOUS-MARINS DE 0 À 500 M EN AMÉRIQUE DU NORD, PAR RÉGION, 2020-2029 (EN MILLIONS USD)
TABLEAU 30 AUTRES EN AMÉRIQUE DU NORD SUR LE MARCHÉ DES SYSTÈMES DE CÂBLES SOUS-MARINS, PAR RÉGION, 2020-2029 (EN MILLIONS USD)
TABLEAU 31 MARCHÉ DES SYSTÈMES DE CÂBLES SOUS-MARINS EN AMÉRIQUE DU NORD, PAR APPLICATION, 2020-2029 (EN MILLIONS USD)
TABLEAU 32 CÂBLES DE COMMUNICATION EN AMÉRIQUE DU NORD SUR LE MARCHÉ DES SYSTÈMES DE CÂBLES SOUS-MARINS, PAR RÉGION, 2020-2029 (EN MILLIONS USD)
TABLEAU 33 MARCHÉ DES CÂBLES DE COMMUNICATION SUR LE MARCHÉ DES SYSTÈMES DE CÂBLES SOUS-MARINS EN AMÉRIQUE DU NORD, PAR TYPE, 2020-2029 (EN MILLIONS USD)
TABLEAU 34 PRODUITS VÉGÉTAUX SÈCHES EN AMÉRIQUE DU NORD DANS LE MARCHÉ DES CÂBLES DE COMMUNICATION SUR LE MARCHÉ DES SYSTÈMES DE CÂBLES SOUS-MARINS, PAR TYPE, 2020-2029 (EN MILLIONS USD)
TABLEAU 35 PRODUITS DE PLANTES HUMIDES EN AMÉRIQUE DU NORD DANS LE MARCHÉ DES CÂBLES DE COMMUNICATION SUR LE MARCHÉ DES SYSTÈMES DE CÂBLES SOUS-MARINS, PAR TYPE, 2020-2029 (EN MILLIONS USD)
TABLEAU 36 CÂBLES ÉLECTRIQUES SUR LE MARCHÉ DES SYSTÈMES DE CÂBLES SOUS-MARINS EN AMÉRIQUE DU NORD, PAR TYPE, 2020-2029 (EN MILLIONS USD)
TABLEAU 37 MARCHÉ DES CÂBLES ÉLECTRIQUES SUR LE MARCHÉ DES SYSTÈMES DE CÂBLES SOUS-MARINS EN AMÉRIQUE DU NORD, PAR TYPE, 2020-2029 (EN MILLIONS USD)
TABLEAU 38 PRODUITS VÉGÉTAUX SÈCHES EN AMÉRIQUE DU NORD DANS LE MARCHÉ DES CÂBLES ÉLECTRIQUES DES SYSTÈMES DE CÂBLES SOUS-MARINS, PAR TYPE, 2020-2029 (EN MILLIONS USD)
TABLEAU 39 PRODUITS DE PLANTES HUMIDES EN AMÉRIQUE DU NORD DANS LE MARCHÉ DES CÂBLES ÉLECTRIQUES SUR LE MARCHÉ DES SYSTÈMES DE CÂBLES SOUS-MARINS, PAR TYPE, 2020-2029 (EN MILLIONS USD)
TABLEAU 40 MARCHÉ DES SYSTÈMES DE CÂBLES SOUS-MARINS EN AMÉRIQUE DU NORD, PAR PAYS, 2020-2029 (EN MILLIONS USD)
TABLEAU 41 MARCHÉ DES SYSTÈMES DE CÂBLES SOUS-MARINS EN AMÉRIQUE DU NORD, PAR PRODUIT, 2020-2029 (EN MILLIONS USD)
TABLEAU 42 PRODUITS VÉGÉTAUX SÈCHES EN AMÉRIQUE DU NORD SUR LE MARCHÉ DES SYSTÈMES DE CÂBLES SOUS-MARINS, PAR TYPE, 2020-2029 (EN MILLIONS USD)
TABLEAU 43 PRODUITS DE PLANTES HUMIDES SUR LE MARCHÉ DES SYSTÈMES DE CÂBLES SOUS-MARINS EN AMÉRIQUE DU NORD, PAR TYPE, 2020-2029 (EN MILLIONS USD)
TABLEAU 44 MARCHÉ DES SYSTÈMES DE CÂBLES SOUS-MARINS EN AMÉRIQUE DU NORD, PAR TENSION, 2020-2029 (EN MILLIONS USD)
TABLEAU 45 MARCHÉ DES SYSTÈMES DE CÂBLES SOUS-MARINS EN AMÉRIQUE DU NORD, PAR OFFRE, 2020-2029 (EN MILLIONS USD)
TABLEAU 46 MARCHÉ DES SYSTÈMES DE CÂBLES SOUS-MARINS EN AMÉRIQUE DU NORD, PAR CLASSE DE FIBRE, 2020-2029 (EN MILLIONS USD)
TABLEAU 47 MARCHÉ DES SYSTÈMES DE CÂBLES SOUS-MARINS EN AMÉRIQUE DU NORD, PAR TYPE DE CÂBLES, 2020-2029 (EN MILLIONS USD)
TABLEAU 48 MARCHÉ DES SYSTÈMES DE CÂBLES SOUS-MARINS EN AMÉRIQUE DU NORD, PAR TYPE DE BLINDAGE, 2020-2029 (EN MILLIONS USD)
TABLEAU 49 MARCHÉ DES SYSTÈMES DE CÂBLES SOUS-MARINS EN AMÉRIQUE DU NORD, PAR PROFONDEUR, 2020-2029 (EN MILLIONS USD)
TABLEAU 50 MARCHÉ DES SYSTÈMES DE CÂBLES SOUS-MARINS EN AMÉRIQUE DU NORD, PAR APPLICATION, 2020-2029 (EN MILLIONS USD)
TABLEAU 51 MARCHÉ DES CÂBLES DE COMMUNICATION SUR LE MARCHÉ DES SYSTÈMES DE CÂBLES SOUS-MARINS EN AMÉRIQUE DU NORD, PAR TYPE, 2020-2029 (EN MILLIONS USD)
TABLEAU 52 PRODUITS VÉGÉTAUX SÈCHES EN AMÉRIQUE DU NORD DANS LE MARCHÉ DES CÂBLES DE COMMUNICATION SUR LE MARCHÉ DES SYSTÈMES DE CÂBLES SOUS-MARINS, PAR TYPE, 2020-2029 (EN MILLIONS USD)
TABLEAU 53 PRODUITS DE PLANTES HUMIDES EN AMÉRIQUE DU NORD DANS LE MARCHÉ DES CÂBLES DE COMMUNICATION SUR LE MARCHÉ DES SYSTÈMES DE CÂBLES SOUS-MARINS, PAR TYPE, 2020-2029 (EN MILLIONS USD)
TABLEAU 54 MARCHÉ DES CÂBLES ÉLECTRIQUES SUR LE MARCHÉ DES SYSTÈMES DE CÂBLES SOUS-MARINS EN AMÉRIQUE DU NORD, PAR TYPE, 2020-2029 (EN MILLIONS USD)
TABLEAU 55 PRODUITS VÉGÉTAUX SECS EN AMÉRIQUE DU NORD DANS LE MARCHÉ DES CÂBLES ÉLECTRIQUES DES SYSTÈMES DE CÂBLES SOUS-MARINS, PAR TYPE, 2020-2029 (EN MILLIONS USD)
TABLEAU 56 PRODUITS DE PLANTES HUMIDES EN AMÉRIQUE DU NORD DANS LE MARCHÉ DES CÂBLES ÉLECTRIQUES SUR LE MARCHÉ DES SYSTÈMES DE CÂBLES SOUS-MARINS, PAR TYPE, 2020-2029 (EN MILLIONS USD)
TABLEAU 57 MARCHÉ DES SYSTÈMES DE CÂBLES SOUS-MARINS AUX ÉTATS-UNIS, PAR PRODUIT, 2020-2029 (EN MILLIONS USD)
TABLEAU 58 PRODUITS VÉGÉTAUX SÈCHES SUR LE MARCHÉ DES SYSTÈMES DE CÂBLES SOUS-MARINS AUX ÉTATS-UNIS, PAR TYPE, 2020-2029 (EN MILLIONS USD)
TABLEAU 59 PRODUITS DE INSTALLATIONS HUMIDES SUR LE MARCHÉ DES SYSTÈMES DE CÂBLES SOUS-MARINS AUX ÉTATS-UNIS, PAR TYPE, 2020-2029 (EN MILLIONS USD)
TABLEAU 60 MARCHÉ DES SYSTÈMES DE CÂBLES SOUS-MARINS AUX ÉTATS-UNIS, PAR TENSION, 2020-2029 (EN MILLIONS USD)
TABLEAU 61 MARCHÉ DES SYSTÈMES DE CÂBLES SOUS-MARINS AUX ÉTATS-UNIS, PAR OFFRE, 2020-2029 (EN MILLIONS USD)
TABLEAU 62 MARCHÉ DES SYSTÈMES DE CÂBLES SOUS-MARINS AUX ÉTATS-UNIS, PAR CLASSE DE FIBRE, 2020-2029 (EN MILLIONS USD)
TABLEAU 63 MARCHÉ DES SYSTÈMES DE CÂBLES SOUS-MARINS AUX ÉTATS-UNIS, PAR TYPE DE CÂBLES, 2020-2029 (EN MILLIONS USD)
TABLEAU 64 MARCHÉ DES SYSTÈMES DE CÂBLES SOUS-MARINS AUX ÉTATS-UNIS, PAR TYPE DE BLINDAGE, 2020-2029 (EN MILLIONS USD)
TABLEAU 65 MARCHÉ DES SYSTÈMES DE CÂBLES SOUS-MARINS AUX ÉTATS-UNIS, PAR PROFONDEUR, 2020-2029 (EN MILLIONS USD)
TABLEAU 66 MARCHÉ DES SYSTÈMES DE CÂBLES SOUS-MARINS AUX ÉTATS-UNIS, PAR APPLICATION, 2020-2029 (EN MILLIONS USD)
TABLEAU 67 CÂBLE DE COMMUNICATION AMÉRICAIN SUR LE MARCHÉ DES SYSTÈMES DE CÂBLES SOUS-MARINS, PAR TYPE, 2020-2029 (EN MILLIONS USD)
TABLEAU 68 PRODUITS VÉGÉTAUX SÈCHES DES ÉTATS-UNIS DANS LE MARCHÉ DES CÂBLES DE COMMUNICATION SUR LE MARCHÉ DES SYSTÈMES DE CÂBLES SOUS-MARINS, PAR TYPE, 2020-2029 (EN MILLIONS USD)
TABLEAU 69 PRODUITS DE INSTALLATIONS HUMIDES DES ÉTATS-UNIS DANS LE MARCHÉ DES CÂBLES DE COMMUNICATION SUR LE MARCHÉ DES SYSTÈMES DE CÂBLES SOUS-MARINS, PAR TYPE, 2020-2029 (EN MILLIONS USD)
TABLEAU 70 CÂBLE ÉLECTRIQUE AMÉRICAIN SUR LE MARCHÉ DES SYSTÈMES DE CÂBLES SOUS-MARINS, PAR TYPE, 2020-2029 (EN MILLIONS USD)
TABLEAU 71 PRODUITS DE VÉGÉTAUX SECS AUX ÉTATS-UNIS DANS LE MARCHÉ DES CÂBLES ÉLECTRIQUES DES SYSTÈMES DE CÂBLES SOUS-MARINS, PAR TYPE, 2020-2029 (EN MILLIONS USD)
TABLEAU 72 PRODUITS DE CÂBLES HUMIDES DES ÉTATS-UNIS DANS LE MARCHÉ DES CÂBLES ÉLECTRIQUES SOUS-MARINS, PAR TYPE, 2020-2029 (EN MILLIONS USD)
TABLEAU 73 MARCHÉ DES SYSTÈMES DE CÂBLES SOUS-MARINS AU CANADA, PAR PRODUIT, 2020-2029 (EN MILLIONS USD)
TABLEAU 74 PRODUITS VÉGÉTAUX SÈCHES SUR LE MARCHÉ DES SYSTÈMES DE CÂBLES SOUS-MARINS AU CANADA, PAR TYPE, 2020-2029 (EN MILLIONS USD)
TABLEAU 75 PRODUITS DE PLANTES HUMIDES SUR LE MARCHÉ DES SYSTÈMES DE CÂBLES SOUS-MARINS AU CANADA, PAR TYPE, 2020-2029 (EN MILLIONS USD)
TABLEAU 76 MARCHÉ DES SYSTÈMES DE CÂBLES SOUS-MARINS AU CANADA, PAR TENSION, 2020-2029 (EN MILLIONS USD)
TABLEAU 77 MARCHÉ DES SYSTÈMES DE CÂBLES SOUS-MARINS AU CANADA, PAR OFFRE, 2020-2029 (EN MILLIONS USD)
TABLEAU 78 MARCHÉ DES SYSTÈMES DE CÂBLES SOUS-MARINS AU CANADA, PAR CLASSE DE FIBRE, 2020-2029 (EN MILLIONS USD)
TABLEAU 79 MARCHÉ DES SYSTÈMES DE CÂBLES SOUS-MARINS AU CANADA, PAR TYPE DE CÂBLES, 2020-2029 (EN MILLIONS USD)
TABLEAU 80 MARCHÉ DES SYSTÈMES DE CÂBLES SOUS-MARINS AU CANADA, PAR TYPE DE BLINDAGE, 2020-2029 (EN MILLIONS USD)
TABLEAU 81 MARCHÉ DES SYSTÈMES DE CÂBLES SOUS-MARINS AU CANADA, PAR PROFONDEUR, 2020-2029 (EN MILLIONS USD)
TABLEAU 82 MARCHÉ DES SYSTÈMES DE CÂBLES SOUS-MARINS AU CANADA, PAR APPLICATION, 2020-2029 (EN MILLIONS USD)
TABLEAU 83 MARCHÉ DES CÂBLES DE COMMUNICATION SUR LE MARCHÉ DES SYSTÈMES DE CÂBLES SOUS-MARINS AU CANADA, PAR TYPE, 2020-2029 (EN MILLIONS USD)
TABLEAU 84 PRODUITS VÉGÉTAUX SECS DANS LE MARCHÉ DES CÂBLES DE COMMUNICATION DANS LES SYSTÈMES DE CÂBLES SOUS-MARINS AU CANADA, PAR TYPE, 2020-2029 (EN MILLIONS USD)
TABLEAU 85 CANADA PRODUITS DE VÉGÉTAUX HUMIDES DANS LE MARCHÉ DES CÂBLES DE COMMUNICATION DANS LES SYSTÈMES DE CÂBLES SOUS-MARINS, PAR TYPE, 2020-2029 (EN MILLIONS USD)
TABLEAU 86 MARCHÉ DES CÂBLES ÉLECTRIQUES SUR LE MARCHÉ DES SYSTÈMES DE CÂBLES SOUS-MARINS AU CANADA, PAR TYPE, 2020-2029 (EN MILLIONS USD)
TABLEAU 87 CANADA PRODUITS VÉGÉTAUX SECS DANS LE MARCHÉ DES CÂBLES ÉLECTRIQUES DES SYSTÈMES DE CÂBLES SOUS-MARINS, PAR TYPE, 2020-2029 (EN MILLIONS USD)
TABLEAU 88 CANADA PRODUITS DE VÉGÉTAUX HUMIDES DANS LE MARCHÉ DES CÂBLES ÉLECTRIQUES DES SYSTÈMES DE CÂBLES SOUS-MARINS, PAR TYPE, 2020-2029 (EN MILLIONS USD)
TABLEAU 89 MARCHÉ MEXICAIN DES SYSTÈMES DE CÂBLES SOUS-MARINS, PAR PRODUIT, 2020-2029 (EN MILLIONS USD)
TABLEAU 90 PRODUITS VÉGÉTAUX SÈCHES SUR LE MARCHÉ DES SYSTÈMES DE CÂBLES SOUS-MARINS AU MEXIQUE, PAR TYPE, 2020-2029 (EN MILLIONS USD)
TABLEAU 91 PRODUITS DE PLANTES HUMIDES SUR LE MARCHÉ DES SYSTÈMES DE CÂBLES SOUS-MARINS AU MEXIQUE, PAR TYPE, 2020-2029 (EN MILLIONS USD)
TABLEAU 92 MARCHÉ MEXICAIN DES SYSTÈMES DE CÂBLES SOUS-MARINS, PAR TENSION, 2020-2029 (EN MILLIONS USD)
TABLEAU 93 MARCHÉ MEXICAIN DES SYSTÈMES DE CÂBLES SOUS-MARINS, PAR OFFRE, 2020-2029 (EN MILLIONS USD)
TABLEAU 94 MARCHÉ MEXICAIN DES SYSTÈMES DE CÂBLES SOUS-MARINS, PAR CLASSE DE FIBRE, 2020-2029 (EN MILLIONS USD)
TABLEAU 95 MARCHÉ MEXICAIN DES SYSTÈMES DE CÂBLES SOUS-MARINS, PAR TYPE DE CÂBLES, 2020-2029 (EN MILLIONS USD)
TABLEAU 96 MARCHÉ MEXICAIN DES SYSTÈMES DE CÂBLES SOUS-MARINS, PAR TYPE DE BLINDAGE, 2020-2029 (EN MILLIONS USD)
TABLEAU 97 MARCHÉ MEXICAIN DES SYSTÈMES DE CÂBLES SOUS-MARINS, PAR PROFONDEUR, 2020-2029 (EN MILLIONS USD)
TABLEAU 98 MARCHÉ MEXICAIN DES SYSTÈMES DE CÂBLES SOUS-MARINS, PAR APPLICATION, 2020-2029 (EN MILLIONS USD)
TABLEAU 99 MEXIQUE CÂBLE DE COMMUNICATION SUR LE MARCHÉ DES SYSTÈMES DE CÂBLES SOUS-MARINS, PAR TYPE, 2020-2029 (EN MILLIONS USD)
TABLEAU 100 PRODUITS VÉGÉTAUX SÈCHES DU MARCHÉ DES CÂBLES DE COMMUNICATION SOUS-MARINS AU MEXIQUE, PAR TYPE, 2020-2029 (EN MILLIONS USD)
TABLEAU 101 PRODUITS DE PLANTES HUMIDES DU MARCHÉ DES CÂBLES DE COMMUNICATION SOUS-MARINS AU MEXIQUE, PAR TYPE, 2020-2029 (EN MILLIONS USD)
TABLEAU 102 CÂBLE ÉLECTRIQUE MEXICAIN SUR LE MARCHÉ DES SYSTÈMES DE CÂBLES SOUS-MARINS, PAR TYPE, 2020-2029 (EN MILLIONS USD)
TABLEAU 103 PRODUITS VÉGÉTAUX SÈCHES DU MARCHÉ DES CÂBLES ÉLECTRIQUES SOUS-MARINS AU MEXIQUE, PAR TYPE, 2020-2029 (EN MILLIONS USD)
TABLEAU 104 PRODUITS DE INSTALLATIONS HUMIDES DANS LE MARCHÉ DES CÂBLES ÉLECTRIQUES DES SYSTÈMES DE CÂBLES SOUS-MARINS AU MEXIQUE, PAR TYPE, 2020-2029 (EN MILLIONS USD)
Liste des figures
FIGURE 1 MARCHÉ DES SYSTÈMES DE CÂBLES SOUS-MARINS EN AMÉRIQUE DU NORD : SEGMENTATION
FIGURE 2 MARCHÉ DES SYSTÈMES DE CÂBLES SOUS-MARINS EN AMÉRIQUE DU NORD : TRIANGULATION DES DONNÉES
FIGURE 3 MARCHÉ DES SYSTÈMES DE CÂBLES SOUS-MARINS EN AMÉRIQUE DU NORD : ANALYSE DROC
FIGURE 4 MARCHÉ DES SYSTÈMES DE CÂBLES SOUS-MARINS EN AMÉRIQUE DU NORD : ANALYSE DU MARCHÉ NORD-AMÉRIQUE PAR RAPPORT AU MARCHÉ RÉGIONAL
FIGURE 5 MARCHÉ DES SYSTÈMES DE CÂBLES SOUS-MARINS EN AMÉRIQUE DU NORD : ANALYSE DE LA RECHERCHE DES ENTREPRISES
FIGURE 6 MARCHÉ DES SYSTÈMES DE CÂBLES SOUS-MARINS EN AMÉRIQUE DU NORD : DÉMOGRAPHIE DES ENTRETIENS
FIGURE 7 MARCHÉ DES SYSTÈMES DE CÂBLES SOUS-MARINS EN AMÉRIQUE DU NORD : GRILLE DE POSITIONNEMENT DU MARCHÉ DBMR
FIGURE 8 MARCHÉ DES SYSTÈMES DE CÂBLES SOUS-MARINS EN AMÉRIQUE DU NORD : ANALYSE DE LA PART DES FOURNISSEURS
FIGURE 9 MARCHÉ DES SYSTÈMES DE CÂBLES SOUS-MARINS EN AMÉRIQUE DU NORD : GRILLE DE COUVERTURE DES APPLICATIONS DU MARCHÉ
FIGURE 10 MARCHÉ DES SYSTÈMES DE CÂBLES SOUS-MARINS EN AMÉRIQUE DU NORD : SEGMENTATION
FIGURE 11 L'AUGMENTATION DES PROJETS DE COMMUNICATION SOUS-MARINS À TRAVERS LE MONDE DEVRAIT DYNAMISER LE MARCHÉ DES SYSTÈMES DE CÂBLES SOUS-MARINS EN AMÉRIQUE DU NORD AU COURS DE LA PÉRIODE DE PRÉVISION
FIGURE 12 LE SEGMENT DES PRODUITS À BASE DE PLANTES SÈCHES DEVRAIT REPRÉSENTER LA PLUS GRANDE PART DU MARCHÉ DES SYSTÈMES DE CÂBLES SOUS-MARINS EN AMÉRIQUE DU NORD DE 2022 À 2029
FIGURE 13 MOTEURS, CONTRAINTES, OPPORTUNITÉS ET DÉFIS DU MARCHÉ DES SYSTÈMES DE CÂBLES SOUS-MARINS EN AMÉRIQUE DU NORD
FIGURE 14 PROJETS D'IDE DANS LES COMMUNICATIONS ET LES MÉDIAS (2019-2020)
FIGURE 15 PRODUCTION D'ÉLECTRICITÉ ÉOLIENNE OFFSHORE
FIGURE 16 EXPANSIONS ANNUELLES NETTE DE LA CAPACITÉ ÉOLIENNE, 2018-2020
FIGURE 17 MARCHÉ DES SYSTÈMES DE CÂBLES SOUS-MARINS EN AMÉRIQUE DU NORD, PAR PRODUIT, 2021
FIGURE 18 NORTH AMERICA SUBMARINE CABLE SYSTEM MARKET, BY VOLTAGE, 2021
FIGURE 19 NORTH AMERICA SUBMARINE CABLE SYSTEM MARKET, BY OFFERING, 2021
FIGURE 20 NORTH AMERICA SUBMARINE CABLE SYSTEM MARKET, BY FIBER CLASS, 2021
FIGURE 21 NORTH AMERICA SUBMARINE CABLE SYSTEM MARKET, BY CABLES TYPE, 2021
FIGURE 22 NORTH AMERICA SUBMARINE CABLE SYSTEM MARKET, BY ARMOR TYPE, 2021
FIGURE 23 NORTH AMERICA SUBMARINE CABLE SYSTEM MARKET, BY DEPTH, 2021
FIGURE 24 NORTH AMERICA SUBMARINE CABLE SYSTEM MARKET: BY APPLICATION, 2021
FIGURE 25 NORTH AMERICA SUBMARINE CABLE SYSTEM MARKET: SNAPSHOT (2021)
FIGURE 26 NORTH AMERICA SUBMARINE CABLE SYSTEM MARKET: BY COUNTRY (2021)
FIGURE 27 NORTH AMERICA SUBMARINE CABLE SYSTEM MARKET: BY COUNTRY (2022 & 2029)
FIGURE 28 NORTH AMERICA SUBMARINE CABLE SYSTEM MARKET: BY COUNTRY (2021 & 2029)
FIGURE 29 NORTH AMERICA SUBMARINE CABLE SYSTEM MARKET: BY PRODUCT (2022-2029)
FIGURE 30 NORTH AMERICA SUBMARINE CABLE SYSTEM MARKET: COMPANY SHARE 2021 (%)
Méthodologie de recherche
La collecte de données et l'analyse de l'année de base sont effectuées à l'aide de modules de collecte de données avec des échantillons de grande taille. L'étape consiste à obtenir des informations sur le marché ou des données connexes via diverses sources et stratégies. Elle comprend l'examen et la planification à l'avance de toutes les données acquises dans le passé. Elle englobe également l'examen des incohérences d'informations observées dans différentes sources d'informations. Les données de marché sont analysées et estimées à l'aide de modèles statistiques et cohérents de marché. De plus, l'analyse des parts de marché et l'analyse des tendances clés sont les principaux facteurs de succès du rapport de marché. Pour en savoir plus, veuillez demander un appel d'analyste ou déposer votre demande.
La méthodologie de recherche clé utilisée par l'équipe de recherche DBMR est la triangulation des données qui implique l'exploration de données, l'analyse de l'impact des variables de données sur le marché et la validation primaire (expert du secteur). Les modèles de données incluent la grille de positionnement des fournisseurs, l'analyse de la chronologie du marché, l'aperçu et le guide du marché, la grille de positionnement des entreprises, l'analyse des brevets, l'analyse des prix, l'analyse des parts de marché des entreprises, les normes de mesure, l'analyse globale par rapport à l'analyse régionale et des parts des fournisseurs. Pour en savoir plus sur la méthodologie de recherche, envoyez une demande pour parler à nos experts du secteur.
Personnalisation disponible
Data Bridge Market Research est un leader de la recherche formative avancée. Nous sommes fiers de fournir à nos clients existants et nouveaux des données et des analyses qui correspondent à leurs objectifs. Le rapport peut être personnalisé pour inclure une analyse des tendances des prix des marques cibles, une compréhension du marché pour d'autres pays (demandez la liste des pays), des données sur les résultats des essais cliniques, une revue de la littérature, une analyse du marché des produits remis à neuf et de la base de produits. L'analyse du marché des concurrents cibles peut être analysée à partir d'une analyse basée sur la technologie jusqu'à des stratégies de portefeuille de marché. Nous pouvons ajouter autant de concurrents que vous le souhaitez, dans le format et le style de données que vous recherchez. Notre équipe d'analystes peut également vous fournir des données sous forme de fichiers Excel bruts, de tableaux croisés dynamiques (Fact book) ou peut vous aider à créer des présentations à partir des ensembles de données disponibles dans le rapport.

