Asia Pacific Quicklime Market
Tamanho do mercado em biliões de dólares
CAGR :
% 
 USD
2,710,039.31 Thousand
USD
3,913,074.88 Thousand
2021
2029
USD
2,710,039.31 Thousand
USD
3,913,074.88 Thousand
2021
2029
| 2022 –2029 | |
| USD 2,710,039.31 Thousand | |
| USD 3,913,074.88 Thousand | |
| % | |
|
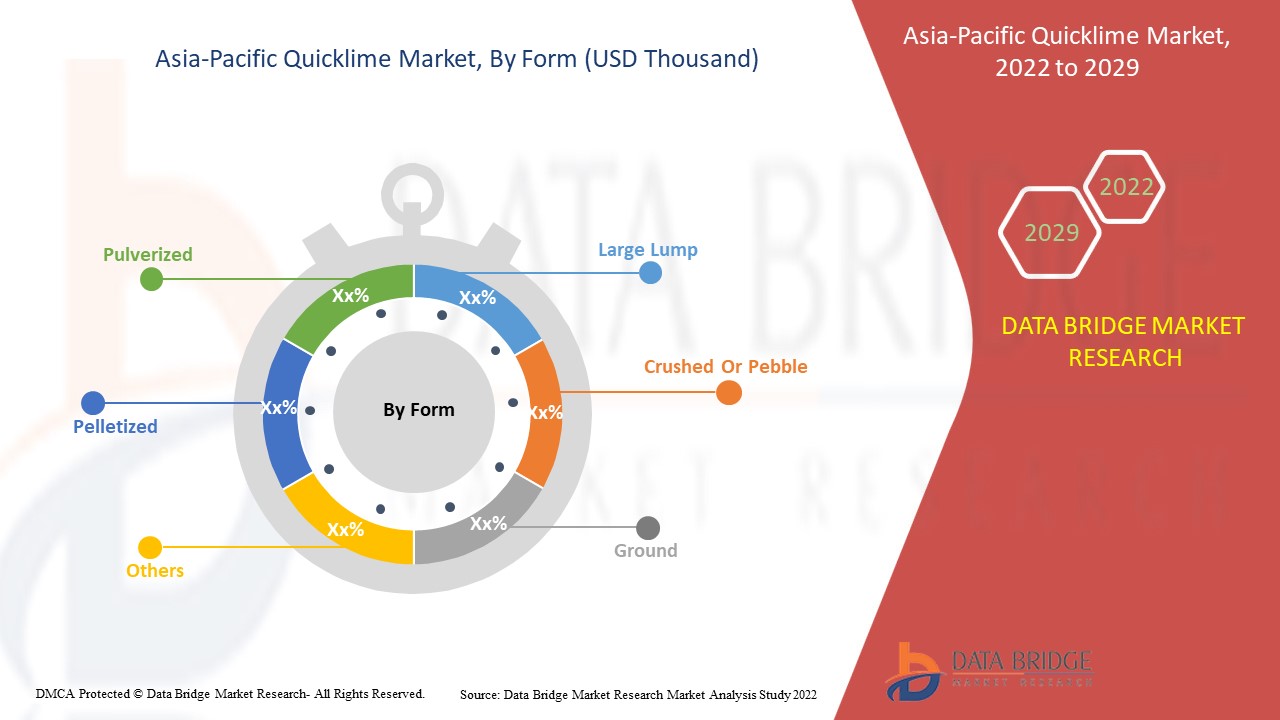
Asia-Pacific Quicklime Market, By Form (Large Lump, Crushed or Pebble, Ground, Pulverized, Pelletized and Others), Product (High Calcium, Magnesium, Dolomitic, and Others), Application (Metallurgy, Building and Construction Materials, Water Treatment, Mining, Chemicals and Others), Country (Japan, China, South Korea, India, Australia & New Zealand, Singapore, Thailand, Indonesia, Malaysia, Philippines, Rest of Asia-Pacific), Industry Trends and Forecast to 2029.
Qual é o tamanho e a taxa de crescimento do mercado de cal rápida Ásia-Pacífico
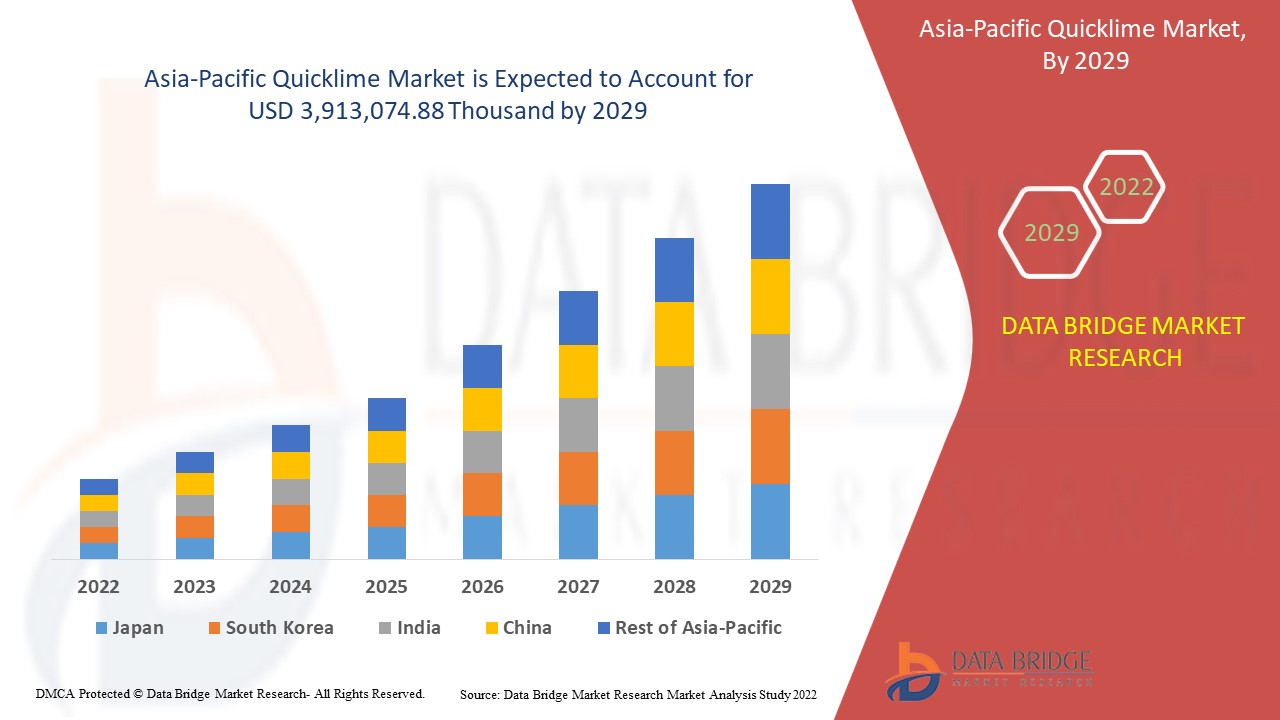
- De acordo com a Data Bridge Market Research Analysis, o mercado de cal rápida Ásia-Pacífico deverá ganhar um crescimento significativo no período de previsão de 2022 a 2029. Data Bridge Market Research analisa que o mercado está crescendo em umCAGR de 4,7%no período previsto de 2022 a 2029 e previsto para atingirUSD 3,913,074,88 mil até 2029.
- Quicklime é um sólido branco amorfo com um alto ponto de fusão de 2600 graus Celsius. Forma cal esfolada, quando interage com água. Cal rápida altacálcioe dolomítico, que são amplamente utilizados como um fluxo em aço purificador. Fornece argamassa durável e gesso e estabilização do solo. Ele também melhora a qualidade da água, especialmente para o amaciamento de água e remoção de arsênico. A cal rápida pode ser aplicada em várias aplicações, tais como materiais de construção e construção, metalurgia, produtos químicos, mineração, papel e produção de celulose, entre outros.
- Os principais motores que contribuem para o crescimento do mercado de cal rápida incluem usos crescentes de carbonato de cálcio precipitado alta adoção de cal rápida na indústria de construção e construção. As principais restrições que podem afectar o crescimento global do mercado de cal rápida são a volatilidade dos preços das matérias-primas de cal rápida e o processo complicado de produção de cal rápida.
- Várias oportunidades associadas ao mercado de cal rápida incluem o aumento da procura de ferro e aço de diferentes indústrias e o aumento das actividades mineiras. Para atender à crescente demanda por produtos de cal rápida na indústria de construção e construção e tratamento de água, algumas empresas estão expandindo suas capacidades de produção e entrando em acordo em diferentes regiões. Além disso, regulamentos governamentais rigorosos para fabricação e comercialização de cal rápida está desafiando o crescimento do mercado.
- O relatório de mercado de cal rápida Ásia-Pacífico fornece detalhes de market share, novos desenvolvimentos e análise de pipeline de produtos, impacto de jogadores de mercado nacionais e localizados, análises de oportunidades em termos de bolsas de receita emergentes, mudanças na regulamentação do mercado, aprovações de produtos, decisões estratégicas, lançamentos de produtos, expansões geográficas e inovações tecnológicas no mercado. Para entender a análise e o cenário de mercado, entre em contato conosco para um Analyst Brief, nossa equipe irá ajudá-lo a criar uma solução de impacto de receita para alcançar seu objetivo desejado.
Tamanho e previsão do mercado
- Valor de mercado Ásia-Pacífico (2021):2,710,039,31 mil dólares
- Valor de mercado previsto (2029):3.913.074.88 mil USD
- Previsões CAGR (2022-2029):4.7%
Alcance do mercado de cal rápida Ásia-Pacífico
O mercado de cal rápida Ásia-Pacífico é segmentado em três segmentos notáveis, que são baseados na forma, produto e aplicação. O crescimento entre segmentos ajuda você a analisar nichos de crescimento e estratégias para se aproximar do mercado e determinar suas áreas de aplicação principais e a diferença em seus mercados-alvo.
- Com base na forma, o mercado de cal rápida Ásia-Pacífico é segmentado em grande massa, esmagado ou seixo, moído, pulverizado, granulado, entre outros. Em 2022, espera-se que o segmento triturado ou pedregulho domine o mercado, pois é amplamente utilizado em aço e outras áreas industriais de fabricação como agente de fluxo.
- Com base no produto, o mercado de cal rápida Ásia-Pacífico é segmentado em alto cálcio, magnésio, dolomítico, entre outros. Em 2022, espera-se que o segmento de cálcio alto domine o mercado, pois é o material alcalino mais eficaz para tratamento de desinfecção e odor.
- Com base na aplicação, o mercado de cal rápida Ásia-Pacífico é segmentado em metalurgia, materiais de construção e construção, tratamento de água, mineração, produtos químicos, entre outros. Em 2022, espera-se que o segmento de materiais de construção e construção domine no mercado de cal rápida Ásia-Pacífico, pois é um ingrediente importante na fabricação de cimento.
Análise do nível do mercado de cal rápida Ásia-Pacífico
O mercado de cal rápida Ásia-Pacífico é segmentado em três segmentos notáveis que são baseados na forma, produto e aplicação.
- Os países abrangidos pelo relatório de mercado de cal rápida Ásia-Pacífico são o Japão, China, Índia, Coreia do Sul, Austrália e Nova Zelândia, Singapura, Malásia, Tailândia, Indonésia, Filipinas e Resto da Ásia-Pacífico. A China está liderando o crescimento do mercado Ásia-Pacífico devido à produção fácil e avançada da cal rápida com material de alta qualidade no país.
- A secção «país» do relatório também fornece factores de impacto individuais no mercado e alterações na regulamentação no mercado nacional que afectam as tendências actuais e futuras do mercado. Os pontos de dados, tais como novas vendas, vendas de substituição, dados demográficos dos países, actos regulamentares e tarifas de importação-exportação, são alguns dos principais indicadores utilizados para prever o cenário de mercado para cada país. Além disso, a presença e disponibilidade de marcas da Ásia-Pacífico e seus desafios enfrentados devido à grande ou escassa concorrência de marcas locais e nacionais, o impacto dos canais de vendas são considerados ao fornecer a análise de previsão dos dados do país.
Uso crescente de carbonato de cálcio precipitado
- Quicklime é usado como enchimento em adesivos e selantes em várias indústrias. Além disso, a cal rápida é utilizada principalmente como principal aditivo reológico na fabricação de produtos industriais de alto desempenho. Cal rápida na forma de carbonato de cálcio precipitado também é usado como cálcio na dieta e é usado principalmente para produtos líquidos onde o tamanho de partículas muito pequeno é importante. Muitos medicamentos eCosméticoscontém carbonato de cálcio precipitado como material de base paraComprimidosou preenchendo produtos químicos, pomadas e cremes.
- Quicklime é comumente usado em tintas e tintas como um agente de volume para aumentar a capacidade e porosidade dos tetos secos. É usado como um enchimento fino e altamente consistentemente controlado e ajuda a controlar as características de fluxo e forma de componentes finos. A Quicklime também pode ser fornecida revestida com aditivos para melhorar o brilho e apoiar a adesão na indústria do papel.
- Além disso, o carbonato de cálcio precipitado utilizado como cal rápida torna os produtos mais fortes e é extraído decalcário, que é usado em diferentes revestimentos. Por esta razão, espera-se que o uso crescente de carbonato de cálcio precipitado funcione como um mergulhador para o mercado de cal rápida Ásia-Pacífico.
Paisagem competitiva e análise de market share de fio magnético
A paisagem competitiva do mercado de cal rápida Ásia-Pacífico fornece detalhes pelo concorrente. Detalhes incluídos são visão geral da empresa, finanças da empresa, receita gerada, potencial de mercado, investimento em pesquisa e desenvolvimento, novas iniciativas de mercado, presença Ásia-Pacífico, locais de produção e instalações, pontos fortes e fracos da empresa, lançamento de produtos, ensaios clínicos pipelines, análise de marca, aprovação de produtos, patentes, largura do produto e respiração, dominância de aplicação, curva de linha de vida de tecnologia. Os pontos de dados acima fornecidos estão relacionados apenas com o foco da empresa relacionado ao mercado de materiais anodos da próxima geração Ásia-Pacífico.
Alguns dos principais operadores de mercado envolvidos no mercado de cal rápida Ásia-Pacífico sãoCARMEUS, Graymont Limited, Cheney Lime & Cement Company,Grupo Lhoist, Mississippi Lime Company, Linwood Mining & Minerals Corporation,SMA Mineral AB, Pete Lien & Sons, Inc., Adelaide Brighton Cement Ltd., Boral, Nordkalk Corporation, Estados Unidos Lime & Minerals, Inc., Cape Lime, Saudi Lime Industries Co., Emirates Lime Factory, Super Cement Manufacturing Company LLC, Valley Minerals LLC, CMI Company, Märker Gruppe, Kalkfabrik Netstal, Brenntag, Yoshizawa Lime Industry CO., LTD., e Austin White Lime Company, Ltd. estão entre outros.
Por exemplo,
- Em julho de 2021, Lhoist North America e Maerz Ofenbau AG iniciaram um novo forno de cal em Montevallo, EUA. Lhoist América do Norte expandiu sua produção dolomita de cal rápida em Marble Falls, Texas, bem como um novo forno de cal em sua instalação New Braunfels, Texas. Com esta expansão, a empresa pode explorar as áreas de mercado inexploradas.
- Em junho de 2014, a Graymont Limited anunciou que celebraram um acordo com a Holcim para adquirir os ativos da Taylor’s Lime da empresa. Esta aquisição reflecte a confiança da Graymont nas perspectivas de crescimento a longo prazo da economia da Nova Zelândia e da região. Esta aquisição está sujeita à obtenção de todas as aprovações regulatórias habituais. O mercado Asia-Pacificquicklime é segmentado em três segmentos notáveis com base na forma, produto e aplicação.
SKU-
Obtenha acesso online ao relatório sobre a primeira nuvem de inteligência de mercado do mundo

- Painel interativo de análise de dados
- Painel de análise da empresa para oportunidades de elevado potencial de crescimento
- Acesso de analista de pesquisa para personalização e customização. consultas
- Análise da concorrência com painel interativo
- Últimas notícias, atualizações e atualizações Análise de tendências
- Aproveite o poder da análise de benchmark para um rastreio abrangente da concorrência
Índice
1 INTRODUÇÃO
1.1 OBJETIVOS DO ESTUDO
1.2 DEFINIÇÃO DE MERCADO
1.3 VISÃO GERAL DO MERCADO DE CAL VIVEIRA DA ÁSIA-PACÍFICO
1.4 LIMITAÇÃO
1,5 MERCADOS COBERTOS
2 SEGMENTAÇÃO DE MERCADO
2.1 MERCADOS COBERTOS
2.2 ÂMBITO GEOGRÁFICO
2,3 ANOS CONSIDERADOS PARA O ESTUDO
2.4 MOEDA E PREÇOS
2.5 MODELO DE VALIDAÇÃO DE DADOS TRIPÉ DBMR
2.6 CURVA DA LINHA DE VIDA DO PRODUTO
2.7 MODELAGEM MULTIVARIADA
2.8 ENTREVISTAS PRINCIPAIS COM PRINCIPAIS LÍDERES DE OPINIÃO
2.9 GRADE DE POSIÇÃO DE MERCADO DBMR
2.1 GRADE DE COBERTURA DE APLICAÇÃO DE MERCADO
2.11 MATRIZ DE DESAFIOS DO MERCADO DBMR
2.12 ANÁLISE DA PARTICIPAÇÃO DO FORNECEDOR
2.13 DADOS DE IMPORTAÇÃO E EXPORTAÇÃO
2.14 FONTES SECUNDÁRIAS
2.15 PREMISSAS
3 RESUMO EXECUTIVO
4 INSIGHTS PREMIUM
4.1 ANÁLISE DA CADEIA DE SUPRIMENTOS
4.1.1 VISÃO GERAL
4.1.2 CENÁRIO DE CUSTOS LOGÍSTICOS
4.1.3 IMPORTÂNCIA DOS PRESTADORES DE SERVIÇOS LOGÍSTICOS
4.2 CENÁRIO DE MUDANÇAS CLIMÁTICAS
4.2.1 PREOCUPAÇÕES AMBIENTAIS
4.2.2 RESPOSTA DA INDÚSTRIA
4.2.3 PAPEL DO GOVERNO
4.2.4 RECOMENDAÇÃO DO ANALISTA
4.3 CENÁRIO DE IMPORTAÇÃO E EXPORTAÇÃO
4.4 LISTA DE COMPRADORES
4.5 CRITÉRIOS DE SELEÇÃO DE FORNECEDORES
4.6 COBERTURA REGULAMENTAR
4.7 AS CINCO FORÇAS DE PORTER:
4.7.1 AMEAÇA DE NOVOS ENTRADANTES:
4.7.2 AMEAÇA DE SUBSTITUTOS:
4.7.3 PODER DE BARGANHA DO CLIENTE:
4.7.4 PODER DE NEGOCIAÇÃO DO FORNECEDOR:
4.7.5 RIVALIDADE INDUSTRIAL:
4.8 ANÁLISE PESTLE
4.8.1 FATORES POLÍTICOS:
4.8.2 FATORES ECONÔMICOS:
4.8.3 FATORES SOCIAIS:
4.8.4 FATORES TECNOLÓGICOS:
4.8.5 FATORES LEGAIS:
4.8.6 FATORES AMBIENTAIS:
4.9 ANÁLISE DE PRODUÇÃO E CONSUMO
4.1 AVANÇOS TECNOLÓGICOS DOS FABRICANTES
4.11 COBERTURA DE PRODUÇÃO DE MATÉRIA-PRIMA
4.12 ANÁLISE DE PREÇOS
5 RESUMO REGIONAL
5.1 ÁSIA-PACÍFICO
5.2 ÁSIA-PACÍFICO
5.3 AMÉRICA DO NORTE
5.4 EUROPA
5.5 AMÉRICA DO SUL
5.6 ORIENTE MÉDIO E ÁFRICA
6 VISÃO GERAL DO MERCADO
6.1 MOTORISTAS
6.1.1 USO CRESCENTE DE CARBONATO DE CÁLCIO PRECIPITADO
6.1.2 AUMENTO DAS ATIVIDADES DE MINERAÇÃO
6.1.3 AUMENTO DA DEMANDA DE FERRO E AÇO DE DIFERENTES INDÚSTRIAS
6.1.4 ALTA ADOÇÃO DE CAL VIVENTE NA INDÚSTRIA DA CONSTRUÇÃO CIVIL
6.2 RESTRIÇÕES
6.2.1 VOLATILIDADE NOS PREÇOS DAS MATÉRIAS-PRIMAS DE CAL VIVENTE
6.2.2 PROCESSO COMPLICADO DE PRODUÇÃO DE CAL VIVENTE
6.3 OPORTUNIDADES
6.3.1 RÁPIDO DESENVOLVIMENTO EM PROCESSOS DE TRATAMENTO DE ÁGUA
6.3.2 AUMENTO DAS ATIVIDADES DE CONSTRUÇÃO NOS PAÍSES EMERGENTES
6.3.3 CRESCENTE PRODUÇÃO DE MÁQUINAS INDUSTRIAIS
6.4 DESAFIOS
6.4.1 REGULAMENTOS GOVERNAMENTAIS RIGOROSOS PARA A FABRICAÇÃO E COMERCIALIZAÇÃO DE CAL VIVENTE
6.4.2 IMPORTÂNCIA CRESCENTE DE ALTERNATIVAS À CAL VIVENTE, COMO O CALCÁRIO E O HIDRÓXIDO DE MAGNÉSIO
7 ANÁLISE DO IMPACTO DA COVID-19 NO MERCADO DE CAL VIVENTE DA ÁSIA-PACÍFICO
7.1 CONSEQUÊNCIAS DA COVID-19 E AS INICIATIVAS DO GOVERNO PARA IMPULSIONAR O MERCADO
7.2 DECISÕES ESTRATÉGICAS DOS FABRICANTES APÓS A COVID-19 PARA OBTER PARTICIPAÇÃO COMPETITIVA NO MERCADO
7.3 IMPACTO NO PREÇO
7.4 IMPACTO NA DEMANDA
7.5 IMPACTO NA CADEIA DE SUPRIMENTOS
7.6 CONCLUSÃO
8 MERCADO DE CAL VIVEIRA DA ÁSIA-PACÍFICO, POR PRODUTO
8.1 VISÃO GERAL
8.2 ALTO TEOR DE CÁLCIO
8.3 MAGNÉSIO
8.4 DOLOMÍTICO
8.5 OUTROS
9 MERCADO DE CAL VIVEIRA DA ÁSIA-PACÍFICO, POR FORMULÁRIO
9.1 VISÃO GERAL
9.2 BRILHADO OU PEIXE
9.3 GRANDE PEDAÇO
9.4 TERRA
9,5 PULVERIZADO
9.6 PELETIZADO
9.7 OUTROS
10 MERCADO DE CAL VIVEIRA DA ÁSIA-PACÍFICO, POR APLICAÇÃO
10.1 VISÃO GERAL
10.2 MATERIAIS DE CONSTRUÇÃO E CONSTRUÇÃO
10.2.1 MATERIAIS DE CONSTRUÇÃO E CONSTRUÇÃO, POR PRODUTO
10.2.1.1 ALTO TEOR DE CÁLCIO
10.2.1.2 MAGNÉSIO
10.2.1.3 DOLOMÍTICO
10.2.1.4 OUTROS
10.3 QUÍMICA
10.3.1 SUBPRODUTO QUÍMICO
10.3.1.1 ALTO TEOR DE CÁLCIO
10.3.1.2 MAGNÉSIO
10.3.1.3 DOLOMÍTICO
10.3.1.4 OUTROS
10.4 TRATAMENTO DE ÁGUA
10.4.1 TRATAMENTO DE ÁGUA, SUBPRODUTO
10.4.1.1 ALTO TEOR DE CÁLCIO
10.4.1.2 MAGNÉSIO
10.4.1.3 DOLOMÍTICO
10.4.1.4 OUTROS
10.5 METALÚRGICA
10.5.1 METALÚRGICO, SUBPRODUTO
10.5.1.1 ALTO TEOR DE CÁLCIO
10.5.1.2 MAGNÉSIO
10.5.1.3 DOLOMÍTICO
10.5.1.4 OUTROS
10.6 MINERAÇÃO
10.6.1 MINERAÇÃO, SUBPRODUTO
10.6.1.1 ALTO TEOR DE CÁLCIO
10.6.1.2 MAGNÉSIO
10.6.1.3 DOLOMÍTICO
10.6.1.4 OUTROS
10.7 OUTROS
10.7.1 OUTROS, POR PRODUTO
10.7.1.1 ALTO TEOR DE CÁLCIO
10.7.1.2 MAGNÉSIO
10.7.1.3 DOLOMÍTICO
10.7.1.4 OUTROS
11 MERCADO DE CAL VIVEIRA DA ÁSIA-PACÍFICO, POR REGIÃO
11.1 ÁSIA-PACÍFICO
11.1.1 CHINA
11.1.2 ÍNDIA
11.1.3 JAPÃO
11.1.4 COREIA DO SUL
11.1.5 SINGAPURA
11.1.6 TAILÂNDIA
11.1.7 INDONÉSIA
11.1.8 AUSTRÁLIA E NOVA ZELÂNDIA
11.1.9 FILIPINAS
11.1.10 MALÁSIA
11.1.11 RESTANTE DA ÁSIA-PACÍFICO
12 MERCADO DE CAL VIVEIRA DA ÁSIA-PACÍFICO: PANORAMA DA EMPRESA
12.1 ANÁLISE DE AÇÕES DA EMPRESA: ÁSIA-PACÍFICO
12.2 FUSÕES E AQUISIÇÕES
12.3 EXPANSÕES
13 ANÁLISE SWOT
14 PERFIL DA EMPRESA
14.1 BORAL
14.1.1 RESUMO DA EMPRESA
14.1.2 ANÁLISE DE RECEITA
14.1.3 PORTFÓLIO DE PRODUTOS
14.1.4 ATUALIZAÇÃO RECENTE
14.2 BRENNTAG SE
14.2.1 RESUMO DA EMPRESA
14.2.2 ANÁLISE DE RECEITA
14.2.3 PORTFÓLIO DE PRODUTOS
14.2.4 ATUALIZAÇÕES RECENTES
14.3 GRUPO LHOIST
14.3.1 RESUMO DA EMPRESA
14.3.2 PORTFÓLIO DE PRODUTOS
14.3.3 ATUALIZAÇÕES RECENTES
14.4 ADELAIDE BRIGHTON CEMENT LTD. (UMA SUBSIDIÁRIA DO GRUPO DE EMPRESAS ADBRI LTD)
14.4.1 RESUMO DA EMPRESA
14.4.2 ANÁLISE DE RECEITA
14.4.3 PORTFÓLIO DE PRODUTOS
14.4.4 ATUALIZAÇÃO RECENTE
14.5 CARMEUSE
14.5.1 COMPANY SNAPSHOT
14.5.2 PRODUCT PORTFOLIO
14.5.3 RECENT UPDATE
14.6 GRAYMONT LIMITED
14.6.1 COMPANY SNAPSHOT
14.6.2 PRODUCT PORTFOLIO
14.6.3 RECENT UPDATE
14.7 NORDKALK CORPORATION
14.7.1 COMPANY SNAPSHOT
14.7.2 PRODUCT PORTFOLIO
14.7.3 RECENT UPDATES
14.8 MISSISSIPPI LIME COMPANY
14.8.1 COMPANY SNAPSHOT
14.8.2 PRODUCT PORTFOLIO
14.8.3 RECENT UPDATE
14.9 YOSHIZAWA LIME FACTORY CO LTD
14.9.1 COMPANY SNAPSHOT
14.9.2 PRODUCT PORTFOLIO
14.9.3 RECENT UPDATE
14.1 AUSTIN WHITE LIME COMPANY, LTD
14.10.1 COMPANY SNAPSHOT
14.10.2 PRODUCT PORTFOLIO
14.10.3 RECENT UPDATE
14.11 CAPE LIME (A SUBSIDIARY OF AFRIMAT)
14.11.1 COMPANY SNAPSHOT
14.11.2 REVENUE ANALYSIS
14.11.3 PRODUCT PORTFOLIO
14.11.4 RECENT UPDATE
14.12 CHENEY LIME & CEMENT COMPANY
14.12.1 COMPANY SNAPSHOT
14.12.2 PRODUCT PORTFOLIO
14.12.3 RECENT UPDATE
14.13 CMI COMPANY
14.13.1 COMPANY SNAPSHOT
14.13.2 PRODUCT PORTFOLIO
14.13.3 RECENT UPDATE
14.14 EMIRATES LIME FACTORY
14.14.1 COMPANY SNAPSHOT
14.14.2 PRODUCT PORTFOLIO
14.14.3 RECENT UPDATE
14.15 KALKFABRIK NETSTAL
14.15.1 COMPANY SNAPSHOT
14.15.2 PRODUCT PORTFOLIO
14.15.3 RECENT UPDATE
14.16 LINWOOD MINING & MINERALS CORPORATION
14.16.1 COMPANY SNAPSHOT
14.16.2 PRODUCT PORTFOLIO
14.16.3 RECENT UPDATE
14.17 MARKER GRUPPE
14.17.1 COMPANY SNAPSHOT
14.17.2 PRODUCT PORTFOLIO
14.17.3 RECENT UPDATE
14.18 PETE LIEN & SONS, INC.
14.18.1 COMPANY SNAPSHOT
14.18.2 PRODUCT PORTFOLIO
14.18.3 RECENT UPDATE
14.19 SAUDI LIME INDUSTRIES CO.
14.19.1 COMPANY SNAPSHOT
14.19.2 PRODUCT PORTFOLIO
14.19.3 RECENT UPDATE
14.2 SMA MINERAL AB
14.20.1 COMPANY SNAPSHOT
14.20.2 PRODUCT PORTFOLIO
14.20.3 RECENT UPDATE
14.21 SUPER CEMENT MANUFACTURING CO. LLC (SCMC)
14.21.1 COMPANY SNAPSHOT
14.21.2 PRODUCT PORTFOLIO
14.21.3 RECENT UPDATE
14.22 UNITED STATES LIME & MINERAL, INC.
14.22.1 COMPANY SNAPSHOT
14.22.2 REVENUE ANALYSIS
14.22.3 PRODUCT PORTFOLIO
14.22.4 RECENT UPDATE
14.23 VALLEY MINERALS LLC
14.23.1 COMPANY SNAPSHOT
14.23.2 PRODUCT PORTFOLIO
14.23.3 RECENT UPDATE
15 QUESTIONNAIRE
16 RELATED REPORTS
Lista de Tabela
TABELA 1 DADOS DE IMPORTAÇÃO DO CÓDIGO QUICKLIMEHS - 252210 (USD MIL)
TABELA 2 DADOS DE EXPORTAÇÃO DE CAL VIVELA.; CÓDIGO SH - 252210 (USD MIL)
TABELA 3 QUADRO REGULAMENTAR
TABELA 4 PREÇO MÉDIO DOS PRODUTOS DE CAL VIVEIRA
TABELA 5 MERCADO DE CAL VIVOS DA ÁSIA-PACÍFICO, POR PRODUTO, 2020-2029 (MIL USD)
TABELA 6 MERCADO DE CAL VIVENTE DA ÁSIA-PACÍFICO, POR PRODUTO, 2020-2029 (TONELADAS)
TABELA 7 MERCADO DE CAL VIVEIRA NA ÁSIA-PACÍFICO COM ALTO TEOR DE CÁLCIO, POR REGIÃO, 2020-2029 (MIL USD)
TABELA 8 MERCADO DE CAL VIVEIRA NA ÁSIA-PACÍFICO COM ALTO TEOR DE CÁLCIO, POR REGIÃO, 2020-2029 (TONELADAS)
TABELA 9 MAGNÉSIO NO MERCADO DE CAL VIVEIRA DA ÁSIA-PACÍFICO, POR REGIÃO, 2020-2029 (MIL USD)
TABELA 10 MAGNÉSIO NO MERCADO DE CAL VIVEIRA DA ÁSIA-PACÍFICO, POR REGIÃO, 2020-2029 (TONELADAS)
TABELA 11 MERCADO DE CAL VIVEIRA DOLOMÍTICA DA ÁSIA-PACÍFICO, POR REGIÃO, 2020-2029 (MIL USD)
TABELA 12 MERCADO DE CAL VIVEIRA DOLOMÍTICA DA ÁSIA-PACÍFICO, POR REGIÃO, 2020-2029 (TONELADAS)
TABELA 13 OUTROS NO MERCADO DE CAL VIVEIRA DA ÁSIA-PACÍFICO, POR REGIÃO, 2020-2029 (MIL USD)
TABELA 14 OUTROS PRODUTOS NO MERCADO DE CAL VIVEIRA DA ÁSIA-PACÍFICO, POR REGIÃO, 2020-2029 (TONELADAS)
TABELA 15 MERCADO DE CAL VIVEIRA DA ÁSIA-PACÍFICO, POR FORMA, 2020-2029 (MIL USD)
TABELA 16 MERCADO DE CAL VIVENTE DA ÁSIA-PACÍFICO, POR FORMA, 2020-2029 (TONELADAS)
TABELA 17 MERCADO DE CAL VIVEIRA OU BRITADA DA ÁSIA-PACÍFICO, POR REGIÃO, 2020-2029 (MIL USD)
TABELA 18 MERCADO DE CAL VIVEIRA EM GRANDES TORRES DA ÁSIA-PACÍFICO, POR REGIÃO, 2020-2029 (MIL USD)
TABELA 19 TERRENO DA ÁSIA-PACÍFICO NO MERCADO DE CAL VIVEIRA, POR REGIÃO, 2020-2029 (MIL USD)
TABELA 20 ÁSIA-PACÍFICO PULVERIZADA NO MERCADO DE CAL VIVEIRA, POR REGIÃO, 2020-2029 (MIL USD)
TABELA 21 ÁSIA-PACÍFICO PELETIZADA NO MERCADO DE CAL VIVEIRA, POR REGIÃO, 2020-2029 (MIL USD)
TABELA 22 OUTROS NO MERCADO DE CAL VIVEIRA DA ÁSIA-PACÍFICO, POR REGIÃO, 2020-2029 (MIL USD)
TABELA 23 MERCADO DE CAL VIVINA DA ÁSIA-PACÍFICO, POR APLICAÇÃO, 2020-2029 (MIL USD)
TABELA 24 MERCADO DE CAL VIVENTE DA ÁSIA-PACÍFICO, POR APLICAÇÃO, 2020-2029 (TONELADAS)
TABELA 25 MATERIAIS DE CONSTRUÇÃO DA ÁSIA-PACÍFICO NO MERCADO DE CAL VIVEIRA, POR REGIÃO, 2020-2029 (MIL USD)
TABELA 26 MATERIAIS DE CONSTRUÇÃO DA ÁSIA-PACÍFICO NO MERCADO DE CAL VIVEIRA, POR PRODUTO, 2020-2029 (MIL USD)
TABELA 27 PRODUTOS QUÍMICOS DA ÁSIA-PACÍFICO NO MERCADO DE CAL VIVEIRA, POR REGIÃO, 2020-2029 (MIL USD)
TABELA 28 PRODUTOS QUÍMICOS DA ÁSIA-PACÍFICO NO MERCADO DE CAL VIVEIRA, POR PRODUTO, 2020-2029 (MIL USD)
TABELA 29 TRATAMENTO DE ÁGUA NA ÁSIA-PACÍFICO NO MERCADO DE CAL VIVEIRA, POR REGIÃO, 2020-2029 (MIL USD)
TABELA 30 TRATAMENTO DE ÁGUA NA ÁSIA-PACÍFICO NO MERCADO DE CAL VIVEIRA, POR PRODUTO, 2020-2029 (MIL USD)
TABELA 31 MERCADO DE CAL VIVEIRA NA ÁSIA-PACÍFICO, POR REGIÃO, 2020-2029 (MIL USD)
TABELA 32 MERCADO DE CAL VIVEIRA NA ÁSIA-PACÍFICO, POR PRODUTO, 2020-2029 (MIL USD)
TABELA 33 MINERAÇÃO NA ÁSIA-PACÍFICO NO MERCADO DE CAL VIVEIRA, POR REGIÃO, 2020-2029 (MIL USD)
TABELA 34 MINERAÇÃO NA ÁSIA-PACÍFICO NO MERCADO DE CAL VIVEIRA, POR PRODUTO, 2020-2029 (MIL USD)
TABELA 35 OUTROS PRODUTOS NO MERCADO DE CAL VIVEIRA DA ÁSIA-PACÍFICO, POR REGIÃO, 2020-2029 (MIL USD)
TABELA 36 OUTROS NO MERCADO DE CAL VIVEIRA DA ÁSIA-PACÍFICO, POR PRODUTO, 2020-2029 (MIL USD)
TABELA 37 MERCADO DE CAL VIVEIRA DA ÁSIA-PACÍFICO, POR PAÍS, 2020-2029 (MIL USD)
TABELA 38 MERCADO DE CAL VIVENTE DA ÁSIA-PACÍFICO, POR PAÍS, 2020-2029 (TONELADAS)
TABELA 39 MERCADO DE CAL VIVEIRA DA ÁSIA-PACÍFICO, POR PRODUTO, 2020-2029 (MIL USD)
TABELA 40 MERCADO DE CAL VIVOS DA ÁSIA-PACÍFICO, POR PRODUTO, 2020-2029 (TONELADAS)
TABELA 41 MERCADO DE CAL VIVEIRA DA ÁSIA-PACÍFICO, POR FORMA, 2020-2029 (MIL USD)
TABELA 42 MERCADO DE CAL VIVEIRA DA ÁSIA-PACÍFICO, POR FORMA, 2020-2029 (TONELADAS)
TABELA 43 MERCADO DE CAL VIVEIRA DA ÁSIA-PACÍFICO, POR APLICAÇÃO, 2020-2029 (MIL USD)
TABELA 44 MERCADO DE CAL VIVENTE DA ÁSIA-PACÍFICO, POR APLICAÇÃO, 2020-2029 (TONELADAS)
TABELA 45 MATERIAIS DE CONSTRUÇÃO DA ÁSIA-PACÍFICO NO MERCADO DE CAL VIVEIRA, POR PRODUTO, 2020-2029 (MIL USD)
TABELA 46 PRODUTOS QUÍMICOS DA ÁSIA-PACÍFICO NO MERCADO DE CAL VIVEIRA, POR PRODUTO, 2020-2029 (MIL USD)
TABELA 47 TRATAMENTO DE ÁGUA NA ÁSIA-PACÍFICO NO MERCADO DE CAL VIVEIRA, POR PRODUTO, 2020-2029 (MIL USD)
TABELA 48 MERCADO DE CAL VIVEIRA METALÚRGICA DA ÁSIA-PACÍFICO, POR PRODUTO, 2020-2029 (MIL USD)
TABELA 49 MINERAÇÃO NA ÁSIA-PACÍFICO NO MERCADO DE CAL VIVEIRA, POR PRODUTO, 2020-2029 (MIL USD)
TABELA 50 OUTROS PRODUTOS DA ÁSIA-PACÍFICO NO MERCADO DE CAL VIVEIRA, POR PRODUTO, 2020-2029 (MIL USD)
TABELA 51 MERCADO DE CAL VIVEIRA DA CHINA, POR PRODUTO, 2020-2029 (MIL USD)
TABELA 52 MERCADO DE CAL VIVENTE DA CHINA, POR PRODUTO, 2020-2029 (TONELADAS)
TABELA 53 MERCADO DE CAL VIVEIRA DA CHINA, POR FORMA, 2020-2029 (MIL USD)
TABELA 54 MERCADO DE CAL VIVEIRA DA CHINA, POR FORMA, 2020-2029 (TONELADAS)
TABELA 55 MERCADO DE CAL VIVEIRA DA CHINA, POR APLICAÇÃO, 2020-2029 (MIL USD)
TABELA 56 MERCADO DE CAL VIVENTE DA CHINA, POR APLICAÇÃO, 2020-2029 (TONELADAS)
TABELA 57 MATERIAIS DE CONSTRUÇÃO DA CHINA NO MERCADO DE CAL VIVEIRA, POR PRODUTO, 2020-2029 (MIL USD)
TABELA 58 PRODUTOS QUÍMICOS DA CHINA NO MERCADO DE CAL VIVEIRA, POR PRODUTO, 2020-2029 (MIL USD)
TABELA 59 TRATAMENTO DE ÁGUA NA CHINA NO MERCADO DE CAL VIVEIRA, POR PRODUTO, 2020-2029 (MIL USD)
TABELA 60 MERCADO METALÚRGICO DE CAL VIVEIRA DA CHINA, POR PRODUTO, 2020-2029 (MIL USD)
TABELA 61 MINERAÇÃO DA CHINA NO MERCADO DE CAL VIVEIRA, POR PRODUTO, 2020-2029 (MIL USD)
TABELA 62 CHINA OUTROS NO MERCADO DE CAL VIVEIRA, POR PRODUTO, 2020-2029 (MIL USD)
TABELA 63 MERCADO DE CAL VIVEIRA DA ÍNDIA, POR PRODUTO, 2020-2029 (MIL USD)
TABELA 64 MERCADO DE CAL VIVEIRA DA ÍNDIA, POR PRODUTO, 2020-2029 (TONELADAS)
TABELA 65 MERCADO DE CAL VIVEIRA DA ÍNDIA, POR FORMA, 2020-2029 (MIL USD)
TABELA 66 MERCADO DE CAL VIVEIRA DA ÍNDIA, POR FORMA, 2020-2029 (TONELADAS)
TABELA 67 MERCADO DE CAL VIVEIRA DA ÍNDIA, POR APLICAÇÃO, 2020-2029 (MIL USD)
TABELA 68 MERCADO DE CAL VIVEIRA DA ÍNDIA, POR APLICAÇÃO, 2020-2029 (TONELADAS)
TABELA 69 MATERIAIS DE CONSTRUÇÃO E CONSTRUÇÃO DA ÍNDIA NO MERCADO DE CAL VIVOS, POR PRODUTO, 2020-2029 (MIL USD)
TABELA 70 MERCADO DE PRODUTOS QUÍMICOS DA ÍNDIA NO MERCADO DE CAL VIVO, POR PRODUTO, 2020-2029 (MIL USD)
TABELA 71 TRATAMENTO DE ÁGUA NA ÍNDIA NO MERCADO DE CAL VIVENTE, POR PRODUTO, 2020-2029 (MIL USD)
TABELA 72 MERCADO METALÚRGICO DE CAL VIVEIRA DA ÍNDIA, POR PRODUTO, 2020-2029 (MIL USD)
TABELA 73 MINERAÇÃO NA ÍNDIA NO MERCADO DE CAL VIVENTE, POR PRODUTO, 2020-2029 (MIL USD)
TABELA 74 ÍNDIA OUTROS NO MERCADO DE CAL VIVEIRA, POR PRODUTO, 2020-2029 (MIL USD)
TABELA 75 MERCADO DE CAL VIVEIRA DO JAPÃO, POR PRODUTO, 2020-2029 (MIL USD)
TABELA 76 MERCADO DE CAL VIVINA DO JAPÃO, POR PRODUTO, 2020-2029 (TONELADAS)
TABELA 77 MERCADO DE CAL VIVEIRA DO JAPÃO, POR FORMA, 2020-2029 (MIL USD)
TABELA 78 MERCADO DE CAL VIVINA DO JAPÃO, POR FORMA, 2020-2029 (TONELADAS)
TABELA 79 MERCADO DE CAL VIVINA DO JAPÃO, POR APLICAÇÃO, 2020-2029 (MIL USD)
TABELA 80 MERCADO DE CAL VIVEIRA DO JAPÃO, POR APLICAÇÃO, 2020-2029 (TONELADAS)
TABELA 81 MATERIAIS DE CONSTRUÇÃO DO JAPÃO NO MERCADO DE CAL VIVEIRA, POR PRODUTO, 2020-2029 (MIL USD)
TABELA 82 PRODUTOS QUÍMICOS DO JAPÃO NO MERCADO DE CAL VIVEIRA, POR PRODUTO, 2020-2029 (MIL USD)
TABELA 83 TRATAMENTO DE ÁGUA NO JAPÃO NO MERCADO DE CAL VIVEIRA, POR PRODUTO, 2020-2029 (MIL USD)
TABELA 84 MERCADO METALÚRGICO DE CAL VIVEIRA NO JAPÃO, POR PRODUTO, 2020-2029 (MIL USD)
TABELA 85 MINERAÇÃO NO JAPÃO NO MERCADO DE CAL VIVENTE, POR PRODUTO, 2020-2029 (MIL USD)
TABELA 86 JAPÃO OUTROS NO MERCADO DE CAL VIVEIRA, POR PRODUTO, 2020-2029 (MIL USD)
TABELA 87 MERCADO DE CAL VIVEIRA DA COREIA DO SUL, POR PRODUTO, 2020-2029 (MIL USD)
TABELA 88 MERCADO DE CAL VIVEIRA DA COREIA DO SUL, POR PRODUTO, 2020-2029 (TONELADAS)
TABELA 89 MERCADO DE CAL VIVEIRA DA COREIA DO SUL, POR FORMA, 2020-2029 (MIL USD)
TABELA 90 MERCADO DE CAL VIVOS DA COREIA DO SUL, POR FORMA, 2020-2029 (TONELADAS)
TABELA 91 MERCADO DE CAL VIVEIRA DA COREIA DO SUL, POR APLICAÇÃO, 2020-2029 (MIL USD)
TABELA 92 MERCADO DE CAL VIVEIRA DA COREIA DO SUL, POR APLICAÇÃO, 2020-2029 (TONELADAS)
TABELA 93 MATERIAIS DE CONSTRUÇÃO E EDIFICAÇÃO DA COREIA DO SUL NO MERCADO DE CAL VIVEIRA, POR PRODUTO, 2020-2029 (MIL USD)
TABELA 94 MERCADO DE PRODUTOS QUÍMICOS DA COREIA DO SUL NO MERCADO DE CAL VIVEIRA, POR PRODUTO, 2020-2029 (MIL USD)
TABELA 95 TRATAMENTO DE ÁGUA NO MERCADO DE CAL VIVEIRA DA COREIA DO SUL, POR PRODUTO, 2020-2029 (MIL USD)
TABELA 96 MERCADO DE METALÚRGICA DE CAL VIVEIRA DA COREIA DO SUL, POR PRODUTO, 2020-2029 (MIL USD)
TABELA 97 MINERAÇÃO DA COREIA DO SUL NO MERCADO DE CAL VIVEIRA, POR PRODUTO, 2020-2029 (MIL USD)
TABELA 98 COREIA DO SUL OUTROS NO MERCADO DE CAL VIVEIRA, POR PRODUTO, 2020-2029 (MIL USD)
TABELA 99 MERCADO DE CAL VIVEIRA DE SINGAPURA, POR PRODUTO, 2020-2029 (MIL USD)
TABELA 100 MERCADO DE CAL VIVEIRA DE SINGAPURA, POR PRODUTO, 2020-2029 (TONELADAS)
TABELA 101 MERCADO DE CAL VIVEIRA DE SINGAPURA, POR FORMA, 2020-2029 (MIL USD)
TABELA 102 MERCADO DE CAL VIVEIRA DE SINGAPURA, POR FORMA, 2020-2029 (TONELADAS)
TABELA 103 MERCADO DE CAL VIVEIRA DE SINGAPURA, POR APLICAÇÃO, 2020-2029 (MIL USD)
TABELA 104 MERCADO DE CAL VIVEIRA DE SINGAPURA, POR APLICAÇÃO, 2020-2029 (TONELADAS)
TABELA 105 MATERIAIS DE CONSTRUÇÃO E EDIFICAÇÃO DE SINGAPURA NO MERCADO DE CAL VIVEIRA, POR PRODUTO, 2020-2029 (MIL USD)
TABELA 106 PRODUTOS QUÍMICOS DE SINGAPURA NO MERCADO DE CAL VIVO, POR PRODUTO, 2020-2029 (MIL USD)
TABELA 107 TRATAMENTO DE ÁGUA EM SINGAPURA NO MERCADO DE CAL VIVEIRA, POR PRODUTO, 2020-2029 (MIL USD)
TABELA 108 MERCADO METALÚRGICO DE CAL VIVEIRA EM SINGAPURA, POR PRODUTO, 2020-2029 (MIL USD)
TABELA 109 MINERAÇÃO DE SINGAPURA NO MERCADO DE CAL VIVEIRA, POR PRODUTO, 2020-2029 (MIL USD)
TABELA 110 SINGAPURA OUTROS NO MERCADO DE CAL VIVEIRA, POR PRODUTO, 2020-2029 (MIL USD)
TABELA 111 MERCADO DE CAL VIVEIRA DA TAILÂNDIA, POR PRODUTO, 2020-2029 (MIL USD)
TABELA 112 MERCADO DE CAL VIVEIRA DA TAILÂNDIA, POR PRODUTO, 2020-2029 (TONELADAS)
TABELA 113 MERCADO DE CAL VIVEIRA DA TAILÂNDIA, POR FORMA, 2020-2029 (MIL USD)
TABELA 114 MERCADO DE CAL VIVEIRA DA TAILÂNDIA, POR FORMA, 2020-2029 (TONELADAS)
TABELA 115 MERCADO DE CAL VIVEIRA DA TAILÂNDIA, POR APLICAÇÃO, 2020-2029 (MIL USD)
TABELA 116 MERCADO DE CAL VIVEIRA DA TAILÂNDIA, POR APLICAÇÃO, 2020-2029 (TONELADAS)
TABELA 117 MATERIAIS DE CONSTRUÇÃO E CONSTRUÇÃO DA TAILÂNDIA NO MERCADO DE CAL VIVEIRA, POR PRODUTO, 2020-2029 (MIL USD)
TABELA 118 PRODUTOS QUÍMICOS DA TAILÂNDIA NO MERCADO DE CAL VIVEIRA, POR PRODUTO, 2020-2029 (MIL USD)
TABELA 119 TRATAMENTO DE ÁGUA NA TAILÂNDIA NO MERCADO DE CAL VIVEIRA, POR PRODUTO, 2020-2029 (MIL USD)
TABELA 120 MERCADO METALÚRGICO DE CAL VIVEIRA DA TAILÂNDIA, POR PRODUTO, 2020-2029 (MIL USD)
TABELA 121 MINERAÇÃO NA TAILÂNDIA NO MERCADO DE CAL VIVENTE, POR PRODUTO, 2020-2029 (MIL USD)
TABELA 122 TAILÂNDIA OUTROS NO MERCADO DE CAL VIVEIRA, POR PRODUTO, 2020-2029 (MIL USD)
TABELA 123 MERCADO DE CAL VIVEIRA DA INDONÉSIA, POR PRODUTO, 2020-2029 (MIL USD)
TABELA 124 MERCADO DE CAL VIVEIRA DA INDONÉSIA, POR PRODUTO, 2020-2029 (TONELADAS)
TABELA 125 MERCADO DE CAL VIVEIRA DA INDONÉSIA, POR FORMA, 2020-2029 (MIL USD)
TABELA 126 MERCADO DE CAL VIVEIRA DA INDONÉSIA, POR FORMA, 2020-2029 (TONELADAS)
TABELA 127 MERCADO DE CAL VIVEIRA DA INDONÉSIA, POR APLICAÇÃO, 2020-2029 (MIL USD)
TABELA 128 MERCADO DE CAL VIVEIRA DA INDONÉSIA, POR APLICAÇÃO, 2020-2029 (TONELADAS)
TABELA 129 MATERIAIS DE CONSTRUÇÃO E CONSTRUÇÃO DA INDONÉSIA NO MERCADO DE CAL VIVEIRA, POR PRODUTO, 2020-2029 (MIL USD)
TABELA 130 PRODUTOS QUÍMICOS DA INDONÉSIA NO MERCADO DE CAL VIVEIRA, POR PRODUTO, 2020-2029 (MIL USD)
TABELA 131 TRATAMENTO DE ÁGUA NO MERCADO DE CAL VIVEIRA DA INDONÉSIA, POR PRODUTO, 2020-2029 (MIL USD)
TABELA 132 MERCADO METALÚRGICO DE CAL VIVEIRA DA INDONÉSIA, POR PRODUTO, 2020-2029 (MIL USD)
TABELA 133 MINERAÇÃO NA INDONÉSIA NO MERCADO DE CAL VIVENTE, POR PRODUTO, 2020-2029 (MIL USD)
TABELA 134 INDONÉSIA OUTROS NO MERCADO DE CAL VIVEIRA, POR PRODUTO, 2020-2029 (MIL USD)
TABELA 135 MERCADO DE CAL VIVEIRA DA AUSTRÁLIA E NOVA ZELÂNDIA, POR PRODUTO, 2020-2029 (MIL USD)
TABELA 136 MERCADO DE CAL VIVEIRA DA AUSTRÁLIA E NOVA ZELÂNDIA, POR PRODUTO, 2020-2029 (TONELADAS)
TABELA 137 MERCADO DE CAL VIVEIRA DA AUSTRÁLIA E NOVA ZELÂNDIA, POR FORMA, 2020-2029 (MIL USD)
TABELA 138 MERCADO DE CAL VIVEIRA DA AUSTRÁLIA E NOVA ZELÂNDIA, POR FORMA, 2020-2029 (TONELADAS)
TABELA 139 MERCADO DE CAL VIVEIRA DA AUSTRÁLIA E NOVA ZELÂNDIA, POR APLICAÇÃO, 2020-2029 (MIL USD)
TABELA 140 MERCADO DE CAL VIVEIRA DA AUSTRÁLIA E NOVA ZELÂNDIA, POR APLICAÇÃO, 2020-2029 (TONELADAS)
TABELA 141 MATERIAIS DE CONSTRUÇÃO DA AUSTRÁLIA E NOVA ZELÂNDIA NO MERCADO DE CAL VIVEIRA, POR PRODUTO, 2020-2029 (MIL USD)
TABELA 142 AUSTRÁLIA E NOVA ZELÂNDIA PRODUTOS QUÍMICOS NO MERCADO DE CAL VIVEIRA, POR PRODUTO, 2020-2029 (MIL USD)
TABELA 143 TRATAMENTO DE ÁGUA NA AUSTRÁLIA E NOVA ZELÂNDIA NO MERCADO DE CAL VIVEIRA, POR PRODUTO, 2020-2029 (MIL USD)
TABELA 144 MERCADO DE CAL VIVEIRA NA AUSTRÁLIA E NOVA ZELÂNDIA, POR PRODUTO, 2020-2029 (MIL USD)
TABELA 145 MINERAÇÃO NA AUSTRÁLIA E NOVA ZELÂNDIA NO MERCADO DE CAL VIVENTE, POR PRODUTO, 2020-2029 (MIL USD)
TABLE 146 AUSTRALIA & NEW ZEALAND OTHERS IN QUICKLIME MARKET, BY PRODUCT, 2020-2029 (USD THOUSAND)
TABLE 147 PHILIPPINES QUICKLIME MARKET, BY PRODUCT, 2020-2029 (USD THOUSAND)
TABLE 148 PHILIPPINES QUICKLIME MARKET, BY PRODUCT, 2020-2029 (TONS)
TABLE 149 PHILIPPINES QUICKLIME MARKET, BY FORM, 2020-2029 (USD THOUSAND)
TABLE 150 PHILIPPINES QUICKLIME MARKET, BY FORM, 2020-2029 (TONS)
TABLE 151 PHILIPPINES QUICKLIME MARKET, BY APPLICATION, 2020-2029 (USD THOUSAND)
TABLE 152 PHILIPPINES QUICKLIME MARKET, BY APPLICATION, 2020-2029 (TONS)
TABLE 153 PHILIPPINES BUILDING AND CONSTRUCTION MATERIALS IN QUICKLIME MARKET, BY PRODUCT, 2020-2029 (USD THOUSAND)
TABLE 154 PHILIPPINES CHEMICAL IN QUICKLIME MARKET, BY PRODUCT, 2020-2029 (USD THOUSAND)
TABLE 155 PHILIPPINES WATER TREATMENT IN QUICKLIME MARKET, BY PRODUCT, 2020-2029 (USD THOUSAND)
TABLE 156 PHILIPPINES METALLURGICAL IN QUICKLIME MARKET, BY PRODUCT, 2020-2029 (USD THOUSAND)
TABLE 157 PHILIPPINES MINING IN QUICKLIME MARKET, BY PRODUCT, 2020-2029 (USD THOUSAND)
TABLE 158 PHILIPPINES OTHERS IN QUICKLIME MARKET, BY PRODUCT, 2020-2029 (USD THOUSAND)
TABLE 159 MALAYSIA QUICKLIME MARKET, BY PRODUCT, 2020-2029 (USD THOUSAND)
TABLE 160 MALAYSIA QUICKLIME MARKET, BY PRODUCT, 2020-2029 (TONS)
TABLE 161 MALAYSIA QUICKLIME MARKET, BY FORM, 2020-2029 (USD THOUSAND)
TABLE 162 MALAYSIA QUICKLIME MARKET, BY FORM, 2020-2029 (TONS)
TABLE 163 MALAYSIA QUICKLIME MARKET, BY APPLICATION, 2020-2029 (USD THOUSAND)
TABLE 164 MALAYSIA QUICKLIME MARKET, BY APPLICATION, 2020-2029 (TONS)
TABLE 165 MALAYSIA BUILDING AND CONSTRUCTION MATERIALS IN QUICKLIME MARKET, BY PRODUCT, 2020-2029 (USD THOUSAND)
TABLE 166 MALAYSIA CHEMICAL IN QUICKLIME MARKET, BY PRODUCT, 2020-2029 (USD THOUSAND)
TABLE 167 MALAYSIA WATER TREATMENT IN QUICKLIME MARKET, BY PRODUCT, 2020-2029 (USD THOUSAND)
TABLE 168 MALAYSIA METALLURGICAL IN QUICKLIME MARKET, BY PRODUCT, 2020-2029 (USD THOUSAND)
TABLE 169 MALAYSIA MINING IN QUICKLIME MARKET, BY PRODUCT, 2020-2029 (USD THOUSAND)
TABLE 170 MALAYSIA OTHERS IN QUICKLIME MARKET, BY PRODUCT, 2020-2029 (USD THOUSAND)
TABLE 171 REST OF ASIA-PACIFIC QUICKLIME MARKET, BY PRODUCT, 2020-2029 (USD THOUSAND)
TABLE 172 REST OF ASIA-PACIFIC QUICKLIME MARKET, BY PRODUCT, 2020-2029 (TONS)
Lista de Figura
FIGURE 1 ASIA PACIFIC QUICKLIME MARKET: SEGMENTATION
FIGURE 2 ASIA PACIFIC QUICKLIME MARKET: DATA TRIANGULATION
FIGURE 3 ASIA PACIFIC QUICKLIME MARKET: DROC ANALYSIS
FIGURE 4 ASIA PACIFIC QUICKLIME MARKET: ASIA PACIFIC VS REGIONAL MARKET ANALYSIS
FIGURE 5 ASIA PACIFIC QUICKLIME MARKET: COMPANY RESEARCH ANALYSIS
FIGURE 6 ASIA PACIFIC QUICKLIME MARKET: THE PRODUCT LIFE LINE CURVE
FIGURE 7 ASIA PACIFIC QUICKLIME MARKET: MULTIVARIATE MODELLING
FIGURE 8 ASIA PACIFIC QUICKLIME MARKET: INTERVIEW DEMOGRAPHICS
FIGURE 9 ASIA PACIFIC QUICKLIME MARKET: DBMR MARKET POSITION GRID
FIGURE 10 ASIA PACIFIC QUICKLIME MARKET: MARKET APPLICATION COVERAGE GRID
FIGURE 11 ASIA PACIFIC QUICKLIME MARKET: THE MARKET CHALLENGE MATRIX
FIGURE 12 ASIA PACIFIC QUICKLIME MARKET: VENDOR SHARE ANALYSIS
FIGURA 13 MERCADO DE CAL VIVINA DA ÁSIA-PACÍFICO: SEGMENTAÇÃO
FIGURA 14 ESPERA-SE QUE A ÁSIA-PACÍFICO DOMINE O MERCADO DE CAL VIVOS DA ÁSIA-PACÍFICO E CRESÇA COM O MAIOR CAGR NO PERÍODO PREVISTO DE 2022 A 2029
FIGURA 15 A AUMENTO DA DEMANDA POR FERRO E AÇO DE DIFERENTES INDÚSTRIAS DEVE IMPULSIONAR O MERCADO DE CAL VIVENTE DA ÁSIA-PACÍFICO NO PERÍODO PREVISTO DE 2022 A 2029
FIGURA 16 O SEGMENTO DE ALTO TEOR DE CÁLCIO DEVE SER REPRESENTANTE DA MAIOR PARCIALIDADE DO MERCADO DE CAL VIVENTE DA ÁSIA-PACÍFICO EM 2022 E 2029
FIGURA 17 CENÁRIO DE IMPORTAÇÃO E EXPORTAÇÃO (MIL USD)
FIGURA 18 CRITÉRIOS DE SELEÇÃO DE FORNECEDORES
FIGURA 19 ANÁLISE DE PRODUÇÃO E CONSUMO
FIGURA 20 MOTIVADORES, RESTRIÇÕES, OPORTUNIDADES E DESAFIOS DO MERCADO DE CAL VIVEIRA DA ÁSIA-PACÍFICO
FIGURA 21 PRODUÇÃO MUNDIAL DE AÇO EM 2015 E 2016
FIGURA 22 PRODUÇÃO DE CIMENTO NA ÍNDIA (JUNHO DE 2019 – ABRIL DE 2020) (MIL TONELADAS)
FIGURA 23 MERCADO DE CAL VIVEIRA DA ÁSIA-PACÍFICO, POR PRODUTO (MIL USD) (2021)
FIGURA 24 MERCADO DE CAL VIVEIRA DA ÁSIA-PACÍFICO, POR FORMATO, (MIL USD) (2021)
FIGURA 25 MERCADO DE CAL VIVINA DA ÁSIA-PACÍFICO, POR APLICAÇÃO (MIL USD) (2021)
FIGURA 26 MERCADO DE CAL VIVEIRA DA ÁSIA-PACÍFICO: RESUMO (2021)
FIGURA 27 MERCADO DE CAL VIVEIRA DA ÁSIA-PACÍFICO: POR PAÍS (2021)
FIGURA 28 MERCADO DE CAL VIVEIRA DA ÁSIA-PACÍFICO: POR PAÍS (2022 E 2029)
FIGURA 29 MERCADO DE CAL VIVEIRA DA ÁSIA-PACÍFICO: POR PAÍS (2021 E 2029)
FIGURA 30 MERCADO DE CAL VIVEIRA DA ÁSIA-PACÍFICO: POR PRODUTO (2022-2029)
FIGURA 31 MERCADO DE CAL VIVEIRA DA ÁSIA-PACÍFICO: PARTICIPAÇÃO DA EMPRESA EM 2021 (%)
Metodologia de Investigação
A recolha de dados e a análise do ano base são feitas através de módulos de recolha de dados com amostras grandes. A etapa inclui a obtenção de informações de mercado ou dados relacionados através de diversas fontes e estratégias. Inclui examinar e planear antecipadamente todos os dados adquiridos no passado. Da mesma forma, envolve o exame de inconsistências de informação observadas em diferentes fontes de informação. Os dados de mercado são analisados e estimados utilizando modelos estatísticos e coerentes de mercado. Além disso, a análise da quota de mercado e a análise das principais tendências são os principais fatores de sucesso no relatório de mercado. Para saber mais, solicite uma chamada de analista ou abra a sua consulta.
A principal metodologia de investigação utilizada pela equipa de investigação do DBMR é a triangulação de dados que envolve a mineração de dados, a análise do impacto das variáveis de dados no mercado e a validação primária (especialista do setor). Os modelos de dados incluem grelha de posicionamento de fornecedores, análise da linha de tempo do mercado, visão geral e guia de mercado, grelha de posicionamento da empresa, análise de patentes, análise de preços, análise da quota de mercado da empresa, normas de medição, análise global versus regional e de participação dos fornecedores. Para saber mais sobre a metodologia de investigação, faça uma consulta para falar com os nossos especialistas do setor.
Personalização disponível
A Data Bridge Market Research é líder em investigação formativa avançada. Orgulhamo-nos de servir os nossos clientes novos e existentes com dados e análises que correspondem e atendem aos seus objetivos. O relatório pode ser personalizado para incluir análise de tendências de preços de marcas-alvo, compreensão do mercado para países adicionais (solicite a lista de países), dados de resultados de ensaios clínicos, revisão de literatura, mercado remodelado e análise de base de produtos . A análise de mercado dos concorrentes-alvo pode ser analisada desde análises baseadas em tecnologia até estratégias de carteira de mercado. Podemos adicionar quantos concorrentes necessitar de dados no formato e estilo de dados que procura. A nossa equipa de analistas também pode fornecer dados em tabelas dinâmicas de ficheiros Excel em bruto (livro de factos) ou pode ajudá-lo a criar apresentações a partir dos conjuntos de dados disponíveis no relatório.

