
Asia Pacific Quicklime Market
Market Size in USD Thousand
 USD
2,710,039.31 Thousand
USD
3,913,074.88 Thousand
2021
2029
USD
2,710,039.31 Thousand
USD
3,913,074.88 Thousand
2021
2029
| 2022 - 2029 | |
| USD 2,710,039.31 Thousand | |
| USD 3,913,074.88 Thousand | |
| % | |
|
What is the Asia-Pacific Quicklime Market Size and Growth Rate?
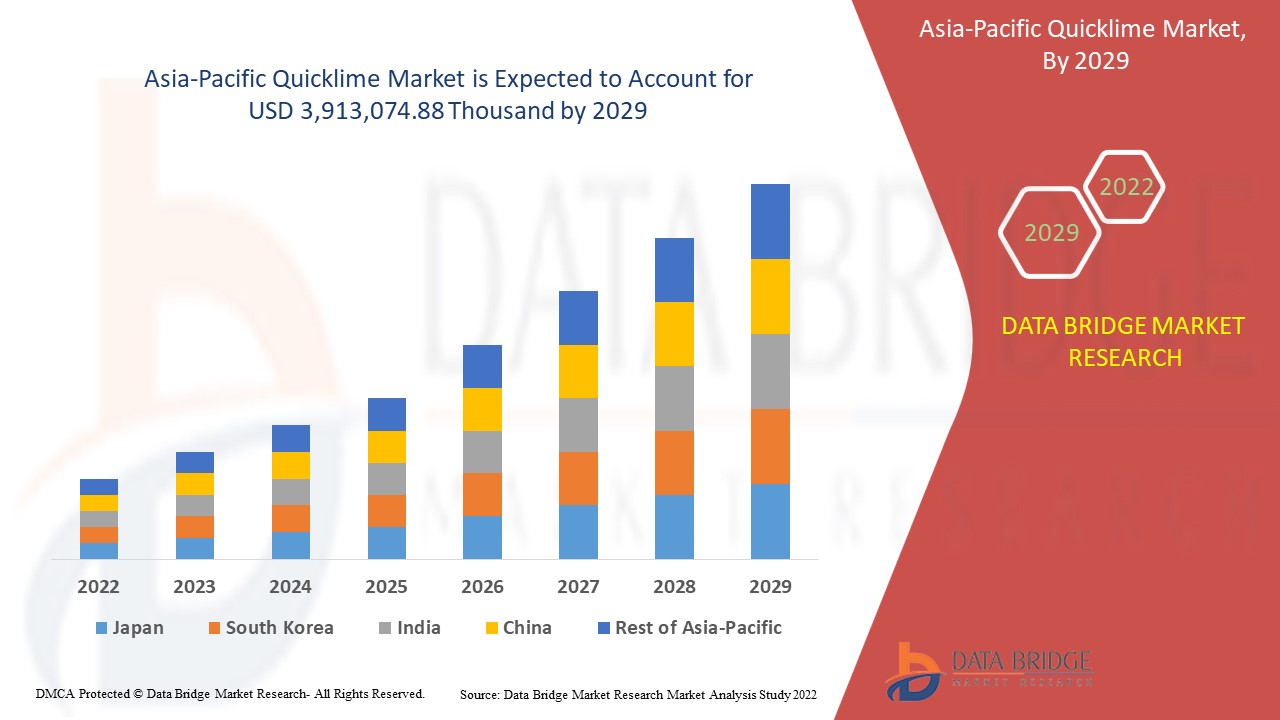
- As per Data Bridge Market Research Analysis the Asia-Pacific quicklime market is expected to gain significant growth in the forecast period of 2022 to 2029. Data Bridge Market Research analyzes that the market is growing at a CAGR of 4.7% in the forecast period of 2022 to 2029 and expected to reach USD 3,913,074.88 thousand by 2029.
- Quicklime is an amorphous white solid with a high melting point of 2600 degrees Celsius. It forms slaked lime, when it interacts with water. Quicklime high calcium and dolomitic, which are extensively used as a flux in purifying steel. It provides durable mortar and plaster and soil stabilization. It also improves water quality, especially for water softening and arsenic removal. Quicklime can be applied on various applications, such as building and construction materials, metallurgy, chemicals, mining, paper, and pulp production among others.
- The major drivers contributing to the growth of the quicklime market include growing usages of precipitated calcium carbonate high adoption of quicklime in building & construction industry. The major restraints which may impact the global quicklime market growth are volatility in the prices of quicklime raw materials and complicated process for producing quicklime.
- Several opportunities associated with the quicklime market include increasing demand for iron and steel from different industries and rising mining activities. In order to fulfill the growing demand for quicklime products in building and construction and water treatment industry, some companies are expanding their production capacities and entering in agreement across different regions. Besides, strict government regulations for manufacturing and commercializing of quicklime is challenging the growth of the market.
- The Asia-Pacific quicklime market report provides details of market share, new developments, and product pipeline analysis, impact of domestic and localized market players, analyses opportunities in terms of emerging revenue pockets, changes in market regulations, product approvals, strategic decisions, product launches, geographic expansions, and technological innovations in the market. To understand the analysis and the market scenario, contact us for an Analyst Brief, our team will help you create a revenue impact solution to achieve your desired goal.
Market Size & Forecast
- Asia-Pacific Market Value (2021): USD 2,710,039.31 thousand
- Expected Market Value (2029): USD 3,913,074.88 thousand
- Forecast CAGR (2022–2029): 4.7%
Asia-Pacific Quicklime Market Scope
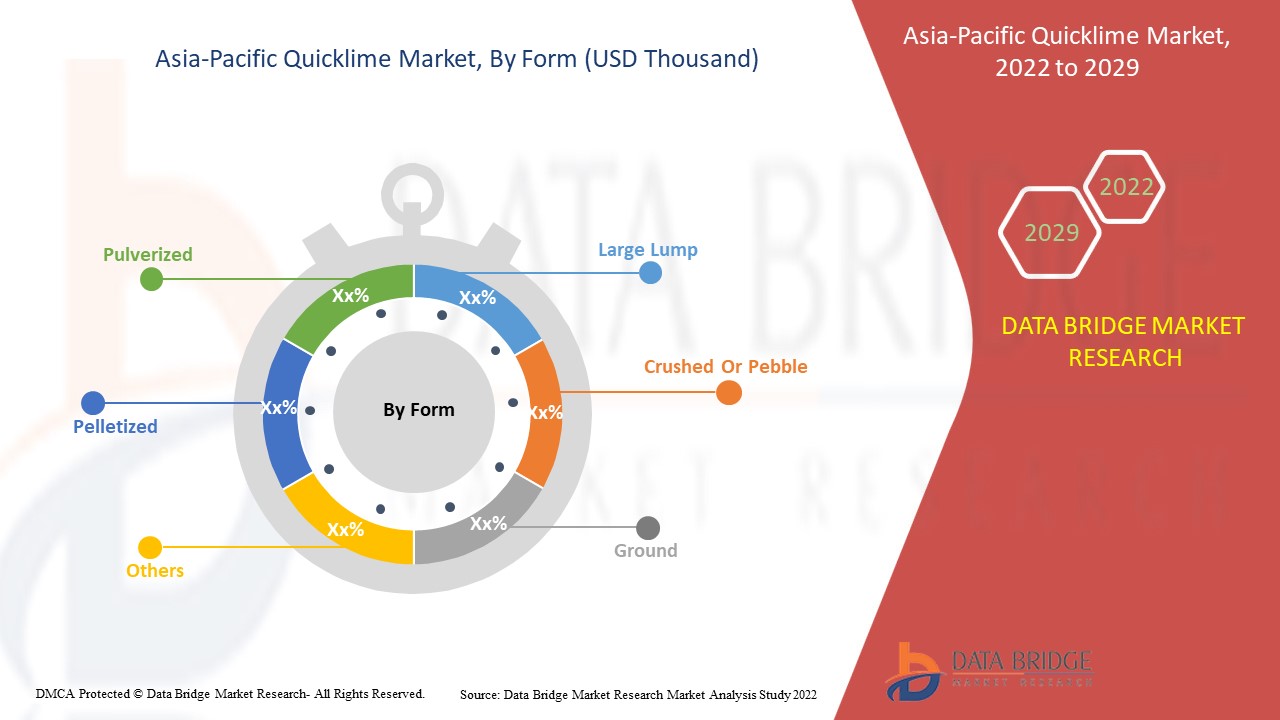
Asia-Pacific quicklime market is segmented into three notable segments, which are based on form, product, and application. The growth among segments helps you analyze niche pockets of growth and strategies to approach the market and determine your core application areas and the difference in your target markets.
- On the basis of form, the Asia-Pacific quicklime market is segmented into large lump, crushed or pebble, ground, pulverized, pelletized, and others. In 2022, the crushed or pebble segment is expected to dominate the market as it is widely used in steel and other industrial manufacturing areas as fluxing agent.
- On the basis of product, the Asia-Pacific quicklime market is segmented into high calcium, magnesium, dolomitic, and others. In 2022, the high calcium segment is expected to dominate the market as it is the most effective alkaline material for disinfection and odor treatment.
- On the basis of application, the Asia-Pacific quicklime market is segmented into metallurgy, building and construction materials, water treatment, mining, chemicals, and others. In 2022, building and construction materials segment is expected to dominate in Asia-Pacific quicklime market, as it is an important ingredient in manufacturing of cement.
Asia-Pacific Quicklime Market Country Level Analysis
Asia-Pacific quicklime market is segmented into three notable segments which are based on the form, product, and application.
- The countries covered in Asia-Pacific quicklime market report are Japan, China, India, South Korea, Australia and New Zealand, Singapore, Malaysia, Thailand, Indonesia, Philippines, and Rest of Asia-Pacific. China is leading the growth of the Asia-Pacific market due to easy and advanced production of the quicklime with high quality material in the country.
- The country section of the report also provides individual market impacting factors and changes in regulation in the market domestically that impacts the current and future trends of the market. Data points such as new sales, replacement sales, country demographics, regulatory acts and import-export tariffs are some of the major pointers used to forecast the market scenario for individual countries. Also, presence and availability of Asia-Pacific brands and their challenges faced due to large or scarce competition from local and domestic brands, impact of sales channels are considered while providing forecast analysis of the country data.
Growing Usage of Precipitated Calcium Carbonate
- Quicklime is used as filler in adhesives and sealants in various industries. In addition, quicklime is mainly used as a major rheological additive in the manufacture of high-performance industrial products. Quicklime in the form of precipitated calcium carbonate is also used as calcium in the diet and is primarily used for liquid products where very small particle size is important. Many medicines and cosmetics contain precipitated calcium carbonate as a base material for tablets or filling chemicals, ointments, and creams.
- Quicklime is commonly used in paints and inks as a bulking agent to increase the capacity and porosity of dry ceilings. It is used as a fine and highly consistently controlled filler and helps control the flow and shape characteristics of fine components. Quicklime can also be supplied coated with additives to improve gloss and support adhesion in the paper industry.
- Furthermore, precipitated calcium carbonate used as quicklime makes the products stronger and is mined from limestone, which is used in different coatings. For this reason, growing usage of precipitated calcium carbonate is expected to act as a diver for the Asia-Pacific quicklime market.
Competitive Landscape and Magnet Wire Market Share Analysis
Asia-Pacific quicklime market competitive landscape provides details by competitor. Details included are company overview, company financials, revenue generated, market potential, investment in research and development, new market initiatives, Asia-Pacific presence, production sites and facilities, company strengths and weaknesses, product launch, clinical trials pipelines, brand analysis, product approvals, patents, product width and breath, application dominance, technology lifeline curve. The above data points provided are only related to the company’s focus related to Asia-Pacific next generation anode materials market.
Some of the major market players engaged in the Asia-Pacific quicklime market are CARMEUSE, Graymont Limited, Cheney Lime & Cement Company, Lhoist Group, Mississippi Lime Company, Linwood Mining & Minerals Corporation, SMA Mineral AB, Pete Lien & Sons, Inc., Adelaide Brighton Cement Ltd., Boral, Nordkalk Corporation, United States Lime & Minerals, Inc., Cape Lime, Saudi Lime Industries Co., Emirates Lime Factory, Super Cement Manufacturing Company LLC, Valley Minerals LLC, CMI Company, Märker Gruppe, Kalkfabrik Netstal, Brenntag, Yoshizawa Lime Industry CO.,LTD., and Austin White Lime Company, Ltd. are among others.
For instance,
- In July 2021, Lhoist North America and Maerz Ofenbau AG have started up a new lime kiln in Montevallo, USA. Lhoist North America has expanded its dolomitic quicklime production at Marble Falls, Texas, as well as a new lime kiln at its New Braunfels, Texas facility. With this expansion the company can tap the untapped market areas.
- In June 2014, Graymont Limited announced that they have entered into an agreement with Holcim to acquire the assets of Taylor’s Lime from the company. This acquisition reflects Graymont’s confidence in the long-term growth prospects for the New Zealand economy and the region. This acquisition is subject to obtaining all the usual regulatory approvals. The Asia-Pacificquicklime market is segmented into three notable segments based on the form, product, and application.
SKU-

- Interactive Data Analysis Dashboard
- Company Analysis Dashboard for high growth potential opportunities
- Research Analyst Access for customization & queries
- Competitor Analysis with Interactive dashboard
- Latest News, Updates & Trend analysis
- Harness the Power of Benchmark Analysis for Comprehensive Competitor Tracking
Table of Content
1 INTRODUCTION
1.1 OBJECTIVES OF THE STUDY
1.2 MARKET DEFINITION
1.3 OVERVIEW OF ASIA PACIFIC QUICKLIME MARKET
1.4 LIMITATION
1.5 MARKETS COVERED
2 MARKET SEGMENTATION
2.1 MARKETS COVERED
2.2 GEOGRAPHICAL SCOPE
2.3 YEARS CONSIDERED FOR THE STUDY
2.4 CURRENCY AND PRICING
2.5 DBMR TRIPOD DATA VALIDATION MODEL
2.6 PRODUCT LIFE LINE CURVE
2.7 MULTIVARIATE MODELING
2.8 PRIMARY INTERVIEWS WITH KEY OPINION LEADERS
2.9 DBMR MARKET POSITION GRID
2.1 MARKET APPLICATION COVERAGE GRID
2.11 DBMR MARKET CHALLENGE MATRIX
2.12 VENDOR SHARE ANALYSIS
2.13 IMPORT-EXPORT DATA
2.14 SECONDARY SOURCES
2.15 ASSUMPTIONS
3 EXECUTIVE SUMMARY
4 PREMIUM INSIGHTS
4.1 SUPPLY CHAIN ANALYSIS
4.1.1 OVERVIEW
4.1.2 LOGISTIC COST SCENARIO
4.1.3 IMPORTANCE OF LOGISTICS SERVICE PROVIDERS
4.2 CLIMATE CHANGE SCENARIO
4.2.1 ENVIRONMENTAL CONCERNS
4.2.2 INDUSTRY RESPONSE
4.2.3 GOVERNMENT’S ROLE
4.2.4 ANALYST RECOMMENDATION
4.3 IMPORT EXPORT SCENARIO
4.4 LIST OF BUYERS
4.5 VENDOR SELECTION CRITERIA
4.6 REGULATORY COVERAGE
4.7 PORTER'S FIVE FORCES:
4.7.1 THREAT OF NEW ENTRANTS:
4.7.2 THREAT OF SUBSTITUTES:
4.7.3 CUSTOMER BARGAINING POWER:
4.7.4 SUPPLIER BARGAINING POWER:
4.7.5 INDUSTRIAL RIVALRY:
4.8 PESTLE ANALYSIS
4.8.1 POLITICAL FACTORS:
4.8.2 ECONOMIC FACTORS:
4.8.3 SOCIAL FACTORS:
4.8.4 TECHNOLOGICAL FACTORS:
4.8.5 LEGAL FACTORS:
4.8.6 ENVIRONMENTAL FACTORS:
4.9 PRODUCTION AND CONSUMPTION ANALYSIS
4.1 TECHNOLOGICAL ADVANCEMENTS BY MANUFACTURERS
4.11 RAW MATERIAL PRODUCTION COVERAGE
4.12 PRICE ANALYSIS
5 REGIONAL SUMMARY
5.1 ASIA PACIFIC
5.2 ASIA-PACIFIC
5.3 NORTH AMERICA
5.4 EUROPE
5.5 SOUTH AMERICA
5.6 MIDDLE-EAST AND AFRICA
6 MARKET OVERVIEW
6.1 DRIVERS
6.1.1 GROWING USAGE OF PRECIPITATED CALCIUM CARBONATE
6.1.2 RISING MINING ACTIVITIES
6.1.3 INCREASE IN DEMAND FOR IRON AND STEEL FROM DIFFERENT INDUSTRIES
6.1.4 HIGH ADOPTION OF QUICKLIME IN BUILDING AND CONSTRUCTION INDUSTRY
6.2 RESTRAINTS
6.2.1 VOLATILITY IN THE PRICES OF QUICKLIME RAW MATERIALS
6.2.2 COMPLICATED PROCESS FOR PRODUCING QUICKLIME
6.3 OPPORTUNITIES
6.3.1 RAPID DEVELOPMENT IN WATER TREATMENT PROCESSES
6.3.2 RISING CONSTRUCTION ACTIVITIES IN EMERGING COUNTRIES
6.3.3 GROWING INDUSTRIAL MACHINERY PRODUCTION
6.4 CHALLENGES
6.4.1 STRICT GOVERNMENT REGULATIONS FOR QUICKLIME MANUFACTURING AND COMMERCIALIZING
6.4.2 GROWING IMPORTANCE OF QUICKLIME ALTERNATIVES SUCH AS LIMESTONE AND MAGNESIUM HYDROXIDE
7 ANALYSIS ON IMPACT OF COVID-19 ON THE ASIA PACIFIC QUICKLIME MARKET
7.1 AFTERMATH OF COVID-19 AND THE GOVERNMENT INITIATIVES TO BOOST THE MARKET
7.2 STRATEGIC DECISIONS OF MANUFACTURERS AFTER COVID-19 TO GET COMPETITIVE MARKET SHARE
7.3 PRICE IMPACT
7.4 IMPACT ON DEMAND
7.5 IMPACT ON SUPPLY CHAIN
7.6 CONCLUSION
8 ASIA PACIFIC QUICKLIME MARKET, BY PRODUCT
8.1 OVERVIEW
8.2 HIGH CALCIUM
8.3 MAGNESIUM
8.4 DOLOMITIC
8.5 OTHERS
9 ASIA PACIFIC QUICKLIME MARKET, BY FORM
9.1 OVERVIEW
9.2 CRUSHED OR PEBBLE
9.3 LARGE LUMP
9.4 GROUND
9.5 PULVERIZED
9.6 PELLETIZED
9.7 OTHERS
10 ASIA PACIFIC QUICKLIME MARKET, BY APPLICATION
10.1 OVERVIEW
10.2 BUILDING AND CONSTRUCTION MATERIAL
10.2.1 BUILDING AND CONSTRUCTION MATERIAL, BY PRODUCT
10.2.1.1 HIGH CALCIUM
10.2.1.2 MAGNESIUM
10.2.1.3 DOLOMITIC
10.2.1.4 OTHERS
10.3 CHEMICAL
10.3.1 CHEMICAL, BY PRODUCT
10.3.1.1 HIGH CALCIUM
10.3.1.2 MAGNESIUM
10.3.1.3 DOLOMITIC
10.3.1.4 OTHERS
10.4 WATER TREATMENT
10.4.1 WATER TREATMENT, BY PRODUCT
10.4.1.1 HIGH CALCIUM
10.4.1.2 MAGNESIUM
10.4.1.3 DOLOMITIC
10.4.1.4 OTHERS
10.5 METALLURGICAL
10.5.1 METALLURGICAL, BY PRODUCT
10.5.1.1 HIGH CALCIUM
10.5.1.2 MAGNESIUM
10.5.1.3 DOLOMITIC
10.5.1.4 OTHERS
10.6 MINING
10.6.1 MINING, BY PRODUCT
10.6.1.1 HIGH CALCIUM
10.6.1.2 MAGNESIUM
10.6.1.3 DOLOMITIC
10.6.1.4 OTHERS
10.7 OTHERS
10.7.1 OTHERS, BY PRODUCT
10.7.1.1 HIGH CALCIUM
10.7.1.2 MAGNESIUM
10.7.1.3 DOLOMITIC
10.7.1.4 OTHERS
11 ASIA PACIFIC QUICKLIME MARKET, BY REGION
11.1 ASIA-PACIFIC
11.1.1 CHINA
11.1.2 INDIA
11.1.3 JAPAN
11.1.4 SOUTH KOREA
11.1.5 SINGAPORE
11.1.6 THAILAND
11.1.7 INDONESIA
11.1.8 AUSTRALIA & NEW ZEALAND
11.1.9 PHILIPPINES
11.1.10 MALAYSIA
11.1.11 REST OF ASIA-PACIFIC
12 ASIA PACIFIC QUICKLIME MARKET: COMPANY LANDSCAPE
12.1 COMPANY SHARE ANALYSIS: ASIA PACIFIC
12.2 MERGERS & ACQUISITIONS
12.3 EXPANSIONS
13 SWOT ANALYSIS
14 COMPANY PROFILE
14.1 BORAL
14.1.1 COMPANY SNAPSHOT
14.1.2 REVENUE ANALYSIS
14.1.3 PRODUCT PORTFOLIO
14.1.4 RECENT UPDATE
14.2 BRENNTAG SE
14.2.1 COMPANY SNAPSHOT
14.2.2 REVENUE ANALYSIS
14.2.3 PRODUCT PORTFOLIO
14.2.4 RECENT UPDATES
14.3 LHOIST GROUP
14.3.1 COMPANY SNAPSHOT
14.3.2 PRODUCT PORTFOLIO
14.3.3 RECENT UPDATES
14.4 ADELAIDE BRIGHTON CEMENT LTD. (A SUBSIDIARY OF ADBRI LTD GROUP OF COMPANIES)
14.4.1 COMPANY SNAPSHOT
14.4.2 REVENUE ANALYSIS
14.4.3 PRODUCT PORTFOLIO
14.4.4 RECENT UPDATE
14.5 CARMEUSE
14.5.1 COMPANY SNAPSHOT
14.5.2 PRODUCT PORTFOLIO
14.5.3 RECENT UPDATE
14.6 GRAYMONT LIMITED
14.6.1 COMPANY SNAPSHOT
14.6.2 PRODUCT PORTFOLIO
14.6.3 RECENT UPDATE
14.7 NORDKALK CORPORATION
14.7.1 COMPANY SNAPSHOT
14.7.2 PRODUCT PORTFOLIO
14.7.3 RECENT UPDATES
14.8 MISSISSIPPI LIME COMPANY
14.8.1 COMPANY SNAPSHOT
14.8.2 PRODUCT PORTFOLIO
14.8.3 RECENT UPDATE
14.9 YOSHIZAWA LIME FACTORY CO LTD
14.9.1 COMPANY SNAPSHOT
14.9.2 PRODUCT PORTFOLIO
14.9.3 RECENT UPDATE
14.1 AUSTIN WHITE LIME COMPANY, LTD
14.10.1 COMPANY SNAPSHOT
14.10.2 PRODUCT PORTFOLIO
14.10.3 RECENT UPDATE
14.11 CAPE LIME (A SUBSIDIARY OF AFRIMAT)
14.11.1 COMPANY SNAPSHOT
14.11.2 REVENUE ANALYSIS
14.11.3 PRODUCT PORTFOLIO
14.11.4 RECENT UPDATE
14.12 CHENEY LIME & CEMENT COMPANY
14.12.1 COMPANY SNAPSHOT
14.12.2 PRODUCT PORTFOLIO
14.12.3 RECENT UPDATE
14.13 CMI COMPANY
14.13.1 COMPANY SNAPSHOT
14.13.2 PRODUCT PORTFOLIO
14.13.3 RECENT UPDATE
14.14 EMIRATES LIME FACTORY
14.14.1 COMPANY SNAPSHOT
14.14.2 PRODUCT PORTFOLIO
14.14.3 RECENT UPDATE
14.15 KALKFABRIK NETSTAL
14.15.1 COMPANY SNAPSHOT
14.15.2 PRODUCT PORTFOLIO
14.15.3 RECENT UPDATE
14.16 LINWOOD MINING & MINERALS CORPORATION
14.16.1 COMPANY SNAPSHOT
14.16.2 PRODUCT PORTFOLIO
14.16.3 RECENT UPDATE
14.17 MARKER GRUPPE
14.17.1 COMPANY SNAPSHOT
14.17.2 PRODUCT PORTFOLIO
14.17.3 RECENT UPDATE
14.18 PETE LIEN & SONS, INC.
14.18.1 COMPANY SNAPSHOT
14.18.2 PRODUCT PORTFOLIO
14.18.3 RECENT UPDATE
14.19 SAUDI LIME INDUSTRIES CO.
14.19.1 COMPANY SNAPSHOT
14.19.2 PRODUCT PORTFOLIO
14.19.3 RECENT UPDATE
14.2 SMA MINERAL AB
14.20.1 COMPANY SNAPSHOT
14.20.2 PRODUCT PORTFOLIO
14.20.3 RECENT UPDATE
14.21 SUPER CEMENT MANUFACTURING CO. LLC (SCMC)
14.21.1 COMPANY SNAPSHOT
14.21.2 PRODUCT PORTFOLIO
14.21.3 RECENT UPDATE
14.22 UNITED STATES LIME & MINERAL, INC.
14.22.1 COMPANY SNAPSHOT
14.22.2 REVENUE ANALYSIS
14.22.3 PRODUCT PORTFOLIO
14.22.4 RECENT UPDATE
14.23 VALLEY MINERALS LLC
14.23.1 COMPANY SNAPSHOT
14.23.2 PRODUCT PORTFOLIO
14.23.3 RECENT UPDATE
15 QUESTIONNAIRE
16 RELATED REPORTS
List of Table
TABLE 1 IMPORT DATA OF QUICKLIMEHS CODE - 252210 (USD THOUSAND)
TABLE 2 EXPORT DATA OF QUICKLIME.; HS CODE - 252210 (USD THOUSAND)
TABLE 3 REGULATORY FRAMEWORK
TABLE 4 AVERAGE PRICE OF QUICKLIME PRODUCTS
TABLE 5 ASIA PACIFIC QUICKLIME MARKET, BY PRODUCT, 2020-2029 (USD THOUSAND)
TABLE 6 ASIA PACIFIC QUICKLIME MARKET, BY PRODUCT, 2020-2029 (TONS)
TABLE 7 ASIA PACIFIC HIGH CALCIUM IN QUICKLIME MARKET, BY REGION, 2020-2029 (USD THOUSAND)
TABLE 8 ASIA PACIFIC HIGH CALCIUM IN QUICKLIME MARKET, BY REGION, 2020-2029 (TONS)
TABLE 9 ASIA PACIFIC MAGNESIUM IN QUICKLIME MARKET, BY REGION, 2020-2029 (USD THOUSAND)
TABLE 10 ASIA PACIFIC MAGNESIUM IN QUICKLIME MARKET, BY REGION, 2020-2029 (TONS)
TABLE 11 ASIA PACIFIC DOLOMITIC IN QUICKLIME MARKET, BY REGION, 2020-2029 (USD THOUSAND)
TABLE 12 ASIA PACIFIC DOLOMITIC IN QUICKLIME MARKET, BY REGION, 2020-2029 (TONS)
TABLE 13 ASIA PACIFIC OTHERS IN QUICKLIME MARKET, BY REGION, 2020-2029 (USD THOUSAND)
TABLE 14 ASIA PACIFIC OTHERS IN QUICKLIME MARKET, BY REGION, 2020-2029 (TONS)
TABLE 15 ASIA PACIFIC QUICKLIME MARKET, BY FORM, 2020-2029 (USD THOUSAND)
TABLE 16 ASIA PACIFIC QUICKLIME MARKET, BY FORM, 2020-2029 (TONS)
TABLE 17 ASIA PACIFIC CRUSHED OR PEBBLE IN QUICKLIME MARKET, BY REGION, 2020-2029 (USD THOUSAND)
TABLE 18 ASIA PACIFIC LARGE LUMP IN QUICKLIME MARKET, BY REGION, 2020-2029 (USD THOUSAND)
TABLE 19 ASIA PACIFIC GROUND IN QUICKLIME MARKET, BY REGION, 2020-2029 (USD THOUSAND)
TABLE 20 ASIA PACIFIC PULVERIZED IN QUICKLIME MARKET, BY REGION, 2020-2029 (USD THOUSAND)
TABLE 21 ASIA PACIFIC PELLETIZED IN QUICKLIME MARKET, BY REGION, 2020-2029 (USD THOUSAND)
TABLE 22 ASIA PACIFIC OTHERS IN QUICKLIME MARKET, BY REGION, 2020-2029 (USD THOUSAND)
TABLE 23 ASIA PACIFIC QUICKLIME MARKET, BY APPLICATION, 2020-2029 (USD THOUSAND)
TABLE 24 ASIA PACIFIC QUICKLIME MARKET, BY APPLICATION, 2020-2029 (TONS)
TABLE 25 ASIA PACIFIC BUILDING AND CONSTRUCTION MATERIAL IN QUICKLIME MARKET, BY REGION, 2020-2029 (USD THOUSAND)
TABLE 26 ASIA PACIFIC BUILDING AND CONSTRUCTION MATERIAL IN QUICKLIME MARKET, BY PRODUCT, 2020-2029 (USD THOUSAND)
TABLE 27 ASIA PACIFIC CHEMICAL IN QUICKLIME MARKET, BY REGION, 2020-2029 (USD THOUSAND)
TABLE 28 ASIA PACIFIC CHEMICAL IN QUICKLIME MARKET, BY PRODUCT, 2020-2029 (USD THOUSAND)
TABLE 29 ASIA PACIFIC WATER TREATMENT IN QUICKLIME MARKET, BY REGION, 2020-2029 (USD THOUSAND)
TABLE 30 ASIA PACIFIC WATER TREATMENT IN QUICKLIME MARKET, BY PRODUCT, 2020-2029 (USD THOUSAND)
TABLE 31 ASIA PACIFIC METALLURGICAL IN QUICKLIME MARKET, BY REGION, 2020-2029 (USD THOUSAND)
TABLE 32 ASIA PACIFIC METALLURGICAL IN QUICKLIME MARKET, BY PRODUCT, 2020-2029 (USD THOUSAND)
TABLE 33 ASIA PACIFIC MINING IN QUICKLIME MARKET, BY REGION, 2020-2029 (USD THOUSAND)
TABLE 34 ASIA PACIFIC MINING IN QUICKLIME MARKET, BY PRODUCT, 2020-2029 (USD THOUSAND)
TABLE 35 ASIA PACIFIC OTHERS IN QUICKLIME MARKET, BY REGION, 2020-2029 (USD THOUSAND)
TABLE 36 ASIA PACIFIC OTHERS IN QUICKLIME MARKET, BY PRODUCT, 2020-2029 (USD THOUSAND)
TABLE 37 ASIA-PACIFIC QUICKLIME MARKET, BY COUNTRY, 2020-2029 (USD THOUSAND)
TABLE 38 ASIA-PACIFIC QUICKLIME MARKET, BY COUNTRY, 2020-2029 (TONS)
TABLE 39 ASIA-PACIFIC QUICKLIME MARKET, BY PRODUCT, 2020-2029 (USD THOUSAND)
TABLE 40 ASIA-PACIFIC QUICKLIME MARKET, BY PRODUCT, 2020-2029 (TONS)
TABLE 41 ASIA-PACIFIC QUICKLIME MARKET, BY FORM, 2020-2029 (USD THOUSAND)
TABLE 42 ASIA-PACIFIC QUICKLIME MARKET, BY FORM, 2020-2029 (TONS)
TABLE 43 ASIA-PACIFIC QUICKLIME MARKET, BY APPLICATION, 2020-2029 (USD THOUSAND)
TABLE 44 ASIA-PACIFIC QUICKLIME MARKET, BY APPLICATION, 2020-2029 (TONS)
TABLE 45 ASIA-PACIFIC BUILDING AND CONSTRUCTION MATERIALS IN QUICKLIME MARKET, BY PRODUCT, 2020-2029 (USD THOUSAND)
TABLE 46 ASIA-PACIFIC CHEMICAL IN QUICKLIME MARKET, BY PRODUCT, 2020-2029 (USD THOUSAND)
TABLE 47 ASIA-PACIFIC WATER TREATMENT IN QUICKLIME MARKET, BY PRODUCT, 2020-2029 (USD THOUSAND)
TABLE 48 ASIA-PACIFIC METALLURGICAL IN QUICKLIME MARKET, BY PRODUCT, 2020-2029 (USD THOUSAND)
TABLE 49 ASIA-PACIFIC MINING IN QUICKLIME MARKET, BY PRODUCT, 2020-2029 (USD THOUSAND)
TABLE 50 ASIA-PACIFIC OTHERS IN QUICKLIME MARKET, BY PRODUCT, 2020-2029 (USD THOUSAND)
TABLE 51 CHINA QUICKLIME MARKET, BY PRODUCT, 2020-2029 (USD THOUSAND)
TABLE 52 CHINA QUICKLIME MARKET, BY PRODUCT, 2020-2029 (TONS)
TABLE 53 CHINA QUICKLIME MARKET, BY FORM, 2020-2029 (USD THOUSAND)
TABLE 54 CHINA QUICKLIME MARKET, BY FORM, 2020-2029 (TONS)
TABLE 55 CHINA QUICKLIME MARKET, BY APPLICATION, 2020-2029 (USD THOUSAND)
TABLE 56 CHINA QUICKLIME MARKET, BY APPLICATION, 2020-2029 (TONS)
TABLE 57 CHINA BUILDING AND CONSTRUCTION MATERIALS IN QUICKLIME MARKET, BY PRODUCT, 2020-2029 (USD THOUSAND)
TABLE 58 CHINA CHEMICAL IN QUICKLIME MARKET, BY PRODUCT, 2020-2029 (USD THOUSAND)
TABLE 59 CHINA WATER TREATMENT IN QUICKLIME MARKET, BY PRODUCT, 2020-2029 (USD THOUSAND)
TABLE 60 CHINA METALLURGICAL IN QUICKLIME MARKET, BY PRODUCT, 2020-2029 (USD THOUSAND)
TABLE 61 CHINA MINING IN QUICKLIME MARKET, BY PRODUCT, 2020-2029 (USD THOUSAND)
TABLE 62 CHINA OTHERS IN QUICKLIME MARKET, BY PRODUCT, 2020-2029 (USD THOUSAND)
TABLE 63 INDIA QUICKLIME MARKET, BY PRODUCT, 2020-2029 (USD THOUSAND)
TABLE 64 INDIA QUICKLIME MARKET, BY PRODUCT, 2020-2029 (TONS)
TABLE 65 INDIA QUICKLIME MARKET, BY FORM, 2020-2029 (USD THOUSAND)
TABLE 66 INDIA QUICKLIME MARKET, BY FORM, 2020-2029 (TONS)
TABLE 67 INDIA QUICKLIME MARKET, BY APPLICATION, 2020-2029 (USD THOUSAND)
TABLE 68 INDIA QUICKLIME MARKET, BY APPLICATION, 2020-2029 (TONS)
TABLE 69 INDIA BUILDING AND CONSTRUCTION MATERIALS IN QUICKLIME MARKET, BY PRODUCT, 2020-2029 (USD THOUSAND)
TABLE 70 INDIA CHEMICAL IN QUICKLIME MARKET, BY PRODUCT, 2020-2029 (USD THOUSAND)
TABLE 71 INDIA WATER TREATMENT IN QUICKLIME MARKET, BY PRODUCT, 2020-2029 (USD THOUSAND)
TABLE 72 INDIA METALLURGICAL IN QUICKLIME MARKET, BY PRODUCT, 2020-2029 (USD THOUSAND)
TABLE 73 INDIA MINING IN QUICKLIME MARKET, BY PRODUCT, 2020-2029 (USD THOUSAND)
TABLE 74 INDIA OTHERS IN QUICKLIME MARKET, BY PRODUCT, 2020-2029 (USD THOUSAND)
TABLE 75 JAPAN QUICKLIME MARKET, BY PRODUCT, 2020-2029 (USD THOUSAND)
TABLE 76 JAPAN QUICKLIME MARKET, BY PRODUCT, 2020-2029 (TONS)
TABLE 77 JAPAN QUICKLIME MARKET, BY FORM, 2020-2029 (USD THOUSAND)
TABLE 78 JAPAN QUICKLIME MARKET, BY FORM, 2020-2029 (TONS)
TABLE 79 JAPAN QUICKLIME MARKET, BY APPLICATION, 2020-2029 (USD THOUSAND)
TABLE 80 JAPAN QUICKLIME MARKET, BY APPLICATION, 2020-2029 (TONS)
TABLE 81 JAPAN BUILDING AND CONSTRUCTION MATERIALS IN QUICKLIME MARKET, BY PRODUCT, 2020-2029 (USD THOUSAND)
TABLE 82 JAPAN CHEMICAL IN QUICKLIME MARKET, BY PRODUCT, 2020-2029 (USD THOUSAND)
TABLE 83 JAPAN WATER TREATMENT IN QUICKLIME MARKET, BY PRODUCT, 2020-2029 (USD THOUSAND)
TABLE 84 JAPAN METALLURGICAL IN QUICKLIME MARKET, BY PRODUCT, 2020-2029 (USD THOUSAND)
TABLE 85 JAPAN MINING IN QUICKLIME MARKET, BY PRODUCT, 2020-2029 (USD THOUSAND)
TABLE 86 JAPAN OTHERS IN QUICKLIME MARKET, BY PRODUCT, 2020-2029 (USD THOUSAND)
TABLE 87 SOUTH KOREA QUICKLIME MARKET, BY PRODUCT, 2020-2029 (USD THOUSAND)
TABLE 88 SOUTH KOREA QUICKLIME MARKET, BY PRODUCT, 2020-2029 (TONS)
TABLE 89 SOUTH KOREA QUICKLIME MARKET, BY FORM, 2020-2029 (USD THOUSAND)
TABLE 90 SOUTH KOREA QUICKLIME MARKET, BY FORM, 2020-2029 (TONS)
TABLE 91 SOUTH KOREA QUICKLIME MARKET, BY APPLICATION, 2020-2029 (USD THOUSAND)
TABLE 92 SOUTH KOREA QUICKLIME MARKET, BY APPLICATION, 2020-2029 (TONS)
TABLE 93 SOUTH KOREA BUILDING AND CONSTRUCTION MATERIALS IN QUICKLIME MARKET, BY PRODUCT, 2020-2029 (USD THOUSAND)
TABLE 94 SOUTH KOREA CHEMICAL IN QUICKLIME MARKET, BY PRODUCT, 2020-2029 (USD THOUSAND)
TABLE 95 SOUTH KOREA WATER TREATMENT IN QUICKLIME MARKET, BY PRODUCT, 2020-2029 (USD THOUSAND)
TABLE 96 SOUTH KOREA METALLURGICAL IN QUICKLIME MARKET, BY PRODUCT, 2020-2029 (USD THOUSAND)
TABLE 97 SOUTH KOREA MINING IN QUICKLIME MARKET, BY PRODUCT, 2020-2029 (USD THOUSAND)
TABLE 98 SOUTH KOREA OTHERS IN QUICKLIME MARKET, BY PRODUCT, 2020-2029 (USD THOUSAND)
TABLE 99 SINGAPORE QUICKLIME MARKET, BY PRODUCT, 2020-2029 (USD THOUSAND)
TABLE 100 SINGAPORE QUICKLIME MARKET, BY PRODUCT, 2020-2029 (TONS)
TABLE 101 SINGAPORE QUICKLIME MARKET, BY FORM, 2020-2029 (USD THOUSAND)
TABLE 102 SINGAPORE QUICKLIME MARKET, BY FORM, 2020-2029 (TONS)
TABLE 103 SINGAPORE QUICKLIME MARKET, BY APPLICATION, 2020-2029 (USD THOUSAND)
TABLE 104 SINGAPORE QUICKLIME MARKET, BY APPLICATION, 2020-2029 (TONS)
TABLE 105 SINGAPORE BUILDING AND CONSTRUCTION MATERIALS IN QUICKLIME MARKET, BY PRODUCT, 2020-2029 (USD THOUSAND)
TABLE 106 SINGAPORE CHEMICAL IN QUICKLIME MARKET, BY PRODUCT, 2020-2029 (USD THOUSAND)
TABLE 107 SINGAPORE WATER TREATMENT IN QUICKLIME MARKET, BY PRODUCT, 2020-2029 (USD THOUSAND)
TABLE 108 SINGAPORE METALLURGICAL IN QUICKLIME MARKET, BY PRODUCT, 2020-2029 (USD THOUSAND)
TABLE 109 SINGAPORE MINING IN QUICKLIME MARKET, BY PRODUCT, 2020-2029 (USD THOUSAND)
TABLE 110 SINGAPORE OTHERS IN QUICKLIME MARKET, BY PRODUCT, 2020-2029 (USD THOUSAND)
TABLE 111 THAILAND QUICKLIME MARKET, BY PRODUCT, 2020-2029 (USD THOUSAND)
TABLE 112 THAILAND QUICKLIME MARKET, BY PRODUCT, 2020-2029 (TONS)
TABLE 113 THAILAND QUICKLIME MARKET, BY FORM, 2020-2029 (USD THOUSAND)
TABLE 114 THAILAND QUICKLIME MARKET, BY FORM, 2020-2029 (TONS)
TABLE 115 THAILAND QUICKLIME MARKET, BY APPLICATION, 2020-2029 (USD THOUSAND)
TABLE 116 THAILAND QUICKLIME MARKET, BY APPLICATION, 2020-2029 (TONS)
TABLE 117 THAILAND BUILDING AND CONSTRUCTION MATERIALS IN QUICKLIME MARKET, BY PRODUCT, 2020-2029 (USD THOUSAND)
TABLE 118 THAILAND CHEMICAL IN QUICKLIME MARKET, BY PRODUCT, 2020-2029 (USD THOUSAND)
TABLE 119 THAILAND WATER TREATMENT IN QUICKLIME MARKET, BY PRODUCT, 2020-2029 (USD THOUSAND)
TABLE 120 THAILAND METALLURGICAL IN QUICKLIME MARKET, BY PRODUCT, 2020-2029 (USD THOUSAND)
TABLE 121 THAILAND MINING IN QUICKLIME MARKET, BY PRODUCT, 2020-2029 (USD THOUSAND)
TABLE 122 THAILAND OTHERS IN QUICKLIME MARKET, BY PRODUCT, 2020-2029 (USD THOUSAND)
TABLE 123 INDONESIA QUICKLIME MARKET, BY PRODUCT, 2020-2029 (USD THOUSAND)
TABLE 124 INDONESIA QUICKLIME MARKET, BY PRODUCT, 2020-2029 (TONS)
TABLE 125 INDONESIA QUICKLIME MARKET, BY FORM, 2020-2029 (USD THOUSAND)
TABLE 126 INDONESIA QUICKLIME MARKET, BY FORM, 2020-2029 (TONS)
TABLE 127 INDONESIA QUICKLIME MARKET, BY APPLICATION, 2020-2029 (USD THOUSAND)
TABLE 128 INDONESIA QUICKLIME MARKET, BY APPLICATION, 2020-2029 (TONS)
TABLE 129 INDONESIA BUILDING AND CONSTRUCTION MATERIALS IN QUICKLIME MARKET, BY PRODUCT, 2020-2029 (USD THOUSAND)
TABLE 130 INDONESIA CHEMICAL IN QUICKLIME MARKET, BY PRODUCT, 2020-2029 (USD THOUSAND)
TABLE 131 INDONESIA WATER TREATMENT IN QUICKLIME MARKET, BY PRODUCT, 2020-2029 (USD THOUSAND)
TABLE 132 INDONESIA METALLURGICAL IN QUICKLIME MARKET, BY PRODUCT, 2020-2029 (USD THOUSAND)
TABLE 133 INDONESIA MINING IN QUICKLIME MARKET, BY PRODUCT, 2020-2029 (USD THOUSAND)
TABLE 134 INDONESIA OTHERS IN QUICKLIME MARKET, BY PRODUCT, 2020-2029 (USD THOUSAND)
TABLE 135 AUSTRALIA & NEW ZEALAND QUICKLIME MARKET, BY PRODUCT, 2020-2029 (USD THOUSAND)
TABLE 136 AUSTRALIA & NEW ZEALAND QUICKLIME MARKET, BY PRODUCT, 2020-2029 (TONS)
TABLE 137 AUSTRALIA & NEW ZEALAND QUICKLIME MARKET, BY FORM, 2020-2029 (USD THOUSAND)
TABLE 138 AUSTRALIA & NEW ZEALAND QUICKLIME MARKET, BY FORM, 2020-2029 (TONS)
TABLE 139 AUSTRALIA & NEW ZEALAND QUICKLIME MARKET, BY APPLICATION, 2020-2029 (USD THOUSAND)
TABLE 140 AUSTRALIA & NEW ZEALAND QUICKLIME MARKET, BY APPLICATION, 2020-2029 (TONS)
TABLE 141 AUSTRALIA & NEW ZEALAND BUILDING AND CONSTRUCTION MATERIALS IN QUICKLIME MARKET, BY PRODUCT, 2020-2029 (USD THOUSAND)
TABLE 142 AUSTRALIA & NEW ZEALAND CHEMICAL IN QUICKLIME MARKET, BY PRODUCT, 2020-2029 (USD THOUSAND)
TABLE 143 AUSTRALIA & NEW ZEALAND WATER TREATMENT IN QUICKLIME MARKET, BY PRODUCT, 2020-2029 (USD THOUSAND)
TABLE 144 AUSTRALIA & NEW ZEALAND METALLURGICAL IN QUICKLIME MARKET, BY PRODUCT, 2020-2029 (USD THOUSAND)
TABLE 145 AUSTRALIA & NEW ZEALAND MINING IN QUICKLIME MARKET, BY PRODUCT, 2020-2029 (USD THOUSAND)
TABLE 146 AUSTRALIA & NEW ZEALAND OTHERS IN QUICKLIME MARKET, BY PRODUCT, 2020-2029 (USD THOUSAND)
TABLE 147 PHILIPPINES QUICKLIME MARKET, BY PRODUCT, 2020-2029 (USD THOUSAND)
TABLE 148 PHILIPPINES QUICKLIME MARKET, BY PRODUCT, 2020-2029 (TONS)
TABLE 149 PHILIPPINES QUICKLIME MARKET, BY FORM, 2020-2029 (USD THOUSAND)
TABLE 150 PHILIPPINES QUICKLIME MARKET, BY FORM, 2020-2029 (TONS)
TABLE 151 PHILIPPINES QUICKLIME MARKET, BY APPLICATION, 2020-2029 (USD THOUSAND)
TABLE 152 PHILIPPINES QUICKLIME MARKET, BY APPLICATION, 2020-2029 (TONS)
TABLE 153 PHILIPPINES BUILDING AND CONSTRUCTION MATERIALS IN QUICKLIME MARKET, BY PRODUCT, 2020-2029 (USD THOUSAND)
TABLE 154 PHILIPPINES CHEMICAL IN QUICKLIME MARKET, BY PRODUCT, 2020-2029 (USD THOUSAND)
TABLE 155 PHILIPPINES WATER TREATMENT IN QUICKLIME MARKET, BY PRODUCT, 2020-2029 (USD THOUSAND)
TABLE 156 PHILIPPINES METALLURGICAL IN QUICKLIME MARKET, BY PRODUCT, 2020-2029 (USD THOUSAND)
TABLE 157 PHILIPPINES MINING IN QUICKLIME MARKET, BY PRODUCT, 2020-2029 (USD THOUSAND)
TABLE 158 PHILIPPINES OTHERS IN QUICKLIME MARKET, BY PRODUCT, 2020-2029 (USD THOUSAND)
TABLE 159 MALAYSIA QUICKLIME MARKET, BY PRODUCT, 2020-2029 (USD THOUSAND)
TABLE 160 MALAYSIA QUICKLIME MARKET, BY PRODUCT, 2020-2029 (TONS)
TABLE 161 MALAYSIA QUICKLIME MARKET, BY FORM, 2020-2029 (USD THOUSAND)
TABLE 162 MALAYSIA QUICKLIME MARKET, BY FORM, 2020-2029 (TONS)
TABLE 163 MALAYSIA QUICKLIME MARKET, BY APPLICATION, 2020-2029 (USD THOUSAND)
TABLE 164 MALAYSIA QUICKLIME MARKET, BY APPLICATION, 2020-2029 (TONS)
TABLE 165 MALAYSIA BUILDING AND CONSTRUCTION MATERIALS IN QUICKLIME MARKET, BY PRODUCT, 2020-2029 (USD THOUSAND)
TABLE 166 MALAYSIA CHEMICAL IN QUICKLIME MARKET, BY PRODUCT, 2020-2029 (USD THOUSAND)
TABLE 167 MALAYSIA WATER TREATMENT IN QUICKLIME MARKET, BY PRODUCT, 2020-2029 (USD THOUSAND)
TABLE 168 MALAYSIA METALLURGICAL IN QUICKLIME MARKET, BY PRODUCT, 2020-2029 (USD THOUSAND)
TABLE 169 MALAYSIA MINING IN QUICKLIME MARKET, BY PRODUCT, 2020-2029 (USD THOUSAND)
TABLE 170 MALAYSIA OTHERS IN QUICKLIME MARKET, BY PRODUCT, 2020-2029 (USD THOUSAND)
TABLE 171 REST OF ASIA-PACIFIC QUICKLIME MARKET, BY PRODUCT, 2020-2029 (USD THOUSAND)
TABLE 172 REST OF ASIA-PACIFIC QUICKLIME MARKET, BY PRODUCT, 2020-2029 (TONS)
List of Figure
FIGURE 1 ASIA PACIFIC QUICKLIME MARKET: SEGMENTATION
FIGURE 2 ASIA PACIFIC QUICKLIME MARKET: DATA TRIANGULATION
FIGURE 3 ASIA PACIFIC QUICKLIME MARKET: DROC ANALYSIS
FIGURE 4 ASIA PACIFIC QUICKLIME MARKET: ASIA PACIFIC VS REGIONAL MARKET ANALYSIS
FIGURE 5 ASIA PACIFIC QUICKLIME MARKET: COMPANY RESEARCH ANALYSIS
FIGURE 6 ASIA PACIFIC QUICKLIME MARKET: THE PRODUCT LIFE LINE CURVE
FIGURE 7 ASIA PACIFIC QUICKLIME MARKET: MULTIVARIATE MODELLING
FIGURE 8 ASIA PACIFIC QUICKLIME MARKET: INTERVIEW DEMOGRAPHICS
FIGURE 9 ASIA PACIFIC QUICKLIME MARKET: DBMR MARKET POSITION GRID
FIGURE 10 ASIA PACIFIC QUICKLIME MARKET: MARKET APPLICATION COVERAGE GRID
FIGURE 11 ASIA PACIFIC QUICKLIME MARKET: THE MARKET CHALLENGE MATRIX
FIGURE 12 ASIA PACIFIC QUICKLIME MARKET: VENDOR SHARE ANALYSIS
FIGURE 13 ASIA PACIFIC QUICKLIME MARKET: SEGMENTATION
FIGURE 14 ASIA-PACIFIC IS EXPECTED TO DOMINATE THE ASIA PACIFIC QUICKLIME MARKET AND IS EXPECTED TO GROW WITH THE HIGHEST CAGR IN THE FORECAST PERIOD OF 2022 TO 2029
FIGURE 15 INCREASING DEMAND FOR IRON AND STEEL FROM DIFFERENT INDUSTRIES IS EXPECTED TO DRIVE THE ASIA PACIFIC QUICKLIME MARKET IN THE FORECAST PERIOD OF 2022 TO 2029
FIGURE 16 HIGH CALCIUM SEGMENT IS EXPECTED TO ACCOUNT FOR THE LARGEST SHARE OF THE ASIA PACIFIC QUICKLIME MARKET IN 2022 & 2029
FIGURE 17 IMPORT EXPORT SCENARIO (USD THOUSAND)
FIGURE 18 VENDOR SELECTION CRITERIA
FIGURE 19 PRODUCTION AND CONSUMPTION ANALYSIS
FIGURE 20 DRIVERS, RESTRAINTS, OPPORTUNITIES, AND CHALLENGES OF ASIA PACIFIC QUICKLIME MARKET
FIGURE 21 WORLD STEEL PRODUCTION IN 2015 AND 2016
FIGURE 22 INDIA CEMENT PRODUCTION (JUNE 2019 – APRIL 2020) (THOUSAND TONS)
FIGURE 23 ASIA PACIFIC QUICKLIME MARKET, BY PRODUCT, (USD THOUSAND) (2021)
FIGURE 24 ASIA PACIFIC QUICKLIME MARKET, BY FORM, (USD THOUSAND) (2021)
FIGURE 25 ASIA PACIFIC QUICKLIME MARKET, BY APPLICATION (USD THOUSAND) (2021)
FIGURE 26 ASIA-PACIFIC QUICKLIME MARKET: SNAPSHOT (2021)
FIGURE 27 ASIA-PACIFIC QUICKLIME MARKET: BY COUNTRY (2021)
FIGURE 28 ASIA-PACIFIC QUICKLIME MARKET: BY COUNTRY (2022 & 2029)
FIGURE 29 ASIA-PACIFIC QUICKLIME MARKET: BY COUNTRY (2021 & 2029)
FIGURE 30 ASIA-PACIFIC QUICKLIME MARKET: BY PRODUCT (2022-2029)
FIGURE 31 ASIA PACIFIC QUICKLIME MARKET: COMPANY SHARE 2021 (%)
Asia Pacific Quicklime Market, Supply Chain Analysis and Ecosystem Framework
To support market growth and help clients navigate the impact of geopolitical shifts, DBMR has integrated in-depth supply chain analysis into its Asia Pacific Quicklime Market research reports. This addition empowers clients to respond effectively to global changes affecting their industries. The supply chain analysis section includes detailed insights such as Asia Pacific Quicklime Market consumption and production by country, price trend analysis, the impact of tariffs and geopolitical developments, and import and export trends by country and HSN code. It also highlights major suppliers with data on production capacity and company profiles, as well as key importers and exporters. In addition to research, DBMR offers specialized supply chain consulting services backed by over a decade of experience, providing solutions like supplier discovery, supplier risk assessment, price trend analysis, impact evaluation of inflation and trade route changes, and comprehensive market trend analysis.
Data collection and base year analysis are done using data collection modules with large sample sizes. The stage includes obtaining market information or related data through various sources and strategies. It includes examining and planning all the data acquired from the past in advance. It likewise envelops the examination of information inconsistencies seen across different information sources. The market data is analysed and estimated using market statistical and coherent models. Also, market share analysis and key trend analysis are the major success factors in the market report. To know more, please request an analyst call or drop down your inquiry.
The key research methodology used by DBMR research team is data triangulation which involves data mining, analysis of the impact of data variables on the market and primary (industry expert) validation. Data models include Vendor Positioning Grid, Market Time Line Analysis, Market Overview and Guide, Company Positioning Grid, Patent Analysis, Pricing Analysis, Company Market Share Analysis, Standards of Measurement, Global versus Regional and Vendor Share Analysis. To know more about the research methodology, drop in an inquiry to speak to our industry experts.
Data Bridge Market Research is a leader in advanced formative research. We take pride in servicing our existing and new customers with data and analysis that match and suits their goal. The report can be customized to include price trend analysis of target brands understanding the market for additional countries (ask for the list of countries), clinical trial results data, literature review, refurbished market and product base analysis. Market analysis of target competitors can be analyzed from technology-based analysis to market portfolio strategies. We can add as many competitors that you require data about in the format and data style you are looking for. Our team of analysts can also provide you data in crude raw excel files pivot tables (Fact book) or can assist you in creating presentations from the data sets available in the report.


