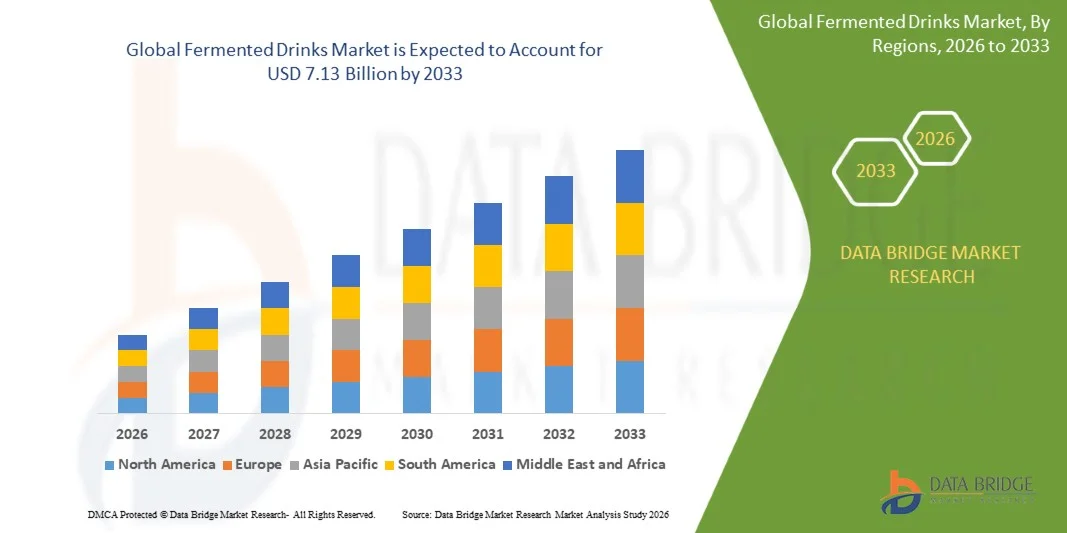
Global Fermented Drinks Market
Taille du marché en milliards USD
TCAC :
% 
 USD
4.51 Billion
USD
7.13 Billion
2025
2033
USD
4.51 Billion
USD
7.13 Billion
2025
2033
| 2026 –2033 | |
| USD 4.51 Billion | |
| USD 7.13 Billion | |
| % | |
|
Marché mondial des boissons fermentées, par type (boissons fermentées alcoholiques et boissons fermentées non alcoholiques), type d'emballage (boissons, conserves, boîtes de tétra/cartons, kegs et barres, etc.), chaîne de distribution (supermarché/hypermarché, magasin de détail spécialisé, magasin de commodité, sur le marché, hors commerce, chaîne en ligne et autres canaux de distribution)- Tendances et prévisions de l'industrie à 2033
Aperçu du marché des boissons fermentées
Selon l'analyse de marché de Data Bridge Le marché des boissons fermentées a été évalué à4,51 milliards de dollars en 2025et devrait atteindre7,13 milliards de dollars en 2033, croissance à unTCAC de 5,90 % de 2026 à 2033. Le marché connaît une croissance constante en raison de la sensibilisation accrue des consommateurs aux avantages probiotiques, de l'augmentation de la demande de boissons fonctionnelles favorisant la digestion et le bien-être, et de la préférence croissante pour des substituts fermentés naturels, biologiques et végétaux comme le kombucha et le kéfir.
L'accent de plus en plus mis sur la santé intestinale, l'immunité et des choix de mode de vie plus sains, conjugués à l'adoption d'options de boissons à faible et sans alcool, encourage les fabricants à élargir leurs gammes de boissons fermentées. Les boissons fermentées alcooliques continuent de dominer la valeur marchande, tandis que les boissons probiotiques non alcoolisées connaissent une croissance plus rapide en raison des tendances axées sur le bien-être des consommateurs. Les progrès dans les technologies de fermentation, l'innovation de produits de première qualité, les solutions d'emballage durables et l'expansion des circuits de vente au détail en ligne soutiennent davantage l'expansion du marché dans toutes les régions du monde.
Taille du marché et prévisions
- Valeur marchande mondiale (2025): 4,51 milliards de dollars
- Valeur de marché prévue (2033): USD 7,13 milliards
- Prévisions CAGR (2026-2033): 5,90%
- Région phare en 2025: Asie-Pacifique
- Région en pleine croissance: Europe
Principales tendances et perspectives du marché
- L'Asie-Pacifique a dominé le marché des boissons fermentées avec la plus grande part des revenus de 33,82 % en 2025, soutenue par des volumes élevés de bière, une forte demande de boissons fermentées traditionnelles et l'adoption croissante de kombucha et de kefir dans des pays comme la Chine, le Japon et l'Inde.
- Le segment des boissons fermentées alcooliques a dominé le marché avec une part de 76,32 % en 2025, tirée par des modes de consommation établis, une infrastructure de production étendue et de solides réseaux mondiaux de distribution
- On s'attend à ce que l'Europe soit la région qui connaît la croissance la plus rapide avec un TCAC de 9,5 % entre 2026 et 2033, alimenté par une forte consommation traditionnelle de boissons fermentées, une concentration croissante des consommateurs sur la santé intestinale et le bien-être, et une demande croissante de boissons probiotiques comme le kefir et le kombucha
- Les boissons fermentées non alcoolisées sont le type qui connaît la croissance la plus rapide et devraient enregistrer un TCAC de 8,5 %, ce qui reflète la hausse des boissons fonctionnelles, des solutions de santé digestive et des produits axés sur le bien-être.
- Le segment des bouteilles dominait la catégorie des types d'emballages avec une part des revenus de 50,89 % en 2025, suivie par l'adoption généralisée de boissons fermentées alcooliques, de kombucha, de kefir et de boissons premium
- Le commerce extérieur représentait 70,43 % du marché, en raison de la forte présence de supermarchés, d'hypermarchés, de détaillants spécialisés et de la préférence accrue des consommateurs pour la consommation de boissons à domicile.
- Le segment des boîtes de conserve est la catégorie de type d'emballage qui connaît la croissance la plus rapide, avec un TCAC de 7,79%, entraîné par la demande croissante de solutions d'emballage pratiques, légères et recyclables
Portée du rapport et segmentation du marché des boissons fermentées
|
Attributs |
Boissons fermentées Principales perspectives du marché |
|
Segments couverts |
|
|
Pays couverts |
Amérique du Nord
Europe
Asie-Pacifique
Moyen-Orient et Afrique
Amérique du Sud
|
|
Principaux acteurs du marché |
|
|
Possibilités de marché |
|
|
Infos sur la valeur ajoutée |
En plus des renseignements sur les scénarios du marché tels que la valeur du marché, le taux de croissance, la segmentation, la couverture géographique et les principaux intervenants, les rapports de marché établis par Data Bridge Market Research comprennent également une analyse approfondie des experts, une analyse des prix, une analyse des parts de marque, une enquête auprès des consommateurs, une analyse démographique, une analyse de la chaîne d'approvisionnement, une analyse de la chaîne de valeur, une vue d'ensemble des matières premières et des consommables, des critères de sélection des fournisseurs, une analyse PESTLE, une analyse Porter et un cadre réglementaire. |
Tendances du marché des boissons fermentées
Tendance: Croissance de la consommation de boissons fonctionnelles et probiotiques
Les consommateurs adoptent de plus en plus des boissons fermentées comme le kombucha, le kéfir et les boissons probiotiques en raison de la sensibilisation accrue à la santé intestinale, au soutien immunitaire et aux bienfaits du bien-être digestif. Les entreprises de boissons investissent dans des formulations d'étiquettes propres, des ingrédients naturels et des saveurs novatrices pour répondre à la demande croissante d'alternatives plus saines aux boissons conventionnelles. L'expansion des catégories de boissons fonctionnelles et la préférence croissante pour les produits axés sur le bien-être accélèrent encore la consommation de boissons fermentées sur les marchés mondiaux. Par exemple, en août 2024, Tata Consumer Products a lancé Tetley Kombucha en Inde, une boisson pétillante fermentée faite avec du thé et du SCOBY (culture symbiotique de bactéries et de levures), avec une formulation de fibres prébiotiques, reflétant une demande croissante de boissons fermentées axées sur le bien-être et fonctionnelles.
L'évolution croissante des consommateurs vers la nutrition fonctionnelle, le bien-être digestif et les boissons qui soutiennent l'immunité accélère l'innovation dans les catégories de boissons probiotiques et fermentées. Les entreprises qui lancent du kombucha, du kéfir et d'autres produits fermentés axés sur la santé tirent parti de cette tendance pour saisir la demande croissante de solutions de boissons naturelles et à valeur ajoutée.
Dynamique du marché des boissons fermentées
Facteur clé du marché : augmentation de la demande de boissons fonctionnelles axées sur la santé
L'accent de plus en plus mis sur la santé du microbiome intestinal, l'amélioration de l'immunité et le bien-être préventif crée une demande importante de boissons fermentées contenant des probiotiques et des microorganismes bénéfiques. Les consommateurs remplacent de plus en plus les boissons traditionnelles par des solutions de rechange fonctionnelles qui offrent des avantages supplémentaires pour la santé au-delà de l'hydratation. Les fabricants élargissent leurs offres de produits grâce à des technologies de fermentation de pointe, à l'enrichissement nutritionnel et à un positionnement haut de gamme pour saisir la demande croissante des consommateurs soucieux de la santé à l'échelle mondiale. Par exemple, en décembre 2023, l'Association scientifique internationale pour les probiotiques et les prébiotiques (ISAPP) a publié plus de 6 600 articles scientifiques dans le domaine de la science biotique et a souligné que l'intérêt des consommateurs pour la santé intestinale et les probiotiques était à un niveau record, soutenant la demande croissante de boissons fermentées fonctionnelles.
La prise de conscience accrue du lien entre la santé digestive et le bien-être général est un facteur clé du marché, encourageant les fabricants à élargir leurs offres de boissons fermentées probiotiques et fonctionnelles.
Principales contraintes et défis : la durée de conservation courte et les défis de préservation de la qualité
Un défi important sur le marché des boissons fermentées est le maintien de la stabilité des produits, de l'activité microbienne et de la qualité sensorielle tout au long de l'entreposage et du transport. Les boissons fermentées nécessitent des procédés de fermentation contrôlés, une gestion de la température et des solutions d'emballage spécialisées pour préserver les microorganismes bénéfiques et assurer une performance constante du produit. Ces exigences accroissent la complexité de la production, les coûts logistiques et les défis de distribution, en particulier pour les petits fabricants émergents qui entrent sur des marchés concurrentiels. Par exemple, en janvier 2022, une recherche publiée dans Applied Sciences a identifié la teneur en oxygène, la température de chauffage, l'acidité, l'activité de l'eau, la teneur en humidité et les matériaux d'emballage comme des facteurs clés qui influent sur la survie des probiotiques durant la fabrication et l'entreposage des aliments.
Les exigences en matière de gestion et de conservation de la durée de conservation demeurent des obstacles clés pour les participants au marché, exigeant des progrès technologiques dans les procédés de fermentation, les emballages et la distribution de la chaîne du froid.
Possibilité de marché clé : expansion des boissons fermentées non alcoholiques et végétales
La préférence croissante des consommateurs pour des boissons plus saines crée d'importantes possibilités pour les boissons fermentées non alcoolisées, y compris le kombucha, le kéfir et les produits de substitution fermentés à base végétale. Les entreprises mettent au point des produits novateurs utilisant des ingrédients naturels, des composés fonctionnels et des méthodes de production durables pour attirer les consommateurs axés sur le bien-être. La croissance des plateformes de commerce électronique, des canaux de boissons haut de gamme et des modèles de consommation directe améliore encore l'accessibilité des produits et favorise l'expansion des marchés émergents. Par exemple, en février 2024, Health-Ade a lancé SunSip, un soda prébiotique avec des avantages pour la santé intestinale, élargissant son portefeuille de boissons fonctionnelles au-delà du kombucha et reflétant la demande croissante des consommateurs de produits fermentés et de boissons de rechange axés sur le bien-être.
L'expansion des boissons fermentées non alcoolisées, végétales et fonctionnelles représente un domaine d'opportunité important, appuyé par l'évolution des préférences des consommateurs à l'égard de produits de boissons plus sains et à valeur ajoutée.
Portée du marché des boissons fermentées
Le marché des boissons fermentées est segmenté en fonction du type, du type d'emballage et du canal de distribution.
- Par type
Sur la base du type, le marché des boissons fermentées est segmenté en boissons fermentées alcooliques et boissons fermentées non alcoolisées. Le segment des boissons fermentées alcooliques a dominé le marché avec une part de 76,32 % en 2025, tirée par des modes de consommation établis, une infrastructure de production étendue et de solides réseaux de distribution mondiale. Le segment bénéficie de l'acceptation généralisée de la bière, du vin, du cidre et d'autres boissons alcoolisées fermentées sur les marchés développés et émergents. Une forte reconnaissance de la marque, des capacités de fabrication matures et des chaînes d'approvisionnement bien établies permettent aux entreprises de maintenir une production à grande échelle et une pénétration du marché. L'intérêt croissant des consommateurs pour les boissons alcoolisées de qualité supérieure, artisanales et spécialisées encourage les fabricants à introduire des saveurs innovantes et des produits différenciés. L'expansion des brasseries, des caves et des plateformes de vente en ligne d'alcool favorise l'accessibilité des produits dans le monde entier.
On s'attend à ce que le segment des boissons fermentées non alcoolisées enregistre la croissance la plus rapide au cours de la période de prévision avec un TCAC de 8,5 %, soutenu par une demande croissante de boissons fonctionnelles, de solutions de santé digestive et de produits axés sur le bien-être. La sensibilisation croissante aux probiotiques, à la santé des intestins et aux ingrédients qui soutiennent l'immunité favorise l'adoption de boissons telles que le kombucha, le kéfir, les thés fermentés et les boissons à base de probiotiques. Les fabricants développent de plus en plus des produits propres, à faible teneur en sucre et naturellement fermentés pour attirer les consommateurs soucieux de la santé. La préférence croissante des jeunes pour des solutions de rechange plus saines aux boissons gazeuses et alcooliques accélère encore l'expansion du segment. L'augmentation de la disponibilité par les supermarchés, les dispensaires spécialisés et les plateformes de commerce électronique améliore l'accès des consommateurs aux boissons fermentées non alcoolisées.
- Par type d'emballage
Sur la base du type d'emballage, le marché des boissons fermentées est segmenté en bouteilles, boîtes de conserve, boîtes de tétra/cartons, fûts et fûts, etc. Le segment des bouteilles a dominé le marché avec une part de 50,89 % en 2025, soutenue par l'adoption généralisée dans les catégories des boissons fermentées alcooliques, kombucha, kefir et boissons haut de gamme. Les bouteilles de verre sont préférées en raison de leur capacité à préserver la qualité des boissons, maintenir les caractéristiques de saveur et fournir une apparence de produit premium. Le segment bénéficie d'une infrastructure de remplissage bien établie et d'une bonne connaissance par les consommateurs des boissons fermentées en bouteille. Les bouteilles sont particulièrement importantes pour les marques qui placent les produits comme des offres traditionnelles, artisanales ou premium. Cependant, les préoccupations de durabilité et la demande de solutions d'emballage légères encouragent les fabricants à évaluer les formats alternatifs.
Le segment des boîtes de conserve devrait enregistrer la croissance la plus rapide à un TCAC de 7,79% au cours de la période de prévision, en raison de la demande croissante de solutions d'emballage pratiques, légères et recyclables. Les boîtes en aluminium offrent des avantages tels que la portabilité, un transport efficace, la durabilité et un poids d'emballage réduit. L'adoption croissante de boissons fermentées prêtes à boire, en particulier de kombucha et de boissons fonctionnelles, soutient la demande de formats en conserve. Les initiatives de durabilité et l'attention accrue accordée aux matériaux d'emballage recyclables encouragent davantage les fabricants à adopter des boîtes d'aluminium. La préférence croissante des jeunes consommateurs pour des formats de boissons pratiques accélère également l'expansion du segment.
- Par canal de distribution
Sur la base du canal de distribution, le marché des boissons fermentées est segmenté en supermarchés/hypermarchés, magasin de détail spécialisé, dépannage, commerce, hors commerce, chaîne en ligne et autres canaux de distribution. Le segment hors commerce a dominé le marché avec une part de 70,43 % en 2025, soutenue par la forte présence de supermarchés, d'hypermarchés, de détaillants spécialisés et une préférence croissante des consommateurs pour la consommation de boissons à domicile. Les canaux hors commerce offrent aux fabricants un large accès aux consommateurs et permettent un accès pratique aux boissons fermentées emballées. La croissance de l'infrastructure de détail organisée, des installations d'entreposage réfrigéré et de la disponibilité de boissons haut de gamme renforce ce segment. Le segment bénéficie d'une consommation accrue de boissons fonctionnelles et de produits de bien-être emballés par les ménages. L'expansion des chaînes de vente au détail dans les marchés émergents appuie davantage la domination du segment.
Le segment des canaux en ligne devrait enregistrer la croissance la plus rapide au cours de la période de prévision, avec un TCAC de 12,3% entre 2026 et 2031, en raison de la pénétration croissante du commerce électronique, des modèles d'affaires directs aux consommateurs et de l'augmentation de la disponibilité de boissons fermentées haut de gamme par le biais de plateformes numériques. Les canaux en ligne permettent aux marques émergentes d'atteindre les consommateurs au-delà des réseaux de détail traditionnels et d'offrir une plus grande variété de produits. Les modèles d'abonnement et le marketing numérique ciblé soutiennent l'engagement des consommateurs et les achats répétés. L'adoption de smartphones et la pénétration du paiement numérique améliorent encore les ventes de boissons en ligne. On s'attend à ce que le canal prenne de l'importance puisque les consommateurs préfèrent de plus en plus des options d'achat pratiques pour les boissons spécialisées et fonctionnelles.
Analyse régionale du marché des boissons fermentées
L'Asie-Pacifique a dominé le marché des boissons fermentées avec la plus grande part des revenus de 33,82 % en 2025, soutenue par des volumes élevés de bière, une forte demande de boissons fermentées traditionnelles et l'adoption croissante de kombucha et de kefir dans des pays comme la Chine, le Japon et l'Inde. La région bénéficie également du développement des capacités de fabrication des boissons, de la sensibilisation accrue des consommateurs à la santé des intestins et de l'adoption croissante de kombucha, de kéfir et d'autres produits fermentés. L'augmentation des investissements dans l'innovation des produits, les lancements de boissons haut de gamme et les circuits modernes de distribution au détail accélèrent le développement du marché. L'accent croissant mis sur la consommation axée sur le bien-être, les ingrédients naturels et les boissons plus saines continue de renforcer la position de leader de l'Asie-Pacifique sur le marché mondial.
Aperçu du marché des boissons fermentées aux États-Unis
Le marché américain des boissons fermentées connaît une forte croissance en raison de la demande croissante des consommateurs de boissons fonctionnelles, de la sensibilisation accrue aux bienfaits pour la santé des intestins et de l'adoption croissante de boissons probiotiques comme le kombucha et le kéfir. L'industrie des boissons matures du pays, ainsi que l'innovation croissante dans les produits fermentés à base d'étiquettes propres, biologiques et végétales, stimulent la demande dans tous les secteurs de la vente au détail et de la consommation directe. De plus, les investissements croissants des entreprises de boissons dans les lancements de produits axés sur le bien-être accélèrent l'expansion du marché. En février 2024, Health-Ade a élargi son portefeuille de boissons fonctionnelles avec le lancement de SunSip, un soda prébiotique conçu pour soutenir la santé intestinale, reflétant l'intérêt croissant des consommateurs américains pour les boissons axées sur le bien-être.
Perspectives du marché des boissons fermentées en Europe
Le marché européen des boissons fermentées reste un important facteur de recettes mondiales, en raison de la forte préférence des consommateurs pour les boissons naturelles, de l'augmentation de la demande de produits probiotiques et de la consommation établie de boissons fermentées traditionnelles. L'adoption généralisée de kombucha, de kéfir et de boissons laitières fermentées favorise l'expansion du marché dans toute la région. L'augmentation des investissements dans l'innovation en matière de boissons fonctionnelles, associée à une sensibilisation accrue à la santé et à la demande de produits d'étiquetage propre, continue d'améliorer l'adoption de boissons fermentées dans toute l'Europe. Yakult Europe produit des boissons fermentées contenant la souche Shirota de Lactobacillus casei et distribue des produits probiotiques sur les marchés européens, reflétant la demande de boissons fermentées fonctionnelles et axées sur la santé de la région
U.K. Boissons fermentées Aperçu du marché
Le marché des boissons fermentées au Royaume-Uni connaît une croissance régulière, soutenue par l'intérêt croissant des consommateurs pour la santé intestinale, l'augmentation de la demande de boissons fonctionnelles et la disponibilité croissante de boissons kombucha et probiotiques par les supermarchés et les chaînes en ligne. L'augmentation des investissements dans des formulations novatrices de boissons et des solutions de rechange plus saines aux boissons traditionnelles contribue à la croissance du marché. De plus, l'expansion des marques de boissons fermentées haut de gamme et la sensibilisation croissante à la santé du microbiome améliorent l'adoption de produits chez les consommateurs soucieux de la santé. Remedy Kombucha a élargi son empreinte de vente au détail au Royaume-Uni grâce à des lancements dans les dépanneurs de Sainsbury, WHSmith, Wasabi et BP, mettant en évidence l'acceptation croissante des détaillants et la demande croissante de boissons fonctionnelles fermentées plus saines.
Allemagne Boissons fermentées Aperçu du marché
Le marché allemand des boissons fermentées ne cesse de croître en raison de l'intérêt marqué des consommateurs pour les boissons biologiques, les pratiques de fermentation traditionnelles et les produits nutritionnels fonctionnels. Les fabricants de boissons et les détaillants introduisent de plus en plus de boissons fermentées comme le kombucha, le kéfir et d'autres boissons probiotiques pour répondre aux tendances croissantes du bien-être. L'innovation continue en matière d'ingrédients naturels, de production durable et d'offre de boissons haut de gamme soutient le développement du marché en Allemagne. Kombuchery, basé en Allemagne, a élargi son portefeuille de kombucha bio, offrant des boissons fermentées positionnées autour des ingrédients naturels et des avantages pour la santé intestinale, reflétant la demande croissante des consommateurs de boissons fermentées fonctionnelles en Allemagne.
Aperçu du marché des boissons fermentées en Asie-Pacifique
Le marché des boissons fermentées en Asie et dans le Pacifique devrait connaître une croissance rapide, en raison de la forte consommation de boissons fermentées traditionnelles, de la sensibilisation accrue aux avantages probiotiques et de la demande croissante de boissons fonctionnelles et axées sur le bien-être dans des pays comme la Chine, l'Inde et le Japon. Les investissements croissants dans l'innovation en matière de boissons, l'expansion des réseaux organisés de vente au détail et l'augmentation de la disponibilité des produits kombucha et kefir appuient l'expansion du marché régional. De plus, le fort patrimoine de fermentation de la région et l'augmentation de la base de consommateurs soucieux de la santé accélèrent l'adoption dans les secteurs commercial et domestique. Tata Consumer Products a lancé Tetley Kombucha en Inde, élargissant l'accès aux boissons fonctionnelles fermentées et reflétant la demande croissante de boissons axées sur le bien-être dans la région Asie-Pacifique.
Aperçu du marché japonais des boissons fermentées
Le marché japonais des boissons fermentées connaît une croissance constante en raison de la culture de fermentation de longue date du pays, de la forte acceptation par les consommateurs des boissons probiotiques et de la demande croissante de produits de santé fonctionnels. Les entreprises de boissons développent de plus en plus des boissons fermentées ciblant le bien-être digestif, le soutien immunitaire et les besoins de soins préventifs. De plus, l'écosystème de pointe des technologies alimentaires et la préférence des consommateurs pour les produits de santé scientifiquement soutenus contribuent davantage à la croissance du marché. Yakult Honsha continue de renforcer sa présence dans les boissons probiotiques au Japon par l'intermédiaire de Yakult 1000, une boisson fermentée contenant la souche Shirota de Lactaseibacillus paracasei (anciennement classée Lactobacillus casei souche Shirota), reflétant la forte demande des consommateurs pour des boissons fermentées fonctionnelles axées sur la santé et le bien-être intestinaux.
Chine Boissons fermentées Aperçu du marché
Le marché chinois des boissons fermentées augmente rapidement, en raison de la sensibilisation accrue des consommateurs à la santé digestive, de l'augmentation des dépenses de la classe moyenne et de la demande croissante de boissons probiotiques et fonctionnelles. L'adoption croissante de circuits de vente au détail modernes, de plateformes de commerce électronique et de produits de boissons fermentées innovants stimule considérablement la demande du marché. En outre, la forte industrie de fermentation traditionnelle de la Chine et l'augmentation des investissements dans les catégories de boissons axées sur la santé placent le pays comme un marché de croissance clé pour les boissons fermentées à l'échelle mondiale. Yakult Chine a lancé une boisson fermentée fermentée à l'acide lactique de pêche contenant la souche Shirota de Lactaseibacillus paracasei, renforçant son portefeuille de boissons probiotiques et soulignant la demande croissante de boissons fermentées fonctionnelles en Chine.
Part de marché des boissons fermentées
L'industrie des boissons fermentées est principalement dirigée par des entreprises bien établies, notamment :
- Danone (France)
- Yakult Honsha Co., Ltd. (Japon)
- La société Coca-Cola (États-Unis)
- PepsiCo, Inc. (États-Unis)
- Nestlé (Suisse)
- Anheuser-Busch Companies LLC (Belgique)
- HEINEKEN (Pays-Bas)
- Carlsberg Brasseries A/S (Danemark)
- Société Kirin Holdings, limitée (Japon)
- ASAHI GROUP HOLDINGS, LTD. (Japon)
- LIMITÉE DES HOTELS DU SUD (Japon)
- Keurig Dr Pepper Inc. (États-Unis)
- Molson Coors Boissons Company (États-Unis)
- Kombucha Wonder Drink (États-Unis)
- Health-Ade LLC (États-Unis)
- Remedy Drinks Pty Ltd (Australie)
- GTS Living Foods LLC (États-Unis)
- The Hain Celestial Group, Inc. (États-Unis)
- Fonterra Co-operative Group Limited (Nouvelle-Zélande)
- Hansen Holding A/S (Danemark)
Derniers développements du marché des boissons fermentées
- En septembre 2025, Yakult Singapore lance Y1000, sa boisson probiotique la plus concentrée, élargissant son portefeuille de boissons fermentées avec un produit contenant plus de 100 milliards de probiotiques vivants par bouteille. Le lancement renforce l'accent mis sur les boissons fonctionnelles soutenues par la science et répond à la demande croissante des consommateurs de boissons probiotiques axées sur la santé intestinale sur le marché asiatique.
- En mai 2024, Health-Ade Kombucha a lancé deux nouvelles saveurs à composition limitée, Orange Creamsicle et Pomegranate Blueberry, élargissant son portefeuille de kombucha pour répondre à la demande croissante des consommateurs de boissons fonctionnelles innovantes axées sur l'intestin. Le lancement souligne la stratégie de l'entreprise d'introduire des innovations de saveur tout en renforçant sa position dans la catégorie croissante kombucha et boissons de bien-être
- En février 2024, Health-Ade a lancé SunSip, un soda prébiotique conçu comme une alternative axée sur la santé des intestins aux boissons gazeuses traditionnelles. L'expansion du produit démontre que l'entreprise va au-delà du kombucha dans la catégorie plus large des boissons fonctionnelles, ciblant les consommateurs qui recherchent des boissons plus saines avec des avantages pour le bien-être digestif
- En mars 2022, Brewerkz et Probicient ont lancé une bière probiotique développée à l'aide de la technologie probiotique, créant ainsi une nouvelle catégorie de boissons alcoolisées fonctionnelles. Le lancement a combiné la fermentation traditionnelle et l'innovation probiotique et a mis en évidence l'intérêt croissant de l'industrie à développer des boissons alcoolisées plus saines avec des avantages fonctionnels supplémentaires
- En juin 2021, Remedy Drinks a lancé sa gamme de boissons fermentées cultivées en direct aux États-Unis, élargissant son portefeuille de kombucha au marché nord-américain. Le lancement a introduit des produits kombucha en conserve contenant des cultures vivantes actives, des acides organiques et des antioxydants, soutenant la demande croissante de boissons fermentées sans sucre, fonctionnelles et axées sur le bien-être
SKU-
Accédez en ligne au rapport sur le premier cloud mondial de veille économique

- Tableau de bord d'analyse de données interactif
- Tableau de bord d'analyse d'entreprise pour les opportunités à fort potentiel de croissance
- Accès d'analyste de recherche pour la personnalisation et les requêtes
- Analyse de la concurrence avec tableau de bord interactif
- Dernières actualités, mises à jour et analyse des tendances
- Exploitez la puissance de l'analyse comparative pour un suivi complet de la concurrence
Table des matières
1. INTRODUCTION
1.1 OBJECTIVES OF THE STUDY
1.2 MARKET DEFINITION
1.3 OVERVIEW OF GLOBAL FERMENTED DRINKS MARKET
1.4 CURRENCY AND PRICING
1.5 LIMITATION
1.6 MARKETS COVERED
2. MARKET SEGMENTATION
2.1 MARKETS COVERED
2.2 ARRIVING AT THE GLOBAL FERMENTED DRINKS MARKET
2.2.1 VENDOR POSITIONING GRID
2.2.2 TECHNOLOGY LIFE LINE CURVE
2.2.3 MARKET GUIDE
2.2.4 COMPANY POSITIONING GRID
2.2.4.1. KEY PLAYERS
2.2.4.2. DISRUPTORS
2.2.4.3. NICHE PLAYERS
2.2.4.4. PROSPECT LEADERS
2.2.5 COMAPANY MARKET SHARE ANALYSIS
2.2.6 MULTIVARIATE MODELLING
2.2.7 DEMAND AND SUPPLY-SIDE VARIABLES
2.2.8 CONSUMPTION TREND OF END PRODUCTS
2.2.9 TOP TO BOTTOM ANALYSIS
2.2.10 STANDARDS OF MEASUREMENT
2.2.11 VENDOR SHARE ANALYSIS
2.2.12 DATA POINTS FROM KEY PRIMARY INTERVIEWS
2.2.13 DATA POINTS FROM KEY SECONDARY DATABASES
2.3 GLOBAL FERMENTED DRINKS MARKET: RESEARCH SNAPSHOT
2.4 ASSUMPTIONS
3. MARKET OVERVIEW
3.1 DRIVERS
3.2 RESTRAINTS
3.3 OPPORTUNITIES
3.4 CHALLENGES
4. EXECUTIVE SUMMARY
5. PREMIUM INSIGHTS
5.1 MARKETING STRATERGY
5.2 RETAILER LIST
5.3 CONSUMPTION AND PRODUCTION ANALYSIS
5.4 RAW MATERIAL EXPORT AND IMPORT ANALYSIS
5.5 SUPPLY CHAIN ANALYSIS
6. IMPACT OF ECONOMIC SLOW DOWN ON MARKET
6.1 IMPACT ON PRICE
6.2 IMPACT ON SUPPLY CHAIN
6.3 IMPACT ON SHIPMENT
6.4 IMPACT ON COMPANY’S STRATEGIC DECISIONS
7. REGULATORY FRAMEWORK AND GUIDELINES
8. PRODUCTION CAPACITY OF KEY MANUFACTURERES
9. BRND OUTLOOK
9.1 COMPARATIVE BRAND ANALYSIS
9.2 PRODUCT VS BRAND OVERVIEW
10. GLOBAL FERMENTED DRINKS MARKET, BY TYPE, 2020-2029, (USD MILLION), (MILLION LITRES)
(ASP, VALUE AND VOLUME WILL BE PROVIDED FOR ALL THE SEGMENTS)
10.1 OVERVIEW
10.2 ALCOHLIC
10.2.1 ASP
10.2.2 VALUE
10.2.3 VOLUME
10.2.4 ALCOHLIC, BY TYPE
10.2.4.1. BEER
10.2.4.1.1. BY CATEGORY
10.2.4.1.1.1 ALE
10.2.4.1.1.2 ALE, BY TYPE
10.2.4.1.1.3 BROWN ALE
10.2.4.1.1.4 PALE ALE
10.2.4.1.1.5 INDIA PALE ALE
10.2.4.1.1.6 SOUR ALE
10.2.4.1.1.7 LAGER
10.2.4.1.1.8 PORTER
10.2.4.1.1.9 STOUT
10.2.4.1.1.10 WHEAT
10.2.4.1.1.11 PILSNER
10.2.4.1.2. WINE
10.2.4.1.2.1 BY WINEMAKING TECHNIQUE
10.2.4.1.3. RED WINE
10.2.4.1.3.1 BY VARIETY
10.2.4.1.3.2 PINOT NOIR
10.2.4.1.3.3 ZINFANDEL
10.2.4.1.3.4 SYRAH
10.2.4.1.3.5 CABERNET SAUVIGNON
10.2.4.1.4. WHITE WINE
10.2.4.1.4.1 BY VARIETY
10.2.4.1.4.1.1. RIESLING
10.2.4.1.4.1.2. PINOT GRIS
10.2.4.1.4.1.3. SAUVIGNON BLANC
10.2.4.1.4.1.4. CHARDONNAY
10.2.4.1.5. ROSE WINE
10.2.4.1.6. SPARKLING WINE
10.2.4.1.7. DESSERT WINE
10.3 NON-ALCOHLIC
10.3.1 ASP
10.3.2 VALUE
10.3.3 VOLUME
10.3.3.1. NON-ALCOHLIC, BY TYPE
10.3.3.1.1. PROBIOTIC DRINKS
10.3.3.1.1.1 DAIRY BASED PROBIOTIC DRINK
10.3.3.1.1.1.1. MILK
10.3.3.1.1.1.2. ALMOND
10.3.3.1.1.1.3. SOY
10.3.3.1.1.1.4. COCONUT
10.3.3.1.1.1.5. OATS
10.3.3.1.1.1.6. OTHERS
10.3.3.1.1.2 FRUIT BASED PROBIOTIC DRINK
10.3.3.1.2. SPARKLING PROBIOTIC DRINK
10.3.3.1.2.1 BY FLAVOR
10.3.3.1.2.1.1. GINGER COLADA
10.3.3.1.2.1.2. LEMON CAYENNE
10.3.3.1.2.1.3. MANGO COCONUT
10.3.3.1.2.1.4. POMEGRANATE
10.3.3.1.2.1.5. TANGERINE
10.3.3.1.2.1.6. LEMON GINGER
10.3.3.1.2.1.7. OTHERS
10.3.3.1.3. FRUIT BASED PROBIOTIC DRINK
10.3.3.1.4. SPARKLING PROBIOTIC DRINK
10.3.3.1.4.1 BY FLAVOR
10.3.3.1.4.1.1. GINGER COLADA
10.3.3.1.4.1.2. LEMON CAYENNE
10.3.3.1.4.1.3. MANGO COCONUT
10.3.3.1.4.1.4. POMEGRANATE
10.3.3.1.4.1.5. TANGERINE
10.3.3.1.4.1.6. LEMON GINGER
10.3.3.1.4.1.7. OTHERS
10.3.3.1.5. SPARKLING PROBIOTIC LEMONADE
10.3.3.1.5.1 BY FLAVOR
10.3.3.1.5.1.1. CLASSIC
10.3.3.1.5.1.2. BLACKBERRY
10.3.3.1.5.1.3. PEACH
10.3.3.1.6. PREBIOTIC SHOTS
10.3.3.1.6.1 BY FLAVOR
10.3.3.1.6.1.1. BEET LEMON
10.3.3.1.6.1.2. BLUEBERRY MINT
10.3.3.1.6.1.3. TURMERIC GINGER
10.3.3.1.7. VEGETABLE BASED PROBIOTIC DRINK
10.3.3.1.7.1 KOMBUCHA DRINK
10.3.3.2. KOMBUCHA, BY TEA TYPE
10.3.3.2.1. BLACK TEA
10.3.3.2.2. GREEN TEA
10.3.3.3. KOMBUCHA, BY FLAVOR
10.3.3.3.1. BLACKBERRY HOPS
10.3.3.3.2. BLUEBERRY BASIL
10.3.3.3.3. GINGER
10.3.3.3.4. GRAPEFRUIT
10.3.3.3.5. LAVENDER MELON
10.3.3.3.6. MANGO LIME
10.3.3.3.7. PINEAPPLE PEACH
10.3.3.3.8. RASPBERRY LEMON
10.3.3.3.9. TART CHERRY
10.3.3.3.10. OTHERS
10.3.3.3.11. OTHERS
11. GLOBAL FERMENTED DRINKS MARKET, BY PROBIOTIC STRAIN, 2020-2029, (USD MILLION)
11.1 OVERVIEW
11.2 LACTOBACILLUS
11.3 STREPTOCOCCUS
11.4 BIFIDOBACTERIUM
11.5 OTHERS
12. GLOBAL FERMENTED DRINKS MARKET, BY PACKAGING TYPE, 2020-2029, (USD MILLION)
12.1 OVERVIEW
12.2 CANS
12.3 TERTA PACKS
12.4 GLASS JARS
12.5 BOTTLES
12.5.1 PLASTIC
12.5.2 GLASS
12.6 POUCHES
12.7 OTHERS
13. GLOBAL FERMENTED DRINKS MARKET, BY DISTRIBUTION CHANNEL, 2020-2029, (USD MILLION)
13.1 OVERVIEW
13.2 ON-TRADE
13.2.1 RETAURANTS
13.2.2 CLUBS, CASINOS & DISCO
13.2.3 HOTELS
13.2.4 EVENTS
13.2.5 OTHERS
14. OFF-TRADE
14.1.1 STORE BASED
14.1.1.1. CONVENIENCE STORES
14.1.1.2. SUPERMARKETS/HYPERMARKETS
14.1.1.3. GROCERY STORES
14.1.1.4. DISCOUNTERS
14.1.1.5. PETROL STATIONS
14.1.1.6. WHOLESALERS
14.1.1.7. OTHERS
14.1.2 NON-STORE BASED
14.1.2.1. ONLINE
14.1.2.2. VENDING
15. GLOBAL FERMENTED DRINKS MARKET, COMPANY LANDSCAPE
15.1 COMPANY SHARE ANALYSIS: GLOBAL
15.2 COMPANY SHARE ANALYSIS: NORTH AMERICA
15.3 COMPANY SHARE ANALYSIS: EUROPE
15.4 COMPANY SHARE ANALYSIS: ASIA-PACIFIC
15.5 MERGERS & ACQUISITIONS
15.6 NEW PRODUCT DEVELOPMENT & APPROVALS
15.7 EXPANSIONS & PARTNERSHIP
15.8 REGULATORY CHANGES
16. GLOBAL FERMENTED DRINKS MARKET, BY GEOGRAPHY, 2020-2029, (USD MILLION), (KILO TONS)
16.1 OVERVIEW (ALL SEGMENTATION PROVIDED ABOVE IS REPRESNTED IN THIS CHAPTER BY COUNTRY)
16.2 NORTH AMERICA
16.2.1 U.S.
16.2.2 CANADA
16.2.3 MEXICO
16.3 EUROPE
16.3.1 GERMANY
16.3.2 U.K.
16.3.3 ITALY
16.3.4 FRANCE
16.3.5 SPAIN
16.3.6 SWITZERLAND
16.3.7 NETHERLANDS
16.3.8 BELGIUM
16.3.9 RUSSIA
16.3.10 DENMARK
16.3.11 SWEDEN
16.3.12 POLAND
16.3.13 TURKEY
16.3.14 REST OF EUROPE
16.4 ASIA-PACIFIC
16.4.1 JAPAN
16.4.2 CHINA
16.4.3 SOUTH KOREA
16.4.4 INDIA
16.4.5 AUSTRALIA
16.4.6 SINGAPORE
16.4.7 THAILAND
16.4.8 INDONESIA
16.4.9 MALAYSIA
16.4.10 PHILIPPINES
16.4.11 NEW ZEALAND
16.4.12 VIETNAM
16.4.13 REST OF ASIA-PACIFIC
16.5 SOUTH AMERICA
16.5.1 BRAZIL
16.5.2 ARGENTINA
16.5.3 REST OF SOUTH AMERICA
16.6 MIDDLE EAST AND AFRICA
16.6.1 SOUTH AFRICA
16.6.2 UAE
16.6.3 SAUDI ARABIA
16.6.4 OMAN
16.6.5 QATAR
16.6.6 KUWAIT
16.6.7 REST OF MIDDLE EAST AND AFRICA
17. GLOBAL FERMENTED DRINKS MARKET, SWOT & DBMR ANALYSIS
18. GLOBAL FERMENTED DRINKS MARKET, COMPANY PROFILE
18.1 BIOGROUPE S.A
18.1.1 COMPANY OVERVIEW
18.1.2 REVENUE ANALYSIS
18.1.3 GEOGRAPHICAL PRESENCE
18.1.4 PRODUCT PORTFOLIO
18.1.5 RECENT DEVELOPMENTS
18.2 KEVITA.COM
18.2.1 COMPANY OVERVIEW
18.2.2 REVENUE ANALYSIS
18.2.3 GEOGRAPHICAL PRESENCE
18.2.4 PRODUCT PORTFOLIO
18.2.5 RECENT DEVELOPMENTS
18.3 DENONE
18.3.1 COMPANY OVERVIEW
18.3.2 REVENUE ANALYSIS
18.3.3 GEOGRAPHICAL PRESENCE
18.3.4 PRODUCT PORTFOLIO
18.3.5 RECENT DEVELOPMENTS
18.4 CHOBANI, LLC.
18.4.1 COMPANY OVERVIEW
18.4.2 REVENUE ANALYSIS
18.4.3 GEOGRAPHICAL PRESENCE
18.4.4 PRODUCT PORTFOLIO
18.4.5 RECENT DEVELOPMENTS
18.5 FONTERRA CO-OP GROUP LTD.
18.5.1 COMPANY OVERVIEW
18.5.2 REVENUE ANALYSIS
18.5.3 GEOGRAPHICAL PRESENCE
18.5.4 PRODUCT PORTFOLIO
18.5.5 RECENT DEVELOPMENTS
18.6 NEXTFOODS.
18.6.1 COMPANY OVERVIEW
18.6.2 REVENUE ANALYSIS
18.6.3 GEOGRAPHICAL PRESENCE
18.6.4 PRODUCT PORTFOLIO
18.6.5 RECENT DEVELOPMENTS
18.7 THE COCA-COLA COMPANY.
18.7.1 COMPANY OVERVIEW
18.7.2 REVENUE ANALYSIS
18.7.3 GEOGRAPHICAL PRESENCE
18.7.4 PRODUCT PORTFOLIO
18.7.5 RECENT DEVELOPMENTS
18.8 CHR. HANSEN HOLDING A/S
18.8.1 COMPANY OVERVIEW
18.8.2 REVENUE ANALYSIS
18.8.3 GEOGRAPHICAL PRESENCE
18.8.4 PRODUCT PORTFOLIO
18.8.5 RECENT DEVELOPMENTS
18.9 YAKULT HONSHA CO. LTD
18.9.1 COMPANY OVERVIEW
18.9.2 REVENUE ANALYSIS
18.9.3 GEOGRAPHICAL PRESENCE
18.9.4 PRODUCT PORTFOLIO
18.9.5 RECENT DEVELOPMENTS
18.10 DUPONT DE NUMEROUS INC.
18.10.1 COMPANY OVERVIEW
18.10.2 REVENUE ANALYSIS
18.10.3 GEOGRAPHICAL PRESENCE
18.10.4 PRODUCT PORTFOLIO
18.10.5 RECENT DEVELOPMENTS
18.11 KIZAKURA CO., LTD.
18.11.1 COMPANY OVERVIEW
18.11.2 REVENUE ANALYSIS
18.11.3 GEOGRAPHICAL PRESENCE
18.11.4 PRODUCT PORTFOLIO
18.11.5 RECENT DEVELOPMENTS
18.12 ENVASADOS EVA, S.A.
18.12.1 COMPANY OVERVIEW
18.12.2 REVENUE ANALYSIS
18.12.3 GEOGRAPHICAL PRESENCE
18.12.4 PRODUCT PORTFOLIO
18.12.5 RECENT DEVELOPMENTS
18.13 BODEGAS SANVIVER S.L.
18.13.1 COMPANY OVERVIEW
18.13.2 REVENUE ANALYSIS
18.13.3 GEOGRAPHICAL PRESENCE
18.13.4 PRODUCT PORTFOLIO
18.13.5 RECENT DEVELOPMENTS
18.14 ECPLAZA NETWORK INC.
18.14.1 COMPANY OVERVIEW
18.14.2 REVENUE ANALYSIS
18.14.3 GEOGRAPHICAL PRESENCE
18.14.4 PRODUCT PORTFOLIO
18.14.5 RECENT DEVELOPMENTS
18.15 CALDWELL BIO FERMENTATION CANADA INC.
18.15.1 COMPANY OVERVIEW
18.15.2 REVENUE ANALYSIS
18.15.3 GEOGRAPHICAL PRESENCE
18.15.4 PRODUCT PORTFOLIO
18.15.5 RECENT DEVELOPMENTS
18.16 DOHLER GMBH
18.16.1 COMPANY OVERVIEW
18.16.2 REVENUE ANALYSIS
18.16.3 GEOGRAPHICAL PRESENCE
18.16.4 PRODUCT PORTFOLIO
18.16.5 RECENT DEVELOPMENTS
18.17 ARIZONA BEVERAGES USA
18.17.1 COMPANY OVERVIEW
18.17.2 REVENUE ANALYSIS
18.17.3 GEOGRAPHICAL PRESENCE
18.17.4 PRODUCT PORTFOLIO
18.17.5 RECENT DEVELOPMENTS
18.18 ALASKAN BREWING
18.18.1 COMPANY OVERVIEW
18.18.2 REVENUE ANALYSIS
18.18.3 GEOGRAPHICAL PRESENCE
18.18.4 PRODUCT PORTFOLIO
18.18.5 RECENT DEVELOPMENTS
18.19 HEINEKEN HOLDING N.V.
18.19.1 COMPANY OVERVIEW
18.19.2 REVENUE ANALYSIS
18.19.3 GEOGRAPHICAL PRESENCE
18.19.4 PRODUCT PORTFOLIO
18.19.5 RECENT DEVELOPMENTS
18.20 BEAVER BREWING COMPANY
18.20.1 COMPANY OVERVIEW
18.20.2 REVENUE ANALYSIS
18.20.3 GEOGRAPHICAL PRESENCE
18.20.4 PRODUCT PORTFOLIO
18.20.5 RECENT DEVELOPMENTS
18.21 ACE CIDER
18.21.1 COMPANY OVERVIEW
18.21.2 REVENUE ANALYSIS
18.21.3 GEOGRAPHICAL PRESENCE
18.21.4 PRODUCT PORTFOLIO
18.21.5 RECENT DEVELOPMENTS
18.22 GLANBIA PLC
18.22.1 COMPANY OVERVIEW
18.22.2 REVENUE ANALYSIS
18.22.3 GEOGRAPHICAL PRESENCE
18.22.4 PRODUCT PORTFOLIO
18.22.5 RECENT DEVELOPMENTS
18.23 HERBALIFE INTERNATIONAL OF AMERICA, INC.
18.23.1 COMPANY OVERVIEW
18.23.2 REVENUE ANALYSIS
18.23.3 GEOGRAPHICAL PRESENCE
18.23.4 PRODUCT PORTFOLIO
18.23.5 RECENT DEVELOPMENTS
18.24 BIONOVA
18.24.1 COMPANY OVERVIEW
18.24.2 REVENUE ANALYSIS
18.24.3 GEOGRAPHICAL PRESENCE
18.24.4 PRODUCT PORTFOLIO
18.24.5 RECENT DEVELOPMENTS
NOTE: THE COMPANIES PROFILED IS NOT EXHAUSTIVE LIST AND IS AS PER OUR PREVIOUS CLIENT REQUIREMENT. WE PROFILE MORE THAN 100 COMPANIES IN OUR STUDY AND HENCE THE LIST OF COMPANIES CAN BE MODIFIED OR REPLACED ON REQUEST
19. RELATED REPORTS
20. CONCLUSION
21. QUESTIONNAIRE
22. ABOUT DATA BRIDGE MARKET RESEARCH
Méthodologie de recherche
La collecte de données et l'analyse de l'année de base sont effectuées à l'aide de modules de collecte de données avec des échantillons de grande taille. L'étape consiste à obtenir des informations sur le marché ou des données connexes via diverses sources et stratégies. Elle comprend l'examen et la planification à l'avance de toutes les données acquises dans le passé. Elle englobe également l'examen des incohérences d'informations observées dans différentes sources d'informations. Les données de marché sont analysées et estimées à l'aide de modèles statistiques et cohérents de marché. De plus, l'analyse des parts de marché et l'analyse des tendances clés sont les principaux facteurs de succès du rapport de marché. Pour en savoir plus, veuillez demander un appel d'analyste ou déposer votre demande.
La méthodologie de recherche clé utilisée par l'équipe de recherche DBMR est la triangulation des données qui implique l'exploration de données, l'analyse de l'impact des variables de données sur le marché et la validation primaire (expert du secteur). Les modèles de données incluent la grille de positionnement des fournisseurs, l'analyse de la chronologie du marché, l'aperçu et le guide du marché, la grille de positionnement des entreprises, l'analyse des brevets, l'analyse des prix, l'analyse des parts de marché des entreprises, les normes de mesure, l'analyse globale par rapport à l'analyse régionale et des parts des fournisseurs. Pour en savoir plus sur la méthodologie de recherche, envoyez une demande pour parler à nos experts du secteur.
Personnalisation disponible
Data Bridge Market Research est un leader de la recherche formative avancée. Nous sommes fiers de fournir à nos clients existants et nouveaux des données et des analyses qui correspondent à leurs objectifs. Le rapport peut être personnalisé pour inclure une analyse des tendances des prix des marques cibles, une compréhension du marché pour d'autres pays (demandez la liste des pays), des données sur les résultats des essais cliniques, une revue de la littérature, une analyse du marché des produits remis à neuf et de la base de produits. L'analyse du marché des concurrents cibles peut être analysée à partir d'une analyse basée sur la technologie jusqu'à des stratégies de portefeuille de marché. Nous pouvons ajouter autant de concurrents que vous le souhaitez, dans le format et le style de données que vous recherchez. Notre équipe d'analystes peut également vous fournir des données sous forme de fichiers Excel bruts, de tableaux croisés dynamiques (Fact book) ou peut vous aider à créer des présentations à partir des ensembles de données disponibles dans le rapport.

